Investigation of potential ultra-low -value -decay candidates 89Sr and 139Ba using Penning trap mass spectrometry
Abstract
- Background
-
Ultra-low -value -decays are interesting processes to study with potential applications to nuclear -decay theory and neutrino physics. While a number of potential ultra-low -value -decay candidates exist, improved mass measurements are necessary to determine which of these are energetically allowed.
- Purpose
-
To perform precise atomic mass measurements of 89Y and 139La. Use these new measurements along with the precisely known atomic masses of 89Sr and 139Ba and nuclear energy level data for 89Y and 139La to determine if there could be an ultra-low -value decay branch in the -decay of 89Sr 89Y or 139Ba 139La.
- Method
-
High-precision Penning trap mass spectrometry was used to determine the atomic mass of 89Y and 139La, from which -decay -values for 89Sr and 139Ba were obtained.
- Results
-
The 89Sr 89Y and 139Ba 139La -decay -values were measured to be = 1502.20(0.35) keV and = 2308.37(0.68) keV. These results were compared to energies of excited states in 89Y at 1507.4(0.1) keV, and in 139La at 2310(19) keV and 2313(1) keV to determine -values of -5.20(0.37) keV for the potential ultra-low -decay branch of 89Sr and -1.6(19.0) keV and -4.6(1.2) keV for those of 139Ba.
- Conclusion
-
The potential ultra-low -value decay branch of 89Sr to the 89Y (3/2-, 1507.4 keV) state is energetically forbidden and has been ruled out. The potential ultra-low -value decay branch of 139Ba to the 2313 keV state in 139La with unknown Jπ has also been ruled out at the 4 level, while more precise energy level data is needed for the 139La (1/2+, 2310 keV) state to determine if an ultra-low -value -decay branch to this state is energetically allowed.
I Introduction
Ultra-low -value -decays, in which the parent nucleus decays to an excited state in the daughter with a -value of less than 1 keV, provide a powerful tool to test the role of atomic interference effects in nuclear -decay Mustonen and Suhonen (2010a); Suhonen and Mustonen (2010). They can also potentially be used as new candidates for direct neutrino mass determination experiments Cattadori et al. (2004, 2007); Suhonen (2014); Kopp and Merle (2010). In order for a potential ultra-low -value decay to be identified or ruled out, precise measurements of the ground-state to ground-state -value as well as the excited state energy levels of the daughter nucleus are necessary.
Currently, the only known ultra-low -value -decay is that of 115In to the 3/2+ first excited state in 115Sn. This decay branch was discovered by Cattadori, et al. in 2005 via the observation of a 497.48 keV line in a -ray spectroscopy measurement on an 1 kg metallic indium sample at Gran Sasso underground laboratory Cattadori et al. (2004). Cattadori, et al. inferred that 115In must undergo a weak -decay branch to the 3/2+ level in 115Sn at 497.334(22) keV111The energy of the 115Sn (3/2+) state was recently measured more precisely to be 497.342(3) keV Zheltonozhsky et al. (2018). Blachot (2005). Using the atomic mass data available at the time Audi et al. (2003), the -value was determined to be 2(4) keV. Later, Penning trap measurements of the 115In – 115Sn mass difference performed with JYFLTRAP at Jyväskylä and with the MIT/FSU trap at Florida State University, combined with the daughter state energy, confirmed that this decay is energetically allowed. The JYFLTRAP and FSU groups determined the -value of the ultra-low decay branch to be 0.35(0.17) keV Wieslander et al. (2009) and 0.155(24) keV Mount et al. (2009), respectively, making this the lowest known -value -decay. The observation of the 115In 115Sn (3/2+) decay was later confirmed in measurements with an 2.5 kg indium sample at the HADES underground laboratory Wieslander et al. (2009); Andreotti et al. (2011). However, theoretical calculations of the partial half-life for the 115In ultra-low -value decay that used the Penning trap -values showed a significant discrepancy with the experimental results Mustonen and Suhonen (2010a); Suhonen and Mustonen (2010). Hence, experimental data for additional ultra-low -value decays are called for.
Since the discovery of the ultra-low -value -decay of 115In, other potential ultra-low -value decay branches were identified in 115Cd Haaranen and Suhonen (2013), 135Cs Mustonen and Suhonen (2011), and a number of other isotopes Mustonen and Suhonen (2010b); Suhonen (2014); Kopp and Merle (2010); Gamage et al. (2019). However, in all of the identified cases, more precise atomic mass data is required for the parent and/or daughter isotope. In Ref. Gamage et al. (2019), four cases were identified for which the daughter is a stable isotope whose mass is known less precisely than that of the parent. In this work, we investigate two of those systems: the decay of 89Sr Y and 139Ba La.
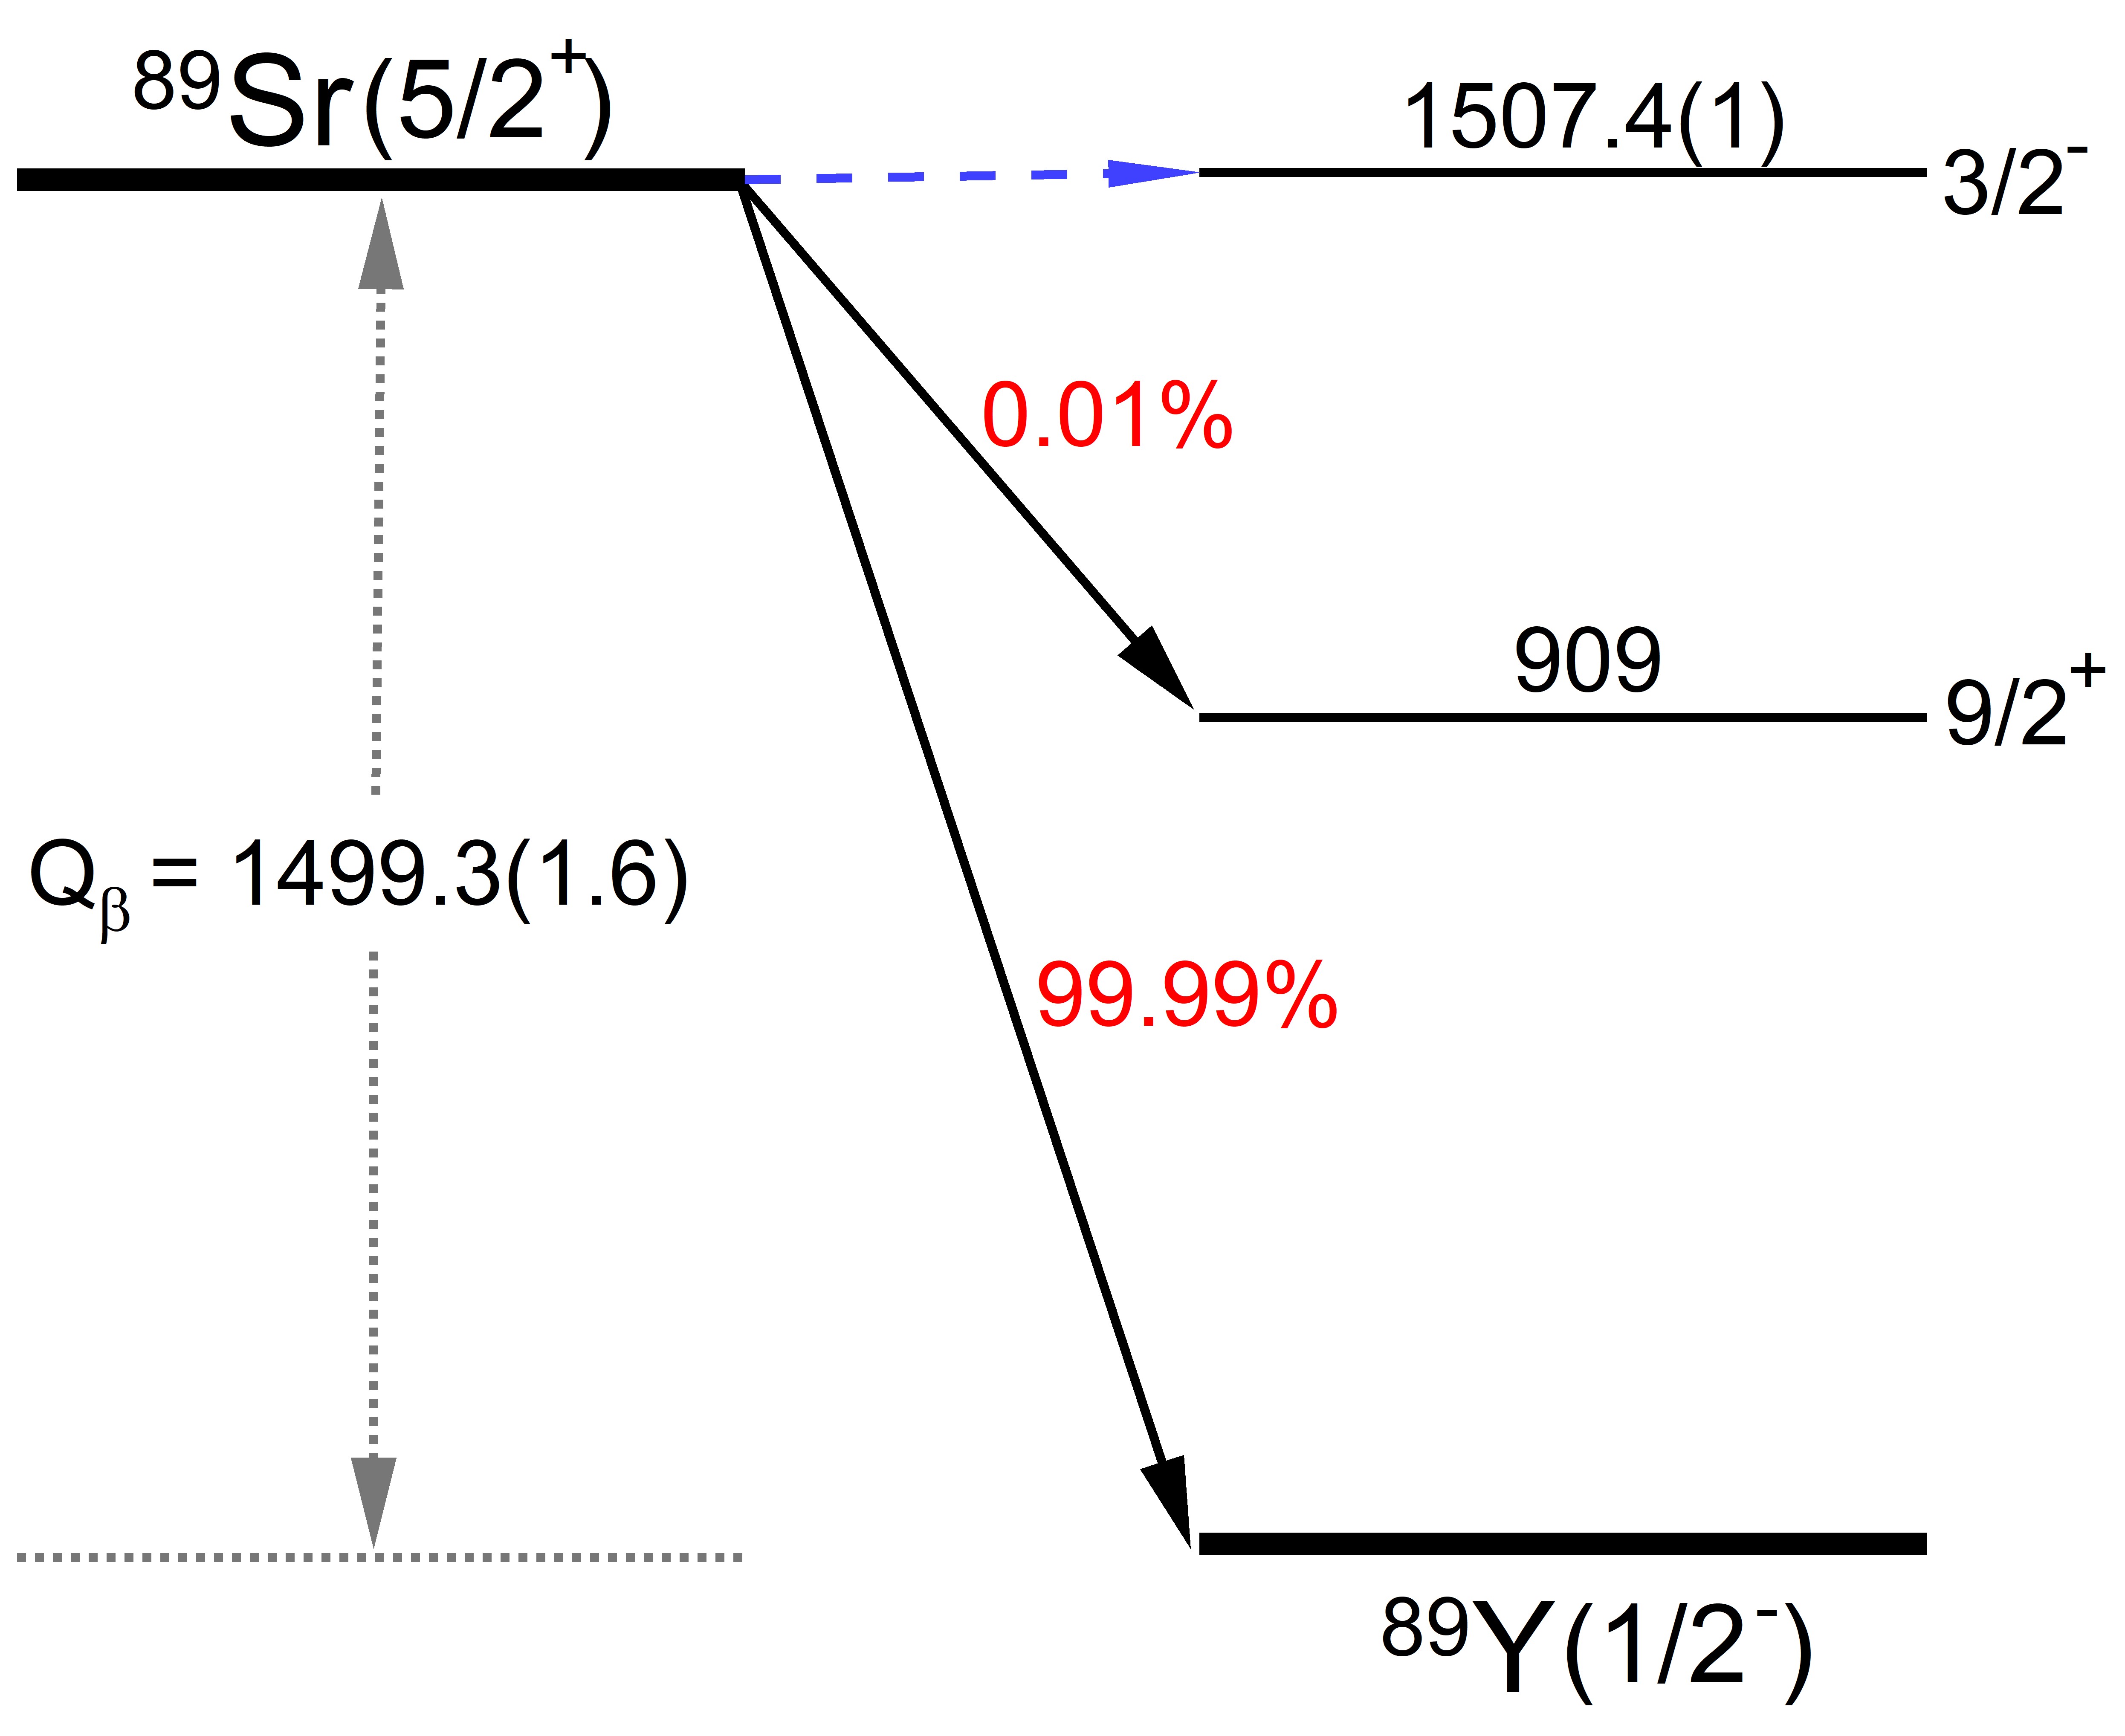
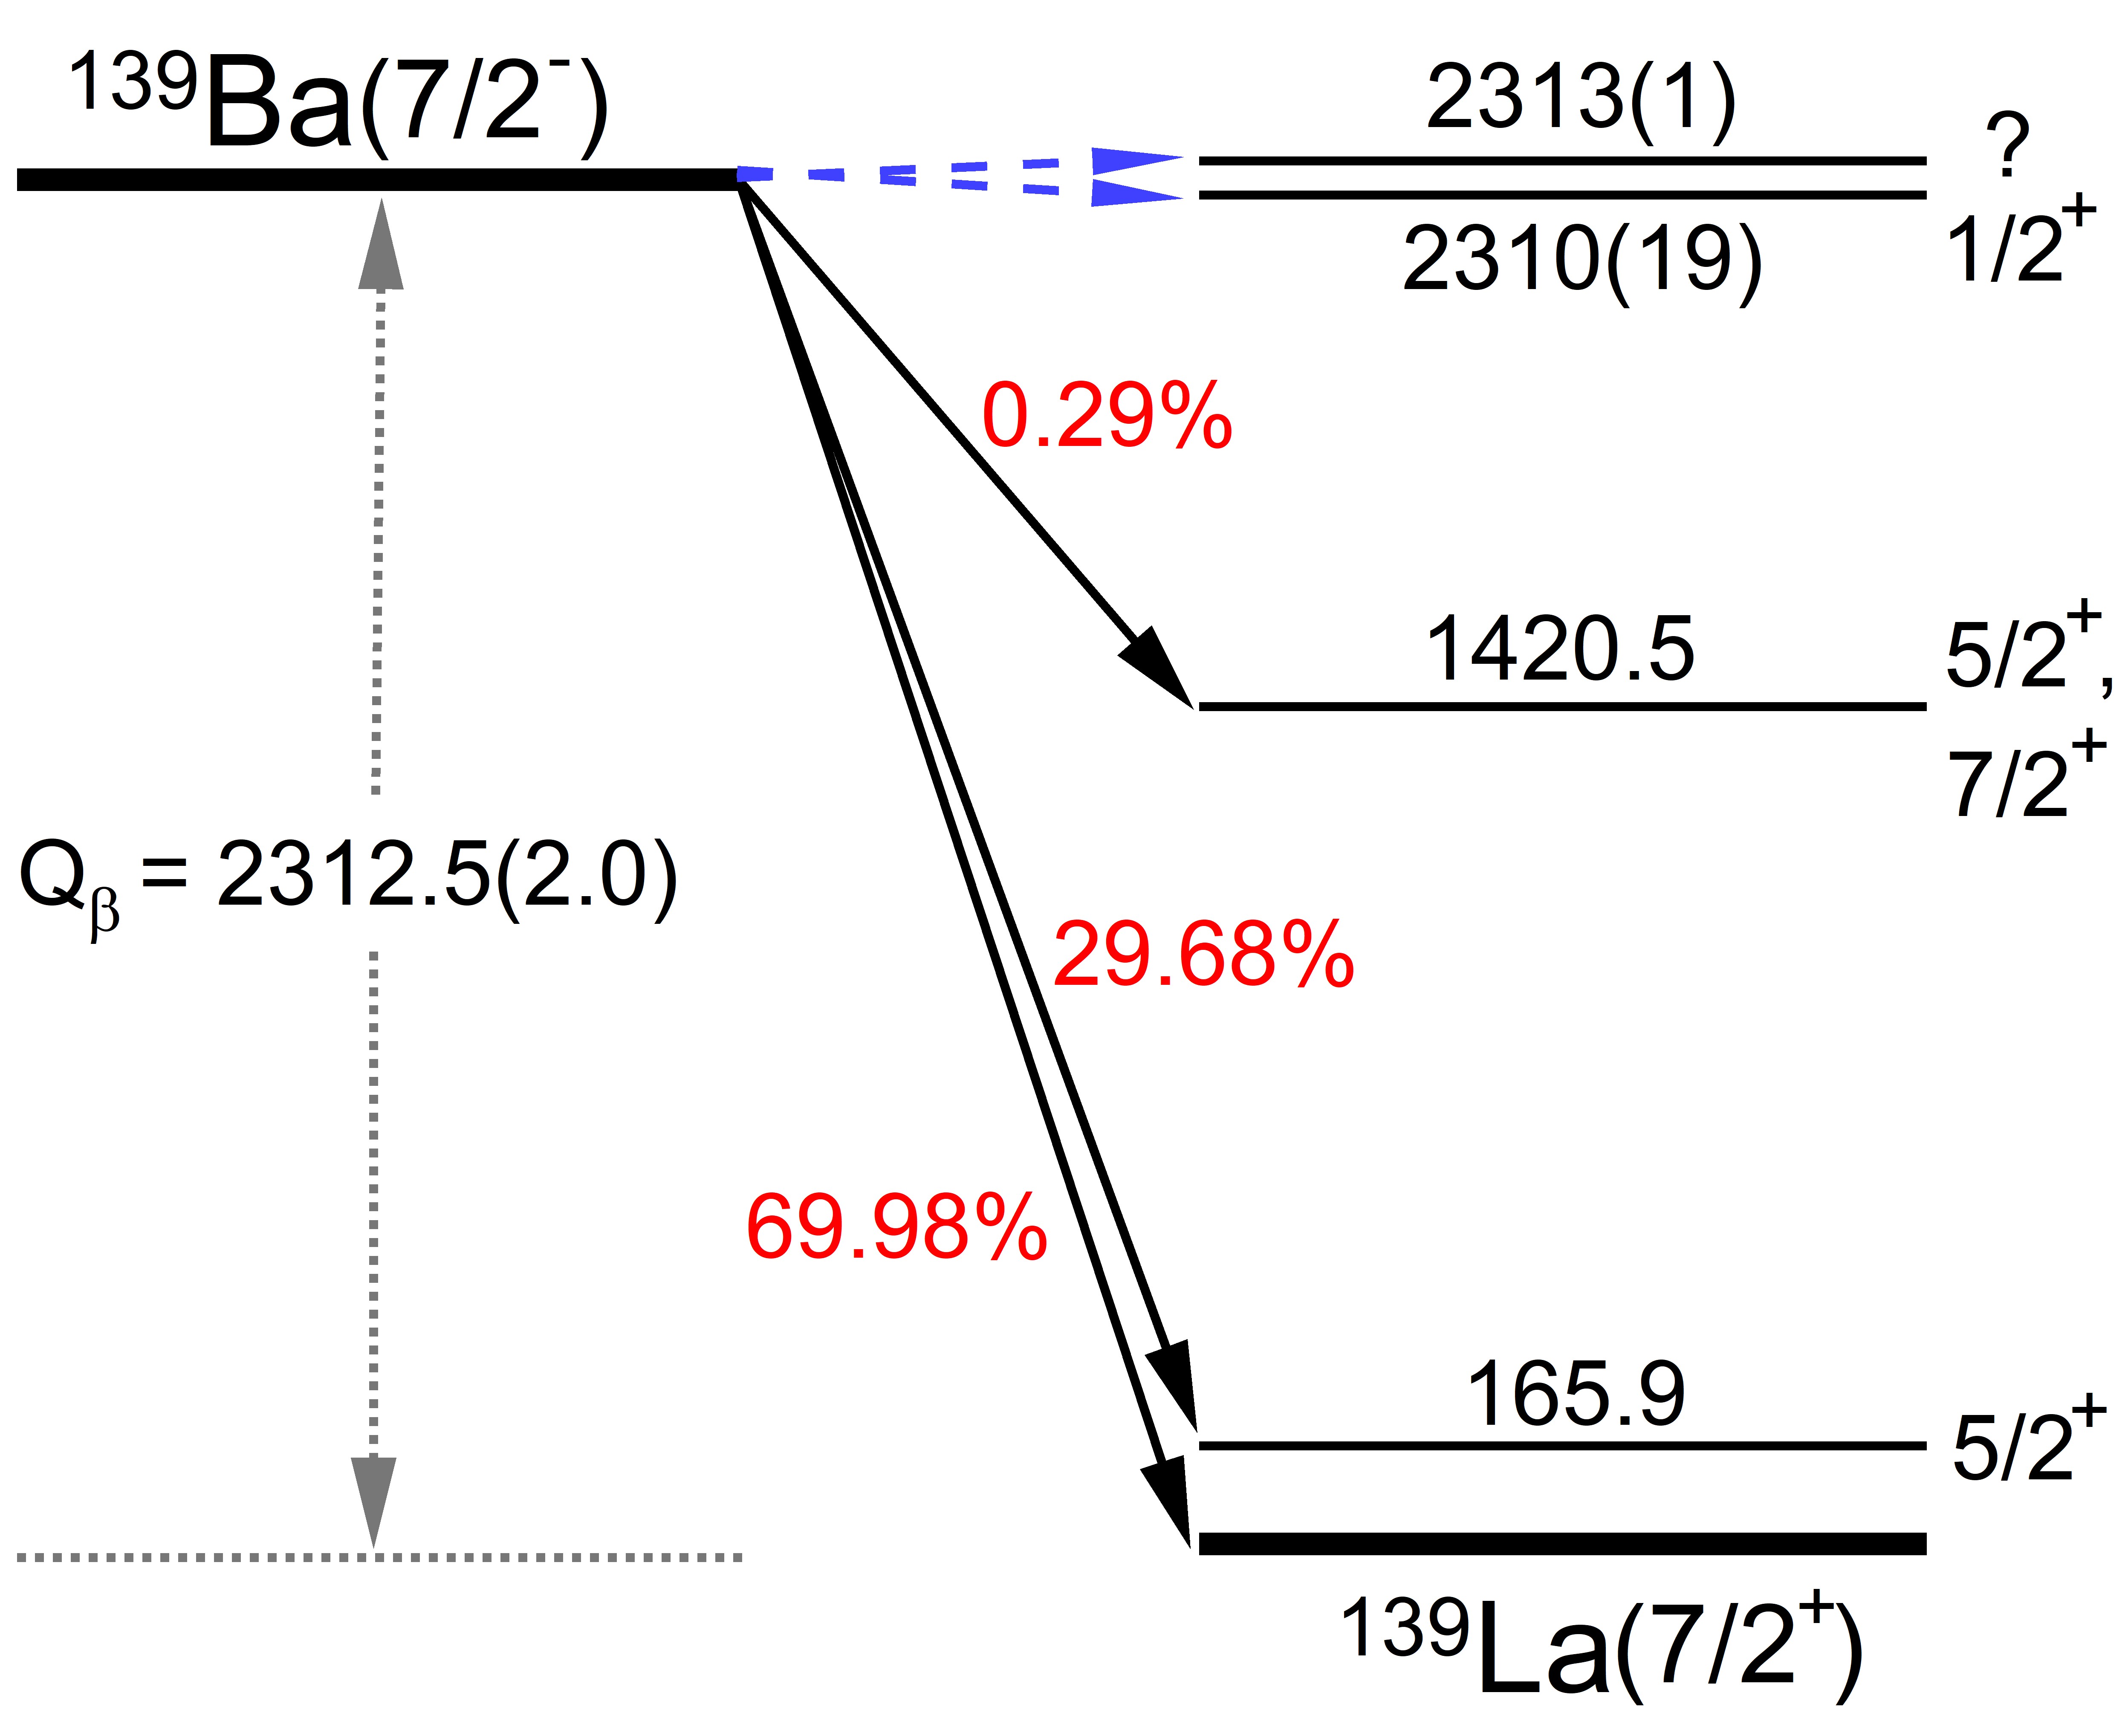
In Fig. 1, decay schemes are shown for 89Sr and 139Ba, with the main -decay transitions indicated by solid black arrows and the potential ultra-low -value decays indicated by dashed blue arrows. In the case of 89Sr, the potential ultra-low -value decay is to the 3/2- state in 89Y at 1507.4 keV. For 139Ba, there are two potential ultra-low -value decay branches: to the 1/2- state in 139La at 2310 keV and to the state of unknown spin and parity at 2313 keV. The ground-state to ground-state -values given in Fig. 1 are calculated using data from the most recent atomic mass evaluation, AME2016 Wang et al. (2017), and are limited by the 1.6 keV/c2 and 2.0 keV/c2 uncertainties in the masses of 89Y and 139La, respectively. The mass of the parent isotopes, 89Sr and 139Ba, are known to 0.09 keV/c2 and 0.32 keV/c2, respectively. Hence, precise and accurate atomic masses for 89Y and 139La with uncertainties 1 keV/c2 are called for to determine if these potential ultra-low -value decay branches are energetically allowed. In this paper we present the first direct mass measurements of 89Y and 139La using Penning trap mass spectrometry. We calculate new -values for these decays and discuss implications for potential ultra-low -value -decays in 89Sr and 139Ba.
II Experiment Description
The atomic masses of 89Y and 139La were measured at the Low Energy Beam and Ion Trap (LEBIT) facility, located at the National Superconducting Cyclotron Laboratory (NSCL) Ringle et al. (2013). While LEBIT was designed to perform on-line mass measurements of rare isotopes from the NSCL produced via projectile fragmentation, it also houses a Laser Ablation Source (LAS) Izzo et al. (2016) and a Thermal Ion Source (TIS) which can be used to produce stable and long-lived isotopes for use as reference masses and for offline measurements with applications in neutrino and nuclear physics Redshaw. et al. (2012); Bustabad et al. (2013a, b); Lincoln et al. (2013); Gulyuz et al. (2015); Eibach et al. (2016); Gamage et al. (2016); Kandegedara et al. (2017); Sandler et al. (2019). For the 139La measurement, the LAS was fitted with a 25mm 25mm 1mm thick sheet of lanthanum esp , used to produce 139La+ (99.9% natural abundance). The TIS was fitted with a canister of xenon gas to produce 136Xe+ (8.9% natural abundance) via plasma ionization for use as a reference ion. For the 89Y measurement, the LAS was fitted with a 25mm 25mm 1mm thick sheet of yttrium esp , used to produce 89Y+ (100% natural abundance), and the TIS was set up to produce 85Rb+ and 87Rb+ (72.2% and 27.8% natural abundances, respectively) via surface ionization for use as reference ions.
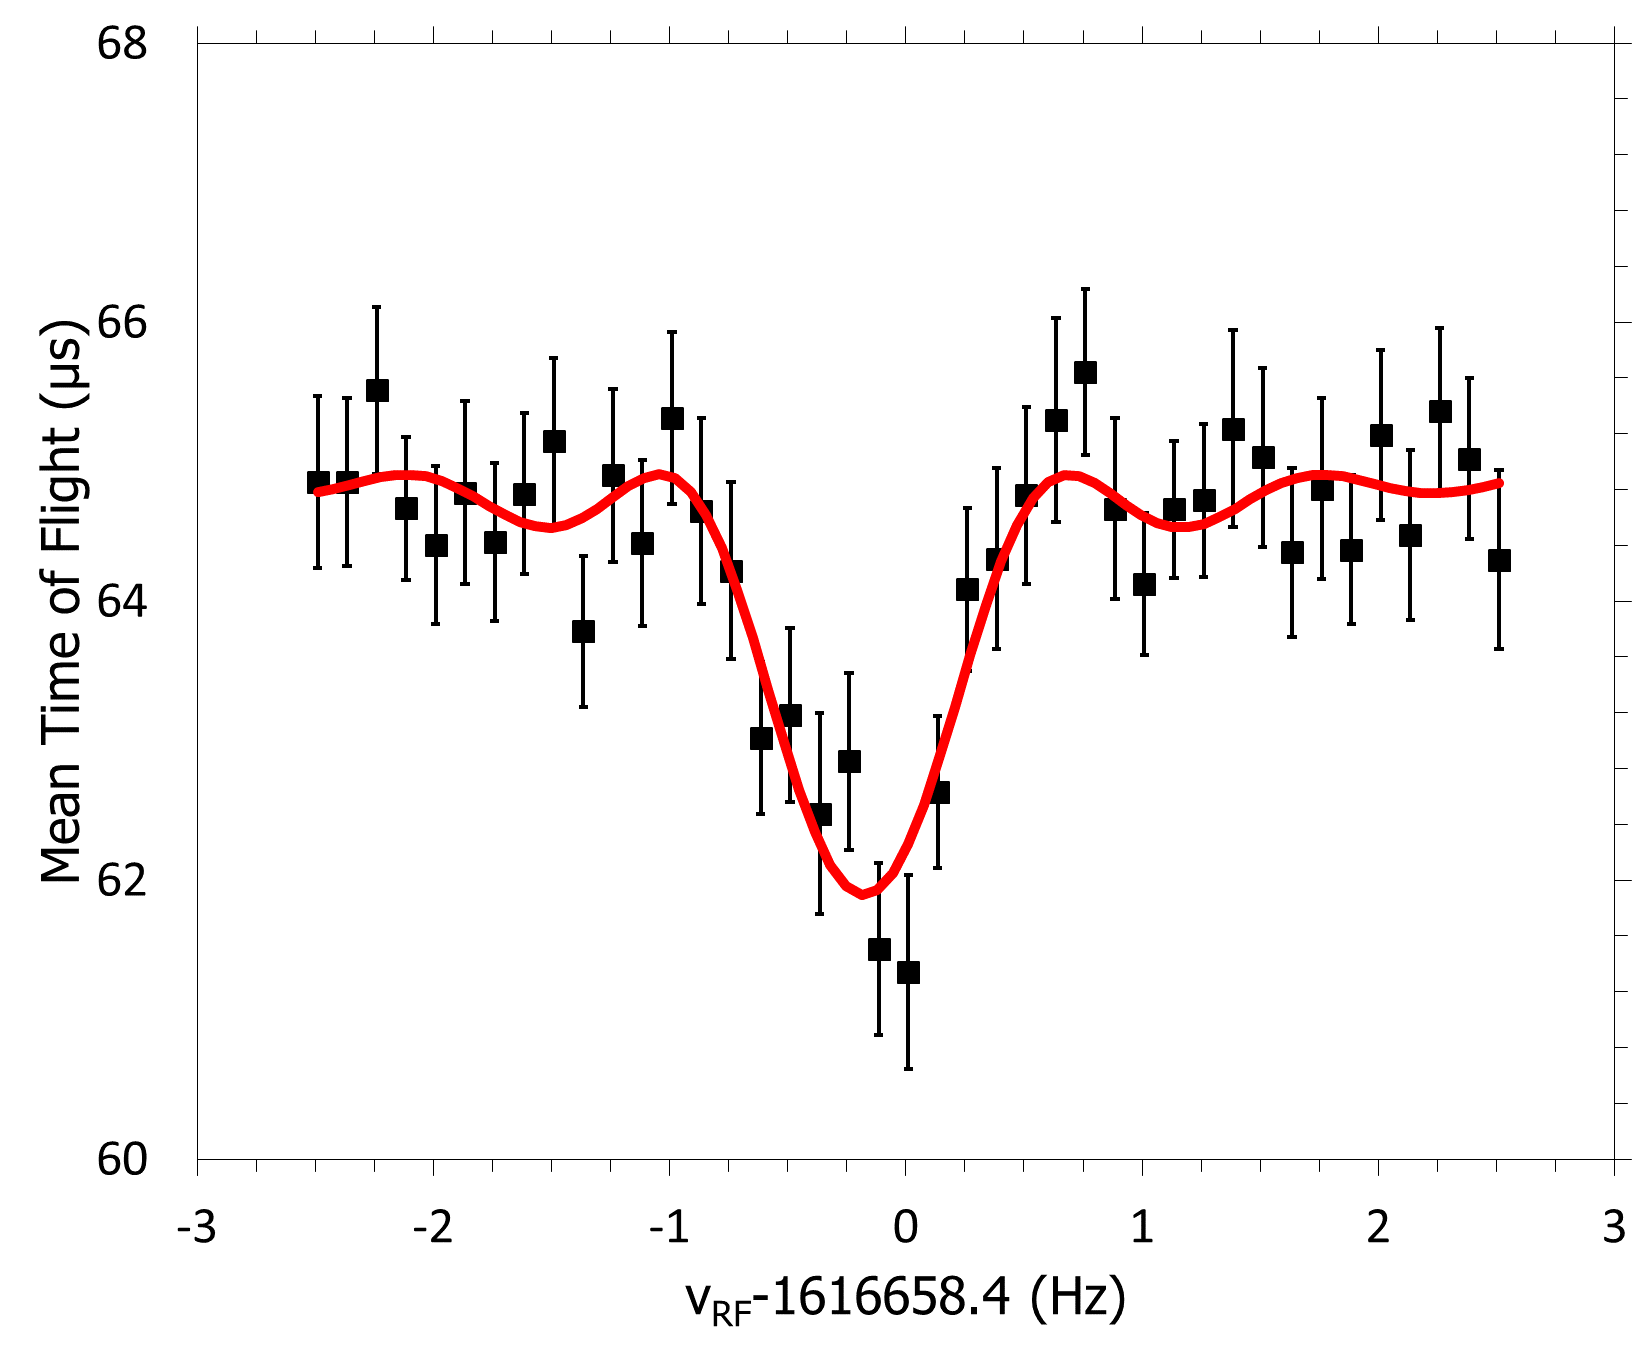
The LEBIT Penning trap is a hyperbolic trap housed in a 9.4 T magnetic field. The facility uses the Time of Flight-Ion Cyclotron Resonance (TOF-ICR) technique to precisely measure the cyclotron frequency of the ion in question Gräff et al. (1980). Ions held within the trap are driven with a quadrupolar radio frequency (rf) pulse near to the cyclotron frequency for a period of time, . They are released towards a micro-channel plate (MCP) detector and the time-of-flight between the trap and the detector is measured. The time-of-flight is minimized when the frequency of the rf pulse matches the cyclotron frequency of the ion in question. By varying the frequency of the rf pulses around the cyclotron frequency and taking multiple time-of-flight measurements, a resonance curve can be built and fit to a theoretical line shape (see Fig. 2). The width of the resonance, and hence the precision to which the central frequency can be obtained from a fit to the theoretical line shape, goes as . In this work we used s. Before and after each measurement of the ion of interest, a cyclotron frequency measurement is taken with the reference ion. The reference measurements are linearly interpolated to find the cyclotron frequency of the reference ion at the time of the measurement of the ion of interest.
The cyclotron frequency of an ion with a charge-to-mass ratio of is given by the relationship
| (1) |
From the cyclotron frequency of the reference ion and the ion of interest, the cyclotron frequency ratio, corresponding to the inverse mass ratio of the ions can be obtained:
| (2) |
A series of measurements of are taken to find an average value, . The atomic mass can then be obtained using the known mass of the reference atom and the equation
| (3) |
where is the atomic mass of the atom of interest, is the atomic mass of a well-known reference atom, and is the mass of the electron. We have ignored the binding energy of electrons in singly charged ions as they are 10 eV, which is much smaller than our statistical uncertainty and therefore negligible. The calculated daughter mass can then be used with the mass of the parent atom to find the -value of the ground-state to ground-state decay, using the equation
| (4) |
where is the atomic mass of the daughter (corresponding to for 89Y and 139La measured here) and is the atomic mass of the parent (89Sr and 139Ba taken from the AME2016).
III Results and Discussion
The average cyclotron frequency ratios, , can be found in Table 1. These ratios have had small corrections applied to them to correct for the / = 2 10-10 per u shift to the ratio that occurs in our system when measuring non-mass doublets Gulyuz et al. (2015). The uncertainties have been inflated by the Birge Ratio Birge (1932) to allow for potential systematic uncertainties that may not have been accounted for.
| Num. | Ion Pair | N | BR | |
|---|---|---|---|---|
| (i) | / | 66 | 1.2 | |
| (ii) | / | 44 | 1.1 | |
| (iii) | / | 66 | 1.3 |
The ratios in Table 1 were used to obtain absolute atomic masses for 89Y and 139La. The mass excesses were then calculated using the equation
| (5) |
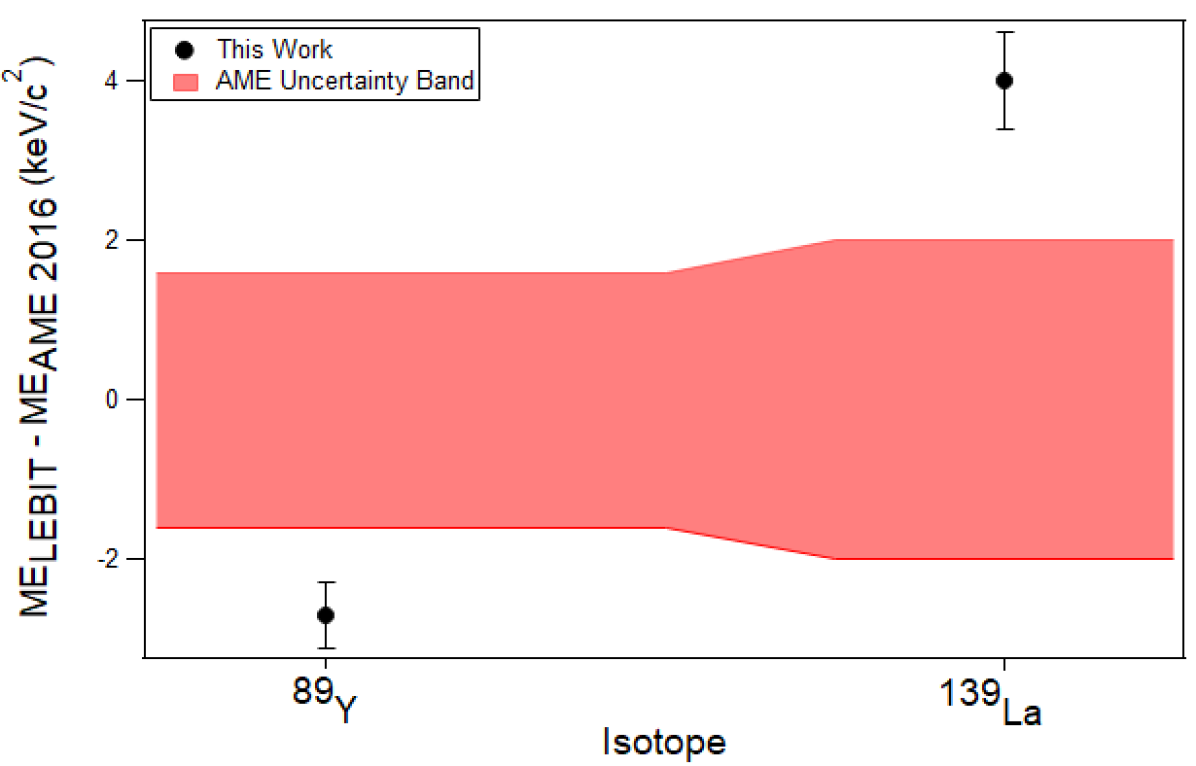
where is the mass number of the atom of interest and the conversion factor is from Ref. Mohr et al. (2016). The results are listed in Table 2 and are compared with the values from the AME2016 Wang et al. (2017). The mass differences are also shown in Fig. 3. There is a 2.8 keV/c2 reduction in the 89Y mass excess obtained in this work compared to the AME2016. In the AME, the 89Y mass value was obtained mainly from a neutron capture measurement linking it to 90Y, which is then linked to 90Zr through a 90Y -decay measurement. The mass of 90Zr was measured directly at LEBIT Gulyuz et al. (2015).
In the case of 139La there is a 4.0 keV/c2 increase in the mass excess value from this work compared to the AME2016. The mass value of 139La in the AME is not based on a direct measurement, but through a -decay measurement that links it to the mass of 139Ba and through a network of neutron capture, -decay, and -decay measurements which eventually link it to 163Dy and 163Ho, for which precise Penning trap measurements have been performed Eliseev et al. (2015). In a previous measurement campaign we performed a direct measurement of the mass of 138La and found a +5.8 keV/c2 discrepancy compared to the AME2016 Sandler et al. (2019). 138La was determined in the AME2016 mainly via a 138LaLa reaction measurement with an uncertainty of 3 keV. Hence, our results for the two lanthanum isotopes are consistent with the 138LaLa measurement being correct, and the 139La mass in AME2016 being off by 4 keV/c2.
| Isotope | Ref. | This work | AME2016 | ME |
| (keV/c2) | (keV/c2) | (keV/c2) | ||
| 89Y | 87Rb | -2.3(1.7) | ||
| 85Rb | -3.4(1.7) | |||
| Ave. | -2.8(1.6) | |||
| 139La | 136Xe | 4.0(2.1) |
Using our new atomic masses for 89Y and 139La along with masses for 89Sr and 139Ba from AME2016, we obtain new ground-state to ground-state -values, , which are listed in Table 3. We also list the energy of the potential ultra-low -value decay daughter state and the calculated -value for the ultra-low decay branch from
| (6) |
For the decay of 89Sr to 89Y, the -value was increased by 2.8 keV. The new value of 1502.20 keV is still less than the 89Y 3/2- excited state energy of 1507.4 keV. With keV, it can now be said definitively that the 3/2- excited state is not a candidate for ultra-low -value decay. We note that the mass of 89Sr is known to 0.09 keV/c2 via an ( measurement that links it to 88Sr, which has been measured precisely using Penning trap mass spectrometry Sandler et al. (2019).
For the decay of 139Ba to 139La, the -value was decreased by 4 keV. The new value of 2308.37 keV is now substantially less than the 2313 keV excited state of 139La. With keV, it can now be said definitively that the 2313 keV excited state is not energetically viable for ultra-low -value decay. However, the 1/2+ excited state of 139La, with an energy of 2310(19) keV and keV, still has too large of an uncertainty for any definitive claims to be made. The energy of this excited state will need to be measured to a higher precision to determine if it is a candidate for an ultra-low -value -decay. The mass of 139Ba is known to 0.32 keV/c2 via an measurement linking it to 138Ba. In Ref. Sandler et al. (2019) we also performed a direct measurement of the mass of 138Ba, which was in excellent agreement with the AME2016 result. The mass of 138Ba was derived in the AME2016 from an measurement linking it to 137Ba—the same series of measurements linking 138Ba and 139Ba. This chain of measurements is ultimately anchored to 136Xe and 133Cs, for which precise atomic mass measurements have been performed. Hence, there is good reason to accept the AME2016 139Ba mass.
| Parent | Daughter | E* | ||
|---|---|---|---|---|
| keV | keV | keV | ||
| 89Sr | 89Y | 1502.20(0.35) | 1507.4(0.1) | -5.20(0.37) |
| 139Ba | 139La | 2308.37(0.68) | 2310(19) | -1.6(19.0) |
| 139Ba | 139La | 2308.37(0.68) | 2313(1) | -4.6(1.2) |
IV Conclusion
Using Penning trap mass spectrometry, the mass excess of 89Y was measured to be keV/c2 and the mass excess of 139La was measured to be keV/c2. These are the first Penning trap mass spectrometry measurements of either isotope. The new masses were used to calculate the -decay -values for 89Sr Y and 139Ba La. The -value for 89Sr was found to be 1502.20(0.35) keV and the -value for 139Ba was found to be 2308.37(0.68) keV. Both have had their uncertainties reduced by more than a factor of two. For the decay of 89Sr, the potential ultra-low -value decay channel to the 3/2- state in 89Y at 1507.4 keV has been refuted. For the decay of 139Ba, one potential ultra-low -value decay channel to the 2313 keV level in 139La with unknown has been refuted. However, the 1/2+ excited state in139La, currently measured to be 2310(19)keV, is still a candidate. More precise measurements of the excitation energy of 139La will be necessary to determine whether or not the -decay of 139Ba to this state is an ultra-low -value decay candidate.
Acknowledgments
This research was supported by Michigan State University and the Facility for Rare Isotope Beams and the National Science Foundation under Contracts No. PHY-1102511 and No. PHY1307233. This material is based upon work supported by the US Department of Energy, Office of Science, Office of Nuclear Physics under Award No. DE-SC0015927.
References
- Mustonen and Suhonen (2010a) M. T. Mustonen and J. Suhonen, J. Phys. G: Nucl. Part. Phys. 37, 064008 (2010a).
- Suhonen and Mustonen (2010) J. Suhonen and M. Mustonen, Progress in Particle and Nuclear Physics 64, 235 (2010), neutrinos in Cosmology, in Astro, Particle and Nuclear Physics.
- Cattadori et al. (2004) C. M. Cattadori, M. D. Deo, M. Laubenstein, L. Pandola, and V. I. Tretyak, Nucl. Phys. A 748, 333 (2004).
- Cattadori et al. (2007) C. M. Cattadori, M. De Deo, M. Laubenstein, L. Pandola, and V. I. Tretyak, Physics of Atomic Nuclei 70, 127 (2007).
- Suhonen (2014) J. Suhonen, Physica Scripta 89, 054032 (2014).
- Kopp and Merle (2010) J. Kopp and A. Merle, Phys. Rev. C 81, 045501 (2010).
- Zheltonozhsky et al. (2018) V. A. Zheltonozhsky, A. M. Savrasov, N. V. Strilchuk, and V. I. Tretyak, Europhys. Lett. 121, 12001 (2018).
- Blachot (2005) J. Blachot, Nuclear Data Sheets 104, 967 (2005).
- Audi et al. (2003) G. Audi, A. Wapstra, and C. Thibault, Nuclear Physics A 729, 337 (2003), the 2003 NUBASE and Atomic Mass Evaluations.
- Wieslander et al. (2009) J. S. E. Wieslander, J. Suhonen, T. Eronen, M. Hult, V.-V. Elomaa, A. Jokinen, G. Marissens, M. Misiaszek, M. T. Mustonen, S. Rahaman, C. Weber, and J. Äystö, Phys. Rev. Lett. 103, 122501 (2009).
- Mount et al. (2009) B. Mount, M. Redshaw, and E. G. Myers, Phys. Rev. Lett. 103, 122502 (2009).
- Andreotti et al. (2011) E. Andreotti, M. Hult, R. González de Orduña, G. Marissens, J. S. E. Wieslander, and M. Misiaszek, Phys. Rev. C 84, 044605 (2011).
- Haaranen and Suhonen (2013) M. Haaranen and J. Suhonen, The European Physical Journal A 49, 93 (2013).
- Mustonen and Suhonen (2011) M. Mustonen and J. Suhonen, Physics Letters B 703, 370 (2011).
- Mustonen and Suhonen (2010b) M. T. Mustonen and J. Suhonen, AIP Conf. Proc. 1304, 401 (2010b).
- Gamage et al. (2019) N. D. Gamage, R. Bhandari, M. H. Gamage, R. Sandler, and M. Redshaw, Hyp. Int. 240, 43 (2019).
- Wang et al. (2017) M. Wang, G. Audi, F. Kondev, W. Huang, S. Naimi, and X. Xu, Chin. Phys. C 41, 030003 (2017).
- Ringle et al. (2013) R. Ringle, S. Schwarz, and G. Bollen, Int. J. Mass Spec. 349, 87 (2013).
- Izzo et al. (2016) C. Izzo, G. Bollen, S. Bustabad, M. Eibach, K. Gulyuz, D. J. Morrissey, M. Redshaw, R. Ringle, R. Sandler, S. Schwarz, and A. A. Valverde, Nucl. Instrum. Methods Phys. Res., Sect. B 376, 60 (2016).
- Redshaw. et al. (2012) M. Redshaw., G. Bollen, M. Brodeur, S. Bustabad, D. L. Lincoln, S. J. Novario, R. Ringle, and S. Schwarz, Phys. Rev. C 86, 041306(R) (2012).
- Bustabad et al. (2013a) S. Bustabad, G. Bollen, M. Brodeur, D. L. Lincoln, S. J. Novario, M. Redshaw, R. Ringle, and S. Schwarz, Phys. Rev. C 88, 035502 (2013a).
- Bustabad et al. (2013b) S. Bustabad, G. Bollen, M. Brodeur, D. L. Lincoln, S. J. Novario, M. Redshaw, R. Ringle, S. Schwarz, and A. A. Valverde, Phys. Rev. C 88, 022501(R) (2013b).
- Lincoln et al. (2013) D. L. Lincoln, J. D. Holt, G. Bollen, M. Brodeur, S. Bustabad, J. Engel, S. Novario, M. Redshaw, R. Ringle, and S. Schwarz, Phys. Rev. Lett 110, 012501 (2013).
- Gulyuz et al. (2015) K. Gulyuz, J. Ariche, G. Bollen, S. Bustabad, M. Eibach, C. Izzo, S. J. Novario, M. Redshaw, R. Ringle, R. Sandler, S. Schwarz, and A. A. Valverde, Phys. Rev. C 91, 055501 (2015).
- Eibach et al. (2016) M. Eibach, G. Bollen, K. Gulyuz, C. Izzo, M. Redshaw, R. Ringle, R. Sandler, and A. A. Valverde, Phys. Rev. C 94, 015502 (2016).
- Gamage et al. (2016) N. D. Gamage, G. Bollen, M. Eibach, K. Gulyuz, C. Izzo, R. M. E. B. Kandegedara, M. Redshaw, R. Ringle, R. Sandler, and A. A. Valverde, Phys. Rev. C 94, 025505 (2016).
- Kandegedara et al. (2017) R. M. E. B. Kandegedara, G. Bollen, M. Eibach, N. D. Gamage, K. Gulyuz, C. Izzo, M. Redshaw, R. Ringle, R. Sandler, and A. A. Valverde, Phys. Rev. C 96 (2017), 10.1103/PhysRevC.96.044321.
- Sandler et al. (2019) R. Sandler, G. Bollen, J. Dissanayake, M. Eibach, K. Gulyuz, A. Hamaker, C. Izzo, X. Mougeot, D. Puentes, F. G. A. Quarati, M. Redshaw, R. Ringle, and I. Yandow, Phys. Rev. C 100, 014308 (2019).
- (29) “Espi metals,” http://www.espimetals.com.
- Gräff et al. (1980) G. Gräff, H. Kalinowsky, and J. Traut, Zeit. Phy. A 297, 35 (1980).
- König et al. (1995) M. König, G. Bollen, H.-J. Kluge, T. Otto, and J. Szerypo, Int. J. Mass. Spectrom. Ion Process 142, 95 (1995).
- Birge (1932) R. T. Birge, Phys. Rev. 40, 207 (1932).
- Mohr et al. (2016) P. J. Mohr, D. B. Newell, and B. N. Taylor, Journal of Physical and Chemical Reference Data 45, 043102 (2016), https://doi.org/10.1063/1.4954402 .
- Eliseev et al. (2015) S. Eliseev, K. Blaum, M. Block, S. Chenmarev, H. Dorrer, C. E. Düllmann, C. Enss, P. E. Filianin, L. Gastaldo, M. Goncharov, U. Köster, F. Lautenschläger, Y. N. Novikov, A. Rischka, R. X. Schüssler, L. Schweikhard, and A. Türler, Phys. Rev. Lett. 115, 062501 (2015).