The First Candidate Colliding-Wind Binary in M33
Abstract
We present the detection of the first candidate colliding-wind binary (CWB) in M33, located in the giant H II region NGC 604. The source was first identified in archival Chandra imaging as a relatively soft X-ray point source, with the likely primary star determined from precise astrometric alignment between archival Hubble Space Telescope and Chandra imaging. The candidate primary star in the CWB is classified for the first time in this work as a carbon-rich Wolf-Rayet star with a likely O star companion based on spectroscopy obtained from Gemini-North. We model the X-ray spectrum using Chandra and XMM-Newton observations, and find the CWB is well-fit as a 1 keV thermal plasma with a median unabsorbed luminosity in the 0.5–2.0 keV band of 3 1035 erg s-1, making this source among the brightest of CWBs observed to date. We present a long term light curve for the candidate CWB from archival Chandra and XMM-Newton observations, and discuss the constraints placed on the binary by this light curve, as well as the X-ray luminosity at maximum. Finally, we compare this candidate CWB in M33 to other well-studied, bright CWBs in the Galaxy and Magellanic Clouds, such as Car.
1 Introduction
Massive stars, stars 8 , vigorously shape their surroundings via mechanical, kinetic, and chemical feedback driven by their strong radiative winds and explosive deaths. The mass loss history of a massive star not only shapes its stellar surroundings, but also significantly alters the evolution of the star itself. A high fraction of massive stars have also been found to exist in close binaries which, if they do not merge, will either accrete or strip mass from their companion at some point during their evolution (Sana et al., 2012; Neugent & Massey, 2014). Thus mass loss via stellar winds or interactions in a binary are of paramount importance for understanding massive star evolution and its influence via energetic and chemical feedback.
Theoretical models of wind mass loss rates (e.g., Vink et al., 2001) have long been used as input in stellar evolution codes to predict evolution with mass loss history; however, mass loss rate predictions from theoretical models can be discrepant from empirically derived values by a factor of a few or more (Fullerton et al., 2006; Oskinova et al., 2007; Sundqvist et al., 2011; Bouret et al., 2012). The systematic biases in observed mass loss rates depend on choice of line diagnostic, as diagnostics such as H are especially sensitive to wind “clumpiness” (Kudritzki & Puls, 2000; Smith, 2014). This highlights the need for a multiwavelength approach to empirically constraining massive star wind properties (e.g., Cohen et al., 2011, 2014; Puebla et al., 2016), and therefore the effects of mass loss on massive star evolution and the surrounding environment.
To this end, X-ray emission from massive stars provides a means to probe the structure and strength of stellar winds beyond standard UV, IR, and optical diagnostics, which are more sensitive to the systematics associated with non-uniform, or clumpy winds (Pittard, 2007). In particular, X-ray line diagnostics and X-ray variability from both single stars and binary systems can be used to probe wind strength and structure (e.g., Pittard & Stevens, 1997; Pittard & Corcoran, 2002; Oskinova et al., 2004; Nazé et al., 2013).
Single OB stars produce soft ( keV) X-ray emission with characteristic 1031–1033 erg s-1 from shocks embedded in their stellar winds (Lucy & Solomon, 1970; Lucy & White, 1980; Lucy, 1982; Owocki et al., 1988; Feldmeier et al., 1997), and in addition clusters of hot, young stars can drive wind-blown bubbles that themselves are sources of soft, diffuse X-ray emission (e.g., Tüllmann et al., 2008). Slightly harder (T 107 K) X-ray emission with characteristic 1032–1035 erg s-1 can be produced by shocks originating in wind-wind collision regions of massive binaries (O + Wolf-Rayet [WR], or WR + WR), sources known as colliding-wind binaries (CWBs) (Prilutskii & Usov, 1976; Cherepashchuk, 1976; Pollock, 1987; Luo et al., 1990; Stevens et al., 1992; Usov, 1992).
While both single X-ray emitting massive stars and CWBs can be used to probe the properties of massive star winds (e.g., Stevens et al., 1996; Oskinova et al., 2003; Pittard & Dougherty, 2006; Lomax et al., 2015) CWBs are on average more X-ray luminous than single stars (Pollock, 1987; Clark et al., 2008; Guerrero & Chu, 2008), and as such act as some of the brightest beacons in X-rays in the Galaxy and Magellanic Clouds (MCs) for studying in detail the strength and structure of winds from massive stars. However, the brightest CWBs such as Carinae, which reach 1035 erg s-1, are somewhat rare (Güdel & Nazé, 2009; Nazé et al., 2011), thus limiting the most detailed studies of such systems to perhaps a dozen sources in Galaxy and MCs (e.g., Rauw & Nazé, 2016), with none yet observed beyond the MCs.
Here we report the discovery of the first candidate CWB in M33 located in the giant H II region NGC 604. The system, hereafter referred to N604-WRX, hosts a carbon-rich WR (WC) primary star, and is comparable in luminosity to the most X-ray bright CWBs in the Galaxy and MCs ( 1035 erg s-1; Pollock et al., 2018).
This paper is organized as follows: in Section 2 we describe the X-ray and optical observations used to identify and characterize N604-WRX. In Section 3 we present our model for the X-ray spectrum of N604-WRX, and the X-ray luminosity and light curve derived from this model. We also present the spectral classification of the likely primary star in the CWB using ground-based spectroscopy. Next, in Section 4 we discuss the evidence from our observations in favor of N604-WRX as a CWB, and compare the source properties to other bright CWBs in the Galaxy and MCs. Finally, we provide conclusions and a discussion of future work to characterize N604-WRX in Section 5.
| Obs. Start Date | Obs. ID | Instrument | Obs. Mode | Off-Axis Angle | Eff. Exposure | PI |
|---|---|---|---|---|---|---|
| (arcmin) | (ks) | |||||
| 2001-07-06 | 2023 | ACIS-I | FAINT | 1.0 | 69.4 | F. Damiani |
| 2005-09-21 | 6378 | ACIS-I | VFAINT | 4.28 | 83.1 | M. Sasaki |
| 2006-06-09 | 6388 | ACIS-I | VFAINT | 8.06 | 80.1 | M. Sasaki |
| 2006-09-04 | 6379 | ACIS-I | VFAINT | 4.23 | 48.8 | M. Sasaki |
| 2006-09-07 | 7402 | ACIS-I | VFAINT | 4.22 | 39.4 | M. Sasaki |
2 Observations & Data Reduction
In this section, we present an overview of the data products, reduction, and analysis methods used in characterizing the candidate CWB N604-WRX, namely archival Chandra, XMM-Newton, and Hubble Space Telescope (HST) imaging, as well as spectra of the likely primary star newly obtained with Gemini-North.
2.1 Chandra Imaging & Spectra
We use five archival Chandra observations to characterize X-ray emission from N604-WRX. Four observations (obs. IDs 6378, 6379, 6388, and 7204) come from the deep Chandra ACIS survey of M33 (ChASeM33; Tüllmann et al., 2011) and were taken with ACIS-I in “Very Faint” (VFAINT) mode. One archival observation (obs. ID 2023) was taken with NGC 604 as the target, with the observations performed with ACIS-I in “FAINT” mode. The observations are summarized in Table 1, including off-axis angle of N604-WRX in each exposure, and effective exposure time for each observation after filtering on good time intervals (GTIs).
We reduced all archival observations using standard reduction techniques with CIAO version 4.10 and CALDB version 4.8.1111http://cxc.harvard.edu/ciao/download/. We reprocessed the level=1 event files using the script chandrarepro. Subsequently, we produced background light curves for each observation, where time intervals with high count rates were removed by filtering the level=2 event files on the GTIs as determined from the task lcclean with 5 clipping. The effective exposures for each observation after filtering for background flaring are listed in Table 1, resulting in a total effective exposure for N604-WRX of 320 ks.
Next, we ran wavdetect independently on each exposure to determine source positions for matching between exposures. We fixed the position for N604-WRX to the position returned from wavdetect from the most on-axis observation (obs. ID 2023), finding good agreement between this position (RA: 1:34:32.606, Dec: +30:47:04.091) and the corresponding point source position (013432.60+304704.1) listed in the ChASeM33 catalog (Tüllmann et al., 2011). We then ran wcsmatch between all other exposures and obs. ID 2023 using sources returned from wavdetect, and subsequently updated the aspect solutions and event files for each observation using wcsupdate to bring them into alignment with obs. ID 2023.
With the position of N604-WRX determined for all exposures, we proceeded to extract spectral products. For each exposure we determined the region encircling 95% of the point spread function (PSF) of the source using the task psfsizesrcs, and used these regions for source extraction. We also extracted background regions in order to model the surrounding soft, diffuse emission from NGC 604. The background regions were chosen as annuli surrounding the source extraction regions, with the inner radius set to where the radial surface brightness profile of N604-WRX approached the level of emission from NGC 604 in the surrounding region, and the outer radius set so that the background annulus was roughly five times the size of the source extraction region, ensuring enough counts to adequately characterize the background. Using these source and background regions, we extracted spectral products using the task specextract for each exposure: source and background spectra, response matrix files (RMFs), and auxiliary response files (ARFs). Details of the spectral models and fitting process and discussed in Section 3.1.
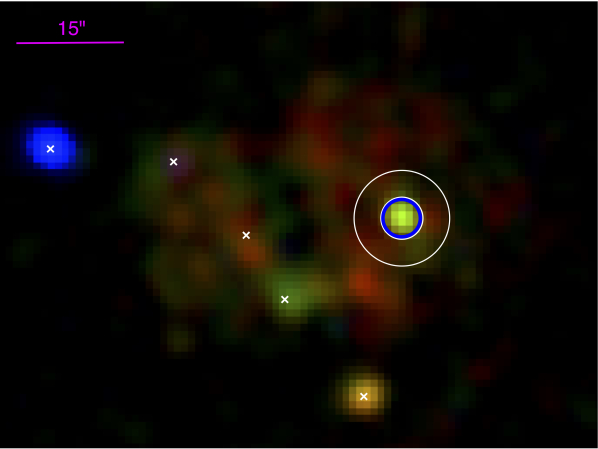
Finally, we created a merged, exposure-corrected image using all obs. IDs listed in Table 1. The individual exposures were first reprojected onto the frame of obs. ID 2023 and then merged using the CIAO task reprojectobs. The merged image was then exposure corrected and binned into 1” 1” pixels (2 2 binning) using the task fluxobs. As the data were processed using the Energy-Dependent Subpixel Event Repositioning algorithm (EDSER; Li et al., 2004) during the chandrarepro task, we also created an image attempting to recover sub-pixel resolution for N604-WRX using an image of the source PSF produced with MARX, and the task dmcopy imposing a binning factor less than one; however, this process appeared to generate artifacts not present in the image at native resolution. Thus, we opted to use the merged image with 1” 1” pixels to create exposure-corrected images in the soft (0.2-1.0 kev), medium (1.0-2.0 keV), and hard (2.0-8.0 keV) bands. In Figure 1 we show the three-color, exposure-corrected mosaic of NGC 604 created using these images with source (blue) and background (white) spectral extraction regions for N604-WRX overlaid. N604-WRX is clearly visible as a point source in the western region of NGC 604 with counts in both the soft and medium bands.
| Obs. Start Date | Obs. ID | Off-Axis Angle (arcmin) | Eff. Exposure (ks) | PI | ||||
|---|---|---|---|---|---|---|---|---|
| MOS1 | MOS2 | PN | MOS1 | MOS2 | PN | |||
| 2010-07-09 | 0650510101 | 4.8 | 5.7 | 4.1 | 87.0 | 74.2 | 81.2 | B.F. Williams |
| 2010-07-21 | 0650510301 | – | – | 15.7 | – | – | 79.4 | B.F. Williams |
| 2012-01-10 | 0672190301 | – | 8.5 | 7.5 | – | 97.6 | 93.4 | B.F. Williams |
| 2017-08-02 | 0800350301 | – | 5.4 | – | – | 23.3 | – | B. Lehmer |
2.2 XMM-Newton Imaging & Spectra
To further characterize the X-ray luminosity and spectrum of N604-WRX, we downloaded all available XMM-Newton observations in the vicinity of the source from the XMM-Newton Science Archive (XSA)222http://nxsa.esac.esa.int/nxsa-web/, comprising four separate observations and a total of seven exposures where N604-WRX was not off-field or on a chip gap. The observations are summarized in Table 2.
Observational data files (ODFs) for each observation were reprocessed using the XMM-Newton Science Analysis System (SAS version 17.0)333https://www.cosmos.esa.int/web/xmm-newton/sas. To produce processed event lists from the ODF for the EPIC-MOS (Turner et al., 2001) and EPIC-pn detectors (Strüder et al., 2001) we employed the SAS tasks emchain and epchain, respectively, applying standard filtering as follows: (PATTERN 12 && flag== #XMMEAEM) for the EPIC-MOS detectors to include single, double, and quadruple events and standard event flagging, and (PATTERN 4 && FLAG == 0) for the EPIC-pn detector to include single and double events and conservative flagging.
With these event lists for each exposure, we next created field-wide high-energy light curves to determine GTIs to filter the event lists for background flaring. For obs. IDs 0650510101, 0650510301, and 0672190301 we created 7-15 keV light curves for all detectors as in Williams et al. (2015). We inspected each light curve by eye to determine the periods of high count rate to exclude: 0.35 counts s-1 for 0650510101 and 0672190301 MOS detectors, 3 counts s-1 for 0650510101 and 0672190301 pn, 0.5 counts s-1 for 0650510301 MOS detectors, and 17.5 counts s-1 for 0650510301 pn. For obs. ID 0800350301 we created 10 keV light curves for the MOS detectors and 10-12 keV light curves for the pn, filtering out periods with count rates 0.35 counts s-1 for the MOS, and 0.4 counts s-1 for the pn as in West et al. (2018). The effective exposures for each exposure after GTI correction are listed in Table 2, resulting in a total effective exposure for N604-WRX of 536 ks.
After GTI-correction, we performed source detection using edetectchain separately for each exposure to determine source positions for cross-correlation with the positions from Chandra obs. ID 2023. Translational shifts between each XMM-Newton exposure and Chandra were determined using at least three sources per exposure with the CIAO task wcsmatch, and subsequently used to bring each EPIC exposure into alignment with Chandra. Given the translational shifts returned for each EPIC exposure, we estimate an additional positional uncertainty for N604-WRX of 21 in RA and 075 in Dec. for all EPIC exposures, which we take into account during source spectral extraction. Using the translational shifts from cross-correlation with Chandra we determine the position of N604-WRX in each EPIC exposure for use in source spectral extraction, as described below.
As for the Chandra observations, spectral extraction region sizes for N604-WRX in each EPIC exposure were chosen to encompass 95% of the PSF at energies of 1 keV, as determined using the SAS tasks psfgen and calview (Read et al., 2011) and the off-axis angle of N604-WRX in each exposure. In addition, we include the positional uncertainty due to alignment in the extraction region sizes. To characterize the sky and instrumental background we selected elliptical regions twice the size of the source extraction regions, which for PN were at similar RAWY positions and off-axis angles as N604-WRX, and for MOS were on the same CCD and at a similar off-axis angle as N604-WRX. For all exposures we ensured that the source and background regions were free of other point sources, both through by-eye verification and checks against other point source catalogs (Tüllmann et al., 2011; Williams et al., 2015).
We next extracted source and background spectra for N604-WRX using evselect with a spectral bin size of five for the PN, and 15 for MOS exposures. RMFs and ARFs were produced using the tasks rmfgen and arfgen. In Table 2 we list all exposures for which spectral products were extracted. Those exposures without off-axis angles or effective exposures listed are exposures in which N604-WRX was either off-field or on a chip gap.
After inspection of the reduced XMM-Newton imaging, we find that the point source N604-WRX is not distinguishable from the surrounding soft emission in NGC 604. This is likely due to the higher soft-sensitivity and lower angular resolution of XMM-Newton as compared to Chandra. Given our inability to resolve N604-WRX from the background in XMM-Newton, we use the archival XMM-Newton observations only to place upper limits on the flux of N604-WRX as described in Section 3.1.
2.3 HST Photometry
In addition to extracting all available X-ray observations of N604-WRX, we searched for the optical counterpart to the X-ray emission to identify the most likely primary star in the CWB. Given the crowded nature of the field, with 200 OB stars in the western region of NGC 604 alone (Hunter et al., 1996), the high angular resolution of Chandra and HST were necessary to identify possible optical counterparts to N604-WRX within the X-ray positional uncertainty. Below, we describe the HST observations used to make the initial identification of the candidate optical counterpart, or primary star, for N604-WRX.
The giant H II region NGC 604 was first imaged with HST using the Wide Field Planetary Camera 2 (WFPC2) in two filters (F555W and F814W), each with exposure times of 400 s (proposal ID 5237, field M33-FIELDN604). The data for this field were reduced as described in Garofali et al. (2018), using the pipelines developed as part of the ACS Nearby Treasury Program (ANGST; Dalcanton et al., 2009), and the Panchromatic Hubble Andromeda Treasury program (PHAT; Dalcanton et al., 2012). Photometry was measured using DOLPHOT and HSTPHOT (Dolphin, 2000), and completeness was estimated using artificial star tests as described in Williams et al. (2014) and Garofali et al. (2018). The 50% completeness limits in this field are = 24.33, and = 24.21, roughly the magnitude of a B star at the distance of M33.
The WFPC2 image was aligned to a common frame as the Chandra observations, again as described in detail in Garofali et al. (2018). With precise astrometric alignment between the HST and Chandra imaging, we are able to search for HST counterparts to N604-WRX within the Chandra positional uncertainty ( 07 post-alignment). We identified three possible counterparts in HST to N604-WRX; however, two of these were saturated in the archival HST WFPC2 imaging, and thus magnitudes were not recovered. The photometry and position are reported only for the faintest counterpart within the X-ray error circle of N604-WRX in Garofali et al. (2018).
The Local Group Galaxy Survey (LGGS; Massey et al., 2006) reports photometry for two sources within the X-ray positional uncertainty of N604-WRX: J013432.63+304704.5 with V magnitude = 17.39 and B-V=0.022, and J013432.64+304704.0 with V magnitude=17.19, and B-V=0.006. However, the LGGS photometry in the region is a blend of the three sources visible in the HST imaging, so these magnitudes are likely inflated relative to the intrinsic values for the three point sources.
| Identifier | RA | Dec | F275W | F336W | F475W | F814W | F160W |
|---|---|---|---|---|---|---|---|
| N604-WRXa | 1:34:32.595 | +30:47:04.604 | 17.83 | 18.32 | 19.88 | 20.00 | 20.01 |
| N604-WRXb | 1:34:32.617 | +30:47:03.592 | 15.82 | 16.26 | 17.82 | 18.01 | 18.23 |
| N604-WRXc | 1:34:32.615 | +30:47:04.178 | 16.16 | 16.55 | 17.89 | 17.81 | 17.56 |
To resolve the positions and magnitudes of all three possible counterparts within the X-ray error circle we therefore need refined HST imaging. To supplement the archival WFPC2 imaging, we made use of HST Advanced Camera for Surveys (ACS) imaging of the region from the forthcoming legacy survey of M33 (P.I. Dalcanton), which consists of imaging of 54 fields in M33 with the Wide Field Camera 3 (WFC3) in the UV (F275W, F336) and IR (F110W, F160W), and the Wide Field Camera (WFC) in the F475W and F814W filters. We align the ACS/WFC imaging to a common frame as the Chandra imaging, noting the same three stars from the archival WFPC2 imaging within the X-ray positional uncertainty of N604-WRX.
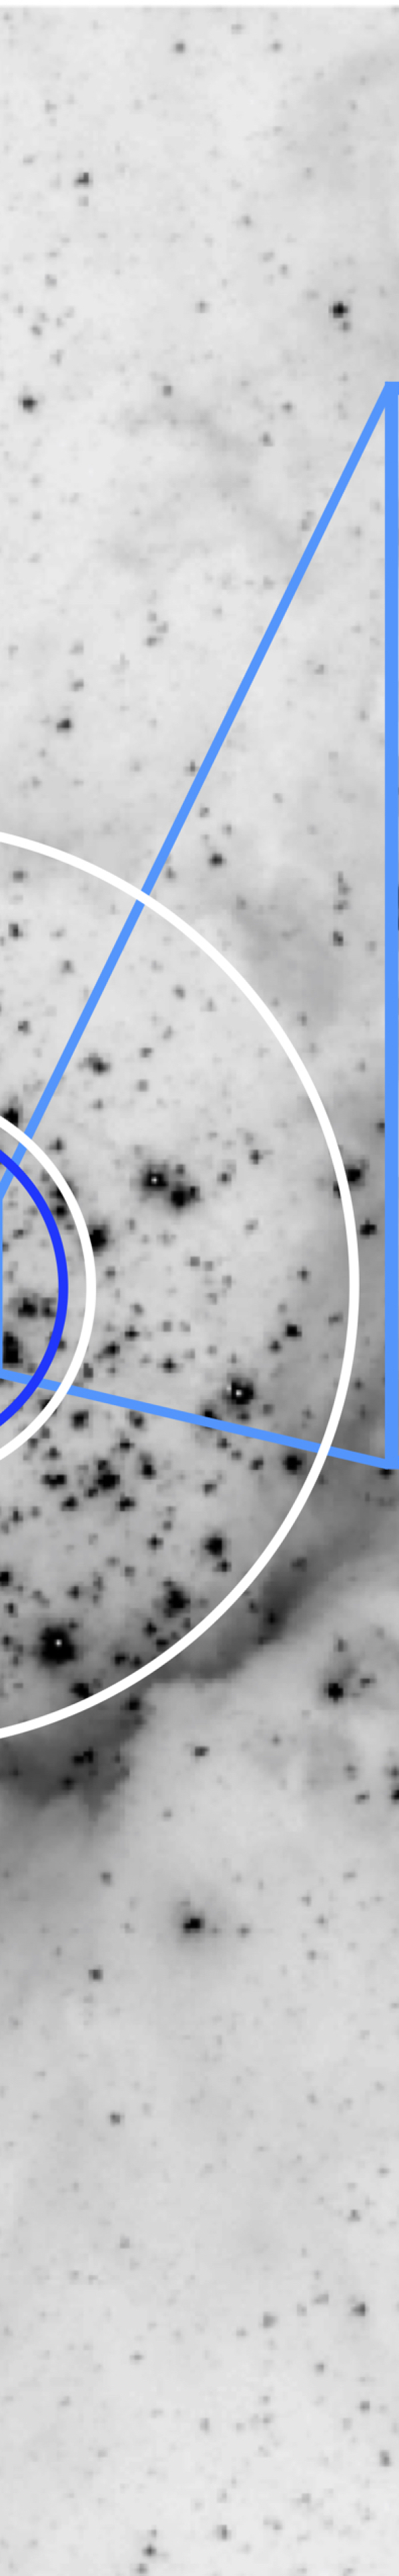
The three possible counterparts to N604-WRX and their five filter photometry determined from the forthcoming HST legacy survey or M33 are listed in Table 3. The stars are shown in an ACS/WFC F475W image of NGC 604 in Figure 2, with the Chandra positional error (magenta), Chandra source extraction region (blue), and Chandra background extraction annulus (white) overlaid. We use the positions recovered from HST listed in Table 3 for targeted spectroscopic follow-up to determine the most likely counterpart to N604-WRX, as described in the next section.
2.4 Gemini Spectroscopy
To determine the spectral type of the likely primary star in N604-WRX we obtained spectra of the two brightest stars within the X-ray error circle (targets N604-WRXb and N604-WRXc, Table 3) using the Gemini Multiple-Object Spectrograph on Gemini-North (GMOS-N) (Hook et al., 2004). Neither N604-WRXb, nor N604-WRXc have clear previous spectral classifications in the literature (see Section 3.3). Target N604-WRXa was excluded from the proposed observations given its fainter magnitude compared to N604-WRXb/c and due to its small angular separation from star N604-WRXc ( 05), which posed an observational challenge for GMOS-N even under the best seeing conditions.
To mitigate against crowding in NGC 604, both stars were observed using a blind-offset, with the slit placed at two different position angles on an offset bright star 165 NE of NGC 604. The first target (N604-WRXb) was observed in July 2018, and the second target (N604-WRXc) was observed in August 2018, both in queue mode and at a mean air mass of 1.1.
Spectra of both stars were taken using the 025330” slit with the B600 grating centered first at 5200 and then at 5250 to compensate for gaps in the detectors. The observations consisted of two exposures per target, each 370 s. The image quality for both observations was 20th percentile, corresponding to a FWHM of 05 for a point source in the R band observed at zenith444http://www.gemini.edu/sciops/telescopes-and-sites/observing-condition-constraints#ImageQuality. Standard baseline calibrations, including flat field images and CuAr lamp observations, were taken for flat fielding and wavelength calibrations, respectively. In addition, observations of the standard star Wolf 1346 were included for flux calibration.
We reduced all data using the gemini IRAF package555https://www.gemini.edu/node/11823. Bias and flat field images were created for each target using the tasks gbias and gsflat. The CuAr arc lamp observations and flux standard were reduced using the task gsreduce, with the wavelength correction applied to the CuAr lamp using gswavelength. The wavelength solution was applied to the flux standard and object using gstransform, with sky subtraction applied to the flux standard only using gsskysub. We did not perform automatic sky subtraction for either target due to issues with oversubtraction given the the confusing nebulosity from the surrounding H II region NGC 604. We performed additional sky subtraction for each target star by hand using the PyRAF task splot after the spectra were extracted. The spectra for both the standard and the target stars were extracted with gsextract, with background subtraction also performed using this task. We derived the sensitivity function from the one-dimensional flux standard spectrum using gsstandard and applied the function to both targets using gscalibrate. We combined the spectra from the two exposures of each target using the PyRAF task scombine and an average of the pixels.
The reduced spectra reveal strong, broad emission features in the spectrum of N604-WRXc, indicative of a WR star and therefore the most likely primary to N604-WRX. As N604-WRXc has no clear history of spectral classification in the literature prior to this work, we discuss our determination of spectral type for this star in Section 3.3.
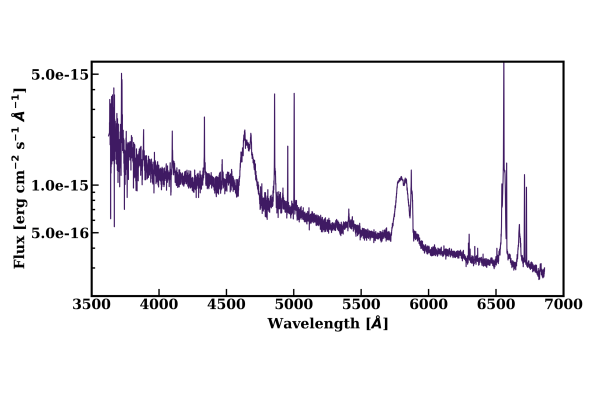
Given the abundance of massive stars the central cavity in NGC 604 where N604-WRX resides, we consider the probability that the newly identified WR star N604-WRXc is a chance coincidence with the X-ray error circle (r = 07) of N604-WRX. We estimate a radius of 7” for the central cavity of NGC 604 from the ACS/WFC F745W image from HST and find eight WR stars catalogued in the literature within this radius (Drissen et al., 2008; Neugent & Massey, 2011), yielding a chance coincidence probability of 8% for a WR star within the positional uncertainty of N604-WRX. If we consider the entirety of NGC 604 (r 25”) and its WR population (14 stars), we get a 1% chance coincidence probability of a WR star with the X-ray error circle of N604-WRX. This low probability of a chance coincidence coupled with the fact that CWBs with WR primaries are relatively prevalent in the Galaxy and MCs leads us to consider the newly identified WR star N604-WRXc as the most likely optical counterpart to N604-WRX, and therefore the most likely primary in the CWB. We show the extracted spectrum from GMOS-N for N604-WRXc in Figure 3, and discuss its spectral properties in more detail in Sections 3.3 and 4.3.
3 Results
In this section, we present the observational results supporting classification of N604-WRX as a CWB. In particular, we present our X-ray spectral modeling and the resultant X-ray luminosity and long-term X-ray light curve, as well as the classification of the likely primary star as a WC4 star.
3.1 X-ray Spectral Modeling
We use XSPEC v12.10.0c (Arnaud, 1996) with the Cash statistic (Cash, 1979) to simultaneously fit the ungrouped Chandra source and background spectra described in Section 2. We use the mcmc routine in XSPEC to estimate 90% confidence intervals on the best-fit model parameters. Because N604-WRX is embedded in NGC 604, itself a source of soft X-ray emission, the spectral fitting process, and in particular the treatment of the background, requires customization and care beyond a simple background subtraction. In this section we describe our custom treatment of the background and our best-fit source plus background model, along with the inferred parameters for N604-WRX from the best-fit model.
3.1.1 Background Model: NGC 604
Our background model is composed of two components: a sky and an instrumental component. The sky component is dominated by the soft emission from NGC 604, which we model following Tüllmann et al. (2008) as a two component thermal plasma (APEC; Smith et al., 2001) with photoelectric absorption (phabs(apec + apec)). We model the instrumental component as a power-law continuum coupled with Gaussian components to represent detector fluorescence lines. For the sky background, we fix = 1.1 1021 cm-2 for the absorption in NGC 604 (Lebouteiller et al., 2006) and scale the elemental abundances to Z = 0.65 (Vilchez et al., 1988; Magrini et al., 2007).
We fit the sky and detector background model to Chandra spectra extracted from annular regions surrounding N604-WRX as described in Section 2.1. We allow the temperatures and normalizations of each background APEC component to vary, as well as an overall multiplicative constant for both the sky and instrument background models, which are scaled for each observation by background size. We find best-fit temperatures and normalizations for the two-component APEC model that are consistent with the values from Tüllmann et al. (2008) for their regions “C1”, “B1”, and “B2”–the main cavity of NGC 604 roughly coincident with the region hosting N604-WRX. We fix the temperatures and normalizations of the background APEC components in our subsequent source plus background fits, allowing only the overall multiplicative constant to vary in order to characterize the background contribution to the source spectra.
3.1.2 Simultaneous Source and Background Fit: N604-WRX + NGC 604
We next perform a simultaneous fit to the source (N604-WRX) and background (NGC 604) spectra using a model for an absorbed diffuse plasma in collisional ionization equilibrium for the source (tbabs tbvarabs apec), and a fixed background component as described in the preceding section. The tbabs component in our source model accounts for Milky Way absorption, and the tbvarabs component accounts for the hydrogen absorption column intrinsic to NGC 604. The APEC (Smith et al., 2001) component of the source model represents the X-ray emission from shocked material in the wind collision region of N604-WRX.
| Obs. ID | Net Cts | (0.5–2.0 keV) | (0.5–8.0 keV) | (0.5–2.0 keV) |
|---|---|---|---|---|
| (10-14 erg s-1 cm-2) | (10-14 erg s-1 cm-2) | (1035 erg s-1) | ||
| 2023 | 31 | 0.15 (0.16) | 0.17 (0.18) | 1.20 (1.28) |
| 6378 | 68 | 0.40 (0.41) | 0.45 (0.46) | 3.19 (3.27) |
| 6388 | 58 | 0.65 (0.68) | 0.73 (0.76) | 5.19 (5.43) |
| 6379 | 23 | 0.21 (0.22) | 0.24 (0.25) | 1.68 (1.76) |
| 7402 | 27 | 0.35 (0.36) | 0.40 (0.41) | 2.80 (2.88) |
| 0650510101 (PN) | 511 | 0.40 (0.49) | 0.45 (0.52) | 3.19 (3.91) |
| 0672190301 (PN) | 440 | 0.22 (0.29) | 0.24 (0.30) | 1.76 (2.32) |
| 0800350301 (MOS2) | 42 | 0.40 (0.72) | 0.44 (0.74) | 3.19 (5.75) |
Although the integration time from Chandra is long ( 320 ks) N604-WRX still has relatively few counts across all five observations ( 200 counts), and we therefore cannot discriminate between more complex (i.e. two-temperature) models. Given the relatively low number of counts, we also fix the absorption in our model for both the line-of-sight absorption (tbabs) to = 5 1020 cm-2, and the intrinsic hydrogen column density (tbvarabs) to = 1 1021 cm-2 (Churchwell & Goss, 1999; Lebouteiller et al., 2006). For the intrinsic absorption component (tbvarabs) we fix the abundances of He, N, O, S, and Ne following Diaz et al. (1987), Vilchez et al. (1988), and Crockett et al. (2006), and scale all other abundances to 0.65 (Vilchez et al., 1988; Asplund et al., 2009).
The total model is thus comprised of fixed sky and detector background components, and a source component where the plasma temperature and normalization are allowed to vary. We also allow an overall multiplicative constant, scaled by extraction region size, to vary for the source, sky background, and detector background components.
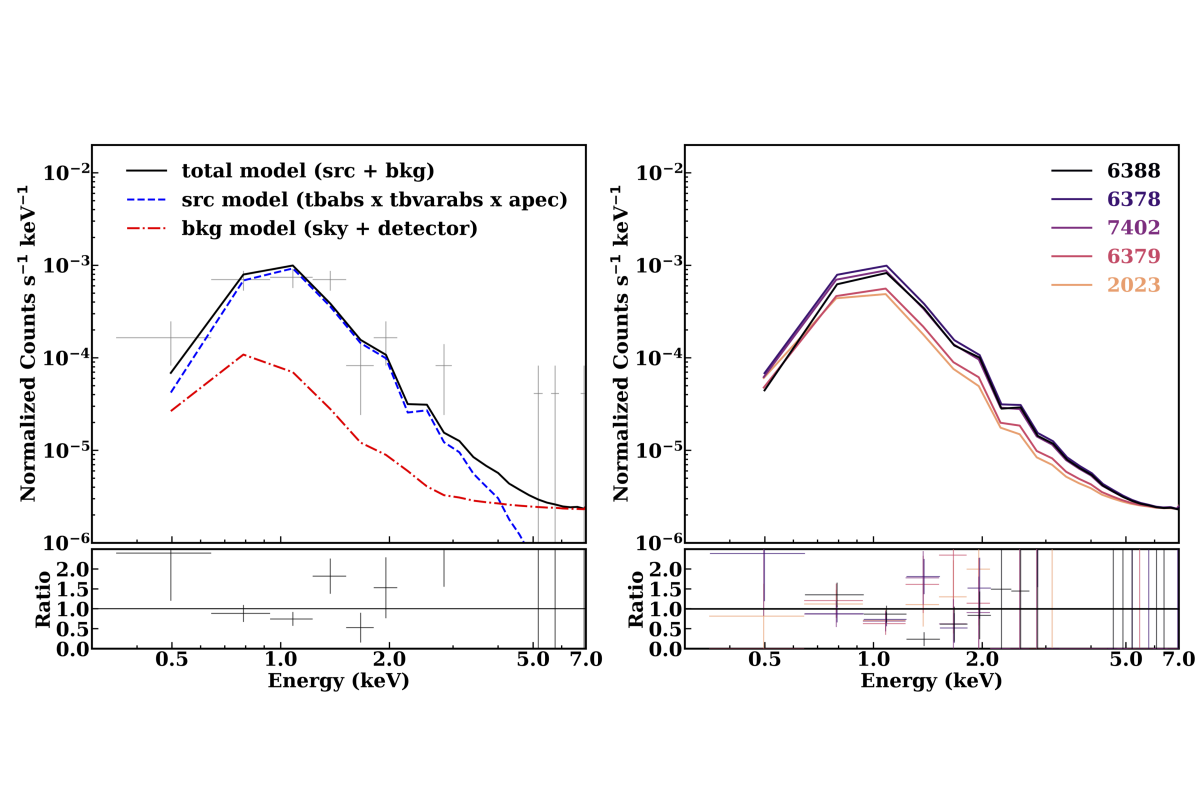
Our best-fit tbabs tbvarabs apec model returns kT = 0.98 keV, and K = 0.23 10-5 cm-5 with a null hypothesis probability of 0.49, where K is the normalization (10-14 / (4 d2) dV, with and as the electron and hydrogen number densities in cm-3). We show the best-fit model (black solid line) for N604-WRX from Chandra obs. ID 6378 in the left panel of Figure 4, with the source and background model components shown as the dashed blue and dash-dot red line, respectively. The right panel of Figure 4 shows the best-fit total model for N604-WRX for all Chandra obs. IDs. The spectra have been rebinned to a signal-to-noise of five in each bin for plotting purposes.
3.2 N604-WRX X-ray Luminosity and Light Curve
We use the best-fit spectral model from Section 3.1.2 to determine the flux of N604-WRX in each Chandra observation and the upper limits on the flux in the XMM-Newton exposures. From these fluxes, we construct a long-term light curve of N604-WRX to look for variability.
In Table 4 we list the absorbed and unabsorbed fluxes in the 0.5–2.0 keV and 0.5–8.0 keV bands for each Chandra observation and upper limits on the flux for the XMM-Newton exposure with the highest signal-to-noise in each observation derived from the best-fit source model. XMM-Newton values are upper limits on the flux as N604-WRX is not resolved from the soft emission of NGC 604 in these observations. We exclude XMM-Newton observation 0650510301 from table, as N604-WRX was 8 arcmin off-axis in that observation, leading to very low signal-to-noise and unreliable upper limits on the flux.
Fluxes and upper limits are derived from the best-fit source model using the flux command in XSPEC, with 90% confidence intervals determined from the XSPEC MCMC chains. We calculate luminosities from the model derived fluxes assuming a distance to M33 of 817 kpc (Freedman et al., 2001). We find a median unabsorbed flux across all Chandra observations of 3.6 10-15 erg s-1 cm-2 ( = 2.9 1035 erg s-1) for N604-WRX. We discuss the implications for N604-WRX as a CWB based on the magnitude of its X-ray flux in Section 4.2.
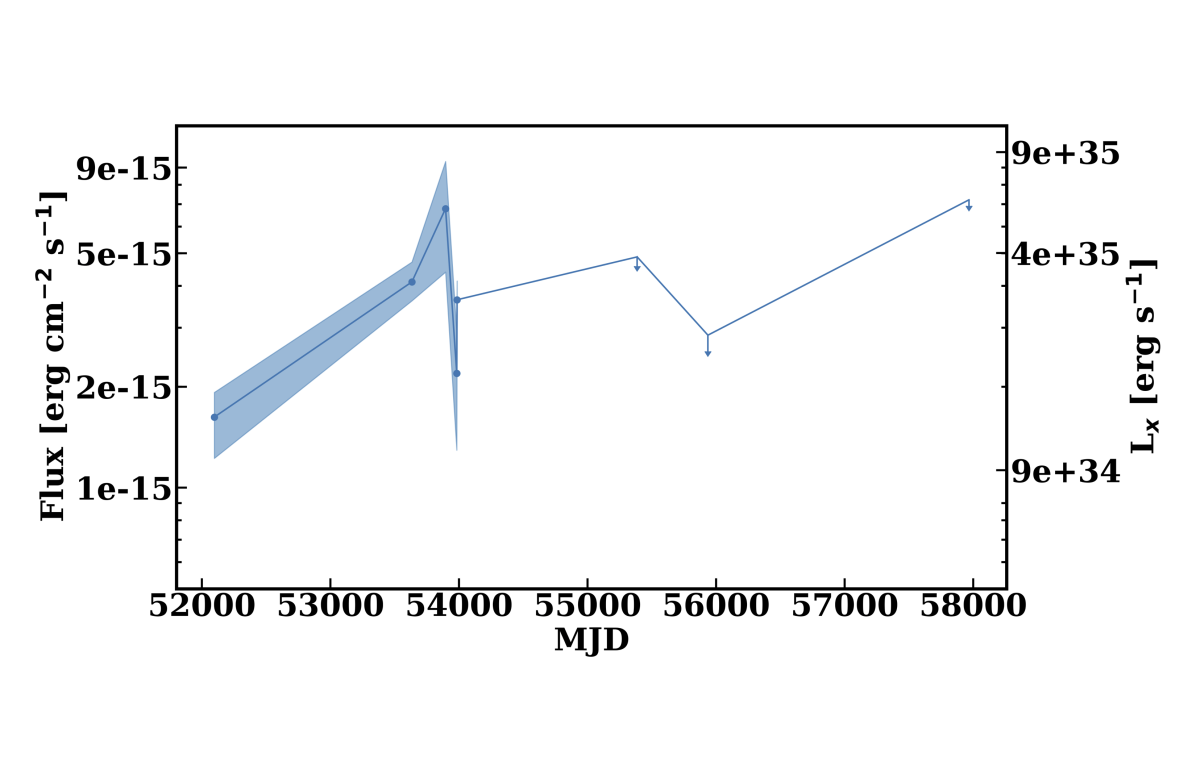
We construct a long-term light curve for N604-WRX, displayed in Figure 5, from the unabsorbed 0.5–2.0 keV fluxes from Table 4. The flux of N604-WRX varies by a factor of two to three between the Chandra observations. Given the low number of counts across all observations, we cannot reliably construct light curves in isolated energy bands, however we can look for evidence of any changes in the spectral hardness by computing the hardness ratio using counts in the soft (S; 0.5–2.0 keV) and hard (H; 2.0-8.0 keV) bands. We define the hardness ratio as , and compute this value and its associated 1 errors using the Bayesian Estimation of Hardness Ratios (BEHR; Park et al., 2006) for all Chandra observations. Within the 1 errors on the hardness ratios we find no evidence for significant changes in the hardness of N604-WRX between Chandra observations. Without an orbital solution for this system we cannot further investigate possible phase-dependence in the spectral hardness or likewise produce a phase-resolved light curve for N604-WRX. In Section 4.4 we discuss the variability and maximum X-ray luminosity reached by N604-WRX and their implications for an orbital period for N604-WRX.
3.3 Spectral Classification of the Candidate Primary Star
Numerous past works have studied in detail the massive star population in M33, and specifically in NGC 604, leading to a large number of classifications for WR and OB stars in the region (e.g., Conti & Massey, 1981; Massey & Conti, 1983; Hunter et al., 1996; Massey et al., 1996; Massey & Johnson, 1998; Bruhweiler et al., 2003; Massey et al., 2006; Drissen et al., 2008; Neugent & Massey, 2011; Fariña et al., 2012). Below, we summarize sources in the literature that appear coincident with the position of N604-WRX, and then present our newly determined WC4 spectral classification for the likely primary star of N604-WRX.
The first identification of a WR star coincident with the position of N604-WRX comes from Drissen et al. (2008). Based on their finder chart for NGC 604 (Figure 3, Drissen et al., 2008), their star N604-WR3 appears to be coincident with the location of N604-WRX, and specifically N604-WRXc, the likely primary of N604-WRX. Unfortunately, tracing previous classifications in the literature from this identification is fraught due to issues with crowding. For example, Drissen et al. (2008) note possible previous classifications for N604-WR3 as WR star CM 12 (Conti & Massey, 1981, spectral type WNL) and WR 136 (Massey & Johnson, 1998, spectral type WNL). However, Drissen et al. (2008) also list their star N604-WR4 as the possible counterpart to CM 12/WR 136 (also listed as MC 75 (Massey & Conti, 1983) and UIT 364 (Massey et al., 1996)). We consider N604-WR4 as the more likely counterpart to these WR identifications in the literature based on our own visual inspection of the WR star positions, absolute magnitudes, and spectral classifications in NGC 604 from previous catalogs, as N604-WR4/CM 12/WR 136 are all consistent with a nitrogen-rich WR star that is brighter than, and to the north of N604-WRX and N604-WR3.
Therefore, the only previous literature identification of a WR star coincident with the position of N604-WRX is N604-WR3 (Drissen et al., 2008, spectral class WN). Two sources from the LGGS (Massey et al., 2006, 2016) also appear coincident with the position of N604-WRX, namely LGGS sources J013432.64+304704.0 (coincident with our Gemini target N604-WRXb), and J013432.63+304704.5 (coincident N604-WRXc, the most likely primary). However, neither LGGS target has a spectral classification from Massey et al. (2006), and although Drissen et al. (2008) provide a WN classification for N604-WR3, they do not provide published spectroscopic confirmation. Given the lack of spectral data in the literature for the stars coincident with the position of N604-WRX, we turn to our GMOS-N spectra as the primary means of classifying the likely primary of N604-WRX.
In Section 2.4, we determined GMOS-N target N604-WRXc to be the most likely primary for N604-WRX given the presence of strong, broad emission lines in the spectrum, indicative of the strong, fast winds of a WR star. The spectrum of the likely primary (Figure 3) displays clear C IV 5801-12 emission, and C III-IV 4650/He II 4686 emission complex, signifying a WC star. In particular, the presence of strong C IV 5808, and the absence of C III 5696 in the spectrum signify that the likely primary to N604-WRX is a WC4 star (Torres et al., 1986; Crowther et al., 1998).
Puzzlingly, the strong C IV 5808 and lack of distinguishing nitrogen features in the GMOS-N spectrum are at odds with the WN spectral classification listed in Drissen et al. (2008) for their star N604-WR3 that appears coincident with our GMOS-N target N604-WRXc. Given the unambiguous presence of C IV 5808 in our GMOS-N spectrum, which is at odds with the WN designation from Drissen et al. (2008), it seems unlikely that our targets are the same source, despite apparent positional overlap. This may not be altogether surprising given that this area of NGC 604 suffers from issues with crowding, and while our GMOS-N spectra were taken with a 025 slit to avoid contamination from neighboring sources, the Drissen et al. (2008) spectral identifications were made with a 15 slit.
Our WC4 spectral classification for N604-WRXc is corroborated by Hectospec data from 2007 taken at the location of N604-WRX as part of spectroscopic follow-up for the ChASeM33 survey (Tüllmann et al., 2011). In particular, the Hectospec spectra, which were taken with the Hectospec fiber positioned to be coincident with the Chandra position for N604-WRX from ChASeM33, show the same broad carbon emission features as our GMOS-N spectrum (Pete Challis, private comm.). Based on this analysis, we therefore determine that the primary to N604-WRX is a WC4 star newly identified in this work.
We attempt to model the spectrum of the WC4 primary using the CoMoving Frame GENeral (CMFGEN) stellar atmosphere and radiative transfer code (Hillier & Miller, 1998). We use the LMC star BAT99-11 as a starting template for our model, as it is WC4 star in a sub-solar metallicity environment similar to NGC 604 (Vilchez et al., 1988; Magrini et al., 2007). We find that we cannot simultaneously reproduce the luminosity of the observed WC4 primary star along with the emission line ratios and strengths using a standard WC4-like template. In particular, the observed WC4 primary is more luminous than a standard WC4 star, but the strengths of the emission lines in the observed spectrum are lower than would be expected if a single WC4 star such as BAT99-11 were simply scaled up in luminosity. Furthermore, scaling a standard WC4 spectral template to the luminosity of the observed WC4 primary is incapable of reproducing the emission line ratios in the observed spectrum. Given that a spectral model for a single WC4 star is a poor fit to the spectrum of the observed primary we consider it likely that another component is necessary to describe the spectrum. We discuss these properties of the WC4 primary and their implications for N604-WRX as a CWB in more detail in Section 4.3.
4 Discussion
In this section we discuss the evidence that N604-WRX is a CWB, namely the soft X-ray spectrum coupled with the strength of the X-ray luminosity, and the WC4 primary star spectrum, which is not well described as a single WC4 star. We further compare N604-WRX to other nearby, bright CWBs to place constraints the orbital period from the strength of its X-ray luminosity and light curve.
4.1 A Soft X-ray Source with a Wolf-Rayet Optical Counterpart
The X-ray spectrum of N604-WRX coupled with the presence of a likely WR counterpart places important constraints on the origin of the X-ray emission. In particular, these properties are strongly indicative of a CWB origin, but inconsistent with N604-WRX as a high-mass X-ray binary (HMXB) or supernova remnant (SNR).
The spectrum of N604-WRX is best described as a soft ( 1 keV) thermal plasma. This spectral shape is much softer than the harder disk blackbody or power law spectral shape associated with HMXBs (Done et al., 2007). In fact, N604-WRX has very few counts at energies 2 keV in these obesrvations, which is inconsistent even with XRBs observed in the soft state (Done et al., 2007). On the other hand, the soft spectrum of N604-WRX is entirely consistent with observations of other extragalactic CWBs (e.g., Guerrero & Chu, 2008), and the 1 keV temperature is consistent with theoretical predictions for plasma temperatures in the wind collision region of CWBs (Prilutskii & Usov, 1976; Cherepashchuk, 1976).
Beyond spectral shape, further inconsistencies with an HMXB classification arise when we consider the X-ray luminosity of N604-WRX, and that the likely optical counterpart is a WR star. Of the handful of HMXBs known to host WR star donors (WR-XRBs), all systems have high X-ray luminosities ( 1038 erg s-1), short orbital periods ( days), and are observed to be time variable in X-rays (van Kerkwijk et al., 1996; Prestwich et al., 2007; Silverman & Filippenko, 2008; Crowther et al., 2010; Liu et al., 2013; Maccarone et al., 2014; van den Heuvel, 2019). The high X-ray luminosities achieved in WR-XRBs are assumed to be the result of accretion of strong, fast WR winds onto a BH (van den Heuvel et al., 2017). By contrast, the median X-ray luminosity of N604-WRX from our best-fit spectral model is 1035 erg s-1, nearly three orders of magnitude below what is expected if the X-ray luminosity is powered by accretion of WR star winds onto a 10 BH (see White & Long, 1986).
Accretion of WR winds onto a NS could produce X-ray luminosities in the range observed for N604-WRX, albeit with harder spectra, and dependent on the binary separation (see White & Long, 1986). However, models of binary evolution suggest that WR-XRBs with NS compact objects rarely, if ever, survive as their high mass ratios result in coalescence during common envelope evolution (van den Heuvel et al., 2017). We therefore find it highly unlikely that N604-WRX is an HMXB, and specifically a WR-XRB, given its soft spectrum and WR counterpart.
The soft spectrum and association with a very young stellar population do not immediately preclude classification as an SNR, as SNRs are soft X-ray sources and, if they have core-collapse progenitors, are often found in the vicinity of massive stars (e.g., Jennings et al., 2014). However, past SNR surveys in M33 and studies of the cluster environment where N604-WRX is located indicate that it is unlikely to be an SNR.
To begin with, N604-WRX does not appear in the SNR catalogs of Long et al. (2010), Lee & Lee (2014), or Garofali et al. (2017), indicating that it was not classified as an SNR on the basis of its narrow-band optical emission or X-ray hardness ratios. Furthermore, the stellar cluster in the western portion of NGC 604, of which N604-WRX is a member, has an extremely young inferred age of 3 Myr based on its substantial WR star population (Hunter et al., 1996; Bruhweiler et al., 2003; Maíz-Apellániz et al., 2004). Models suggest that energy input from supernovae would not make a substantial contribution 3 Myr post-starburst (e.g., Leitherer et al., 1992), and thus we expect few, if any, core-collapse supernovae to have gone off in this particular region since the initial starburst 3 Myr ago. Finally, previous studies of wind-blown bubbles in the western portion of NGC 604, where N604-WRX is located, find that the observed X-ray emission does not require any extra heating from supernovae or SNRs (e.g., Yang et al., 1996; Tüllmann et al., 2008), and is in fact consistent with the X-ray luminosity expected from a wind-blown cavity emanating from extensive mass loss from the numerous OB and WR stars in the region (e.g., Hunter et al., 1996; Bruhweiler et al., 2003; Drissen et al., 2008).
We therefore find the observed X-ray properties of N604-WRX to be inconsistent with classification as more commonly observed extragalactic X-ray sources, namely HMXBs or SNRs, and instead find the spectrum and X-ray luminosity of N604-WRX to be most consistent with a CWB.
4.2 X-ray Luminosity: Brighter than a Single Wolf-Rayet Star or Cluster
The X-ray luminosity inferred from our best-fit spectral model ( 1035 erg s-1) likewise places constraints on the nature of N604-WRX. As discussed in the previous section, this luminosity is much fainter than the luminosities observed for WR-XRBs. However, single massive stars also exhibit low luminosity, soft X-ray emission, so the possibility remains that N604-WRX is a single X-ray emitting massive star or an unresolved collection of X-ray emitting stars in a cluster. We discuss and dispel both possibilities below in favor of N604-WRX as a CWB.
Theoretical predictions and empirical measurements of the X-ray emission emanating from embedded shocks in the winds of massive stars predict X-ray luminosities of 1033 erg s-1 (e.g., Harnden et al., 1979; Cassinelli et al., 1981; Chlebowski et al., 1989). This value is well below the limiting luminosity of recent deep X-ray surveys of M33 (Tüllmann et al., 2011; Williams et al., 2015), which alone makes detection of single X-ray emitting OB or WR stars in M33 unlikely unless such stars in M33 exceed theoretical luminosity predictions and empirical luminosity constraints by more than an order of magnitude. Considering that binaries, and CWBs in particular, are observed to be on average more X-ray luminous than single OB or WR stars (e.g., Pollock, 1987; Chlebowski et al., 1989), the detection of N604-WRX in M33 is more plausibly explained by a binary origin, rather than a single WR star.
To determine whether it is possible that N604-WRX is simply an X-ray emitting massive binary, as opposed to a CWB with a bright wind collision region, we turn to the canonical empirical / 10-7 scaling relation for X-ray emitting massive stars (Long & White, 1980; Cassinelli et al., 1981; Seward & Chlebowski, 1982; Sciortino et al., 1990; Chlebowski & Garmany, 1991; Berghoefer et al., 1997; Sana et al., 2006; Nazé et al., 2011). Conformity to this empirical relation signifies that the dominant source of X-ray emission is shocks embedded in the winds of massive stars, and it is applicable to both single and binary massive stars. The only exceptions to the relation are X-ray bright CWBs, where the dominant source of X-ray emission is the macroscopic wind collision region, as opposed to the embedded shocks in the winds of the massive star components (e.g., Rauw et al., 2002).
To test where N604-WRX lies relative to the / relation we take = -7.0 for the system (see discussion in Section 4.3) and, after applying a bolometric correction appropriate for a WC4 star (Nugis & Lamers, 2000), derive = -12.58. From this rough estimate of the bolometric magnitude we derive 3 1040 erg s-1, which corresponds to an / 1 10-5, using the median unabsorbed X-ray flux in the 0.5–8.0 keV band from Table 4. This value is about two dex greater than the canonical / relation which has a dispersion of 0.21 dex (Nazé et al., 2011), indicating that the X-ray emission from N604-WRX more likely originates from a bright wind collision region rather than shocks in the winds of a massive star or stars.
Finally, we wish to test whether the X-ray luminosity of N604-WRX can instead be explained as a collection of unresolved X-ray emitting massive stars in a cluster. To test for this possibility we first tabulated the number of OB and WR stars in the source extraction region (dark blue region, Figure 1). We selected known WR stars from the catalogs of Drissen et al. (2008) and Neugent & Massey (2011), accounting for duplicates, and included our newly characterized WC4 star, though under the assumption it is not a CWB. We counted OB stars in the region from the catalogs of Hunter et al. (1996) and Massey et al. (2016), again accounting for duplicates. We included all spectroscopic identifications from Massey et al. (2016) within our extraction region, and, following Hunter et al. (1996), all stars in their catalog with F555W-F814W colors 0.3, and -4 (assuming E(B-V) = 0.08), corresponding roughly to stars of spectral type O9.5 V and earlier. Finally, we cross matched these OB identifications from Hunter et al. (1996) and Massey et al. (2016) with massive stars from the HST photometry reduced in Garofali et al. (2018) to again check for duplicates and look for any stars previously missed due to crowding. In total, we identify 4 WR stars and 18 OB stars in the Chandra source extraction region.
We used the published magnitudes and colors for all 22 stars to estimate order-of-magnitude luminosities using the PARSEC-COLIBRI stellar isochrones (Marigo et al., 2017). We compared the stars’ magnitudes and colors to 3 Myr isochrones (roughly the age of the cluster in NCG 604, Hunter et al., 1996; González Delgado & Pérez, 2000; Maíz-Apellániz et al., 2004; Eldridge & Relaño, 2011) at Z = 0.65 (Vilchez et al., 1988; Magrini et al., 2007), assuming a Kroupa initial mass function and reddening appropriate to the region (e.g., Massey et al., 1995). In this way, we derived approximate bolometric luminosities for each star in the extraction region which we then converted to X-ray luminosities assuming 10, which is appropriate for both single X-ray emitting massive stars and binaries where the wind collision region does not dominate the X-ray luminosity (e.g., Berghoefer et al., 1997; Nazé et al., 2011).
We next created simulated event lists for each star in the region assuming a point source, and using MARX (Günther et al., 2017) with the following inputs: the photon fluxes inferred from our measurements (assuming D = 817 kpc (Freedman et al., 2001)), the known positions of the stars from HST, and a simple tbabs apec spectral model with = 1.1 1021 cm-2 (Lebouteiller et al., 2006), kT= 1 keV, and Z = 0.65 (Vilchez et al., 1988; Magrini et al., 2007) produced using Sherpa (Freeman et al., 2001). Additionally, we used MARX to create an event list representative of the diffuse background emission in the western portion of NGC 604 using the spectral model and associated flux taken from Tüllmann et al. (2008) for their region “B1”.
For each star, as well as for the background, we set the exposure time to zero, and “NumRays” to the number of counts we wished to detect. The desired background count level was taken from Tüllmann et al. (2008) again for their region “B1”, and we set each of the 22 stars to detect four photons each, amounting to a total of 90 counts for all sources, similar to the total number of counts detected for N604-WRX in a single deep Chandra exposure. We merged the individual event lists for each star together with the diffuse background event list using dmmerge and additionally imposed a 2 2 binning to create a final simulated image that we could compare to our Chandra observations of N604-WRX.
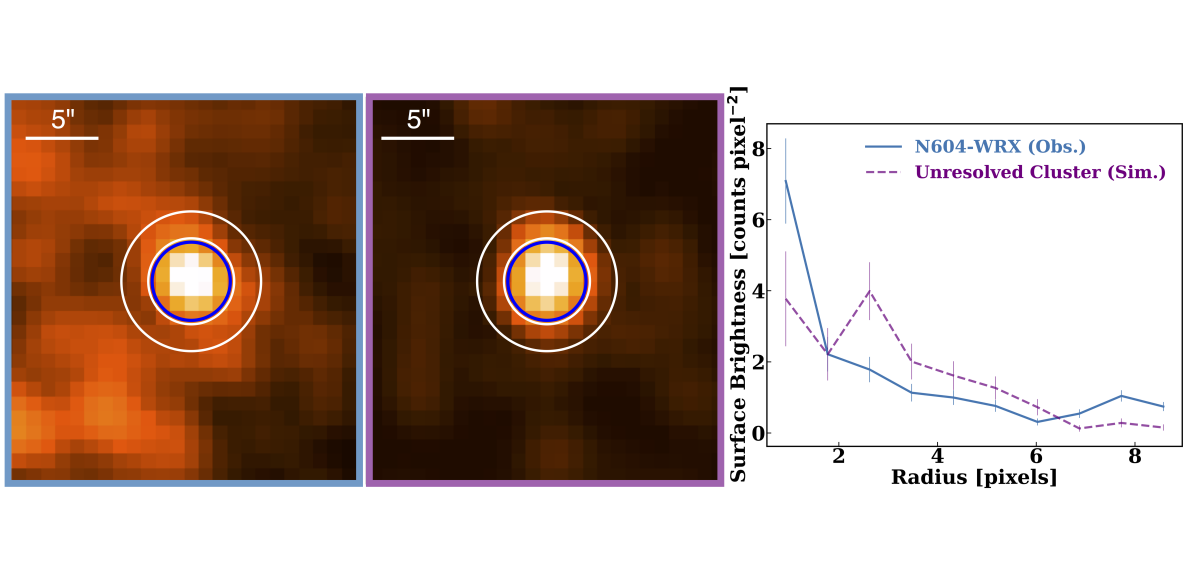
In the center panel of Figure 6 we display a simulated image of the X-ray emission from an unresolved cluster of massive stars within the source extraction region (blue) at the location of N604-WRX, while in the left panel we show a 0.2-8.0 keV mosaic of the Chandra observations of N604-WRX. The right panel of Figure 6 shows the radial surface brightness profiles for both N604-WRX (solid blue line), and the simulated unresolved cluster (dashed purple line).
While both images contain of order the same number of counts within the source extraction region (blue circle), the Chandra mosaic represents 300 ks of observation time while the simulated image from MARX requires 100 Ms to achieve even a modest number of counts in the source extraction region. This extremely long integration time is due to the faint X-ray luminosities of the individual massive stars in the region which, based on their inferred bolometric luminosities, all have 1031–1032 erg s-1. Furthermore, as shown in the right pane of Figure 6, the simulated unresolved cluster is a slightly extended source of X-ray emission, while N604-WRX is a point source. Given the slightly extended nature of the emission from this simulated ensemble of massive stars and the extremely long integration time necessary to obtain such an image we rule out the possibility that the X-ray emission from N604-WRX emanates from an unresolved cluster of massive stars.
4.3 Evidence for a Companion from the Primary Star Spectrum
The WC4 spectral type of the likely primary coupled with its exceptional brightness in the optical and X-rays provide further evidence that N604-WRX is a CWB. Single WC stars are observed to be extremely faint sources in X-rays ( 1030 erg s-1), owing to the high opacity of their metal-rich winds (Oskinova et al., 2003; Rauw et al., 2015). Thus the WC4 star observed to be coincident with relatively high X-ray luminosity makes it extremely unlikely that the X-ray emission observed from N604-WRX can be ascribed to a single star.
Just as the high X-ray luminosity indicates a likely CWB, the magnitude of the WC4 counterpart is also indicative of binarity. The WC4 star has = 17.89 from the HST photometry, which corresponds to 18 as determined from the GMOS-N spectrum and pysynphot. Assuming a modest reddening of E(B-V) = 0.13 (Massey et al., 1995; Hunter et al., 1996) and a distance modulus of 24.6 this corresponds to -7.0 for the WC4 primary. For comparison, WC stars in M33 typically have = -3.0 – -5.5 (e.g., Massey & Conti, 1983), while Galactic WC4 stars are observed to have average = -3.3 (n.b., narrow band ; Sander et al., 2012). Thus, assuming even a moderate reddening, the likely primary to N604-WRX is 4 as bright as the brightest WC stars in M33, and 30 as bright as stars of the same spectral type in the Milky Way.
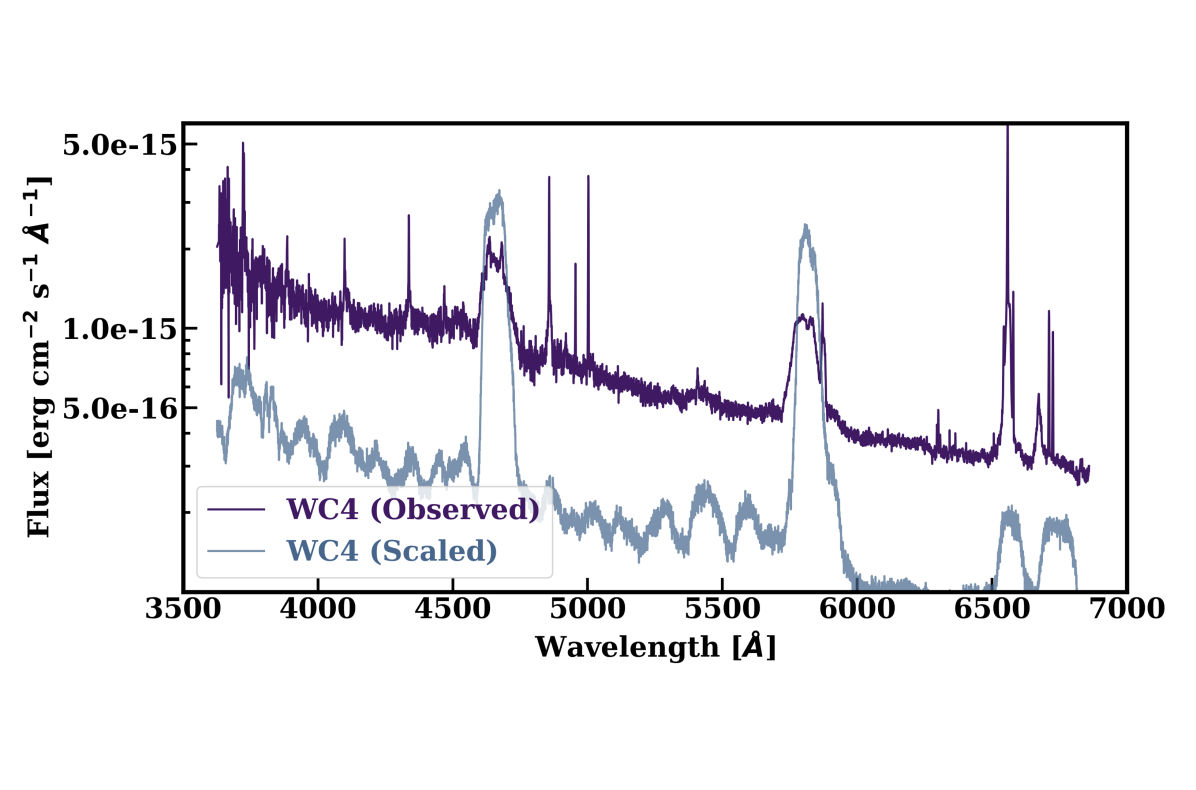
The incredible brightness of the likely primary compared to stars of the same spectral type cannot be explained simply as a scaled up version of a WC4 star. In Figure 7 we show the observed WC4 star spectrum from GMOS-N, as well as the spectrum of the LMC WC4 star BAT99-11 (Brey 10, HD 32402; Neugent et al., 2018) scaled to the apparent magnitude of the observed WC4 primary. Figure 7 demonstrates that this simple approximation of a scaled-up WC star is not a good description of the observed WC4 primary in N604-WRX, as not only are the line strengths and relative line ratios incorrect, but the simulated continuum is also inconsistent with the observed WC4 star.
The remarkably high of the observed WC4 star relative to its spectral type may instead be explained by the presence of a companion. For example, if the companion is a late O supergiant with an absolute magnitude of -6.5 – -7.0 (e.g., Massey, 1998) the observed apparent magnitude of the WC4 star as well as the relative weakness of its carbon emission features could be consistently explained. While a WC4 + O binary configuration would be entirely consistent with N604-WRX as a CWB, we see no clear evidence of an O companion (e.g., absorption lines) in the observed WC4 spectrum.
To test whether we should expect to detect signatures of an O supergiant companion in the WC4 spectrum we create a composite WC + O spectrum in pysynphot using scaled LMC spectra from an O7.5Iaf (LMC173-2, Massey et al., 2014) and WC4 star (BAT99-11, Neugent et al., 2018). We scale the WC + O composite to match the apparent magnitude of the observed WC4 star, assuming the WC component contributes 40% to the total luminosity. We then rebin the composite spectrum to GMOS-N resolution, and add noise consistent with the observed spectrum.
The simulated WC + O composite spectrum is displayed in green in Figure 8, and, notably, the absorption lines from the O supergiant component are largely erased with a realistic signal-to-noise and spectral resolution applied. Those absorption lines which are still visible in the composite are unfortunately coincident with strong nebular lines from NGC 604 in the observed spectrum.
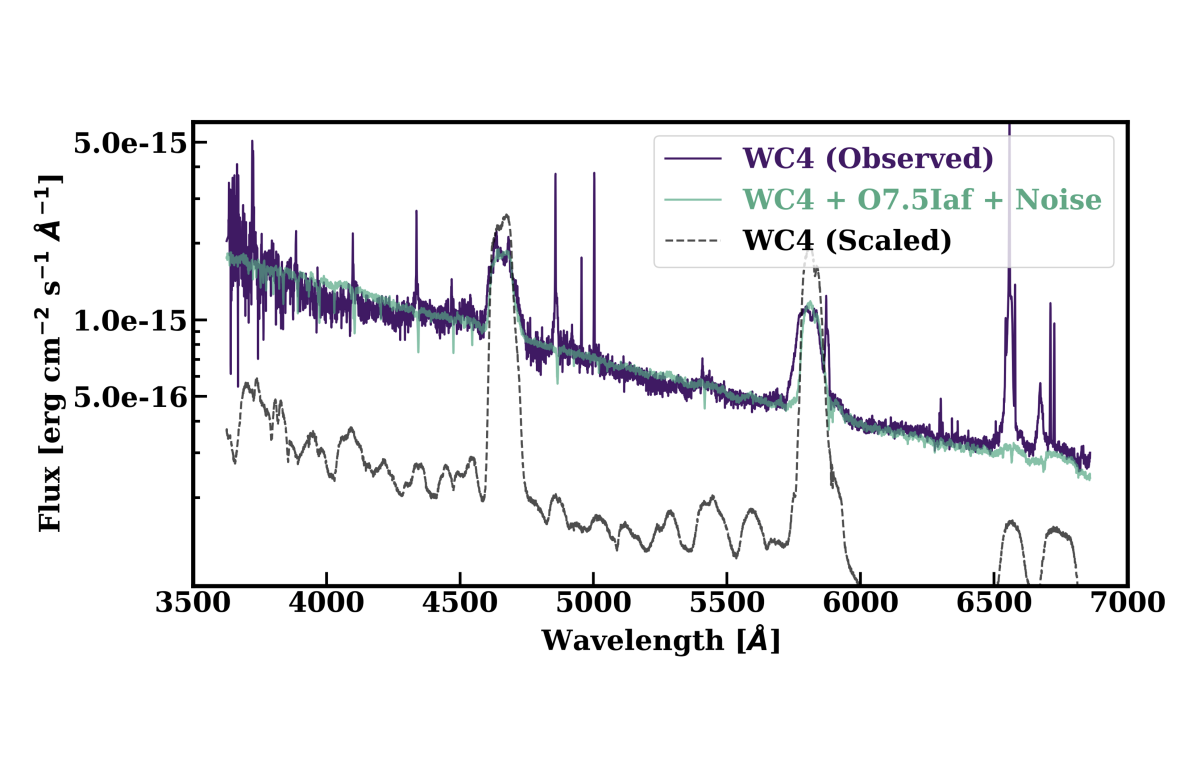
Importantly, the simulated WC + O spectrum shown in green in Figure 8 is able to match the continuum of the observed spectrum (purple) while preserving the relative strengths of the carbon emission features. This consistency between the observed spectrum and simulated composite indicates that, despite the lack of absorption line features in the GMOS-N spectrum, the observed WC4 spectrum is compatible with the presence of an O supergiant companion which contributes substantial flux. We discuss the prospects for follow-up observations to definitively determine the presence of a companion in the conclusions.
4.4 Comparison to Bright Colliding-Wind Binaries
One of the most remarkable aspects of N604-WRX remains its high X-ray luminosity at maximum, which appears to exceed even that of the brightest CWBs in the Galaxy and MCs. In this section we discuss the X-ray luminosity and X-ray light curve of N604-WRX compared to other bright CWBs in order to place some constraints on the binary parameters giving rise to such an extreme X-ray luminosity.
The unabsorbed X-ray luminosity of N604-WRX at maximum in the observed light curve is 5.4 1035 erg s-1, a value which exceeds even the brightest CWBs in the LMC and Galaxy at their maxima: Mk 34 with = 3.2 1035 erg s-1 in the LMC (Pollock et al., 2018), and Carinae with = 2.4 1035 erg s-1 in the Galaxy (Corcoran et al., 2017). Both of these well-studied CWBs are known to be quite massive, with recent spectroscopic measurements of Mk 34 indicating M 100 for each WN component of the binary (Tehrani et al., 2019), and a combined mass of 100 for Car (Hillier et al., 2001).
In terms of well-studied, bright CWBs with WC primaries there is WR 140, a WC7 + O4.5 system with an orbital period of 2900 days which reaches = 4 1034 erg s-1 (Marchenko et al., 2003; Pollock et al., 2005; Sugawara et al., 2015), and Wr48a, a WC8 + WN8h binary with a 30 year period, which reaches as high as = 3 1035 erg s-1 (Zhekov et al., 2011, 2014; Williams et al., 2012).
The common thread for these remarkably bright CWBs is, not surprisingly, very massive components with exceedingly strong winds. However, it does not appear that the spectral type of the primary uniquely determines which systems reach the highest X-ray luminosities, and the spectral type of the secondary is too often ill-constrained to make inferences as to its relative importance. Rather, it is likely a combination of the relative wind momenta of the binary components, as well as the orbital configuration (period, eccentricity, and viewer orientation) that set the observed X-ray luminosity.
Of the systems discussed here, namely Mk 34, Car, WR 140, and WR48a, all are measured or presumed to have eccentric orbits and all are generally long period systems, with Mk 34 having the shortest orbital period at 155 days (Pollock et al., 2018), and all other systems having orbital periods 5 years (Marchenko et al., 2003; Williams et al., 2012; Corcoran et al., 2017). It therefore seems likely that N604-WRX, given its high X-ray luminosity, is likewise a long period system perhaps also with an eccentric orbit.
Long period CWBs with eccentric orbits are more likely to approach the adiabatic limit in the wind collision region (Pittard & Stevens, 2002), and in this case the star with the higher wind momentum (i.e., stronger wind) will largely set the X-ray luminosity. In such long period systems the wind components are also able to reach terminal velocity in the wind collision region, so variations in the X-ray luminosity will come about due to the changing separation of the stars and, theoretically, should scale as 1/, where is the separation between the stars (e.g., Güdel & Nazé, 2009).
In theory, the 1/ scaling for long period systems means their light curves can be described by this relation, with the X-ray luminosity reaching maximum at periastron. However, this is not always observed to be exactly the case. For example, WR 140 rises in flux as the system approaches periastron, but drops to a minimum just before conjunction, when the O star passes behind the more opaque winds of the WC7 primary (Corcoran et al., 2011). Deviations from the theoretical 1/ light curve behavior for long period systems are thus indicative of the effects of changing line-of-sight absorption, or possibly the wind collision region becoming radiative at periastron.
As we do not yet have a full orbital solution for N604-WRX we can only speculate regarding periodicity in the light curve shown in Figure 5. However, if we assume N604-WRX is a long period, eccentric CWB in the adiabatic limit like other bright CWBs then the light curve maximum in Figure 5 may represent an orbital phase close to periastron, with the rapid decrease shortly thereafter representing a phase close to conjunction. If we assume the most recent flux upper limit measurement from XMM-Newton also represents a phase close to maximum, then N604-WRX would have a period 4000 days, or 11 years. As the upper limits from XMM-Newton are derived from unresolved observations of N604-WRX with high background, we caution that deriving a period from these values is very speculative. More time-resolved observations will be necessary to determine where true minimum in the light curve lies, and thus derive an orbital solution.
The lack of obvious periodicity in the light curve for N604-WRX is not unexpected given our limited observations. Although some nearby CWBs have shown evidence for periodicity in their X-ray light curves (e.g., Lomax et al., 2015; Pollock et al., 2018), more often CWBs exhibit phase-dependent variability in X-rays (e.g., Pollock & Corcoran, 2006; Gosset et al., 2009), with binary orbital periods later verified via spectroscopic follow-up (e.g., Rauw et al., 2004; Bonanos et al., 2004; Gamen et al., 2006; Tehrani et al., 2019). For CWBs with WC primaries in particular, orbital periods may be determined via IR observations if there is episodic dust formation near periastron (e.g., Williams et al., 2012). Clearly, multi-wavelength follow-up of N604-WRX is necessary to further characterize the orbital configuration of this remarkable system.
5 Summary & Conclusions
We present the identification N604-WRX, the first candidate CWB in M33, and the first such system observed beyond the MCs. The candidate CWB is a soft ( 1 keV) source embedded in a very young cluster in the giant H II region NGC 604. Based on spectral modeling of N604-WRX we derive a median unabsorbed luminosity of (0.5–2.0 keV) = 2.9 1035 erg s-1, making this candidate CWB as bright as the most luminous known CWBs in the Galaxy and MCs, including Car and Mk 34. From our spectral models and all available archival Chandra and XMM-Newton observations we derive an X-ray light curve, demonstrating that N604-WRX varies by a factor of a few between observations, and reaches an unabsorbed luminosity of (0.5–2.0 keV) = 5.4 1035 erg s-1 at maximum.
We identify a WR star coincident with the X-ray emission from N604-WRX, and consider this star to be the likely primary in the CWB. Using GMOS-N we are able to characterize the likely primary, for the first time, as a WC4 star whose high luminosity signifies the likely presence of a companion star, possibly a late O supergiant. Thus, we find N604-WRX to best be described as a WC4 + (O) CWB system.
Given the distance to N604-WRX in M33 long integration times ( 100s ks) are needed with current X-ray facilities to achieve even a modest increase in the number of detected counts for N604-WRX over currently available observations in the Chandra and XMM-Newton archives. Next generation X-ray facilities will therefore be of great importance to further identification and characterization of even the brightest extragalactic CWBs.
The status of N604-WRX as a CWB can be verified via multiwavelength follow-up. In particular, follow-up spectroscopy of the likely WC4 primary with higher signal-to-noise will be necessary to look for signatures of a companion in the spectrum, and further provide a spectral classification for the secondary. Given the crowded field in NGC 604 HST may be necessary for such follow-up characterization to avoid contamination from nearby stars.
In order to determine an orbital solution for N604-WRX, which would also help cement classification as a CWB, dedicated radial velocity follow-up may be required, though confusing contamination from nebular emission from NGC 604 may make such a task more difficult. As we determined the likely primary to be a WC star, it may also be possible to look in the IR for periodic dust formation at periastron in order to derive an orbital period.
Multiwavelength confirmation of N604-WRX as a CWB will be an important step towards expanding extragalactic studies of bright CWBs, and leveraging such sources as probes of massive star winds and massive star evolution in binaries.
Acknowledgements
Support for this work was provided by Chandra Award Number AR8-19006X issued by the Chandra X-ray Observatory Center, which is operated by the Smithsonian Astrophysical Observatory and on behalf of the National Aeronautics and Space Administration under contract NAS8-03060. This work is based on observations obtained as part of program GN-2018A-FT-210 at the Gemini Observatory, which is operated by the Association of Universities for Research in Astronomy, Inc., under a cooperative agreement with the NSF on behalf of the Gemini partnership: the National Science Foundation (United States), National Research Council (Canada), CONICYT (Chile), Ministerio de Ciencia, Tecnología e Innovación Productiva (Argentina), Ministério da Ciência, Tecnologia e Inovação (Brazil), and Korea Astronomy and Space Science Institute (Republic of Korea). This work made use of PyRAF and the Gemini IRAF package. PyRAF is a product of the Space Telescope Science Institute, which is operated by AURA for NASA. We would like to thank the referee for helpful comments in improving the manuscript. K.G. would also like to thank Bret Lehmer and Kathryn Neugent for helpful discussions during the preparation of this manuscript.
References
- Arnaud (1996) Arnaud, K. A. 1996, in Astronomical Society of the Pacific Conference Series, Vol. 101, Astronomical Data Analysis Software and Systems V, ed. G. H. Jacoby & J. Barnes, 17
- Asplund et al. (2009) Asplund, M., Grevesse, N., Sauval, A. J., & Scott, P. 2009, Annual Review of Astronomy and Astrophysics, 47, 481, doi: 10.1146/annurev.astro.46.060407.145222
- Astropy Collaboration et al. (2013) Astropy Collaboration, Robitaille, T. P., Tollerud, E. J., et al. 2013, A&A, 558, A33, doi: 10.1051/0004-6361/201322068
- Astropy Collaboration et al. (2018) Astropy Collaboration, Price-Whelan, A. M., Sipőcz, B. M., et al. 2018, AJ, 156, 123, doi: 10.3847/1538-3881/aabc4f
- Berghoefer et al. (1997) Berghoefer, T. W., Schmitt, J. H. M. M., Danner, R., & Cassinelli, J. P. 1997, A&A, 322, 167
- Bonanos et al. (2004) Bonanos, A. Z., Stanek, K. Z., Udalski, A., et al. 2004, ApJ, 611, L33, doi: 10.1086/423671
- Bouret et al. (2012) Bouret, J.-C., Hillier, D. J., Lanz, T., & Fullerton, A. W. 2012, A&A, 544, A67, doi: 10.1051/0004-6361/201118594
- Bruhweiler et al. (2003) Bruhweiler, F. C., Miskey, C. L., & Smith Neubig, M. 2003, AJ, 125, 3082, doi: 10.1086/374988
- Cash (1979) Cash, W. 1979, ApJ, 228, 939, doi: 10.1086/156922
- Cassinelli et al. (1981) Cassinelli, J. P., Waldron, W. L., Sanders, W. T., et al. 1981, ApJ, 250, 677, doi: 10.1086/159414
- Cherepashchuk (1976) Cherepashchuk, A. M. 1976, Soviet Astronomy Letters, 2, 138
- Chlebowski & Garmany (1991) Chlebowski, T., & Garmany, C. D. 1991, ApJ, 368, 241, doi: 10.1086/169687
- Chlebowski et al. (1989) Chlebowski, T., Harnden, F. R., J., & Sciortino, S. 1989, ApJ, 341, 427, doi: 10.1086/167506
- Churchwell & Goss (1999) Churchwell, E., & Goss, W. M. 1999, ApJ, 514, 188, doi: 10.1086/306941
- Clark et al. (2008) Clark, J. S., Muno, M. P., Negueruela, I., et al. 2008, A&A, 477, 147, doi: 10.1051/0004-6361:20077186
- Cohen et al. (2011) Cohen, D. H., Gagné, M., Leutenegger, M. A., et al. 2011, MNRAS, 415, 3354, doi: 10.1111/j.1365-2966.2011.18952.x
- Cohen et al. (2014) Cohen, D. H., Wollman, E. E., Leutenegger, M. A., et al. 2014, MNRAS, 439, 908, doi: 10.1093/mnras/stu008
- Conti & Massey (1981) Conti, P. S., & Massey, P. 1981, ApJ, 249, 471, doi: 10.1086/159307
- Corcoran et al. (2011) Corcoran, M. F., Pollock, A. M. T., Hamaguchi, K., & Russell, C. 2011, arXiv e-prints, arXiv:1101.1422. https://arxiv.org/abs/1101.1422
- Corcoran et al. (2017) Corcoran, M. F., Liburd, J., Morris, D., et al. 2017, ApJ, 838, 45, doi: 10.3847/1538-4357/aa6347
- Crockett et al. (2006) Crockett, N. R., Garnett, D. R., Massey, P., & Jacoby, G. 2006, ApJ, 637, 741, doi: 10.1086/498424
- Crowther et al. (2010) Crowther, P. A., Barnard, R., Carpano, S., et al. 2010, MNRAS, 403, L41, doi: 10.1111/j.1745-3933.2010.00811.x
- Crowther et al. (1998) Crowther, P. A., De Marco, O., & Barlow, M. J. 1998, MNRAS, 296, 367, doi: 10.1046/j.1365-8711.1998.01360.x
- Dalcanton et al. (2009) Dalcanton, J. J., Williams, B. F., Seth, A. C., et al. 2009, ApJS, 183, 67, doi: 10.1088/0067-0049/183/1/67
- Dalcanton et al. (2012) Dalcanton, J. J., Williams, B. F., Lang, D., et al. 2012, ApJS, 200, 18, doi: 10.1088/0067-0049/200/2/18
- Diaz et al. (1987) Diaz, A. I., Terlevich, E., Pagel, B. E. J., Vilchez, J. M., & Edmunds, M. G. 1987, MNRAS, 226, 19, doi: 10.1093/mnras/226.1.19
- Dolphin (2000) Dolphin, A. E. 2000, PASP, 112, 1383, doi: 10.1086/316630
- Done et al. (2007) Done, C., Gierliński, M., & Kubota, A. 2007, Astronomy and Astrophysics Review, 15, 1, doi: 10.1007/s00159-007-0006-1
- Drissen et al. (2008) Drissen, L., Crowther, P. A., Úbeda, L., & Martin, P. 2008, MNRAS, 389, 1033, doi: 10.1111/j.1365-2966.2008.13633.x
- Eldridge & Relaño (2011) Eldridge, J. J., & Relaño, M. 2011, MNRAS, 411, 235, doi: 10.1111/j.1365-2966.2010.17676.x
- Fariña et al. (2012) Fariña, C., Bosch, G. L., & Barbá, R. H. 2012, AJ, 143, 43, doi: 10.1088/0004-6256/143/2/43
- Feldmeier et al. (1997) Feldmeier, A., Puls, J., & Pauldrach, A. W. A. 1997, A&A, 322, 878
- Freedman et al. (2001) Freedman, W. L., Madore, B. F., Gibson, B. K., et al. 2001, ApJ, 553, 47, doi: 10.1086/320638
- Freeman et al. (2001) Freeman, P., Doe, S., & Siemiginowska, A. 2001, in Society of Photo-Optical Instrumentation Engineers (SPIE) Conference Series, Vol. 4477, Astronomical Data Analysis, ed. J.-L. Starck & F. D. Murtagh, 76–87
- Fruscione et al. (2006) Fruscione, A., McDowell, J. C., Allen, G. E., et al. 2006, in Proc. SPIE, Vol. 6270, Society of Photo-Optical Instrumentation Engineers (SPIE) Conference Series, 62701V
- Fullerton et al. (2006) Fullerton, A. W., Massa, D. L., & Prinja, R. K. 2006, ApJ, 637, 1025, doi: 10.1086/498560
- Gamen et al. (2006) Gamen, R., Gosset, E., Morrell, N., et al. 2006, A&A, 460, 777, doi: 10.1051/0004-6361:20065618
- Garofali et al. (2018) Garofali, K., Williams, B. F., Hillis, T., et al. 2018, MNRAS, 479, 3526, doi: 10.1093/mnras/sty1612
- Garofali et al. (2017) Garofali, K., Williams, B. F., Plucinsky, P. P., et al. 2017, MNRAS, 472, 308, doi: 10.1093/mnras/stx1905
- González Delgado & Pérez (2000) González Delgado, R. M., & Pérez, E. 2000, MNRAS, 317, 64, doi: 10.1046/j.1365-8711.2000.03545.x
- Gosset et al. (2009) Gosset, E., Nazé, Y., Sana, H., Rauw, G., & Vreux, J. M. 2009, A&A, 508, 805, doi: 10.1051/0004-6361/20077981
- Güdel & Nazé (2009) Güdel, M., & Nazé, Y. 2009, Astronomy and Astrophysics Review, 17, 309, doi: 10.1007/s00159-009-0022-4
- Guerrero & Chu (2008) Guerrero, M. A., & Chu, Y.-H. 2008, The Astrophysical Journal Supplement Series, 177, 216, doi: 10.1086/587059
- Günther et al. (2017) Günther, H. M., Frost, J., & Theriault-Shay, A. 2017, AJ, 154, 243, doi: 10.3847/1538-3881/aa943b
- Harnden et al. (1979) Harnden, F. R., J., Branduardi, G., Elvis, M., et al. 1979, ApJ, 234, L51, doi: 10.1086/183107
- Hillier et al. (2001) Hillier, D. J., Davidson, K., Ishibashi, K., & Gull, T. 2001, ApJ, 553, 837, doi: 10.1086/320948
- Hillier & Miller (1998) Hillier, D. J., & Miller, D. L. 1998, ApJ, 496, 407, doi: 10.1086/305350
- Hook et al. (2004) Hook, I. M., Jørgensen, I., Allington-Smith, J. R., et al. 2004, PASP, 116, 425, doi: 10.1086/383624
- Hunter et al. (1996) Hunter, D. A., Baum, W. A., O’Neil, Jr., E. J., & Lynds, R. 1996, ApJ, 456, 174, doi: 10.1086/176638
- Hunter (2007) Hunter, J. D. 2007, Computing In Science & Engineering, 9, 90, doi: 10.1109/MCSE.2007.55
- Jennings et al. (2014) Jennings, Z. G., Williams, B. F., Murphy, J. W., et al. 2014, ApJ, 795, 170, doi: 10.1088/0004-637X/795/2/170
- Joye & Mandel (2003) Joye, W. A., & Mandel, E. 2003, in Astronomical Society of the Pacific Conference Series, Vol. 295, Astronomical Data Analysis Software and Systems XII, ed. H. E. Payne, R. I. Jedrzejewski, & R. N. Hook, 489
- Kudritzki & Puls (2000) Kudritzki, R.-P., & Puls, J. 2000, ARA&A, 38, 613, doi: 10.1146/annurev.astro.38.1.613
- Lebouteiller et al. (2006) Lebouteiller, V., Kunth, D., Lequeux, J., et al. 2006, A&A, 459, 161, doi: 10.1051/0004-6361:20053161
- Lee & Lee (2014) Lee, J. H., & Lee, M. G. 2014, ApJ, 793, 134, doi: 10.1088/0004-637X/793/2/134
- Leitherer et al. (1992) Leitherer, C., Robert, C., & Drissen, L. 1992, ApJ, 401, 596, doi: 10.1086/172089
- Li et al. (2004) Li, J., Kastner, J. H., Prigozhin, G. Y., et al. 2004, ApJ, 610, 1204, doi: 10.1086/421866
- Liu et al. (2013) Liu, J.-F., Bregman, J. N., Bai, Y., Justham, S., & Crowther, P. 2013, Nature, 503, 500, doi: 10.1038/nature12762
- Lomax et al. (2015) Lomax, J. R., Nazé, Y., Hoffman, J. L., et al. 2015, A&A, 573, A43, doi: 10.1051/0004-6361/201424468
- Long & White (1980) Long, K. S., & White, R. L. 1980, ApJ, 239, L65, doi: 10.1086/183293
- Long et al. (2010) Long, K. S., Blair, W. P., Winkler, P. F., et al. 2010, The Astrophysical Journal Supplement Series, 187, 495, doi: 10.1088/0067-0049/187/2/495
- Lucy (1982) Lucy, L. B. 1982, ApJ, 255, 286, doi: 10.1086/159827
- Lucy & Solomon (1970) Lucy, L. B., & Solomon, P. M. 1970, ApJ, 159, 879, doi: 10.1086/150365
- Lucy & White (1980) Lucy, L. B., & White, R. L. 1980, ApJ, 241, 300, doi: 10.1086/158342
- Luo et al. (1990) Luo, D., McCray, R., & Mac Low, M.-M. 1990, ApJ, 362, 267, doi: 10.1086/169263
- Maccarone et al. (2014) Maccarone, T. J., Lehmer, B. D., Leyder, J. C., et al. 2014, MNRAS, 439, 3064, doi: 10.1093/mnras/stu167
- Magrini et al. (2007) Magrini, L., Vílchez, J. M., Mampaso, A., Corradi, R. L. M., & Leisy, P. 2007, A&A, 470, 865, doi: 10.1051/0004-6361:20077445
- Maíz-Apellániz et al. (2004) Maíz-Apellániz, J., Pérez, E., & Mas-Hesse, J. M. 2004, AJ, 128, 1196, doi: 10.1086/422925
- Marchenko et al. (2003) Marchenko, S. V., Moffat, A. F. J., Ballereau, D., et al. 2003, ApJ, 596, 1295, doi: 10.1086/378154
- Marigo et al. (2017) Marigo, P., Girardi, L., Bressan, A., et al. 2017, ApJ, 835, 77, doi: 10.3847/1538-4357/835/1/77
- Massey (1998) Massey, P. 1998, in Astronomical Society of the Pacific Conference Series, Vol. 142, The Stellar Initial Mass Function (38th Herstmonceux Conference), ed. G. Gilmore & D. Howell, 17
- Massey et al. (1995) Massey, P., Armandroff, T. E., Pyke, R., Patel, K., & Wilson, C. D. 1995, AJ, 110, 2715, doi: 10.1086/117725
- Massey et al. (1996) Massey, P., Bianchi, L., Hutchings, J. B., & Stecher, T. P. 1996, ApJ, 469, 629, doi: 10.1086/177811
- Massey & Conti (1983) Massey, P., & Conti, P. S. 1983, ApJ, 273, 576, doi: 10.1086/161393
- Massey & Johnson (1998) Massey, P., & Johnson, O. 1998, ApJ, 505, 793, doi: 10.1086/306199
- Massey et al. (2014) Massey, P., Neugent, K. F., Morrell, N., & Hillier, D. J. 2014, ApJ, 788, 83, doi: 10.1088/0004-637X/788/1/83
- Massey et al. (2016) Massey, P., Neugent, K. F., & Smart, B. M. 2016, AJ, 152, 62, doi: 10.3847/0004-6256/152/3/62
- Massey et al. (2006) Massey, P., Olsen, K. A. G., Hodge, P. W., et al. 2006, AJ, 131, 2478, doi: 10.1086/503256
- Nazé et al. (2013) Nazé, Y., Oskinova, L. M., & Gosset, E. 2013, ApJ, 763, 143, doi: 10.1088/0004-637X/763/2/143
- Nazé et al. (2011) Nazé, Y., Broos, P. S., Oskinova, L., et al. 2011, The Astrophysical Journal Supplement Series, 194, 7, doi: 10.1088/0067-0049/194/1/7
- Neugent & Massey (2011) Neugent, K. F., & Massey, P. 2011, ApJ, 733, 123, doi: 10.1088/0004-637X/733/2/123
- Neugent & Massey (2014) —. 2014, ApJ, 789, 10, doi: 10.1088/0004-637X/789/1/10
- Neugent et al. (2018) Neugent, K. F., Massey, P., & Morrell, N. 2018, ApJ, 863, 181, doi: 10.3847/1538-4357/aad17d
- Nugis & Lamers (2000) Nugis, T., & Lamers, H. J. G. L. M. 2000, A&A, 360, 227
- Oskinova et al. (2004) Oskinova, L. M., Feldmeier, A., & Hamann, W.-R. 2004, A&A, 422, 675, doi: 10.1051/0004-6361:20047187
- Oskinova et al. (2007) Oskinova, L. M., Hamann, W.-R., & Feldmeier, A. 2007, A&A, 476, 1331, doi: 10.1051/0004-6361:20066377
- Oskinova et al. (2003) Oskinova, L. M., Ignace, R., Hamann, W. R., Pollock, A. M. T., & Brown, J. C. 2003, A&A, 402, 755, doi: 10.1051/0004-6361:20030300
- Owocki et al. (1988) Owocki, S. P., Castor, J. I., & Rybicki, G. B. 1988, ApJ, 335, 914, doi: 10.1086/166977
- Park et al. (2006) Park, T., Kashyap, V. L., Siemiginowska, A., et al. 2006, ApJ, 652, 610, doi: 10.1086/507406
- Pittard (2007) Pittard, J. M. 2007, ApJ, 660, L141, doi: 10.1086/518365
- Pittard & Corcoran (2002) Pittard, J. M., & Corcoran, M. F. 2002, A&A, 383, 636, doi: 10.1051/0004-6361:20020025
- Pittard & Dougherty (2006) Pittard, J. M., & Dougherty, S. M. 2006, MNRAS, 372, 801, doi: 10.1111/j.1365-2966.2006.10888.x
- Pittard & Stevens (1997) Pittard, J. M., & Stevens, I. R. 1997, MNRAS, 292, 298, doi: 10.1093/mnras/292.2.298
- Pittard & Stevens (2002) —. 2002, A&A, 388, L20, doi: 10.1051/0004-6361:20020583
- Pollock (1987) Pollock, A. M. T. 1987, ApJ, 320, 283, doi: 10.1086/165539
- Pollock & Corcoran (2006) Pollock, A. M. T., & Corcoran, M. F. 2006, A&A, 445, 1093, doi: 10.1051/0004-6361:20053496
- Pollock et al. (2005) Pollock, A. M. T., Corcoran, M. F., Stevens, I. R., & Williams, P. M. 2005, ApJ, 629, 482, doi: 10.1086/431193
- Pollock et al. (2018) Pollock, A. M. T., Crowther, P. A., Tehrani, K., Broos, P. S., & Townsley, L. K. 2018, MNRAS, 474, 3228, doi: 10.1093/mnras/stx2879
- Prestwich et al. (2007) Prestwich, A. H., Kilgard, R., Crowther, P. A., et al. 2007, ApJ, 669, L21, doi: 10.1086/523755
- Prilutskii & Usov (1976) Prilutskii, O. F., & Usov, V. V. 1976, AZh, 53, 6
- Puebla et al. (2016) Puebla, R. E., Hillier, D. J., Zsargó, J., Cohen, D. H., & Leutenegger, M. A. 2016, MNRAS, 456, 2907, doi: 10.1093/mnras/stv2783
- Rauw & Nazé (2016) Rauw, G., & Nazé, Y. 2016, Advances in Space Research, 58, 761, doi: 10.1016/j.asr.2015.09.026
- Rauw et al. (2002) Rauw, G., Vreux, J. M., Stevens, I. R., et al. 2002, A&A, 388, 552, doi: 10.1051/0004-6361:20020523
- Rauw et al. (2004) Rauw, G., De Becker, M., Nazé, Y., et al. 2004, A&A, 420, L9, doi: 10.1051/0004-6361:20040150
- Rauw et al. (2015) Rauw, G., Nazé, Y., Wright, N. J., et al. 2015, The Astrophysical Journal Supplement Series, 221, 1, doi: 10.1088/0067-0049/221/1/1
- Read et al. (2011) Read, A. M., Rosen, S. R., Saxton, R. D., & Ramirez, J. 2011, A&A, 534, A34, doi: 10.1051/0004-6361/201117525
- Sana et al. (2006) Sana, H., Rauw, G., Nazé, Y., Gosset, E., & Vreux, J. M. 2006, MNRAS, 372, 661, doi: 10.1111/j.1365-2966.2006.10847.x
- Sana et al. (2012) Sana, H., de Mink, S. E., de Koter, A., et al. 2012, Science, 337, 444, doi: 10.1126/science.1223344
- Sander et al. (2012) Sander, A., Hamann, W. R., & Todt, H. 2012, A&A, 540, A144, doi: 10.1051/0004-6361/201117830
- Sciortino et al. (1990) Sciortino, S., Vaiana, G. S., Harnden, F. R., J., et al. 1990, ApJ, 361, 621, doi: 10.1086/169225
- Seward & Chlebowski (1982) Seward, F. D., & Chlebowski, T. 1982, ApJ, 256, 530, doi: 10.1086/159929
- Silverman & Filippenko (2008) Silverman, J. M., & Filippenko, A. V. 2008, ApJ, 678, L17, doi: 10.1086/588096
- Smith (2014) Smith, N. 2014, ARA&A, 52, 487, doi: 10.1146/annurev-astro-081913-040025
- Smith et al. (2001) Smith, R. K., Brickhouse, N. S., Liedahl, D. A., & Raymond, J. C. 2001, ApJ, 556, L91, doi: 10.1086/322992
- Stevens et al. (1992) Stevens, I. R., Blondin, J. M., & Pollock, A. M. T. 1992, ApJ, 386, 265, doi: 10.1086/171013
- Stevens et al. (1996) Stevens, I. R., Corcoran, M. F., Willis, A. J., et al. 1996, MNRAS, 283, 589, doi: 10.1093/mnras/283.2.589
- Strüder et al. (2001) Strüder, L., Briel, U., Dennerl, K., et al. 2001, A&A, 365, L18, doi: 10.1051/0004-6361:20000066
- Sugawara et al. (2015) Sugawara, Y., Maeda, Y., Tsuboi, Y., et al. 2015, Publications of the Astronomical Society of Japan, 67, 121, doi: 10.1093/pasj/psv099
- Sundqvist et al. (2011) Sundqvist, J. O., Puls, J., Feldmeier, A., & Owocki, S. P. 2011, A&A, 528, A64, doi: 10.1051/0004-6361/201015771
- Tehrani et al. (2019) Tehrani, K. A., Crowther, P. A., Bestenlehner, J. M., et al. 2019, MNRAS, 484, 2692, doi: 10.1093/mnras/stz147
- Torres et al. (1986) Torres, A. V., Conti, P. S., & Massey, P. 1986, ApJ, 300, 379, doi: 10.1086/163811
- Tüllmann et al. (2008) Tüllmann, R., Gaetz, T. J., Plucinsky, P. P., et al. 2008, ApJ, 685, 919, doi: 10.1086/591019
- Tüllmann et al. (2011) —. 2011, ApJS, 193, 31, doi: 10.1088/0067-0049/193/2/31
- Turner et al. (2001) Turner, M. J. L., Abbey, A., Arnaud, M., et al. 2001, A&A, 365, L27, doi: 10.1051/0004-6361:20000087
- Usov (1992) Usov, V. V. 1992, ApJ, 389, 635, doi: 10.1086/171236
- van den Heuvel (2019) van den Heuvel, E. P. J. 2019, arXiv e-prints, arXiv:1901.06939. https://arxiv.org/abs/1901.06939
- van den Heuvel et al. (2017) van den Heuvel, E. P. J., Portegies Zwart, S. F., & de Mink, S. E. 2017, MNRAS, 471, 4256, doi: 10.1093/mnras/stx1430
- van Kerkwijk et al. (1996) van Kerkwijk, M. H., Geballe, T. R., King, D. L., van der Klis, M., & van Paradijs, J. 1996, A&A, 314, 521
- Vilchez et al. (1988) Vilchez, J. M., Pagel, B. E. J., Diaz, A. I., Terlevich, E., & Edmunds, M. G. 1988, MNRAS, 235, 633, doi: 10.1093/mnras/235.3.633
- Vink et al. (2001) Vink, J. S., de Koter, A., & Lamers, H. J. G. L. M. 2001, A&A, 369, 574, doi: 10.1051/0004-6361:20010127
- West et al. (2018) West, L. A., Lehmer, B. D., Wik, D., et al. 2018, ApJ, 869, 111, doi: 10.3847/1538-4357/aaec6b
- White & Long (1986) White, R. L., & Long, K. S. 1986, ApJ, 310, 832, doi: 10.1086/164736
- Williams et al. (2014) Williams, B. F., Lang, D., Dalcanton, J. J., et al. 2014, ApJS, 215, 9, doi: 10.1088/0067-0049/215/1/9
- Williams et al. (2015) Williams, B. F., Wold, B., Haberl, F., et al. 2015, ApJS, 218, 9, doi: 10.1088/0067-0049/218/1/9
- Williams et al. (2012) Williams, P. M., van der Hucht, K. A., van Wyk, F., et al. 2012, MNRAS, 420, 2526, doi: 10.1111/j.1365-2966.2011.20218.x
- Yang et al. (1996) Yang, H., Chu, Y.-H., Skillman, E. D., & Terlevich, R. 1996, AJ, 112, 146, doi: 10.1086/117995
- Zhekov et al. (2011) Zhekov, S. A., Gagné, M., & Skinner, S. L. 2011, ApJ, 727, L17, doi: 10.1088/2041-8205/727/1/L17
- Zhekov et al. (2014) Zhekov, S. A., Tomov, T., Gawronski, M. P., et al. 2014, MNRAS, 445, 1663, doi: 10.1093/mnras/stu1880