A new formulation of the external field effect in MOND and numerical simulations of ultra-diffuse dwarf galaxies application to NGC 1052-DF2 and NGC 1052-DF4
Abstract
The ultra-diffuse dwarf galaxy NGC 1052-DF2 (DF2) has ten (eleven) measured globular clusters (GCs) with a line-of-sight velocity dispersion of km/s (km/s). Our conventional statistical analysis of the original ten GCs gives km/s. The overall distribution of velocities agrees well with a Gaussian of this width. Due to the non-linear Poisson equation in MOND, a dwarf galaxy has weaker self-gravity when in close proximity to a massive host. This external field effect is investigated using a new analytic formulation and fully self-consistent live -body models in MOND. Our formulation agrees well with that of Famaey and McGaugh (2012). These new simulations confirm our analytic results and suggest that DF2 may be in a deep-freeze state unique to MOND. The correctly calculated MOND velocity dispersion agrees with our inferred dispersion and that of van Dokkum et al. (2018b) if DF2 is within 150 kpc of NGC 1052 and both are 20 Mpc away. The GCs of DF2 are however significantly brighter and larger than normal GCs, a problem which disappears if DF2 is significantly closer to us. A distance of 10-13 Mpc makes DF2 a normal dwarf galaxy even more consistent with MOND and the 13 Mpc distance reported by Trujillo et. al. (2019). We discuss the similar dwarf DF4, finding good agreement with MOND. We also discuss possible massive galaxies near DF2 and DF4 along with their distances and peculiar velocities, noting that NGC 1052 may lie at a distance near 10 Mpc.
keywords:
gravitation – dark matter – galaxies: dwarf – galaxies: kinematics and dynamics – galaxies: distances and redshifts – galaxies: individual: NGC 1052-DF21 Introduction
Amongst the most competitive solutions to the missing mass problem are the standard cosmological CDM model (Ostriker & Steinhardt, 1995) and the Milgromian dynamics (MOND) theory, which was proposed by Milgrom (1983a) at a similar time to when the notion of dark matter came to be taken seriously (Ostriker & Peebles, 1973). Although it is generally thought that the dark matter model is successful on large scales (e.g. Planck Collaboration, 2016), dark matter particles have not been detected after much experimental effort (e.g. Hoof et al., 2018). Moreover, the results of high-resolution -body simulations do not seem to be compatible with observations on galactic and cosmological scales (Haslbauer et al., 2019; Bose et al., 2018; Bullock & Boylan-Kolchin, 2017; Peebles & Nusser, 2010; Kroupa et al., 2010; Kroupa, 2012, 2015).
MOND can be formulated as space-time scale invariance (Milgrom, 2009; Wu & Kroupa, 2015). This is an excellent description of gravitation within Milgromian dynamics (Milgrom, 1983a; Bekenstein & Milgrom, 1984; Famaey & McGaugh, 2012; Bullock & Boylan-Kolchin, 2017). In MOND, a galaxy with an internal acceleration larger than Milgrom’s constant pc/Myr2; is in the Newtonian-gravitational regime which breaks space-time scale invariance, while for lower accelerations the equations of motion are space-time scale invariant, representing the MOND regime. MOND predicts that each isolated galaxy has a phantom dark matter halo which can be described mathematically as a Newtonian isothermal potential, causing the gravitating mass of the galaxy to exceed its inertial mass composed of normal, baryonic matter. In the external field of another galaxy, the non-linear MOND theory predicts this phantom dark matter halo to be reduced such that the internal dynamics of a system depends on the positions of nearby galaxies, even if they exert no tides. This external field effect (EFE) constitutes an important prediction of MOND which follows directly from its governing equations (Bekenstein & Milgrom, 1984; Milgrom, 1986).
Observationally, the EFE can be tested by studying low-mass dwarf galaxies in the vicinity of major host galaxies. It has been successfully applied in the Local Group (McGaugh & Milgrom, 2013), in particular to correctly predict the very low velocity dispersion of Crater 2 (McGaugh, 2016; Caldwell et al., 2017). Evidence for the EFE has been found in the rotation curves of galaxies (Wu & Kroupa, 2015; Hees et al., 2016; Haghi et al., 2016), the Milky Way escape velocity curve (Banik & Zhao, 2018a) and in the asymmetric tidal tail of the globular star cluster Pal 5 (Thomas et al., 2018).
In this context, it is interesting to note the observations by van Dokkum et al. (2018b) of NGC 1052-Dragonfly 2 (DF2)111For a review of the discovery history and proper name of this galaxy (here referred to in short as DF2), see Trujillo et al. (2019), which was previously discovered by Fosbury et al. (1978, plate 1). van Dokkum et al. (2018b) used the line-of-sight velocities of its 10 GCs as bright tracers of its potential, which is consistent without dark matter in a Newtonian context.
Another dwarf galaxy was recently discovered by van Dokkum et al. (2019b). NGC 1052-DF4 (DF4) is in close projected proximity to DF2 with similar unusual size, luminosity, morphology, globular cluster population and velocity dispersion. Based on the radial velocities of 7 GCs associated with DF4, they derived a Newtonian dynamical mass-to-light ratio of about unity.
These galaxies are studied here in order to test MOND and shed additional light on their possible origin. In Section 2, we introduce a new set of fitting functions to calculate the global line-of-sight velocity dispersion of a non-isolated stellar system lying in the external field of a host galaxy as a function of the internal and external gravitational field. Our detailed formulation is compared with the EFE formulation by Famaey & McGaugh (2012). In Section 3.1, we compare the MOND-predicted velocity dispersion of the GC system with the observed velocity dispersion of DF2. The first -body numerical MOND modelling of DF2 is also documented in Section 3.3. We then address the unusual appearance of DF2, finding that if it is only 13 Mpc away instead of the 20 Mpc distance estimated by van Dokkum et al. (2018b), it would also be consistent with MOND, even if it were isolated (Section 3.4). A smaller distance of 13 Mpc was in fact recently suggested by Trujillo et al. (2019). In Section 4, we apply our analytical formalism to the recently discovered NGC 1052-DF4 (DF4, van Dokkum et al., 2019b). Our results show that it can also be explained in MOND thanks to its weak self-gravity, which renders it susceptible to the EFE. We provide our conclusions in Section 5, emphasising that, given current measurement uncertainties, the NGC 1052, DF2 and DF4 system may be at a distance of Mpc.
2 Analytic description of the velocity dispersion
The velocity dispersion of DF2 is a measure of its potential assuming virial equilibrium. In this section, we obtain the MOND expectation for . This prediction has no free parameters but depends on the dwarf’s baryonic mass , effective radius , distance from the observer and its separation from the host galaxy with baryonic mass , which defines the external field.
A formulation of how the velocity dispersion of a self-gravitating system depends on the internal and external fields is made available here in the form of analytical functions. This formulation is equivalent to but generalizes that available in Kroupa et al. (2018). If DF2 is in dynamical equilibrium at a separation from NGC 1052, then the line-of-sight velocity dispersion can be calculated explicitly as a function of the internal and external accelerations in MOND.
The globally averaged one-dimensional line-of-sight velocity dispersion of a non-isolated stellar system, when the external gravity is much weaker or stronger than the internal gravity, and also in the intermediate regime was quantified by Haghi et al. (2009), using the numerical MOND potential solver code N-MODY (Londrillo & Nipoti, 2009). Haghi et al. (2009) formulated a functional representation for in the intermediate regime () for different values of the external field and quantified the different asymptotic behaviour (i.e. in the Newtonian, the deep-MOND and the external-field-dominated regimes). The formulation was presented as their equations 16 and 17 with coefficients provided for different values of in their table 1. Here, an analytical formulation is found for the data in that table, allowing to be calculated as a function of the internal field in a system with mass exposed to an external field .
The one-dimensional (line-of-sight) MOND velocity dispersion (in km/s) for a system of baryonic mass and 3D half-mass radius with internal acceleration is
| (1) |
where the velocity dispersion of an isolated system
| (2) |
and
| (3) |
with being Newton’s gravitational constant. Note that Equations 1, 2 and 3 supersede the equation used by van Dokkum et al. (2018b) by a correction factor which ensures the correct behaviour as the internal acceleration rises above and the dynamics become Newtonian. These formulae are chosen because they reproduce well the previous analytical velocity dispersion estimators (Milgrom, 1994; McGaugh & Milgrom, 2013) for systems in the external-field dominated case () and for the isolated deep-MOND regime (Milgrom, 1995) and the N-MODY results.
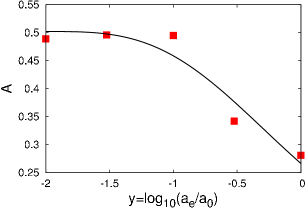
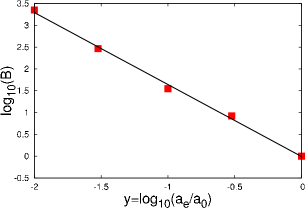
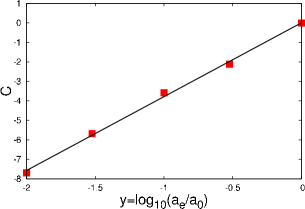
We fit the data in Haghi et al. (2009, table 1) using the functions and with argument :
| (4) | |||||
| (5) | |||||
| (6) |
These fitting functions are shown in Fig. 1. Therefore, for any non-isolated system with known external acceleration , it is possible to calculate using these functions.
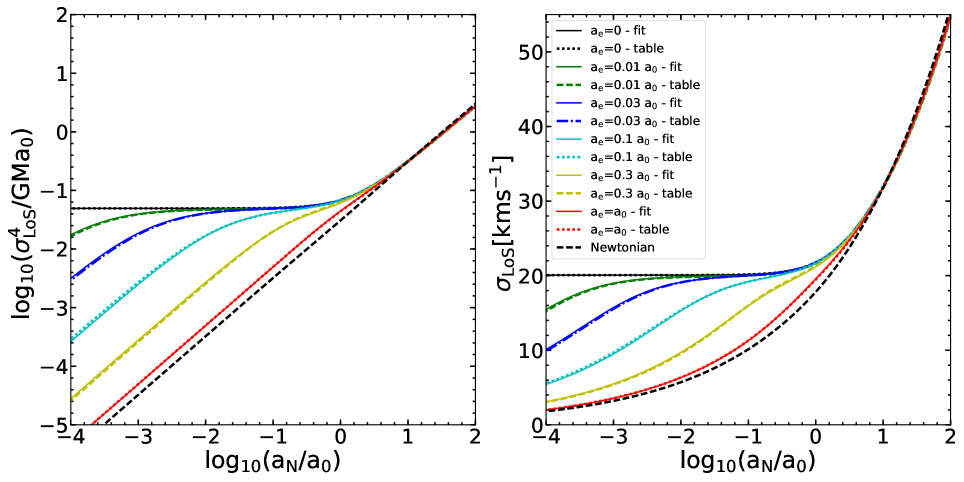
To visualize the effect of different external accelerations, we plot the MONDian velocity dispersion as a function of internal acceleration from a weak to a strong external field (Fig. 2). In order to see how well these fitting functions reproduce the previous results of Haghi et al. (2009), we compare the line-of-sight velocity dispersion found using the best-fitting functions and (Eq. 6) with the result of Eq. 1 using the coefficients given in table 1 of Haghi et al. (2009).
It should be noted that our three fitting functions are arbitrarily chosen because they reproduce the results of Haghi et al. (2009) very well. Although function in Fig. 1 does not perfectly match the simulated data, Figure 2 shows that the line-of-sight velocity dispersion resulting from our best fitting functions are in excellent agreement with those calculated using the coefficients given in table 1 of Haghi et al. (2009). There is at most a 0.1 percent difference between the numerically simulated values in table 1 of Haghi et al. (2009), and our analytic fit in Fig. 1, i.e. .
2.1 Comparison with Famaey & McGaugh (2012)
As another check on our analytical formulation of the velocity dispersion, we compare it with the ansatz proposed by Famaey & McGaugh (2012) considering the net MOND effect in one dimension (their eq. 59). When , the object is quasi-Newtonian i.e. Newton’s law of Gravity applies with an effective gravitational constant (Famaey & McGaugh, 2012; McGaugh & Milgrom, 2013; Famaey et al., 2018; Müller et al., 2019a). According to the Famaey & McGaugh (2012) formulation, the MOND acceleration at the half-light radius is
| (7) |
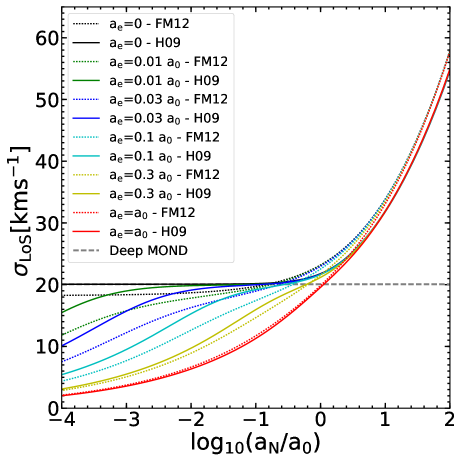
where is the MOND interpolating function, is the MONDian internal gravitational field, is the external field from the host, and is the Newtonian internal gravitational field for the mass embedded within the 3D deprojected half-mass radius . Using the simple interpolating function (Famaey & Binney, 2005), we solve this equation for . The external acceleration can be approximated by , where is the rotational velocity of the external galaxy and is the separation between the two objects. Adopting the mass estimator in Wolf et al. (2010) to calculate the line-of-sight velocity dispersion as , one can calculate the true velocity dispersion of the system, corrected for the external field. Here, the effective gravitational constant in MOND is defined as . In Figure 3, we show the MONDian velocity dispersion as a function of internal acceleration for weak to strong external fields using the formulation of Famaey & McGaugh (2012) (dotted lines) and Haghi et al. (2009) (solid lines).
It is important to mention that we calculated using the Famaey & McGaugh (2012) relation in the isolated deep-MOND regime for DF2 and obtained a value of km/s, which is 10% lower than the deep-MOND prediction of 20 km/s for the isolated system. In the Newtonian regime, the velocity dispersion from Famaey & McGaugh (2012) is higher than the values calculated in our formalism. The Famaey & McGaugh (2012) formula thus leads to a velocity dispersion smaller by 10% in the MOND regime and larger by 5% in the Newtonian regime compared to our analytical formulation. Therefore, the global one-dimensional line-of-sight velocity dispersion of a non-isolated stellar system lying in the intermediate external-field regime probably differs by between these formalisms.
This could be due to the different interpolating function used in the MOND -body integrator (Haghi et al., 2009). It should be noted that to calculate with the Famaey & McGaugh (2012) ansatz, we use the Newtonian mass estimator in Haghi et al. (2009) instead of the Wolf et al. (2010) mass estimator ). This could be another source of difference between the results of our analytic formulation and the Famaey & McGaugh (2012) ansatz. In any case, the difference can be practically neglected in view of the typical measurement uncertainties.
3 NGC 1052-DF2
In this section, the above analytic formulae are applied for the case of DF2 and compared with -body simulations. The NGC 1052 group has a systemic velocity of km/s with a galaxy–galaxy dispersion of km/s (van Dokkum et al., 2018c). The main group host galaxy NGC 1052 has a baryonic mass (Bellstedt et al., 2018) if it lies at a distance of 20 Mpc. If DF2 is at its projected distance to NGC 1052 then the two galaxies are kpc apart, but a more likely distance is kpc as the sky plane contains two of the three space dimensions.
van Dokkum et al. (2018b) assume that DF2 is located at a distance of Mpc in the NGC 1052 group. This implies that the effective radius of its population of 10 GCs is kpc, the stellar body of the galaxy has kpc and its absolute V-band magnitude is mag, corresponding to a luminosity . We furthermore assume (like van Dokkum et al., 2018b) that the mass-to-light ratio of the stellar population is , while spectroscopy suggests a slightly lower value of 1.6 (Dabringhausen & Fellhauer, 2016). These values for are in any case well consistent with typical dwarf galaxies in this luminosity range (see e.g. fig. 9 in Dabringhausen & Fellhauer 2016).
3.1 The inferred velocity dispersion of NGC 1052-DF2
Using the ten GCs of DF2, van Dokkum et al. (2018a) found km/s. Here we revisit the velocity dispersion calculation, which is important for the conclusions as to how much dark matter is contained in DF2 and whether MOND can be falsified using the 10 globular clusters (GCs) with measured radial velocities as was suggested by van Dokkum et al. (2018a).
We model the true GC radial velocities as following a Gaussian distribution about some mean with intrinsic dispersion . This stands in contrast to the biweight distribution (Beers et al., 1990) favoured in van Dokkum et al. (2018b) and also used in Kroupa (1997), but a Gaussian/normal distribution is the simpler model and is in fact often realized in nature, since the central limit theorem states that a distribution arising from different random processes approaches the Gaussian distribution. To determine the likelihood of a particular model ( combination of and ), we use the fact that a normal distribution with dispersion has a probability
| (8) |
A measurement can differ from the mean due to both measurement errors and intrinsic dispersion. Assuming both are Gaussian, we can add these in quadrature. Thus, the probability of a model is
| (9) | |||||
| (10) |
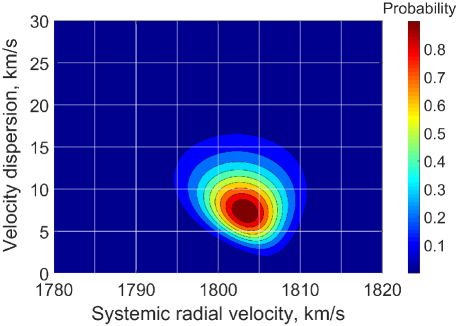
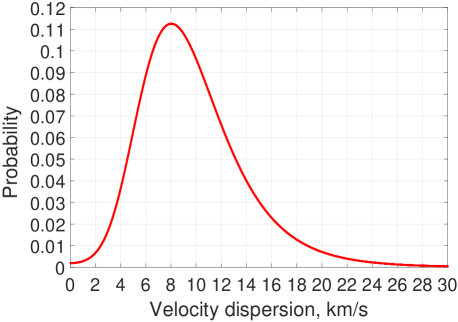
where the intrinsic velocity dispersion of the GC system is and the uncertainty on the velocity measurement of the ith GC is . Using this procedure on a grid of values in , we obtain the probabilities of different models relative to the most likely model (see Appendix A for more details). Marginalizing over the systemic radial velocity , we obtain the probability distribution of (Fig. 4). At the 68.3% confidence level, km/s (other confidence intervals are listed in Table 1). Due to measurement errors, this is slightly lower than the root mean square dispersion of the radial velocities. However, it is not much lower, as is readily apparent from the data GCs 39 and 92 have radial velocities differing by km/s but km/s in both GCs (van Dokkum et al., 2018b, figure 1). This suggests that km/s, as confirmed by the present analysis. This revised velocity dispersion shows DF2 to be in excellent agreement with the expected MOND value (Kroupa et al., 2018). It should be noted that our inferred value agrees quite well with that of van Dokkum et al. (2018a), which improves on van Dokkum et al. (2018b) by including more data. Moreover, our result is consistent with the most recent estimation of the velocity dispersion of DF2 by Martin et al. (2018) when allowing for the possibility that some GCs may be interlopers. Similarly to their analysis, we also find no compelling evidence that interlopers affect our inferred (Figs. 8 and 9).
| Confidence interval | Range in , km/s |
|---|---|
| 0 sigma (most likely value) | 8.0 |
| 1 sigma (68.3% confidence) | 5.0 12.3 |
| 2 sigma (95.4% confidence) | 2.4 18.8 |
| 3 sigma (99.7% confidence) | 0.0 28.4 |
3.2 Analytic expectations
Having inferred the internal velocity dispersion of DF2 (Figure 4), its expected dependence on and is shown in Fig. 5 using the analytic formulation of MOND calibrated using numerical simulations (Section 2). For the host mass , the velocity dispersion of DF2 is and 14 km/s for and 98 kpc, respectively. This is clearly in agreement with the here inferred velocity dispersion (Sec. 3.1) and the value arrived at by van Dokkum et al. (2018a), km/s, within their 2-sigma confidence range. Another recently determined stellar velocity dispersion of DF2 also agrees with our MOND calculations (Emsellem et al., 2018). They measured the velocity dispersion of GCs in DF2 by spectroscopic analysis and got a value of km/s. Moreover, they also studied the velocity dispersion of stars in the dwarf galaxy, obtaining km/s. These values agree well with the MOND expectation, as does the recent stellar body measurement of km/s by Danieli et al. (2019).
If kpc, then DF2 would be isolated (unless another major galaxy is in its vicinity) and the expected MOND velocity dispersion would be km/s (Eq. 2). This would challenge MOND with just over two-sigma confidence according to the velocity dispersion reported by van Dokkum et al. (2018a, b) but is compatible within the three-sigma confidence range of the here obtained velocity dispersion using the same data. DF2 is thus most likely in a quasi-Newtonian state, confirming a central MOND prediction if it is indeed close to NGC 1052 (Kroupa et al., 2018; Famaey et al., 2018).
3.3 N-body MOND models
Since the size of the ultra-diffuse dwarf galaxy is a few kpc and its velocity dispersion is a few km/s, the crossing time for its stars is Gyr. If such a galaxy moves outwards from its pericentre with a high orbital speed, it may not be able to retain dynamical equilibrium when it is far away from the host galaxy, so that it becomes frozen in the quasi-Newtonian regime. In this case, the velocity dispersion is lower than expected if dynamical equilibrium is assumed. This memory effect (Haghi et al., 2009; Wu & Kroupa, 2013a) is considered in the following using -body models.
We model DF2 as being in orbit around a purely baryonic NGC 1052, which we model as an analytical oblate Hernquist profile (Hernquist, 1990) with axial ratio of 1:1:0.7, a major axis of 2 kpc and baryonic mass of (Bellstedt et al., 2018).
DF2 is represented using equal-mass particles which are integrated along their orbits using the N-MODY code (Londrillo & Nipoti, 2009) that considers only a uniform EFE but not tides (Wu & Kroupa, 2013a). The DF2 baryonic mass distribution is a Plummer model, with an overall mass of with half-mass radius kpc (model U1) and kpc (model U2). The equilibrium -body initial conditions are constructed in Newtonian dynamics and then the global velocities of the dwarf particles are increased by the virial ratio , where is the MONDian potential energy and is the Newtonian kinetic energy (Wu & Kroupa, 2013a).
The pericentre distance is assumed to be kpc, and this distance along the short axis of the host galaxy is the starting point for the simulations. At this separation, the dwarf has essentially no phantom dark matter halo due to the strong external field close to the host, making its dynamics nearly Newtonian. The initial relative velocity (which is entirely outwards) is varied in the range of km/s with an interval of km/s. The dwarf has a lingering memory of a colder past on an internal crossing time scale Gyr.
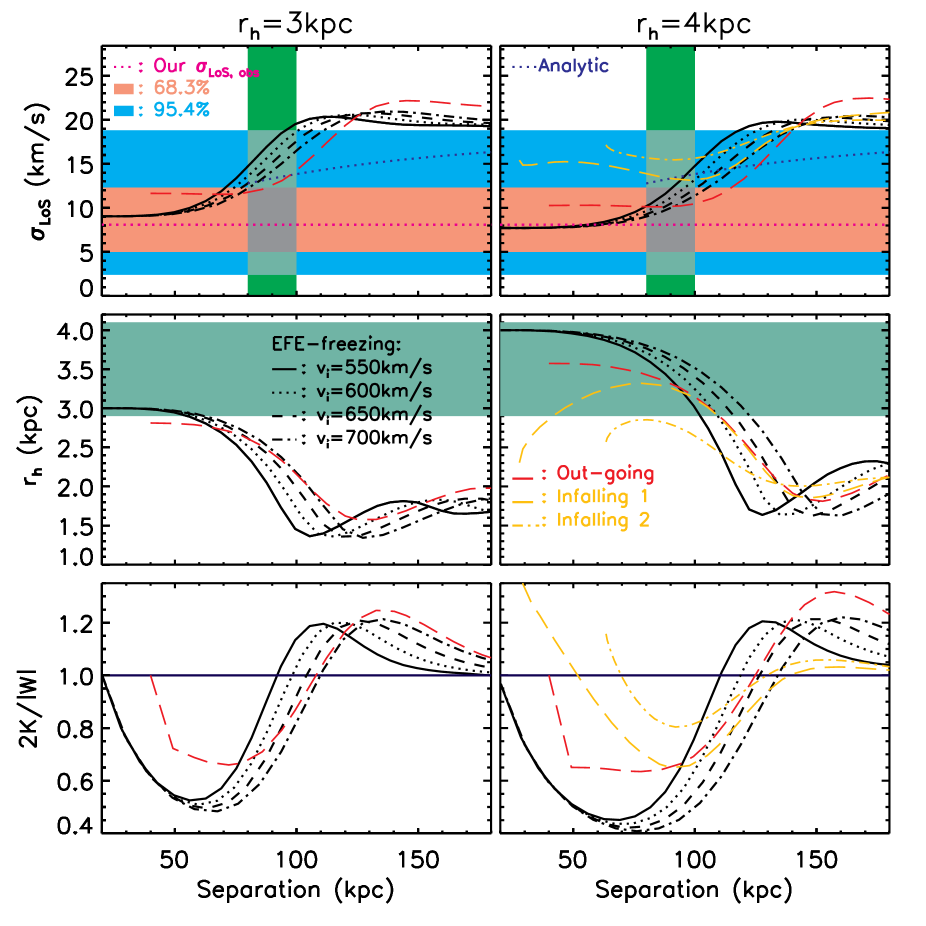
Fig. 5 shows that the internal dispersion is essentially frozen at the Newtonian value between kpc and kpc. The dwarf would be observed to lack dark matter here. At kpc, the line-of-sight (LoS) velocity dispersion in the simulations is (U1) and (U2). The virial ratios are below 1 at this separation such that the systems are colder than their equilibrium states, this being the memory effect whereby DF2 is in a deep freeze. The radii of the model dwarfs are 2.12.9 (U1) and 3.73.9 (U2), both in good agreement with observations of DF2. Its deprojected 3D circularised half-light radius is in the range 2.94.1 kpc (van Dokkum et al., 2018b) if we assume this is 4/3 of the analogous projected quantity (Wolf et al., 2010).
As DF2 moves further from NGC 1052, the memory effect disappears near (U1) and (U2). These simulations show that an orbit with a higher velocity can freeze DF2 out to a larger separation. The deep-freeze state can be recognized when . Moreover, an initially more diffuse dwarf can be frozen in the quasi-Newtonian regime out to a larger separation. This demonstrates a competition between the orbital time and the crossing time, and an initial ultra-diffuse galaxy moving rapidly from the inner region near a host galaxy can be frozen in quasi-Newtonian dynamics even at a large separation. The observed DF2 may thus be the first example of the memory effect in MOND.
We have also realised two fully self-consistent simulations (including tides and the EFE) with the adaptive-mesh refinement MOND code Phantom of RAMSES (PoR, Lüghausen et al., 2015) of a U1 and a U2 model. These are launched on a hyperbolic orbit from a larger pericentre at kpc to avoid strong tidal effects from the host galaxy. The initial relative velocity is 550 km/s perpendicular to the line of sight, implying an apocentre of 1540 kpc. All our galaxy models consist of live particles. To simplify the calculations, the host galaxy, NGC 1052, has a spherical Plummer density profile with a mass of and a half-mass radius of kpc. Both the tidal and external field are taken into account in these simulations. The model dwarfs are initially in equilibrium at their pericentres (i.e. kpc) with cut-off radii of 10 kpc. After launch, our model dwarf galaxies are temporarily frozen in the quasi-Newtonian state (bottom panel of Figure 5). At a distance of kpc, for the U1 model and for the U2 model, consistent with our N-MODY simulations which only include the EFE. The parameters of the PoR models are listed in Table 2.
For completeness of our analysis, we calculate two PoR models launched from a larger distance of 200 kpc with initial relative velocity of 400 km/s directed such that the pericenter is at 28 (64) kpc. These are shown by the gold dashed (dot-dashed) curves in Fig. 5. We use a starting point 200 kpc away because this makes DF2 almost isolated initially. The external field from the host galaxy is such that a more distant starting point would not make any difference to the external field and tidal effects. In these models, the initial half-mass radius of DF2 is 1.5 (2.0) kpc. The size of the system expands when the dwarf galaxy is near pericenter, compensating for the smaller size of the initial model and matching the observed radius. An even better match could be obtained for a larger initial size, which would somewhat lower the velocity dispersion and make this more in line with observations.
The infalling satellite puffs up (compared to the outgoing cases) and shows a significant increase in the virial ratio, possibly not surviving a second passage. The system is frozen in the MOND regime near pericenter i.e. it has a virial ratio . At a separation of 80-100 kpc, the velocity dispersion agrees with the observations within their 2-sigma error range. When the separation is beyond 100 kpc, the prediction from the new model is very similar to those of EFE-only (N-MODY) models.
The GCs are more spread out than the stars of the stellar body of DF2, so the GC velocity dispersion could be slightly lower than our analytical and numerical predictions. This issue does not arise for the stellar velocity dispersion measurements, which are already weighted by luminosity and thus nearly mass-weighted, as in our calculations.
While these experiments are still idealized, they demonstrate that a systematic study of such dwarf satellite galaxies is needed before drawing conclusions about fundamental theory. A more detailed paper is in preparation (Wu et al.) in which multiple orbits for DF2 will be studied.
In summary, the analytically calculated value of is verified by N-MODY (a spherical particle-mesh code) and PoR (an adaptive-mesh refinement code) simulations. All our theoretical estimates are consistent with the measured velocity dispersion of DF2.
| Model | Line type | Pericenter | Starting position | Starting separation | Initial relative speed | Initial | Speed at pericenter |
|---|---|---|---|---|---|---|---|
| Out-going 1 | Red dashed | 40 kpc | (0, 0, 40) kpc | 40 kpc | 550 km/s | 3.0 kpc | 550 km/s |
| Out-going 2 | Red dashed | 40 kpc | (0, 0, 40) kpc | 40 kpc | 550 km/s | 4.0 kpc | 550 km/s |
| Infalling 1 | Gold dashed | 28 kpc | (40, 0, 195) kpc | 200 kpc | 400 km/s | 1.5 kpc | 553 km/s |
| Infalling 2 | Gold dot-dashed | 64 kpc | (80, 0, 183) kpc | 200 kpc | 400 km/s | 2.0 kpc | 487 km/s |
3.4 The properties of NGC 1052-DF2 at different distances
The above discussion assumed that DF2 is a physical member of the NGC 1052 group with a projected separation of kpc from NGC 1052 which is assumed to be 20 Mpc away (see Sec. 3.4.4). The arguments in favour of this are (i) the line-of-sight velocity is km/s () with respect to the NGC 1052 group and km/s with respect to NGC 1052 and (ii) the non-detection of a gas component in DF2 (Sardone et al., 2019; Chowdhury, 2019), suggesting it is part of a galaxy group (Geha et al., 2006). In addition, the Hubble Space Telescope should have been able to resolve the red-giant-branch stars if this dwarf galaxy is closer than 10 Mpc, unless its stellar population is non-canonical.
The surface-brightness fluctuation method can yield inaccurate results because it relies on the number of giant stars per unit surface area (Jerjen & Rejkuba, 2001). This depends on the age and metallicity of the stellar population, the mass distribution of which also depends on the metallicity and star-formation rate (Kroupa et al., 2013; Yan et al., 2017; Jeřábková et al., 2018). Galaxies with a high star formation rate are known to be producing stellar populations overabundant in massive stars (Gunawardhana et al., 2011), while galaxies with a low star formation rate show a deficit of massive stars (Lee et al., 2009; Watts et al., 2018). Old, dormant galaxies also show significant variations of their stellar populations: elliptical galaxies may be dominated by very low mass stars (van Dokkum & Conroy, 2010), while faint diffuse dwarf galaxies have a deficit of low mass stars (Gennaro et al., 2018) when compared to the canonical stellar population (Yan et al., 2017; Jeřábková et al., 2018).
In the following we discuss the properties of DF2 if it were at a shorter distance from Earth, by considering its dynamical ratio and the properties of its GC system. Notably, we seek to illuminate how hard the evidence for a Mpc distance is and how much leeway we have for this dwarf to be at about 10 to 13 Mpc. A particularly important question we seek to touch is which major galaxy (NGC 1052 or NGC 1042) along the line of sight can be the host galaxy to which DF2 is a possible satellite. Can NGC 1052 itself be much closer, such that the NGC 1052, DF2 and possibly DF4 (Sec. 4) system of galaxies might be gravitational bound and at a distance of 10-13 Mpc? The major tension with this suggestion would be the high peculiar velocity such a distance would imply, and so we discuss other precedence cases of correlated galaxy populations which have group radial velocities which deviate from the Hubble flow significantly (Sec. 3.4.2).
3.4.1 Globular cluster population and specific globular cluster frequency
That the distance of DF2 may differ significantly from Mpc is indicated by its ten GCs all being brighter and larger than the GCs of other known galaxies (van Dokkum et al., 2018a). The GC luminosity function of all known galaxies universally peaks at (Rejkuba, 2012), while that of DF2 peaks at for a distance of Mpc. If DF2 were to lie at Mpc, its GCs would appear normally bright and would have radii consistent with normal GCs.
The number of GCs per luminosity of the host galaxy, the specific frequency, is known to increase with decreasing luminosity of the dwarf galaxy for early-type (i.e. dormant) spheroidal galaxies. The specific GC frequency, , is a measure of the number of GCs possessed by a galaxy with absolute V-band magnitude (Elmegreen, 1999; Georgiev et al., 2010; Wu & Kroupa, 2013b).
At Mpc, with GCs and absolute V-band magnitude of (van Dokkum et al., 2018c), DF2 has , which is normal for an early-type dwarf galaxy (Georgiev et al., 2010, figure 3). For the distance range in which DF2 would have normally-bright GCs (, Fig. 6), the absolute V-band magnitude is between and such that is between 48 and 19, respectively. The value is thus compatible with normal late-type dwarf galaxies at both distances (20 and 10 Mpc; fig. 3 in Georgiev et al. 2010).
3.4.2 The systemic line-of-sight velocity of NGC 1052-DF2
The systemic line-of-sight velocity of its GCs is km/s (van Dokkum et al., 2018b) such that if they are bound to DF2 and this velocity were due to the Hubble flow, then Mpc. The NGC 1052-group systemic velocity is km/s, suggesting physical association and a similar distance. Can DF2 nevertheless be a foreground dwarf galaxy with for example Mpc? Trujillo et al. (2019) carried out an analysis of all extant stellar-population related data and showed that these do suggest a much shorter distance (13 Mpc) than previously indicated (20 Mpc). With this revised distance, the galaxy appears to be a rather ordinary low surface brightness galaxy because the luminosity and structural properties of its GCs are similar to those of other galaxies (Section 3.4.3).
The peculiar velocity of DF2 relative to the CMB reference frame would be rather large at Mpc ( km/s, Trujillo et al., 2019). Observationally, such a peculiar velocity is not out of the question in the real Universe as the Local Group of galaxies has km/s (Kogut et al., 1993). Another high-velocity system is the Leo-I group of galaxies, which lies at a distance of Mpc and has a line-of-sight group velocity of km/s, about 300 km/s ahead of the Hubble velocity (Müller et al., 2018). Other examples can be found in the vicinity of the Local Group, where galaxies are receding significantly faster than the Hubble expansion (figure 5 in McConnachie 2012; Pawlowski & McGaugh 2014; Banik & Zhao 2018b).
Systems with km/s are unlikely in a CDM cosmology but very natural in a MOND cosmology (figure 14 of Candlish, 2016). The peculiar velocity of DF2 could have been enhanced if it was flung out by a three-body interaction, perhaps between it, another putative major galaxy at Mpc (e.g. NGC 1042) and a smaller galaxy. If DF2 was flung out away from us, its higher radial velocity than NGC 1052 does not necessarily imply a larger distance. For example, moving at km/s for Myr implies motion by only kpc. NGC 1042 does have a disturbed morphology, suggesting that it was involved in a relatively recent event (van Dokkum et al., 2019a). It is therefore possible that DF2 is an isolated normal dwarf galaxy which by coincidence lies along the line of sight to the NGC 1052 group with a comparable line-of-sight velocity, making it appear extraordinary.
According to Fig. 6, DF2 becomes a normal dwarf galaxy with baryonic mass if (Mateo, 1998; Martin et al., 2008; McConnachie, 2012). In this case, it may be an isolated dwarf galaxy whose MOND velocity dispersion would be km/s, within the 2 confidence range of the observed velocity dispersion of its GCs (Table 1). The high line-of-sight systemic velocity of DF2 could be a chance superposition with NGC 1052 if NGC 1052 is at a distance of 20 Mpc(see Sec. 3.4.4). In this case, a plausible scenario is that DF2 is a normal satellite of NGC 1042, which may be closer to Earth than NGC 1052. At a distance of 13 Mpc, the sky-projected separation of NGC 1042 and DF2 would be only 78 kpc (van Dokkum et al., 2019b, figure 4). However, the EFE of this galaxy is insignificant for the internal dynamics of DF2 since the baryonic mass of NGC 1042 is about one order of magnitude lower than that of NGC 1052.
3.4.3 Implications for the dark matter content of DF2 of a revised distance scale
A fixed implies has no effect on the Newtonian gravity at the effective radius . This is because a fixed angular size implies while a fixed apparent magnitude implies at fixed , thereby causing a cancellation between the changes to and those to under an inverse square gravity law. As equilibrium requires where is the true gravity, any theory uniquely linking and has the property that . This is true even in the presence of an external field because this is independent of , if we assume that remains constant and the mass of the external field’s source also scales as , which is valid for a fixed .
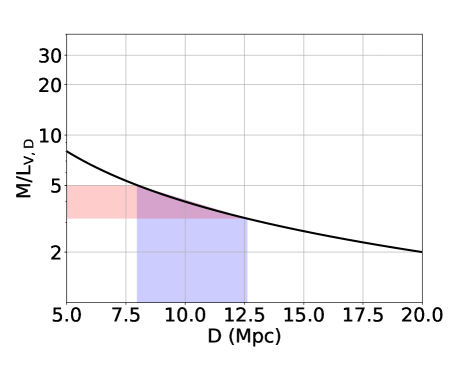
van Dokkum et al. (2018b) calculate the gravitating mass of DF2 to be assuming km/s. From Wolf et al. (2010), where km/s is the line-of-sight velocity dispersion of the GCs in DF2 measured by van Dokkum et al. (2018a), is the effective radius of the GC system and is the angular radius on the sky. If DF2 lies at a distance , then its absolute V-band luminosity becomes , where at a distance of 20 Mpc (van Dokkum et al., 2018b). As they obtained , the mass-to-light ratio in Solar units at distance is
| (11) |
A smaller would imply a smaller luminosity and effective radius. This would increase the V-band dynamical mass-to-light ratio of its GC system for their observed velocity dispersion. Assuming this is 8 km/s, Fig. 6 shows how the Newtonian dynamical ratio changes with distance.
3.4.4 Implications for MOND of a revised distance scale
In general, scaling the distance to all relevant objects by some factor affects the velocity dispersion by because the external and internal gravitational fields remain constant if the values are held fixed (Section 3.4.3). If NGC 1052 is assumed to be at 20 Mpc while DF2 is at 13 Mpc, then DF2 becomes an isolated object. Using , we see that the MOND prediction becomes km/s. Within the 2 confidence range, this is consistent with the here inferred dispersion (Table 1), the km/s measurement of van Dokkum et al. (2018a) and the DF2’s GC velocity dispersion of km/s obtained by Emsellem et al. (2018) based on eleven GCs. The latter workers also studied the velocity dispersion of stars in DF2, inferring a dispersion of km/s. All these values agree with the MOND expectation for an isolated DF2 at 13 Mpc, though the km/s measurement by Danieli et al. (2019) is uncomfortably low for MOND.
However, DF2 need not be isolated if it is 13 Mpc from Earth. The gas-poor nature of DF2 (Chowdhury, 2019; Sardone et al., 2019) suggests that it may be in or was in a galaxy group. A possible candidate host galaxy is NGC 1052, whose distance is far from certain. Theureau et al. (2007) reported a value of Mpc based on the Tully-Fisher relation (Tully & Fisher, 1977). In a MOND context, this relation is a consequence of fundamental physics for isolated systems (Milgrom, 1983b; McGaugh et al., 2000). Thus, it is quite possible that DF2 and NGC 1052 have a similar distance of Mpc.
If we assume that the distance to both NGC 1052 and DF2 is reduced by the same factor, then the numerical results in Section 3.3 can easily be scaled to a lower distance. The main consequence is that the calculated is reduced by a factor of 0.8. The timescales of the simulations and all velocities in them would also be reduced by the same factor, while the mutual separation would be reduced by and the masses by . A 20% reduction in the predicted makes our results even more consistent with observations, especially if these eventually favour the lower value reported by Danieli et al. (2019).
4 NGC 1052-DF4
van Dokkum et al. (2019b) announced the discovery of DF4, a second galaxy lacking dark matter with rather similar properties to DF2 in terms of its size, surface brightness, morphology and distance. They measured the root mean square spread of observed radial velocities as km/s amongst a population of seven luminous globular clusters that extend out to a distance of 7 kpc from the centre of DF4. Taking observational uncertainties into account, they determined an intrinsic velocity dispersion of km/s. Using our analytic formulae for the global one-dimensional line-of-sight velocity dispersion of a non-isolated stellar system lying in the intermediate external field regime (Section 2), we calculate the expected internal velocity dispersion of DF4 in MOND.
4.1 The external field effect of three possible hosts
Since the group environment of DF4 may host several large galaxies, we have to consider the EFE of all influencing galaxies when calculating the MONDian velocity dispersion of DF4. There are three other bright nearby galaxies in the group close to DF4 in terms of their sky positions. These galaxies are NGC 1052, NGC 1042, and NGC 1035 with baryonic masses of (Bellstedt et al., 2018), , and (Müller et al., 2019a), respectively, assuming they are all at a distance of Mpc. To estimate the total baryonic mass of NGC 1042 and NGC 1035 with K-band absolute magnitudes of and , respectively (Skrutskie et al., 2006; Brough et al., 2006), we follow the approach in Müller et al. (2019a). We first convert the K-band luminosities to stellar masses using a ratio of 0.8. Then we add the gas mass using eq. 2 from Di Cintio & Lelli (2016).
We therefore evaluate the MONDian velocity dispersion of DF4 by considering the EFE on it associated to each bright galaxy separately. In reality, the EFE from all three objects should be considered, but this is left to future work (though we briefly touch on this in Section 4.1.4). Here, we only consider the separation between DF4 and its possible host, allowing implicitly the distance, , of DF4 from Earth to be significantly uncertain. The expected dependencies of the internal velocity dispersion of DF4 on between it and NGC 1052, NGC 1042 and NGC 1035 are shown in Figure 7.
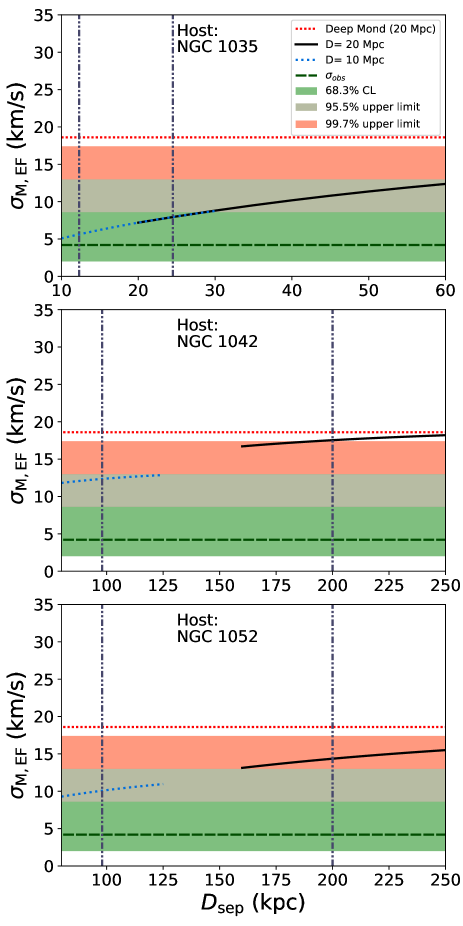
We show the effect of a reduced distance (dotted blue lines) based on halving the distance to all relevant objects. This simply involves redrawing the curves with and (Section 3.4.4). For each assumed distance, the curves start from the corresponding sky-projected separation. We also show dashed vertical lines at , representing the most likely 3D separations.
If DF4 and all three candidate hosts were at a similar distance of Mpc rather than 20 Mpc, its MOND-predicted velocity dispersion would be lower. As a result, the isolated velocity dispersion in the deep-MOND limit would fall from 18.6 km/s to 13.2 km/s in the complete absence of the EFE. Of course, some external field may be present if the object is at Mpc.
4.1.1 NGC 1035
We assume that NGC 1035 and DF4 are at similar distances of Mpc, consistent with the Type II supernova distance to the former of Mpc (Schmidt et al., 1992) or Mpc (Schmidt et al., 1994; Poznanski et al., 2009). The Tully-Fisher distance is smaller ( Mpc, Sorce et al., 2014), but this can be understood if the Tully-Fisher relation (Tully & Fisher, 1977) is a consequence of MOND for isolated galaxies (Milgrom, 1983b). Given the rather low surface brightness of NGC 1035 and the nearby massive galaxies NGC 1042 and NGC 1052, their external fields could reduce the circular velocity of NGC 1035 (Haghi et al., 2016). If the EFE is not accounted for, a 10% reduction in the circular velocity implies that the MOND dynamical mass must be 40% lower. Assuming a fixed , this is possible only for a 20% lower distance, sufficient to explain why the Tully-Fisher distance to NGC 1035 is smaller than the Type II supernova distance by about this amount. The available information thus suggests NGC 1035 to lie at Mpc.
Since DF4’s sky-projected distance from NGC 1035 is only 21 kpc (assuming Mpc), its EFE on DF4 might significantly lower the latter’s internal accelerations (top panel of Figure 7). Although such a small separation is discouraged by lack of tidal features around NGC 1035 and DF4 (Müller et al., 2019b), the two galaxies could plausibly be separated by kpc. This in turn somewhat reduces the MOND expectation for .
If DF4 and NGC 1035 are close to each other, then tidal stability of DF4 could be an issue (see Sec. 4.2). For the moment, we simply mention that at a separation of 60 kpc and distance of 20 Mpc, the EFE from NGC 1035 alone is sufficient to bring the MOND-predicted velocity dispersion of DF4 in agreement with the observed value (van Dokkum et al., 2019b) at the 2-sigma confidence level (top panel of Figure 7). Because a lower distance reduces the predicted velocity dispersion, this improves to 1-sigma agreement if both objects are only 10 Mpc from us and 30 kpc from each other.
4.1.2 NGC 1052
Even if NGC 1035 is nowhere near DF4, its observed velocity dispersion is still rather sensitive to other possible hosts due to the low internal acceleration of DF4. In fact, its internal velocity dispersion is consistent with MOND at the 2-sigma confidence level once we consider the effect of NGC 1052 due to its high mass of at a projected separation of 167 kpc for Mpc. This improves to a 1 agreement if both NGC 1052 and DF4 are only Mpc away and as close as possible to each other.
4.1.3 NGC 1042
The baryonic mass of NGC 1042 is , roughly less than that of NGC 1052. As a result, NGC 1042 has only a small effect on the internal dynamics of DF4, even if they have no line of sight separation (middle panel of Figure 7).
4.1.4 Combined effect of multiple hosts
Considering external fields from all these galaxies (assuming they are all at a similar distance from Earth and form a galaxy group) would perhaps lead to a lower than when considering e.g. NGC 1035 alone. As NGC 1035, NGC 1042 and NGC 1052 are all in a similar direction from DF4, the external fields would add, making this a reasonable approximation in an upcoming project with full MONDian -body simulations.
4.2 Tides from NGC 1035
The tidal radius of DF4 would be rather small if it was indeed only 21 kpc from NGC 1035, which is the minimum consistent with their observed angular separation for a distance of Mpc. In this case, DF4 would be in the process of tidal disruption, contradicting deep imaging data (Müller et al., 2019b, figure 3). The MONDian tidal radius of a mass located at separation from another object of mass is (Zhao, 2005, equation 14)
| (12) |
Given the total baryonic mass of NGC 1035, the minimum tidal radius of DF4 would be about 1.7 kpc assuming a separation of kpc. This is comparable to its observed half-light radius of (van Dokkum et al., 2019b). A larger separation distance kpc from NGC 1035 leads to a larger tidal radius kpc for DF4 such that tides do not affect it very much.
Tides from NGC 1035 would affect DF4 much less if DF4 is at a different distance than NGC 1035. In this case, neither the tidal nor the external field of NGC 1035 would affect DF4. However, our results in this section demonstrate that the EFE from NGC 1052 alone is sufficient to bring in line with observations even if the distance to both is Mpc. The agreement improves further if both DF4 and NGC 1052 are closer to Earth, as long as they are also close to each other. At 10 Mpc, even an isolated DF4 is consistent with MOND at 2. The only problematic case is an isolated DF4 at 20 Mpc, which is just outside the 3-sigma observational upper limit (Figure 7).
5 Conclusions
Using previously conducted -body simulations, we develop a fully analytical formulation of the MOND external field effect. We use this to calculate the velocity dispersion of the GC system of DF2, which we predict to be km/s if MOND is correct. Our analysis of the ten (eleven) observed line of sight velocities of its GCs shows this prediction to be consistent with observations. Our analytical external field effect calculation agrees well with an independent estimation of the MONDian velocity dispersion (Famaey & McGaugh, 2012). We test our analytical results using the first fully self-consistent PoR (Lüghausen et al., 2015) -body models of satellite galaxies orbiting a live host (Section 3.3). These concur with our analytical formulation and suggest that DF2 may be in a deep freeze state, with an even lower velocity dispersion than calculated analytically (Haghi et al., 2009; Wu & Kroupa, 2013a).
Before this can be viewed as a confirmation of MOND, the distance of DF2 is addressed critically (Section 3.4). While it cannot be excluded that DF2 is at the nominal distance of the NGC 1052 group ( Mpc), it is found that it may also be at around half this distance. If this were the case, then DF2 would be a normal dwarf galaxy consistent with MOND and it may even be a normal dSph satellite galaxy. We note here that NGC 1052 may itself be at Mpc (see Sec. 3.4.4)
It is also worth noting that the analysis by van Dokkum et al. (2018b) adopted a very small km/s instead of the value of km/s inferred here from their original data. By including a revised velocity for one of the GCs, van Dokkum et al. (2018a) later corrected the velocity dispersion to km/s, in better agreement with the stellar velocity dispersion (Emsellem et al., 2018) and also with MOND (van Dokkum et al., 2018a). Moreover, van Dokkum et al. (2018b) adopted a high stellar population mass-to-light ratio of rather than the average value typical for such systems (, see fig. 9 of Dabringhausen & Fellhauer, 2016). The distance Mpc adopted by van Dokkum et al. (2018b) may also seem high, given that DF2 becomes a highly unusual galaxy on grounds unrelated to the correct law of gravity. All these choices push the results towards less dark matter and tension with MOND. Here, we have shown that by taking the data at face value and a more conservative theoretical approach, DF2 is consistent with a central MOND prediction, namely the EFE (Milgrom, 1986).
Future observations will need to ascertain if this galaxy is indeed at Mpc and how isolated it is. The null detection of gas in DF2 (Sardone et al., 2019; Chowdhury, 2019) suggests that it resides in a group environment and thus feels a significant external field, independently of the assumed gravity law. Our investigation of the DF2 GCs suggests a normal specific GC frequency with a normal size and brightness, if it lies at a distance of 13 Mpc. A recently claimed detection of the tip of its red giant branch does indeed yield a distance of Mpc (section 4.1 in Trujillo et al., 2019). If the whole NGC 1052 group is at 13 Mpc instead of 20 Mpc, the MOND predicted velocity dispersions should be reduced by 20%, making them more consistent with observations (Section 3.4.4). In this case, the high peculiar velocities of DF2 and of NGC 1052 relative to the CMB are in tension with the standard CDM cosmological model but are well consistent with the velocity field expected in a MONDian universe (figure 14 of Candlish, 2016).
In Section 4, we apply our analytic formalism to the recently discovered DF4 (van Dokkum et al., 2019b). Our analysis shows that the EFE from NGC 1052 could significantly reduce its MOND-predicted . Given their sky-projected separation, the effect could be strong enough to yield consistency with the observed of DF4 (Figure 7). Even better agreement might be reached if one also considers the EFE it experiences from NGC 1035. We note that a lower distance than 20 Mpc further improves the agreement but the EFE from NGC 1042 can have only a small impact (Figure 7). DF2 and DF4 would falsify MOND if these objects are completely isolated. In particular, the km/s velocity dispersion of DF2 reported by Danieli et al. (2019) would rule out MOND at 3 (5) if it lies 13 Mpc (20 Mpc) from Earth.
In a CDM context, the rather low velocity dispersions of DF2 and DF4 suggest that they might be DM-poor tidal dwarf galaxies. In this regard, it is interesting to note that their radial velocities have opposite signs, once the systemic motion of NGC 1052 is subtracted. Thus, they may both be ancient metal-poor tidal dwarf galaxies orbiting NGC 1052 (Recchi & Kroupa, 2015). This is reminiscent of the results obtained by Ibata et al. (2014). The predicted existence of dark-matter-free tidal dwarf galaxies in a CDM universe has been demonstrated conclusively by Haslbauer et al. (2019).
Although DF2 and DF4 seem to contradict MOND at first glance, their velocity dispersions are actually well consistent with MOND expectations once the EFE is included. The EFE is an integral part of MOND that follows directly from its governing equations (Milgrom, 1986). Thus, careful analytical and numerical work is required to judge what MOND really predicts for any individual system. Although not a trivial task, this can in principle be done rather accurately because MOND relies only on the distribution of actually observed baryonic matter.
Finally, it is clear from this discussion that a critical unknown in our understanding of DF2 and DF4 and whether they are associated with NGC 1052 is the distance problem: just how far from us are these galaxies?
Acknowledgements
AHZ and IB are Alexander von Humboldt Fellows. HH is a DAAD visiting scholar. BJ thanks the hospitality of the Stellar Populations and Dynamics Research Group in Bonn and of the AIfA, where this work was done. OM thanks the Swiss National Science Foundation for financial support. XW gives thanks for support from the Natural Science Foundation of China grants numbers 11503025 and 11421303, Anhui Natural Science Foundation grant number 1708085MA20 and the “Hundred Talents Project of Anhui Province”.
References
- Banik & Zhao (2018a) Banik I., Zhao H., 2018a, MNRAS, 473, 419
- Banik & Zhao (2018b) Banik I., Zhao H., 2018b, MNRAS, 473, 4033
- Beers et al. (1990) Beers T. C., Flynn K., Gebhardt K., 1990, AJ, 100, 32
- Bekenstein & Milgrom (1984) Bekenstein J., Milgrom M., 1984, ApJ, 286, 7
- Bellstedt et al. (2018) Bellstedt S., et al., 2018, MNRAS, 476, 4543
- Bose et al. (2018) Bose S., et al., 2018, preprint, Arxiv (arXiv:1810.03635)
- Brough et al. (2006) Brough S., Forbes D. A., Kilborn V. A., Couch W., 2006, MNRAS, 370, 1223
- Bullock & Boylan-Kolchin (2017) Bullock J. S., Boylan-Kolchin M., 2017, Annual Review of Astronomy and Astrophysics, 55, 343
- Caldwell et al. (2017) Caldwell N., et al., 2017, ApJ, 839, 20
- Candlish (2016) Candlish G. N., 2016, MNRAS, 460, 2571
- Chowdhury (2019) Chowdhury A., 2019, MNRAS, 482, L99
- Cole et al. (2012) Cole D. R., Dehnen W., Read J. I., Wilkinson M. I., 2012, MNRAS, 426, 601
- Dabringhausen & Fellhauer (2016) Dabringhausen J., Fellhauer M., 2016, MNRAS, 460, 4492
- Danieli et al. (2019) Danieli S., van Dokkum P., Conroy C., Abraham R., Romanowsky A. J., 2019, ApJL, 874, L12
- Di Cintio & Lelli (2016) Di Cintio A., Lelli F., 2016, MNRAS, 456, L127
- Elmegreen (1999) Elmegreen B. G., 1999, Ap&SS, 269, 469
- Emsellem et al. (2018) Emsellem E., et al., 2018, A&A, accepted
- Famaey & Binney (2005) Famaey B., Binney J., 2005, MNRAS, 363, 603
- Famaey & McGaugh (2012) Famaey B., McGaugh S. S., 2012, Living Reviews in Relativity, 15, 10
- Famaey et al. (2018) Famaey B., McGaugh S., Milgrom M., 2018, MNRAS, 480, 473
- Fosbury et al. (1978) Fosbury R. A. E., Mebold U., Goss W. M., Dopita M. A., 1978, MNRAS, 183, 549
- Geha et al. (2006) Geha M., Blanton M. R., Masjedi M., West A. A., 2006, ApJ, 653, 240
- Gennaro et al. (2018) Gennaro M., et al., 2018, ApJ, 855, 20
- Georgiev et al. (2010) Georgiev I. Y., Puzia T. H., Goudfrooij P., Hilker M., 2010, MNRAS, 406, 1967
- Gunawardhana et al. (2011) Gunawardhana M. L. P., et al., 2011, MNRAS, 415, 1647
- Haghi et al. (2009) Haghi H., Baumgardt H., Kroupa P., Grebel E. K., Hilker M., Jordi K., 2009, MNRAS, 395, 1549
- Haghi et al. (2016) Haghi H., Bazkiaei A. E., Zonoozi A. H., Kroupa P., 2016, MNRAS, 458, 4172
- Haslbauer et al. (2019) Haslbauer M., Dabringhausen J., Kroupa P., Javanmardi B., Banik I., 2019, A&A, accepted
- Hees et al. (2016) Hees A., Famaey B., Angus G. W., Gentile G., 2016, MNRAS, 455, 449
- Hernquist (1990) Hernquist L., 1990, ApJ, 356, 359
- Hoof et al. (2018) Hoof S., Geringer-Sameth A., Trotta R., 2018, preprint, Arxiv (arXiv:1812.06986)
- Ibata et al. (2014) Ibata N. G., Ibata R. A., Famaey B., Lewis G. F., 2014, Nature, 511, 563
- Jerjen & Rejkuba (2001) Jerjen H., Rejkuba M., 2001, A&A, 371, 487
- Jeřábková et al. (2018) Jeřábková T., Hasani Zonoozi A., Kroupa P., Beccari G., Yan Z., Vazdekis A., Zhang Z.-Y., 2018, A&A, 620, A39
- Kogut et al. (1993) Kogut A., et al., 1993, ApJ, 419, 1
- Kroupa (1997) Kroupa P., 1997, New Astronomy, 2, 139
- Kroupa (2012) Kroupa P., 2012, Publications of the Astronomical Society of Australia, 29, 395
- Kroupa (2015) Kroupa P., 2015, Canadian Journal of Physics, 93, 169
- Kroupa et al. (2010) Kroupa P., et al., 2010, A&A, 523, A32
- Kroupa et al. (2013) Kroupa P., Weidner C., Pflamm-Altenburg J., Thies I., Dabringhausen J., Marks M., Maschberger T., 2013, The Stellar and Sub-Stellar Initial Mass Function of Simple and Composite Populations. Springer Science and Business Media Dordrecht, p. 115, doi:10.1007/978-94-007-5612-0_4
- Kroupa et al. (2018) Kroupa P., et al., 2018, Nature, 561, E4
- Laporte et al. (2019) Laporte C. F. P., Agnello A., Navarro J. F., 2019, MNRAS, 484, 245
- Lee et al. (2009) Lee J. C., et al., 2009, ApJ, 706, 599
- Londrillo & Nipoti (2009) Londrillo P., Nipoti C., 2009, Memorie della Societa Astronomica Italiana Supplementi, 13, 89
- Lüghausen et al. (2015) Lüghausen F., Famaey B., Kroupa P., 2015, Canadian Journal of Physics, 93, 232
- Martin et al. (2008) Martin N. F., de Jong J. T. A., Rix H.-W., 2008, ApJ, 684, 1075
- Martin et al. (2018) Martin N. F., Collins M. L. M., Longeard N., Tollerud E., 2018, ApJ, 859, L5
- Mateo (1998) Mateo M. L., 1998, ARA&A, 36, 435
- McConnachie (2012) McConnachie A. W., 2012, AJ, 144, 4
- McGaugh (2016) McGaugh S. S., 2016, ApJl, 832, L8
- McGaugh & Milgrom (2013) McGaugh S., Milgrom M., 2013, ApJ, 775, 139
- McGaugh et al. (2000) McGaugh S. S., Schombert J. M., Bothun G. D., de Blok W. J. G., 2000, ApJ, 533, L99
- Milgrom (1983a) Milgrom M., 1983a, ApJ, 270, 365
- Milgrom (1983b) Milgrom M., 1983b, ApJ, 270, 371
- Milgrom (1986) Milgrom M., 1986, ApJ, 302, 617
- Milgrom (1994) Milgrom M., 1994, ApJ, 429, 540
- Milgrom (1995) Milgrom M., 1995, ApJ, 455, 439
- Milgrom (2009) Milgrom M., 2009, ApJ, 698, 1630
- Müller et al. (2018) Müller O., Jerjen H., Binggeli B., 2018, A&A, 615, A105
- Müller et al. (2019a) Müller O., Famaey B., Zhao H., 2019a, A&A, 623, A36
- Müller et al. (2019b) Müller O., et al., 2019b, A&A Letters, accepted
- Ostriker & Peebles (1973) Ostriker J. P., Peebles P. J. E., 1973, ApJ, 186, 467
- Ostriker & Steinhardt (1995) Ostriker J. P., Steinhardt P. J., 1995, Nature, 377, 600
- Pawlowski & McGaugh (2014) Pawlowski M. S., McGaugh S. S., 2014, MNRAS, 440, 908
- Peebles & Nusser (2010) Peebles P. J. E., Nusser A., 2010, Nature, 465, 565
- Planck Collaboration (2016) Planck Collaboration 2016, A&A, 594, A13
- Poznanski et al. (2009) Poznanski D., et al., 2009, ApJ, 694, 1067
- Recchi & Kroupa (2015) Recchi S., Kroupa P., 2015, MNRAS, 446, 4168
- Rejkuba (2012) Rejkuba M., 2012, Ap&SS, 341, 195
- Sardone et al. (2019) Sardone A., Pisano D. J., Burke-Spolaor S., Mascoop J. L., Pol N., 2019, ApJL, 871, L31
- Schmidt et al. (1992) Schmidt B. P., Kirshner R. P., Eastman R. G., 1992, ApJ, 395, 366
- Schmidt et al. (1994) Schmidt B. P., Kirshner R. P., Eastman R. G., Phillips M. M., Suntzeff N. B., Hamuy M., Maza J., Aviles R., 1994, ApJ, 432, 42
- Skrutskie et al. (2006) Skrutskie M. F., et al., 2006, AJ, 131, 1163
- Sorce et al. (2014) Sorce J. G., Tully R. B., Courtois H. M., Jarrett T. H., Neill J. D., Shaya E. J., 2014, MNRAS, 444, 527
- Theureau et al. (2007) Theureau G., Hanski M. O., Coudreau N., Hallet N., Martin J.-M., 2007, A&A, 465, 71
- Thomas et al. (2018) Thomas G. F., Famaey B., Ibata R., Renaud F., Martin N. F., Kroupa P., 2018, A&A, 609, A44
- Trujillo et al. (2019) Trujillo I., et al., 2019, MNRAS, accepted
- Tully & Fisher (1977) Tully R. B., Fisher J. R., 1977, A&A, 54, 661
- Watts et al. (2018) Watts A. B., Meurer G. R., Lagos C. D. P., Bruzzese S. M., Kroupa P., Jerabkova T., 2018, MNRAS, 477, 5554
- Wolf et al. (2010) Wolf J., Martinez G. D., Bullock J. S., Kaplinghat M., Geha M., Muñoz R. R., Simon J. D., Avedo F. F., 2010, MNRAS, 406, 1220
- Wu & Kroupa (2013a) Wu X., Kroupa P., 2013a, MNRAS, 435, 728
- Wu & Kroupa (2013b) Wu X., Kroupa P., 2013b, MNRAS, 435, 1536
- Wu & Kroupa (2015) Wu X., Kroupa P., 2015, MNRAS, 446, 330
- Yan et al. (2017) Yan Z., Jerabkova T., Kroupa P., 2017, A&A, 607, A126
- Zhao (2005) Zhao H. S., 2005, A&A, 444, L25
- van Dokkum & Conroy (2010) van Dokkum P. G., Conroy C., 2010, Nature, 468, 940
- van Dokkum et al. (2018a) van Dokkum P., et al., 2018a, Research Notes of the American Astronomical Society, 2, 54
- van Dokkum et al. (2018b) van Dokkum P., et al., 2018b, Nature, 555, 629
- van Dokkum et al. (2018c) van Dokkum P., et al., 2018c, ApJl, 856, L30
- van Dokkum et al. (2019a) van Dokkum P., Danieli S., Romanowsky A., Abraham R., Conroy C., 2019a, Research Notes of the American Astronomical Society, 3, 29
- van Dokkum et al. (2019b) van Dokkum P., Danieli S., Abraham R., Conroy C., Romanowsky A. J., 2019b, ApJL, 874, L5
Appendix A The velocity dispersion of NGC 1052-DF2: Is a Gaussian description valid?
The original analysis of DF2’s internal kinematics (van Dokkum et al., 2018b) was based on only ten GCs. It has been shown that such a small sample can lead to significant uncertainties in estimates of the inferred velocity dispersion (Laporte et al., 2019). In Section 3.1, we therefore applied a standard Gaussian analysis to the ten reported data points, including the updated value from van Dokkum et al. (2018a). There, we averaged the error budgets given by van Dokkum et al. (2018b) to obtain the uncertainty of each measurement. For example, GC 59 with radial velocity of km/s was assumed to have a radial velocity of km/s.
One possible objection to our method is that some subsample of the data is unusually clustered in velocity space (i.e. unusually dynamically cold). However, we must bear in mind that when considering over 1000 possible ways of obtaining a subsample from the ten observed GCs, some combinations are bound to yield a much smaller velocity dispersion than that of the underlying population. To illustrate this point, we note that van Dokkum et al. (2018b) argued against a Gaussian distribution of width 10 km/s (near our most likely value) because 6/10 GCs have a radial velocity within km/s of their mean. However, those authors did not mention that there are 210 ways of choosing 6 objects out of 10.
Before considering this in detail, a rough calculation illustrates why such a clustering of radial velocities is not very unlikely. For a Gaussian distribution, the probability of lying within of the mean is 0.31. For this to happen with 6/10 objects has a chance of 0.04 using standard binomial statistics. However, the actual probability is even higher because we have assumed that the aforementioned 6/10 objects have radial velocities within km/s of the true mean, when what is observed is that they are simply within an 8 km/s range of each other.
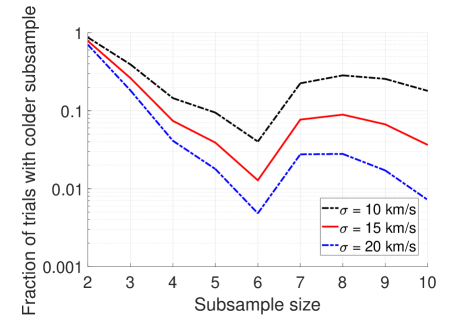
To more rigorously check whether the observed radial velocities are consistent with a Gaussian distribution, we conduct Monte Carlo trials in which each radial velocity follows a normal distribution of width (Equation 10). We then find all subsamples of size . For each , we find the proportion of mock datasets which have a subsample of size that is dynamically colder than the coldest observed subsample of that size. Our results are shown in Figure 9 for three choices of .
At the 99% confidence level, all subsample velocity dispersions are consistent with our model for or 15 km/s (Figure 9). The fact that this is true for indicates that no single object is a statistically significant outlier, casting doubt on the contrary claim of van Dokkum et al. (2018b). Although some tension is apparent for the case when km/s, it must be borne in mind that there is no a priori reason to consider the coldest 6/10 subsample rather than e.g. the coldest 5/10 or 7/10. Given that over 1000 distinct subsamples can be drawn from 10 objects but only 210 of these subsamples have size , it is clear that there are significant ‘look elsewhere’ effects which we do not take into account. Thus, the probabilities shown in Figure 9 must be considered underestimates. Even if they are taken at face value, it is clear that there is no compelling reason to reject our standard assumptions, at least if is within the 68% confidence interval suggested by our analysis (Figure 4). Thus, an intrinsic velocity dispersion of 14 km/s is entirely consistent with all available observations and also with MOND, as demonstrated in this work using analytic and numerical methods.
For future reference, Table 1 shows the 1, 2 and 3 sigma confidence intervals of the velocity dispersion as derived here from the 10 GC data points in van Dokkum et al. (2018a), updating the data in van Dokkum et al. (2018b).