22email: meisner@theochem.uni-stuttgart.de 33institutetext: Kapteyn Astronomical Institute, University of Groningen, The Netherlands
33email: kamp@astro.rug.nl 44institutetext: Max Planck Institute for Extraterrestrial Physics, Gießenbachstrasse 1, 85741 Garching, Germany
The role of atom tunneling in gas-phase reactions in planet-forming disks
Abstract
Context. Gas-phase chemical reactions of simple molecules have been recently revised to include atom tunneling at very low temperatures. This paper investigates the impact of the increased reaction rate constant due to tunneling effects on planet-forming disks.
Aims. Our aim is to quantify the astrophysical implications of atom tunneling for simple molecules that are frequently used to infer disk structure information or to define the initial conditions for planet (atmosphere) formation.
Methods. We quantify the tunneling effect on reaction rate constants by using H2 + OH H2O + H as a scholarly example in comparison to previous UMIST2012 rate constants. In a chemical network with 1299 reactions, we identify all chemical reactions that could show tunneling effects. We devise a simple formulation of reaction rate constants that overestimates tunneling and screen a standard T Tauri disk model for changes in species abundances. For those reactions found to be relevant, we find values of the most recent literature for the rate constants including tunneling and compare the resulting disk chemistry to the standard disk model(s), a T Tauri and a Herbig disk.
Results. The rate constants in the UMIST2012 database in many cases already capture tunneling effects implicitly, as seen in the curvature of the Arrhenius plots of some reactions at low temperature. A rigorous screening procedure identified three neutral-neutral reactions where atom tunneling could change simple molecule abundances. However, by adopting recent values of the rate constants of these reactions and due to the layered structure of planet-forming disks, the effects are limited to a small region between the ion-molecule dominated regime and the ice reservoirs where cold ( K) neutral-neutral chemistry dominates. Abundances of water close to the midplane snowline can increase by a factor of two at most compared to previous results with UMIST2012 rates. Observables from the disk surface, such as high excitation ( K) water line fluxes, decrease by 60% at most when tunneling effects are explicitly excluded. On the other hand, disk midplane quantities relevant for planet formation such as the C-to-O ratio and also the ice-to-rock ratio are clearly affected by these gas-phase tunneling effects.
Key Words.:
astrochemistry; Protoplanetary disks; Stars: low-mass; Infrared: planetary systems1 Introduction
Observations and modeling of molecules are relevant in order to obtain a chemical inventory in space and to derive physical conditions in astrophysical environments. For example, the HEXOS program, a Herschel/HIFI key program (Bergin et al., 2010), revealed the chemical inventory of the Orion and Sagittarius B2 star forming regions. The team identified complex organic species such as methanol (CH3OH), hydrogen cyanide (HCN), and methyl cyanide (CH3CN), among others, which are thought to be precursors of amino acids (Crockett et al., 2014). On the other hand, we can use the line emission of more simple species to learn about the physical conditions in space, for example the fine structure and molecular lines observed towards the dark cloud core Barnard 5 (Bensch, 2006). Comparing the line ratio [C i]/CO J=3-2 with models of a 1D spherical grid of the photodissociation region can give us an estimation of the total mass and density of the region close to the central core. Other examples are interferometric measurements of CO submm lines in protoplanetary disks that yield the radial extent of the molecular gas disk (Isella et al., 2007), and CN lines that can probe the vertical structure (e.g., flaring and UV penetration) of planet-forming disks (Cazzoletti et al., 2018; van Zadelhoff et al., 2003).
To assist the quantitative interpretation of such astrophysical observations, extensive chemical modeling is often performed using large databases of chemical reaction rates such as the UMIST Database for Astrochemistry 2012 (UMIST2012) (McElroy et al., 2013), the Kinetic Database for Astronomy (KIDA) (Wakelam et al., 2012), or the Ohio State University (OSU) database (e.g., Harada et al., 2010). The data in these first two compilations are regularly reviewed and updated. However, these data are often based on experimental work carried out in a finite temperature range. Cryogenic temperatures are often hard to access in the laboratory as the rate constants become too small to be measured precisely as reactants freeze out and unwanted reactions with surfaces of the experimental setting take place. Hence, computational methods gain increasing importance when trying to accurately assess chemical reactivity (Meisner & Kästner, 2016a; Biczysko et al., 2018). Despite explicit warnings (Woodall et al., 2007; Wakelam et al., 2012) extrapolation to lower temperatures is performed frequently, often using Arrhenius-type formulas.
In the last decades, the accuracy of rate constants obtained by means of computational methods has increased significantly, in particular at low temperatures where quantum mechanical effects can become relevant (see Wiesenfeld et al., 2016, for a recent white paper on these advancements). One nuclear quantum effect we want to address in this paper is the tunneling effect, also referred to as quantum tunneling. Caused by the wave particle dualism, the quantum mechanical tunneling describes the effect that a particle can penetrate a potential energy barrier the particle could classically not overcome. In general, quantum tunneling plays a role in various fields of physics. In chemistry, the tunneling of atoms through a potential energy barrier can allow reactivity even in cases where it would classically be forbidden. Examples can be found in biochemistry, molecular catalysis, and surface science (see Meisner & Kästner, 2016a, for a recent review). For an overview of the importance of atom tunneling for astrochemical surface reactions, we refer to the review by Hama & Watanabe (2013).
The tunnel effect contributes considerably to the rate constants of chemical reactions, both in the gas phase and on ice surfaces. Prime examples for surface reactions enhanced by atom tunneling are hydrogen atom additions to unsaturated chemical compounds. The subsequent hydrogenation of CO to formaldehyde and finally to methanol (Hidaka et al., 2009; Andersson et al., 2011; Goumans, 2011) is one of the most prominent examples. The addition of hydrogen atoms to graphite surfaces or polycyclic aromatic hydrocarbons (PAHs) is assumed to be an intermediate step in the formation of H2 (Goumans & Kästner, 2010; Wakelam et al., 2017). In addition to these instances, water formation was shown to be enhanced by atom tunneling on ice surfaces by Oba et al. (2012).
In the gas phase, atom tunneling can play an important role in the formation of complex organic molecules (COMs) and can, for example, change the results of kinetic models qualitatively. For instance, the rate constants of some cryogenic reactions even increase with further lowering the temperature, see below (Shannon et al., 2013; Álvarez Barcia et al., 2016). As light 1H (protium) atoms are more likely to undergo the tunneling process than 2D (deuterium) atoms, hydrogen abstraction of COMs is more likely than deuterium abstraction, for example leading to a deuterium enrichment of methanol (Goumans & Kästner, 2011).
The tunneling probability of a particle depends on the width of the barrier, on the mass of the tunneling particle, and on the height of the potential energy barrier. A suitable estimate on the relevance of atom tunneling for a particular reaction is the crossover temperature , which can be obtained easily by current computational methods. The crossover temperature depends on the shape of the potential energy barrier, more precisely on the negative curvature along the reaction path in mass-weighted Cartesian coordinates, ,
| (1) |
where is Boltzmann’s constant and is Planck’s constant, The crossover temperature can be understood as the temperature below which atom tunneling is more likely than the classical transition. For most hydrogen atom or proton transfer reactions, the crossover temperature is between 100 K and 300 K, while is rarely above 150 K when the motion of heavier atoms is involved.
Classically, the reaction rate constant decreases with decreasing temperature for an elementary reaction. When the classical over-the-barrier reaction dominates, the Arrhenius plot, which is the plot of the logarithmic reaction rate constant against the inverse of the temperature, is expected to decrease linearly (see Fig. 1). However, at lower temperatures the Arrhenius plot becomes curved due to a non-negligible contribution of atom tunneling (Meisner & Kästner, 2016a). At very low temperatures, tunneling can occur from a single quantum state leading to a temperature-independent rate constant (Zuev et al., 2003).
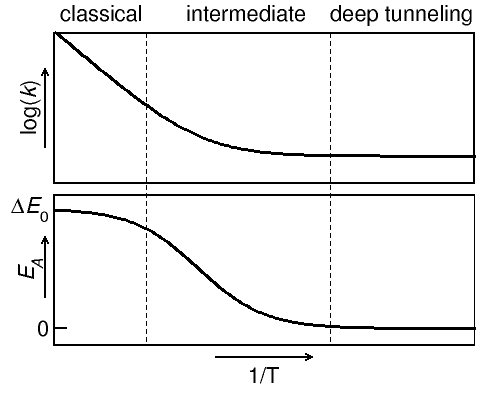
The slope of the Arrhenius plot is assigned to be proportional to the activation barrier of a chemical reaction :
| (2) |
Following Tolman, the activation energy can also be understood as the average energy of the molecules reacting minus the average energy of all reactant molecules (Tolman, 1920; Truhlar, 1978). The activation energy in general depends on the temperature and in nearly all cases decreases towards lower temperatures, implying a positive curvature, i.e.,
| (3) |
even though some convex exceptions exist, as described in Truhlar & Kohen (2000).
The activation energy, however, is not directly related to the potential energy barrier or the adiabatic reaction barrier (which is the zero-point corrected potential energy barrier) as prominent examples will demonstrate later. At higher temperatures, when there is enough energy for the particles to overcome the potential energy barrier and react classically, the activation barrier can be quite close to the adiabatic reaction barrier . When nuclear quantum effects are more important (e.g., at lower temperatures) this is no longer the case. As described above, the temperature regimes differ from reaction to reaction (Meisner & Kästner, 2016a).
In astrochemistry, the modified Arrhenius equation (Parenthesis now added)
| (4) |
is used for chemical modeling. Here, the parameters , , and are obtained by fits to either experimental measurements or from accurate computations. In contrast to the physical interpretations of and discussed above, , , and are merely fitting parameters without any physical meaning and are only applicable for the temperature regime the original data stem from, while extrapolation should in general be avoided. Although Eq. (4) looks similar to the Eyring equation, effects which are not covered in classical Eyring theory are implicitly included in the data forming the basis for the fit, and thus are implicitly included in the fitting parameters , , and . In particular, the value of is in most cases lower than the adiabatic energy barrier when fitted at moderate temperatures, due to atom tunneling.
A nice example where and can be accidentally mixed up is the reaction
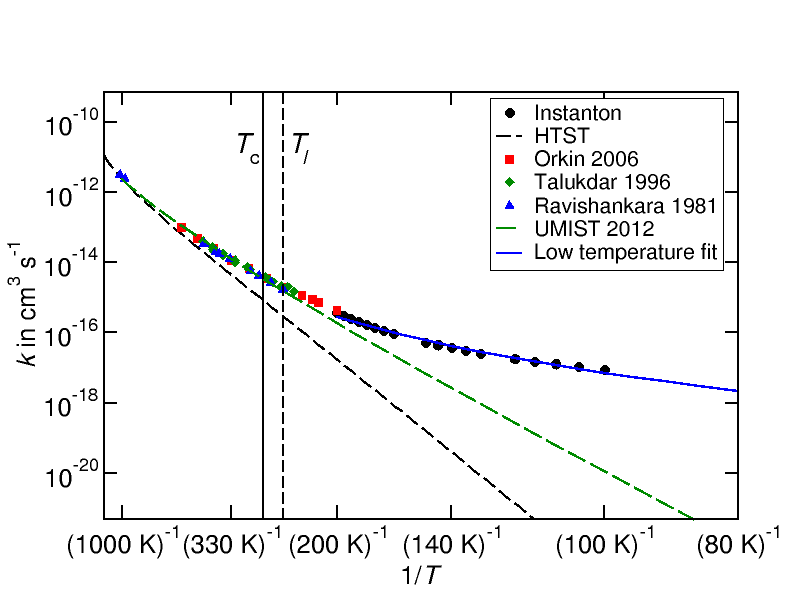
In this radical neutral-neutral reaction, a hydrogen atom is transferred from the hydrogen molecule forming water and a remaining H atom. For this reaction, atom tunneling sets in at comparably high temperatures; the crossover temperature is approximately 276 K, indicating a rather sharp potential energy barrier (Meisner & Kästner, 2016b). However, atom tunneling affects the reaction rate constants at temperatures as high as 500 K, which can be recognized by the noticeable curvature in Fig. 2 and the deviation of the experimental values from the rate constants calculated with harmonic transition state theory (HTST), which uses quantum mechanical expressions for the translational, rotational, and vibrational partition function (thus including zero-point energy), but does not include atom tunneling. It is therefore perfectly suited to monitoring the influence of atom tunneling on reaction rate constants. Details of the calculations can be found in Meisner & Kästner (2016b).
Due to the importance of atom tunneling for this reaction, the experimentally observed activation energy of approximately 2000 K (depending on the temperature region where the values are taken) deviates significantly from the potential and adiabatic energy barriers of 2700 K and 2900 K, respectively. This mix-up leads to some confusion about the actual barrier height (Meisner et al., 2017). In UMIST, K, implicitly covering the effect of atom tunneling, although underestimating it at cryogenic temperatures.
Another example reaction where the value of is not related at all to the adiabatic energy barrier is the hydrogen atom transfer reaction NH + H NH + H, (Smith & Adams, 1981; Herbst et al., 1998; Álvarez Barcia et al., 2016), which possesses a strongly stabilized pre-reactive complex leading to a positive slope of the Arrhenius plot at cryogenic temperatures (Shannon et al., 2013), and therefore K in the UMIST2012 database. However, the adiabatic energy barrier of this reaction is K.
As discussed above, atom tunneling is an important feature of chemical kinetics in both gas-phase and solid-phase reactions. In this work, we focus on the atom tunneling effect of gas-phase reactions, the modified reaction rate constants, and the impact on protoplanetary disks. This is a good starting point to elucidate the relevance of atom tunneling for a particular astrophysical environment being distinct from dense clouds, for example. Furthermore, properly including atom tunneling in surface reactions would also need to take atom tunneling into account for diffusion processes (Oba et al., 2012), which is clearly beyond the scope of this work.
In this work, the influence of the tunnel effect on gas-phase reactions in planet-forming disks is studied systematically. This paper does not assess the quality of the UMIST2012 database or the accuracy of the disk models, but focuses on the influence of quantum tunneling on the whole kinetic model. It is, to the best of our knowledge, the first study of the impact of the tunneling effect on a large chemical reaction network, rather than atom tunneling in just one specific reaction.
The paper is structured as follows. In Sect. 2 we describe the underlying disk models including the procedure used to select chemical reactions that could show tunneling effects. We also describe the methodology of our analysis. In Sect. 3 we present the influence of the quantum mechanical tunnel effect on the molecular composition of planet-forming disks, based on the systematically varied Arrhenius parameters for the different chemical reactions. We also present the species densities and line fluxes. In Sect. 4 we discuss the astrophysical implications of the results reported here, and in Sect. 5 we present our conclusions.
2 Methods
To elucidate the importance of atom tunneling for gas-phase chemistry in the environment of planet-forming disks, we calculated reaction rate constants of the water forming reaction H2 + OH H2O + H without any atom tunneling and compare that to the UMIST2012 database (McElroy et al., 2013, see below for technical details).
In the recent literature, rate constants for some chemical reactions have been calculated using the semi-classical instanton theory. These rate constants can be considered reasonably accurate and sufficiently precise to be used in quantitative kinetic models. We used rate constants for the reactions of H2 + OH H2O + H (Meisner & Kästner, 2016b), CH4 + OH CH3 + H2O (Lamberts et al., 2017), and CH4 + H CH3 + H2 (Beyer et al., 2016).
More chemical reaction rate constants with comparable or even better accuracy may exist in the literature. However, a complete literature review of all chemical reactions is not feasible, and hence we perform here first a screening to identify additional reactions where atom tunneling might be important. We then perform an exhaustive screening of those reactions using planet-forming disk models as astrophysical environments. For the reactions where the screening actually identifies large effects of tunneling on species abundances, recent literature values are looked up, compared to the UMIST2012 database, and used in a comparative disk simulation.
2.1 No tunneling
We used the reaction rate constants of the reaction of
calculated with HTST by Meisner & Kästner (2016b). The fit of the modified Arrhenius equation (4) gives
| (5) |
for the reaction rate constants in absence of atom tunneling. It should be noted that the value of = 2791.0 K is closer to the adiabatic energy barrier of 2913 K (Meisner & Kästner, 2016b) than to the UMIST2012 value of 1736 K.
At around 500 K, the experimental rate constant is already a factor of 5 higher than the rate constant obtained by HTST. At 200 K, this ratio increases to 13 at 200 K and is expected to be several orders of magnitude higher at K. The differences of the rate constants are shown in Fig. 2. The values of the HTST calculations are from Meisner & Kästner (2016b).
2.2 Screening of chemical reactions that might be influenced by atom tunneling
2.2.1 Creation of the list of reactions
We used the small chemical network with 100 species and 1299 reactions from Kamp et al. (2017) to identify chemical reactions that could show effects of H-tunneling using the following criteria:
-
•
The reaction is neutral-neutral or ion-neutral. Other types of reactions do not involve a simple ground-state over-the-barrier kinetics, and therefore make it difficult to distinguish the tunnel effect from other nonclassical effects.
-
•
The reaction does not involve excited molecular hydrogen (H2exc) as a reactant or product.
-
•
¿ 0 K, which implies that there is a potential energy barrier. As discussed above, the fitting parameter does not directly relate to a barrier height. A negative value of leads to an increase in reaction rate constants at very low temperatures. This behavior can be observed for molecules with a strongly pronounced pre-reactive complex in combination with a significant contribution of atom tunneling, like that in the reaction of OH radicals with methanol (see Shannon et al. 2013). A simple modification like the one we perform for this screening is therefore not sufficient to estimate the rate constants at very low temperatures, and would even underestimate them. Furthermore, the value of is affected by atom tunneling, and thus the biggest contribution is already incorporated in the fitting parameters provided by UMIST. This means that reactions with do not serve as a suitable test set for our study. It is, however, strongly recommended to further investigate these reactions.
-
•
¡ K, since these reactions can be assumed to posses relatively high potential energy barriers. These reactions are instead related to the field of combustion chemistry where the effect of atom tunneling is negligible due to the high temperature. It can be assumed that atom tunneling has just a marginal influence on the reaction rate constants, if they are even measurable or computable. However, high values of might also occur in cases of endothermic reactions.
-
•
The reaction transfers one single hydrogen atom or proton as the tunnel effect depends strongly on the mass of the transferred particles and hydrogen is the lightest chemical element. The tunneling effect is therefore expected to have a larger impact than heavier atoms have, even though carbon tunneling also influences reactivity (Zuev et al. (2003); Borden (2016))
-
•
More than one product is formed. Otherwise, the excess energy resulting from the chemical reaction leads to the destruction of the product molecule.
-
•
: a negative value of , i.e., a negative curvature of the Arrhenius plot indicates that other dynamic effects dominate the reaction kinetics. Atom tunneling plays a minor role for these reactions.
Applying these criteria to the rate network yields 47 reactions that perhaps show a significant speed-up by atom tunneling: 43 of these reactions are neutral-neutral reactions, 4 are of ion-neutral. As the UMIST2012 data base is focused on gas-phase reactions, no surface reactions are considered.
2.2.2 Modification of the Arrhenius plots
In order to estimate the impact of the effect, we use a simple ad hocapproach assuming that the original rate constant stays constant below a threshold temperature, thus breaking the original Arrhenius plot into two temperature regimes. Based on the experience of the reactions where tunneling corrected rate constants are available (reactions 1-3), we set the threshold temperature to K. For temperatures above 250 K, we keep the original UMIST2012 rate constant, and for the low-temperature part we use the rate constant of 250 K. This approach is presented in Fig. 3 for one example reaction. It is quite likely that this approach overestimates the tunnel effect; however, it is a suitable probe that can determine for which reactions atom tunneling might be relevant.
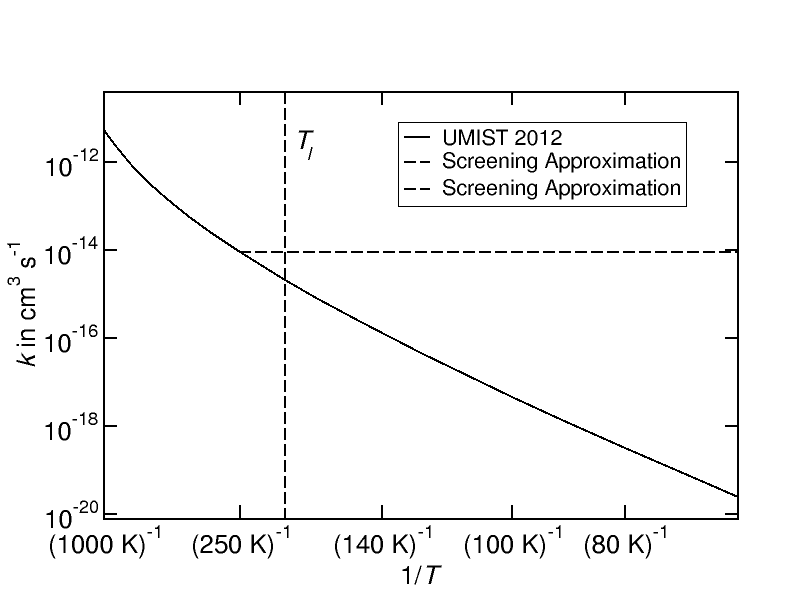
For most chemical reactions, the rate constant still decreases at these temperatures and the rate constants do not become temperature independent until very low temperatures. Therefore, this approximation can be assumed to overestimate the influence of atom tunneling on the rate constants. However, the approach is promising for the identification of reactions where tunneling could be important.
Table 1 shows which rate constants were modified for the screening experiment. For the screening, the standard disk around a young T Tauri star was used (Woitke et al., 2016). After the screening, a literature search was performed to check if the rate constants used in the UMIST2012 database already include atom tunneling appropriately. The chemical reactions identified via the screening where atom tunneling might be important are shown in Table 2.
| No. | Reaction | ||||||
|---|---|---|---|---|---|---|---|
| 4 | C | + | NH | N | + | CH | |
| 5 | CH2 | + | CH2 | CH3 | + | CH | |
| 6 | CH2 | + | CH4 | CH3 | + | CH3 | |
| 7 | CH2 | + | CN | HCN | + | CH | |
| 8 | CH2 | + | O | OH | + | CH | |
| 9 | CH2 | + | OH | H2O | + | CH | |
| 10 | CH2 | + | OH | O | + | CH3 | |
| 11 | CH3 | + | CH3 | CH4 | + | CH2 | |
| 12 | CH3 | + | CN | HCN | + | CH2 | |
| 13 | CH3 | + | H2O | OH | + | CH4 | |
| 14 | CH3 | + | NH3 | CH4 | + | NH2 | |
| 15 | CH3 | + | OH | CH4 | + | O | |
| 16 | CH3 | + | OH | H2O | + | CH2 | |
| 17 | CH4 | + | CN | HCN | + | CH3 | |
| 18 | CH | + | HCO | CO | + | CH2 | |
| 19 | CH | + | N | NH | + | C | |
| 20 | CH | + | O | OH | + | C | |
| 21 | H2 | + | CH2 | CH3 | + | H | |
| 22 | H2 | + | CH3 | CH4 | + | H | |
| 23 | H2 | + | CH | CH2 | + | H | |
| 24 | H | + | CN | HCN | + | H | |
| 25 | H2 | + | NH | NH2 | + | H | |
| 26 | H | + | O | OH | + | H | |
| 27 | H | + | CH3 | CH2 | + | H2 | |
| 28 | H | + | CH | C | + | H | |
| 29 | H | + | H2O | OH | + | H2 | |
| 30 | H | + | NH2 | NH | + | H2 | |
| 31 | H | + | NH | N | + | H2 | |
| 32 | H | + | OH | O | + | H2 | |
| 33 | N | + | HCO | CO | + | NH | |
| 34 | NH3 | + | H | NH2 | + | H2 | |
| 35 | NH | + | H | NH | + | OH | |
| 36 | NH2 | + | CH4 | CH3 | + | NH3 | |
| 37 | NH2 | + | OH | NH3 | + | O | |
| 38 | NH | + | CH4 | CH3 | + | NH2 | |
| 39 | NH | + | CN | HCN | + | N | |
| 40 | NH | + | OH | NH2 | + | O | |
| 41 | O | + | CH | OH | + | CH | |
| 42 | O | + | H2O | OH | + | OH | |
| 43 | O | + | NH3 | OH | + | NH2 | |
| 44 | OH | + | CN | HCN | + | O | |
| 45 | OH | + | HCN | CN | + | H2O | |
| 46 | OH | + | NH3 | H2O | + | NH2 | |
| 47 | OH | + | OH | H2O | + | O | |
| 48 | H2 | + | C+ | CH+ | + | H | |
| 49 | H2 | + | N+ | NH+ | + | H | |
| 50 | H | + | CH | CH+ | + | H2 | |
| 51 | H | + | CH | CH | + | H2 | |
2.3 Planet-forming disk models
We use the thermo-chemical disk modeling code ProDiMo (Woitke et al., 2009a; Kamp et al., 2010; Thi et al., 2011; Aresu et al., 2012) to calculate the chemistry in steady state in a standard disk around a young T Tauri star and a young Herbig Ae star. The disks have very different geometries and central stars and thus provide two complementary environments to study the effects of atom tunneling in disks. The basic physical model structure is described for the T Tauri disk in Woitke et al. (2016) and for the Herbig disk in Tilling et al. (2012). We repeat here only some of the key features of the two models. The dust temperatures and the local radiation field are calculated from 2D radiative transfer using the standard DIANA dust opacities (Min et al., 2016). We keep the underlying density and temperature structure of the reference models fixed when changing individual reaction rate constants. The computational grid is 90x90 (radial versus vertical points).
The chemical rate constants are taken primarily from the UMIST2012 database (McElroy et al., 2013), but photorates are calculated using the local radiation field and cross sections from the Leiden database (van Dishoeck et al., 2008) and reactions of excited H2 (Kamp et al., 2017). In the screening, we restrict ourselves to the small chemical network with 100 species and 1299 reactions described by Kamp et al. (2017). In the subsequent study with updated rate constants from the literature, we use the large chemical network with 235 species and 3167 reactions. It is important to note that we generally extrapolate rate constants beyond the temperature range of validity except for lower temperatures in the case of negative or higher temperatures for positive (this would lead to a divergence of the rate constant).
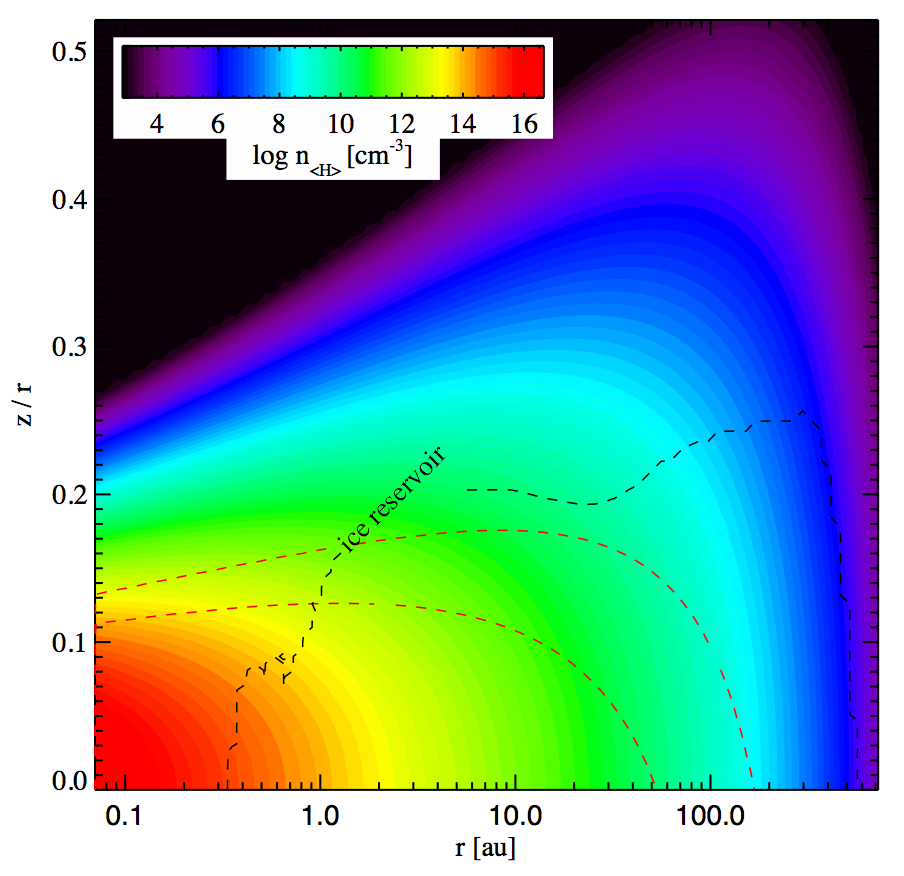
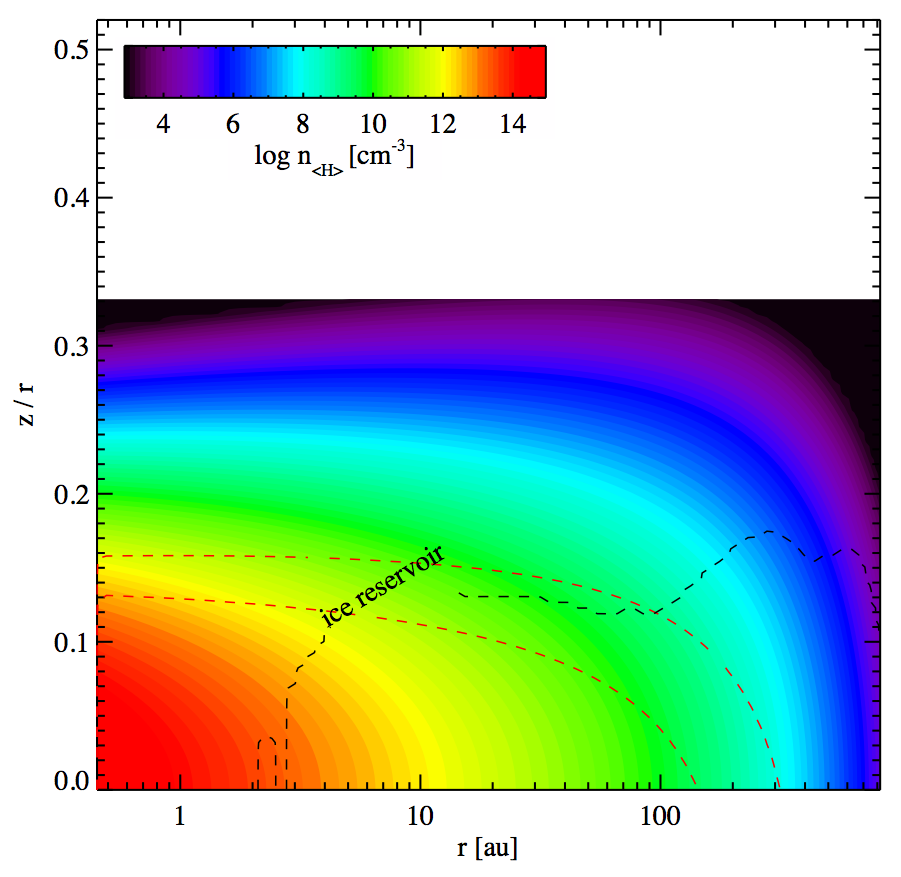
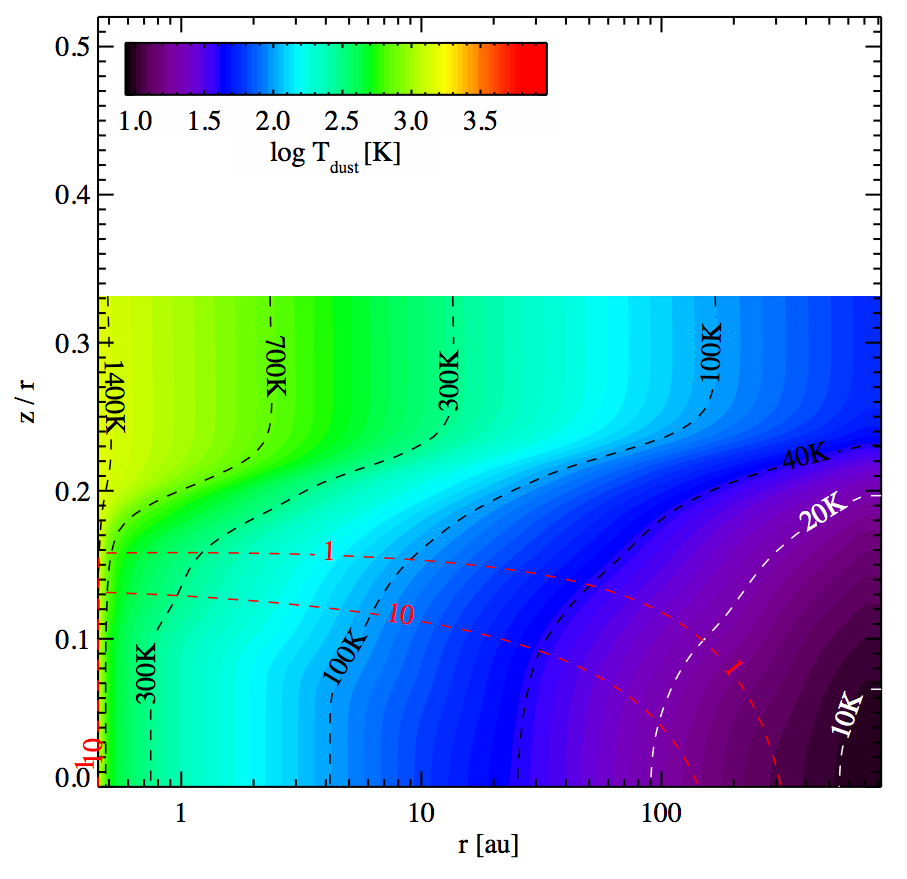
Since we focus here entirely on gas-phase chemistry, we exclude for the remainder of the work the ice reservoir of the disk. To identify the location of the ice reservoir we locate regions where at least one monolayer of ice has been deposited on the grain surfaces. These regions are subsequently excluded in the analysis of differences in species abundances.
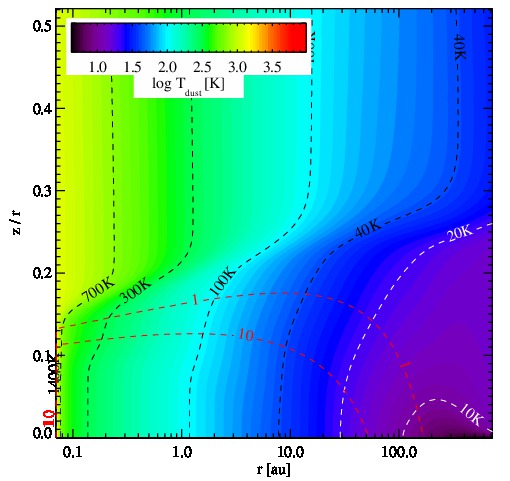
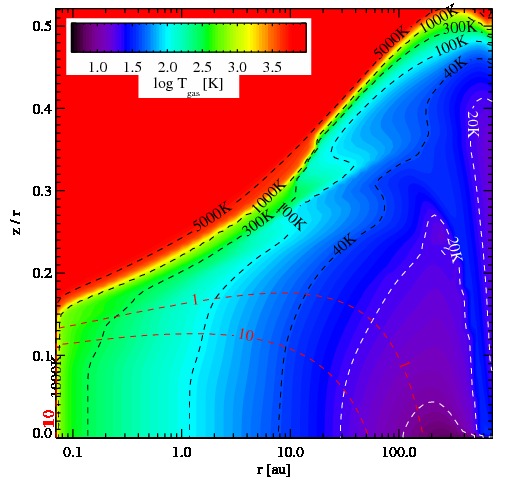
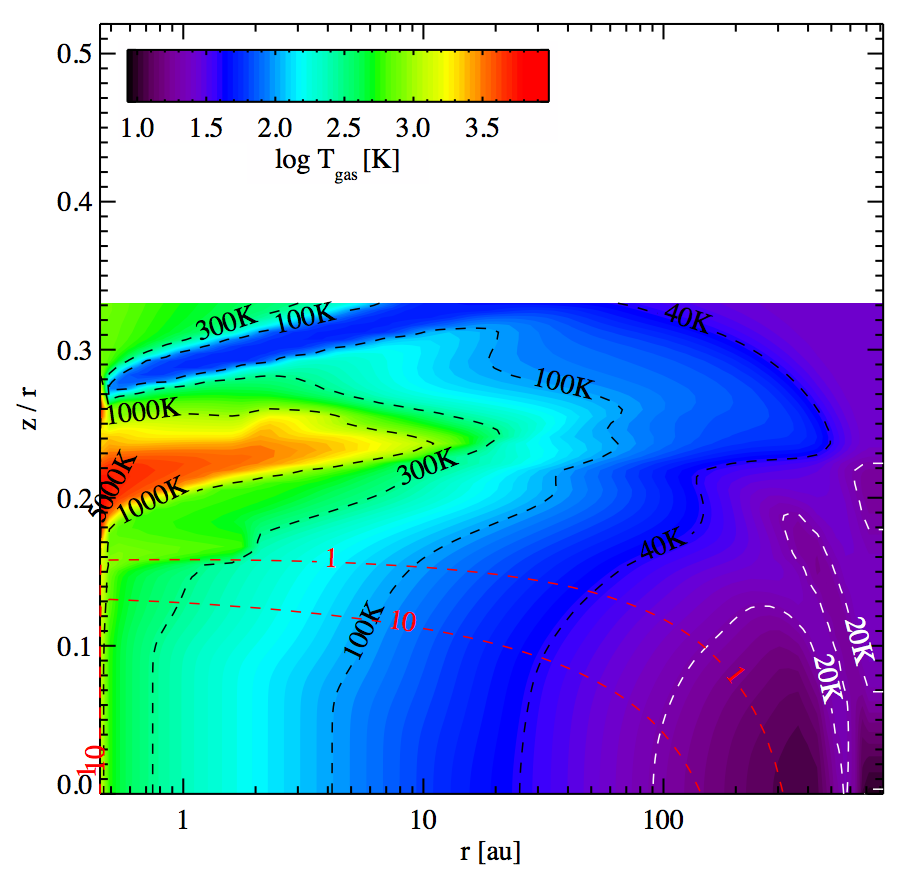
Figure 4 shows the density and temperature (dust and gas) structure of the two reference models. The T Tauri disk model shows a flaring structure: the height of the dashed contour increases with distance from star . In the disk atmosphere above gas and dust temperatures decouple; below the disk model is vertically isothermal. The Herbig disk model on the other hand has a flat surface, i.e., the disk is not strongly flaring. Above the contour the temperature regime interesting for tunneling in the gas phase ( K) is more radially extended than in the T Tauri disk model; at lower temperatures water freezes out and above 250 K tunneling is not important.
2.4 Identification of the importance of a chemical reaction
We take a previously published reference model and then study the impact of individually changed reaction rate constants on the steady-state chemistry by comparing abundances of all species (, where is the total hydrogen number density) to those of a reference model
| (6) |
We evaluate the distribution function of abundance differences and flag a rate if the distribution is wider than the numerical noise. Since we restrict ourselves to the study of gas-phase reaction rates, we exclude the ice reservoir (as defined in Sect. 2.3) from further analysis.
As a second step, we study the impact of those changes on the emission line fluxes using a set of standard lines of various ionic/atomic/molecular species (e.g., atomic fine structure lines, rotational lines of H2, CO, OH, H2O, HCO+, N2H+) across a wide wavelength range (optical to submm). We use the same 56 standard lines as Kamp et al. (2017). If a reaction is found to have significant changes on species abundances, we also investigate the resulting changes in line fluxes with respect to the standard model.
2.5 Arrhenius fits
To obtain a more reliable and meaningful result, we fitted the parameters of the modified Arrhenius equation (Eq. 4) for reactions [1], [2], and [3] and for the reactions where the screening showed a significant change in species abundances (see the above-mentioned criteria). Again, a two-segment Arrhenius plot is constructed, divided by a reaction-dependent threshold temperature . Below the Arrhenius parameters are fitted to the literature values obtained by quantum chemistry. The fits were performed using the nonlinear least-squares (NLLS) Marquardt–Levenberg algorithm implemented in gnuplot v 5.0 (Williams et al., 2013). For the high-temperature regime, i.e., for , the UMIST2012 values were used.
As the instanton rate constants close to the crossover temperature are overestimated, we use the values below for the fitting of the modified Arrhenius parameters for the reactions [1], [2], and [3]. For the other reactions, a literature survey for the corresponding low-temperature rate constants is performed. For these reactions, the threshold temperatures listed in Table 2 were used. If the two rates do not match at the intersection , ProDiMo performs a weighted average to ensure a smooth rate constant.
3 Results
To investigate the influence of the tunneling effect, we first present results from a pilot study on the reaction H2 + OH H2O + H [1] comparing the species densities in a T Tauri disk model using the rate constants calculated without tunneling to those using the rate constants from the UMIST2012 database. We next present which of the 47 reactions that are susceptible to tunneling (Table 1) cause major deviations in the species densities in the T Tauri disk model. For these reactions, we present here rates collected from the literature. In the last step, we perform a detailed comparison between the species densities from disk models calculated with the revised literature rates and instanton theory (Table 2) and those calculated with UMIST2012 rates.
3.1 Influence of tunneling in the reaction H2 + OH H2O + H on disk models
We use the rate constants for this reaction calculated in the absence of tunneling (Sect. 1) and compare the results for a T Tauri disk model to those of the same disk model using the original UMIST2012 values of the rate constants.
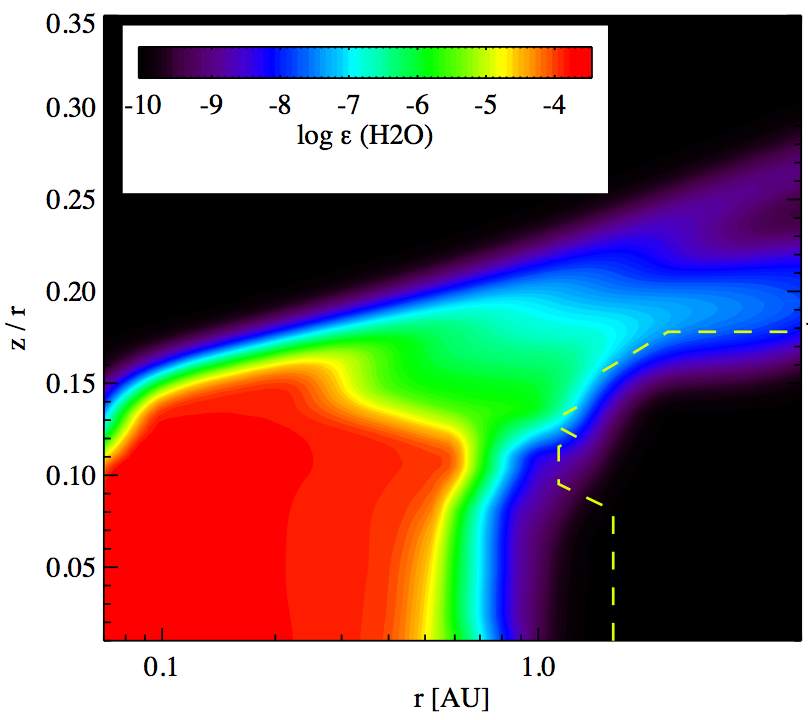
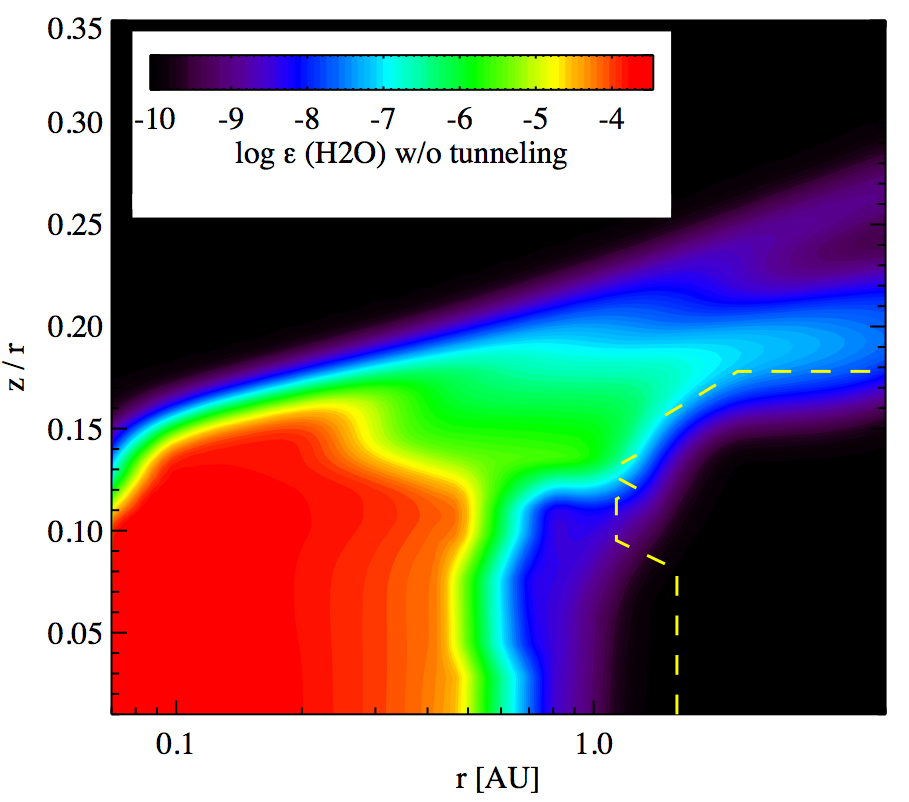
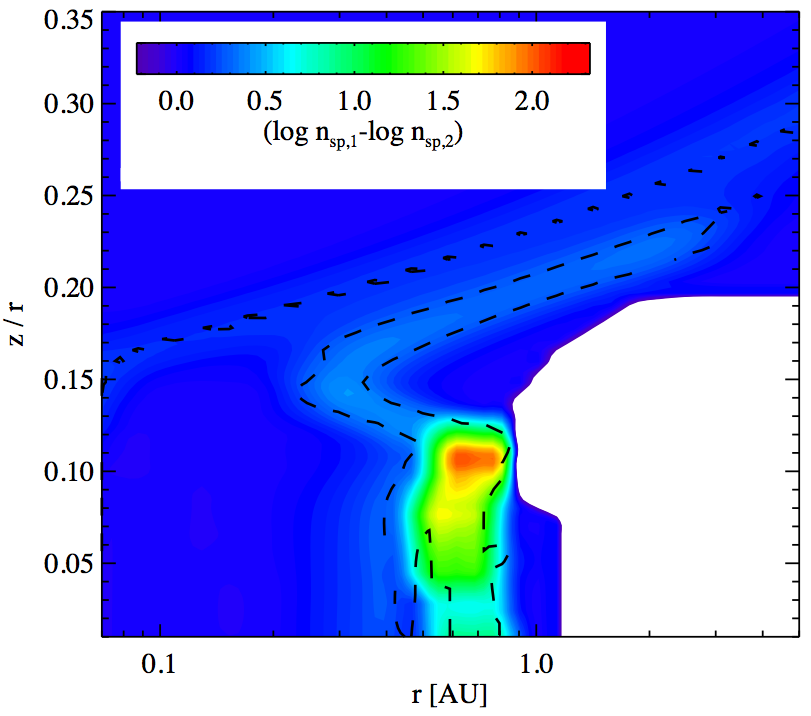
Figure 5 shows a zoomed image of the T Tauri disk model around the snowline at au. Water species density values can differ by up to a factor of (Fig. 7) close to the snowline at . However, even in surface layers, there can be deviations of up to a factor of 3. In the disk surface, where photons provide a certain level of ionization, the main pathways of water formation are through ion-molecule chemistry or radiative association H + OH H2O (e.g., Woitke et al., 2009b; Najita et al., 2011; Kamp et al., 2013). None of those reaction pathways shows significant tunneling effects, and hence we expect most of the disk water reservoirs to remain unchanged.
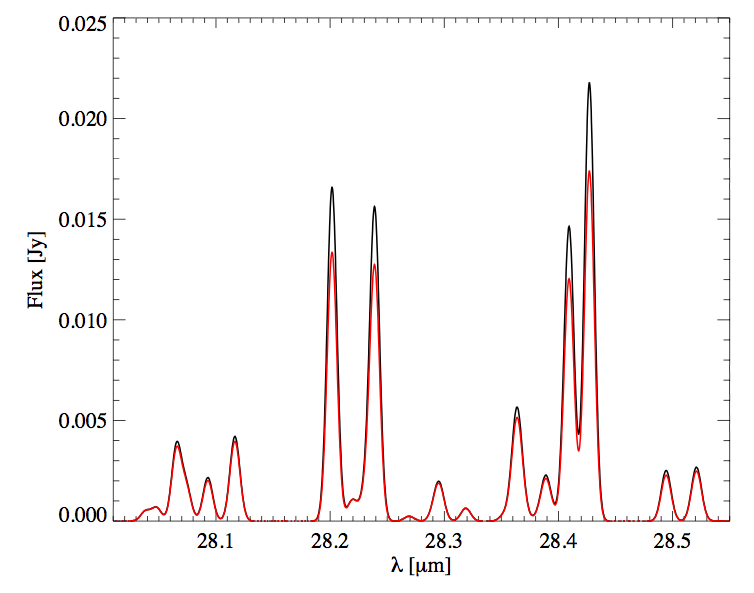
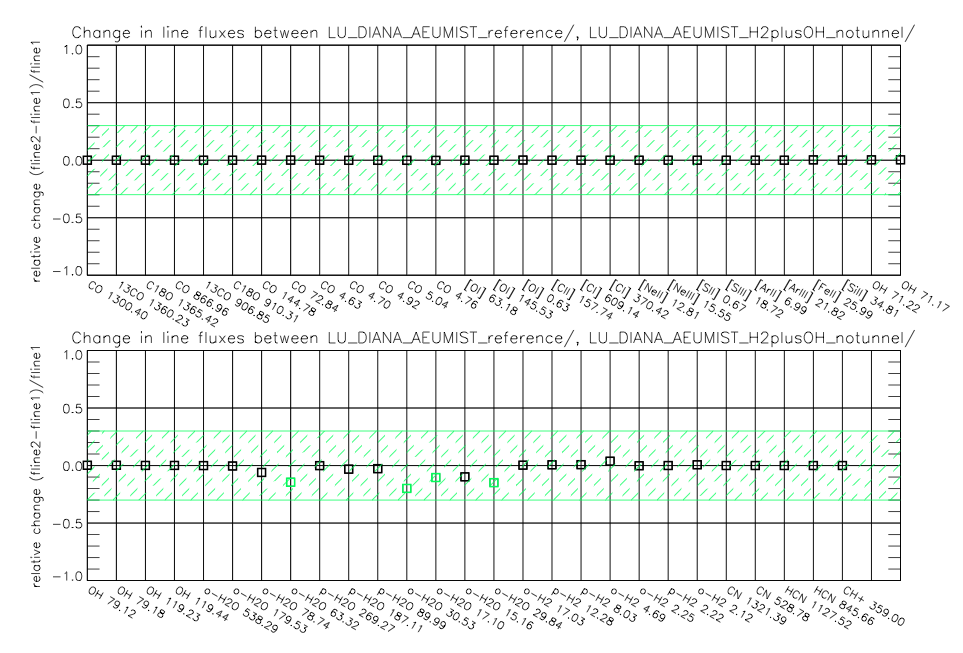
This inner disk water reservoir around the position of the radial midplane snowline gives rise to mid-IR spectra. Observations with the Spitzer Space Telescope have shown that many disks are rich in rotational and ro-vibrational water lines (e.g., Carr & Najita, 2008; Pontoppidan et al., 2010). Figure 6 shows how these changes in water abundance propagate into the mid-IR spectrum. Line fluxes can deviate by up to 60% (Fig. 20), but more importantly, water lines are often very optically thick and originate at very different radii and different depth, thus changing also the relative fluxes and the overall appearance of the spectrum. Changes affecting only strong lines, for example, can influence the temperature determination from such a spectrum using slab models.
In the following, we perform a detailed screening of all reactions in the small chemical network to identify rates susceptible to similar tunneling effects.
3.2 Screening of chemical reactions
Using the criteria defined in Sect 2.4, we identified 47 reactions that could show tunneling effects. As stated above in the methods section, this screening strongly overestimates the influence of atom tunneling on the chemical reactions under consideration. We compare the results from the T Tauri disk model for each reaction individually. This leads to four additional reactions that show differences in species densities and that could be important for the gas-phase chemistry in disks (marked bold in Table 1)
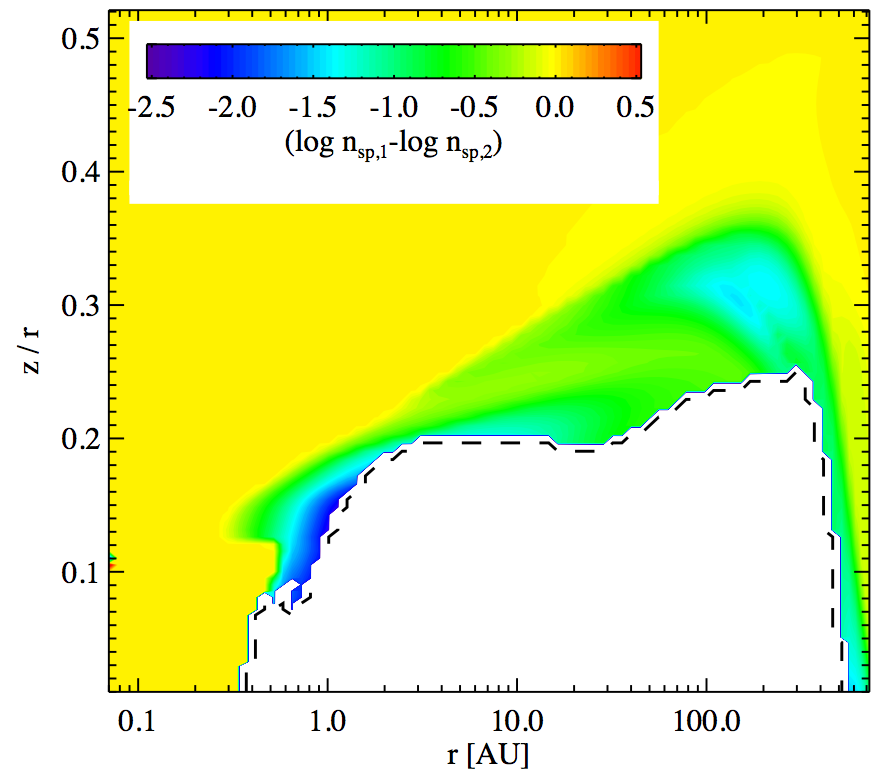
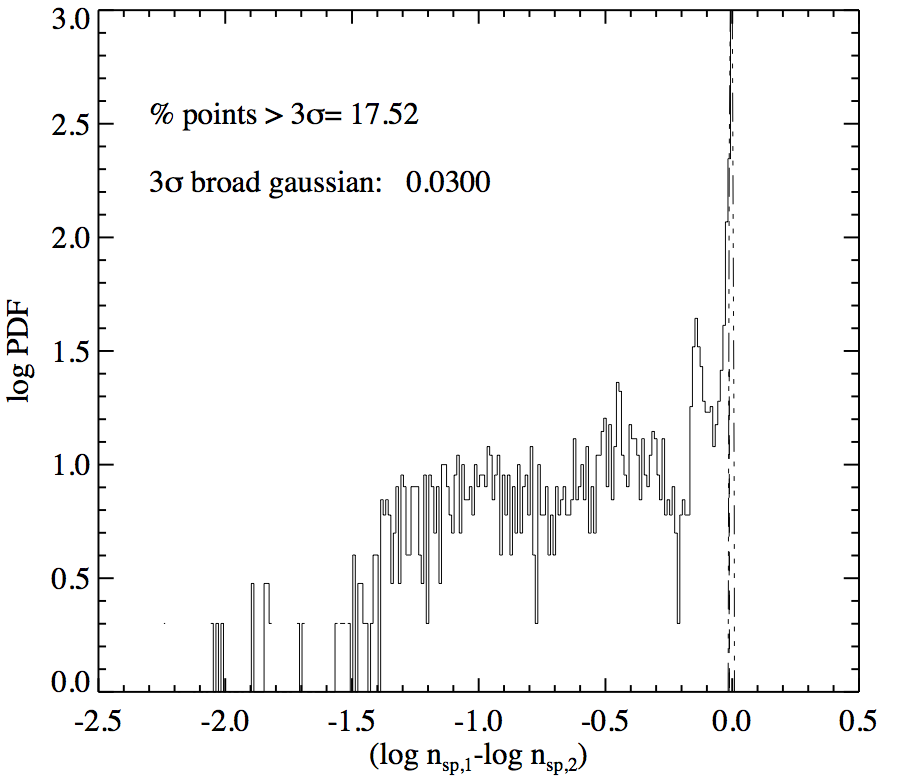
We use reaction [24] to discuss the influence of a temperature-independent rate constant below 250 K on the results of the disk chemistry simulations. We monitor the difference in HCN abundance in the T Tauri disk model and the distribution function for (see Fig. 8). Roughly 18% of the grid points outside the ice reservoir (black dashed line) show a deviation of more than 3 from the numerical noise. The changes occur predominantly in the upper disk layers beyond 20 au. However, also at the outer edge of the disk, the HCN density increases due to the enhanced rate constant up to a factor of .
3.3 Use of correct reaction rate constants
, their threshold temperature , and their respective Arrhenius fit parameters for the low-temperature regime below . No. Reaction Ref. UMIST2012 Values low-temperature fit [K] [K] 1 H2 + OH H2O + H M16 200 2.05(-12) 1.52 1736 250 2.342(-15) 5.2729 0.072 2 CH4 + OH CH3 + H2O L17 240 3.77(-13) 2.42 1162 178 8.252(-14) 7.753 0.040 3 CH4 + H CH3 + H2 B16 300 5.94(-13) 3.0 4045 300 1.19(-19) 16.37 1.217 literature search after screening 24 H2 + CN HCN + H J06 200 4.04(-13) 2.87 820 200 1.826(-13) 11.920 6.3(-4) 26 H2 + O H + OH B03 450 3.14(-13) 2.70 3150 298 5.79(-16) 7.077 1340 41 CH4 + O OH + CH3 Z16 500 2.29(-12) 2.20 3820 298 7.132(-15) 5.200 1560 111 The notation stands for . References: M16 (Meisner & Kästner, 2016b), L17 (Lamberts et al., 2017), B16 (Beyer et al., 2016), J06 (Ju et al., 2006), B03 (Balakrishnan, 2003), Z16 (Zhao et al., 2016).
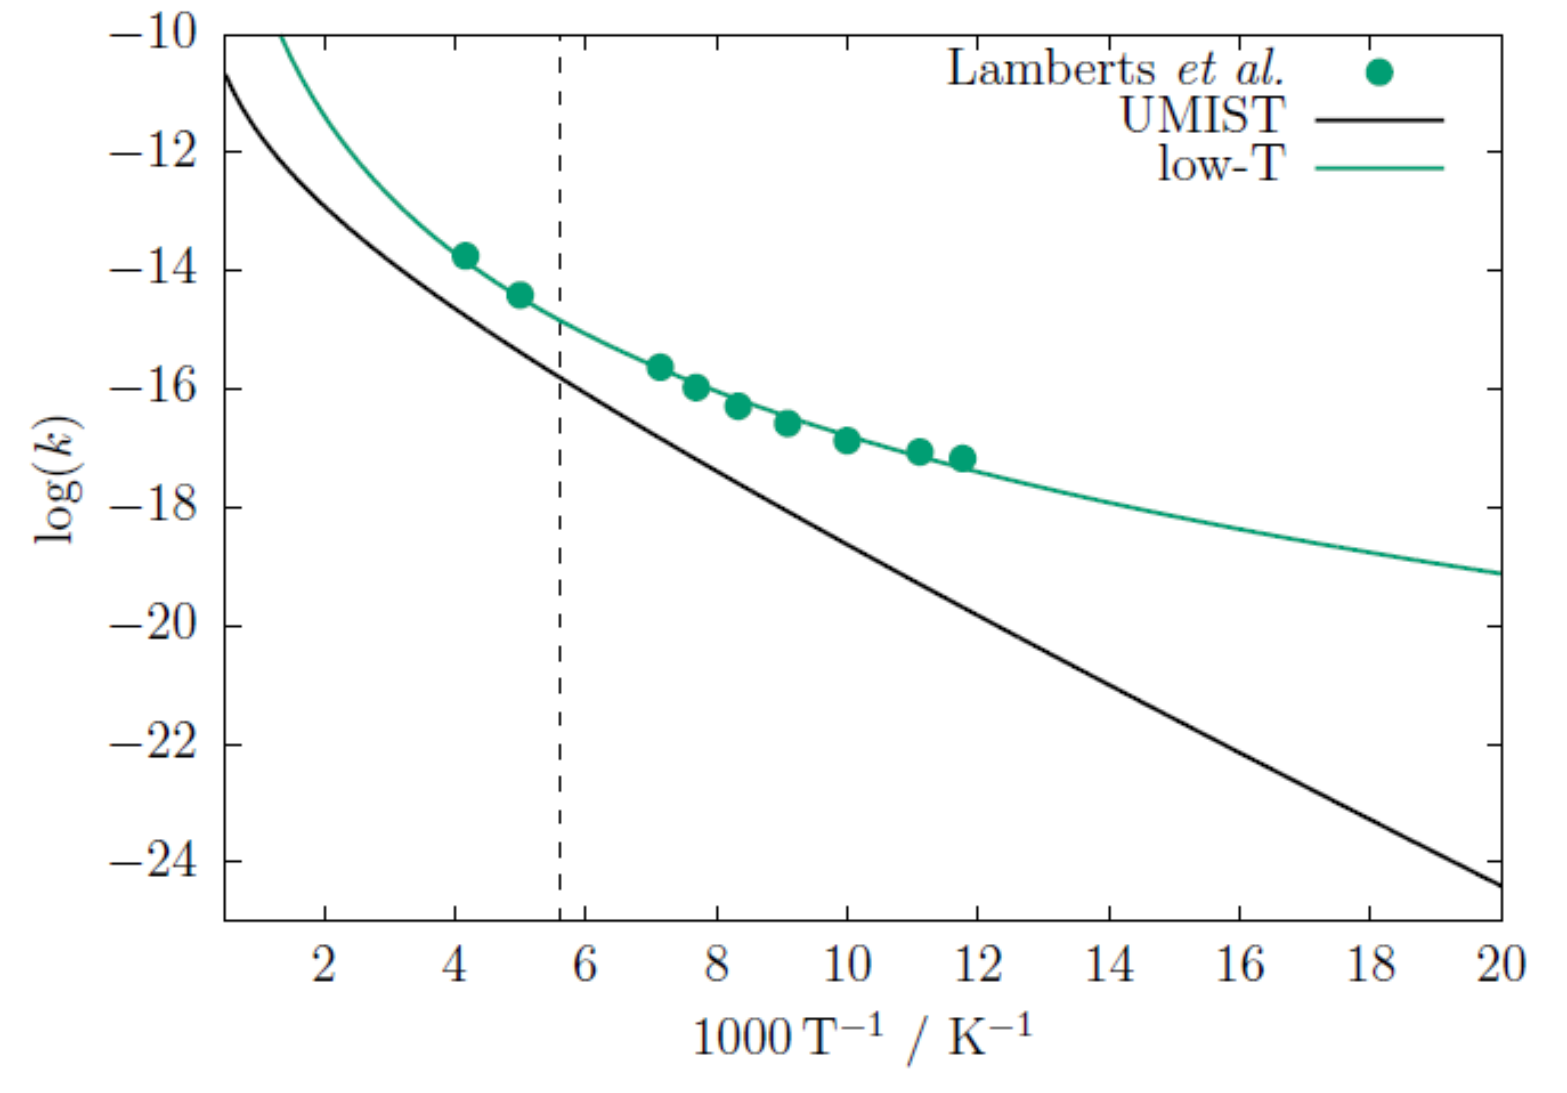
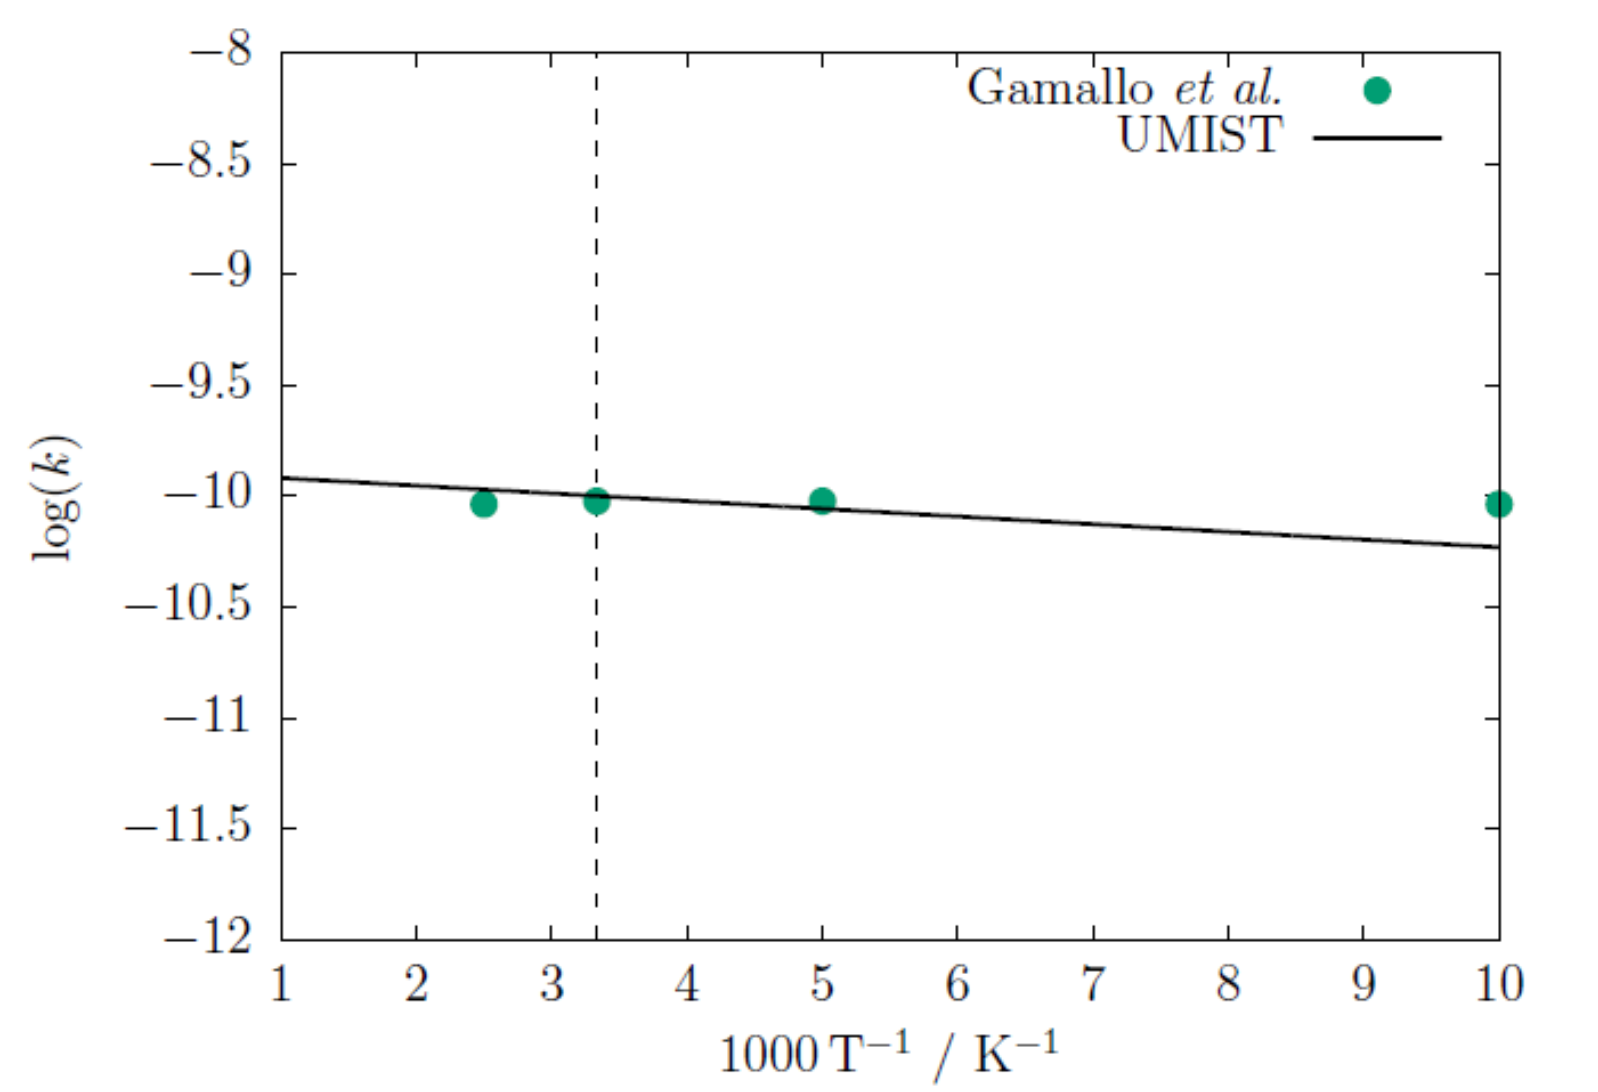
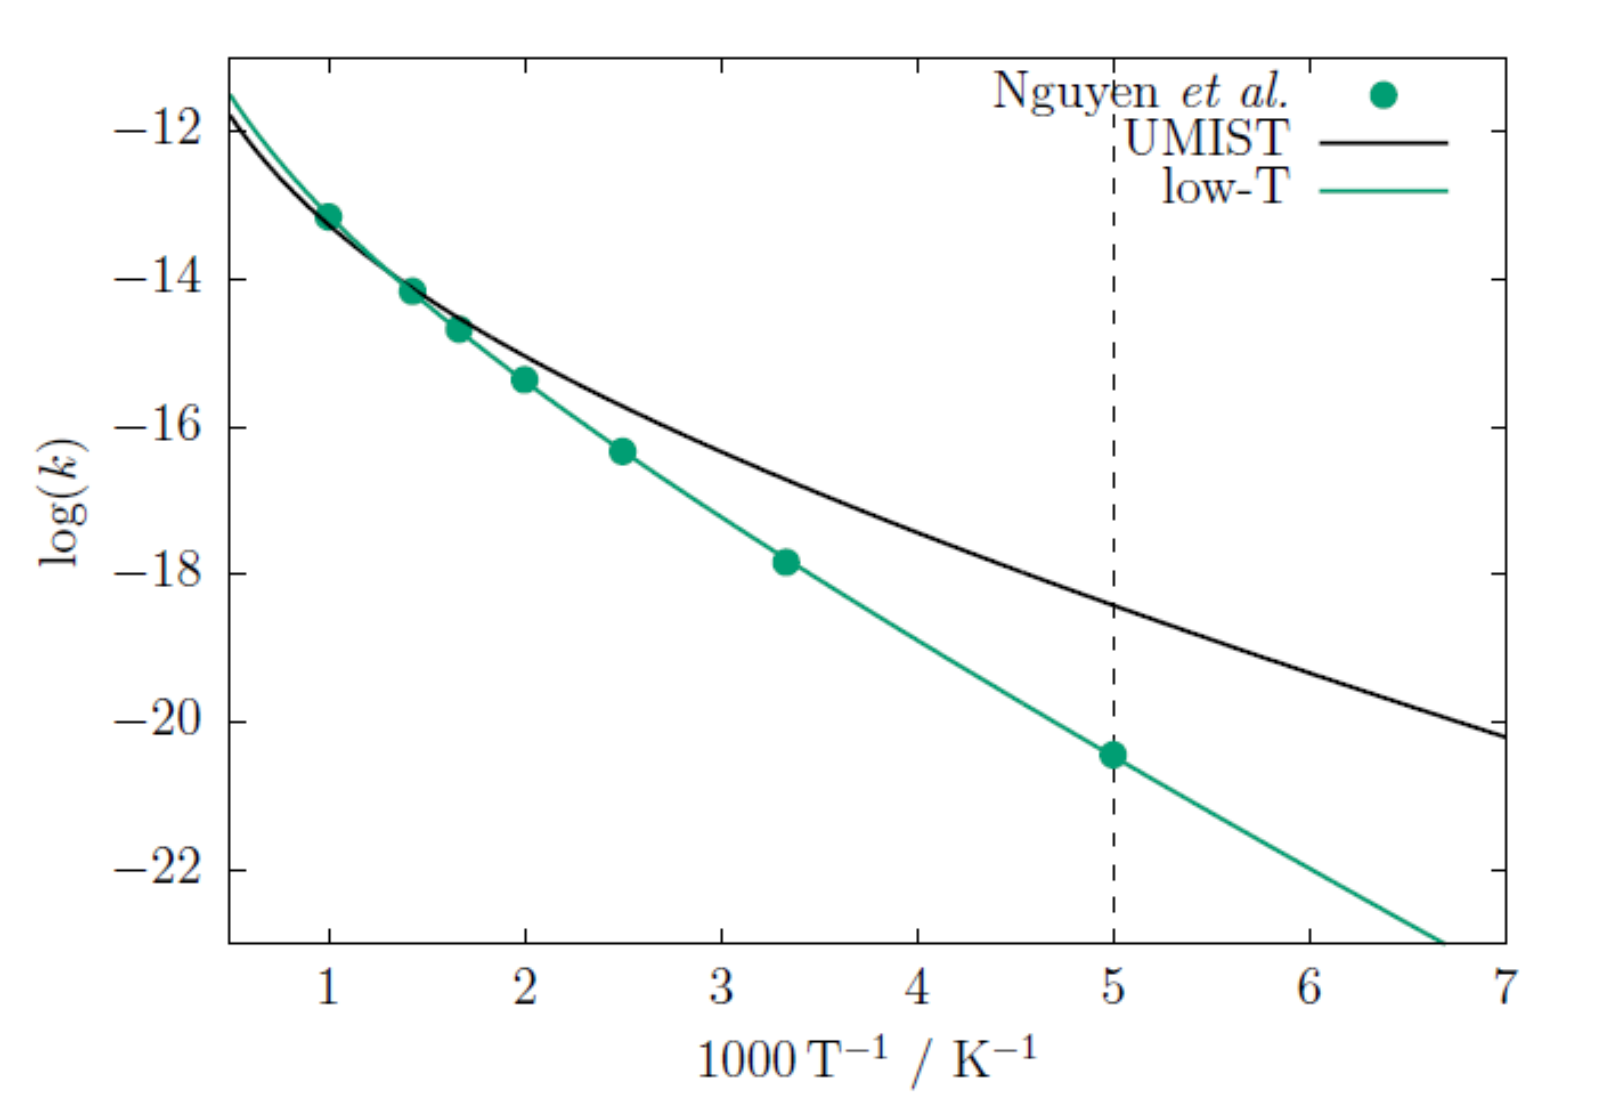
We combed through the literature to obtain more realistic rate constants for these five reactions. The UMIST2012 data for reaction [28] is already in excellent agreement with the recent quantum dynamical results of Gamallo et al. (2012). Thus, we do not include this reaction in the subsequent work. For reaction [35], the UMIST2012 values overestimate the reaction rate compared to the computations by Nguyen & Stanton (2019), as can be seen in figure 18. The recently published values based on highly accurate semiclassical transition state theory (SCTST) calculations are state of the art and are shown to deviate just slightly from experimental values. Therefore, this reaction cannot be used to elucidate whether atom tunneling plays a crucial role and will be omitted. It should be noted, however, that the reaction rate constants computed on CVT/OMT-Level might underestimate atom tunneling in the lower temperature range. We therefore encourage updating the Arrhenius parameters of this reaction in the next version of the UMIST database
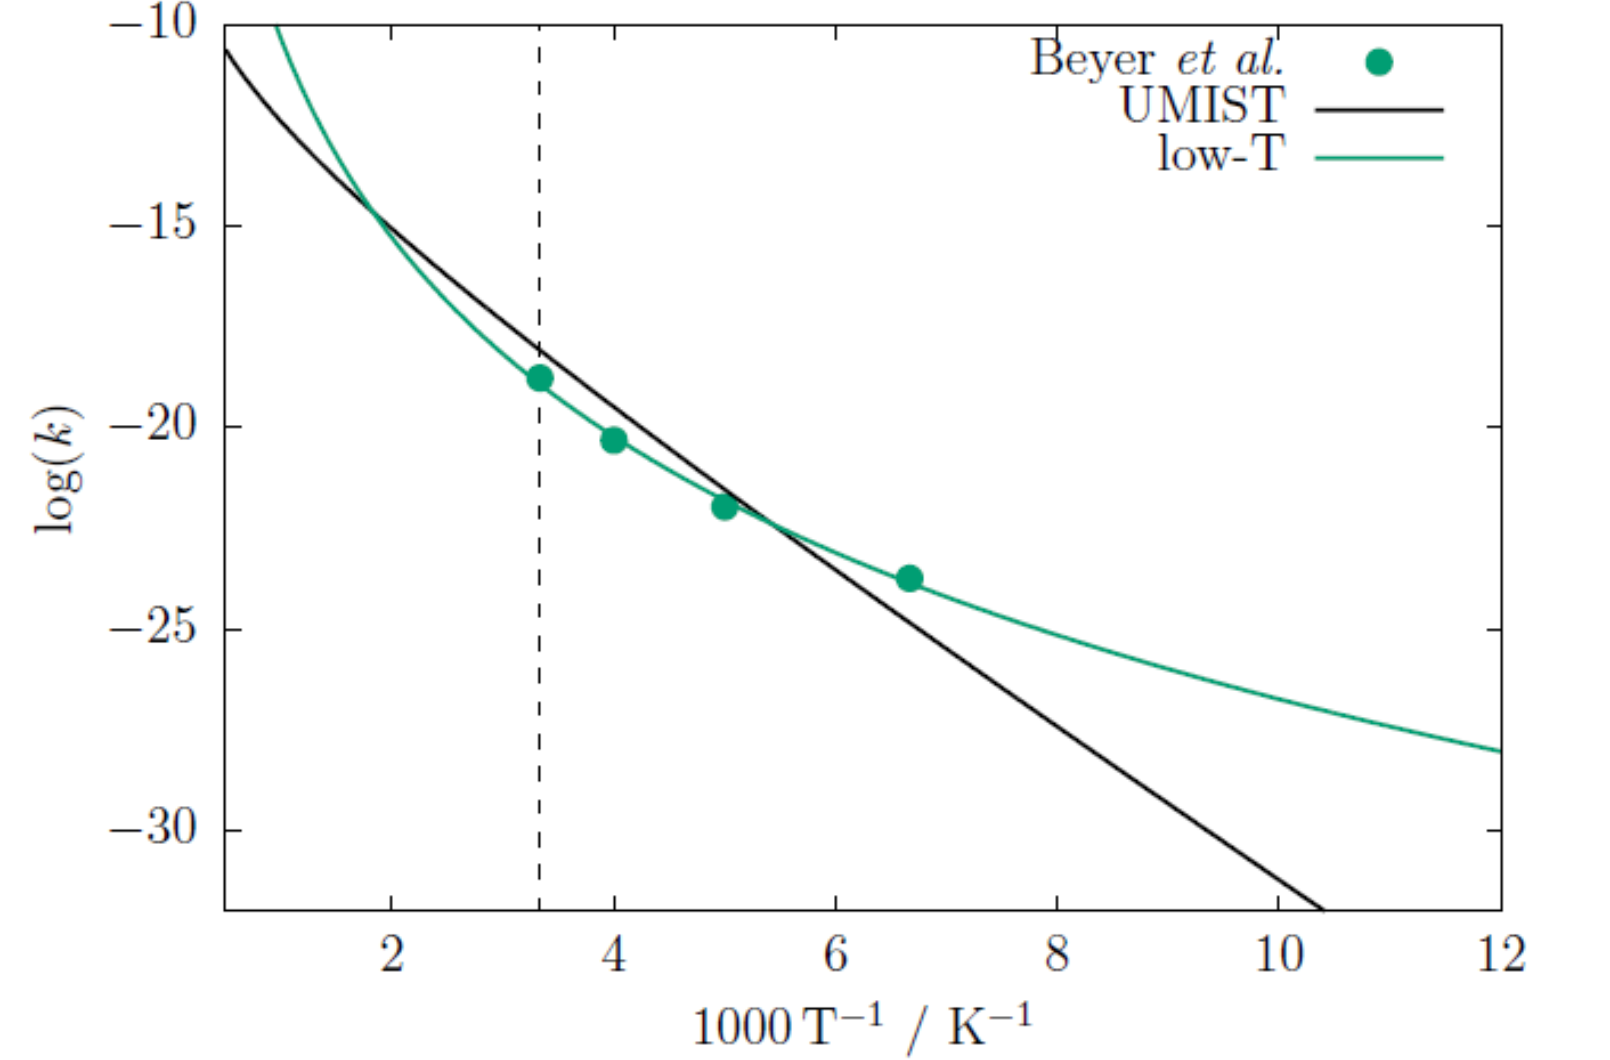
In the following, we briefly discuss the influence of atom tunneling on the rate constants of reactions [1], [2], and [3], and on those identified in the screening, reactions [24], [26], and [41]. For these six reactions, we computed Arrhenius fits following the method outlined in Sect. 2.4. The resulting parameters are summarized in Table 2 (bottom). We then present results when using Arrhenius parameters fitted to these new rate constants. The analysis method is the same as above. We want to highlight the vanishingly small values of the fitting parameter for the low-temperature fit of exothermic reactions [1], [2], [3], and [24], which have little impact on the rate constant.
3.3.1 H2 + OH H2O + H
As previous work in Meisner & Kästner (2016b) shows, atom tunneling increases the rate constant for this water forming reaction by several orders of magnitude (see Fig. 2). However, using the new Arrhenius parameters, the water abundance (density) increases just above the ice reservoir () in the T Tauri disk at distances of 0.3–50 au from the central star (see Fig. 9). The increase in water abundance is typically less than a factor two. The spatial extent of this region is largely limited by ion-molecule chemistry dominating the water formation closer to the disk surface (higher ) where photons can reach. In addition, the rate constant increase is noteworthy only below K, which also limits spatially the impact of the enhanced water formation. In addition, surface chemistry, especially chemical desorption from surfaces, can enhance the gas-phase water abundance around the snowline (Cazaux et al., 2016); however, this process needs to be studied in a future work.
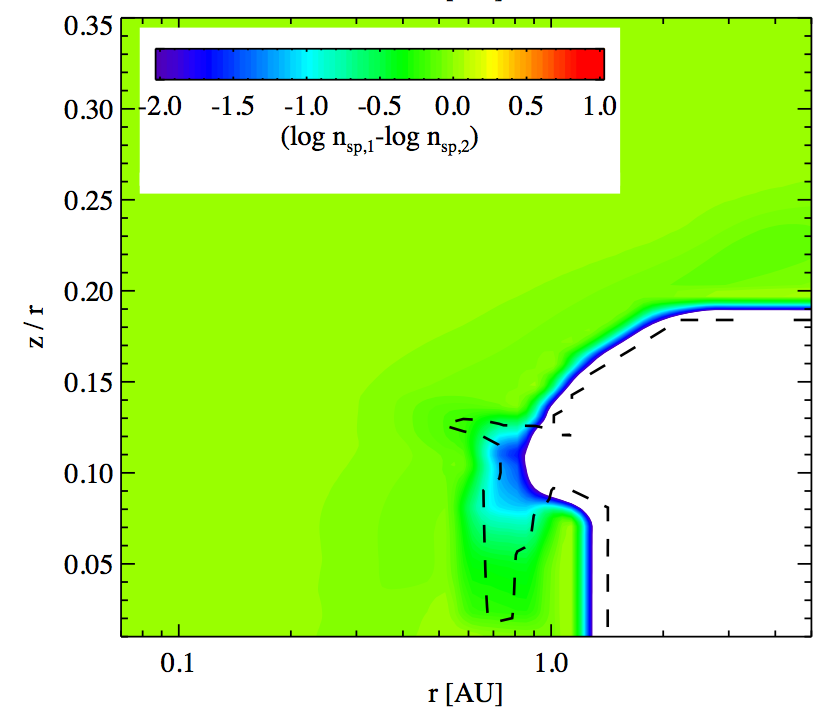
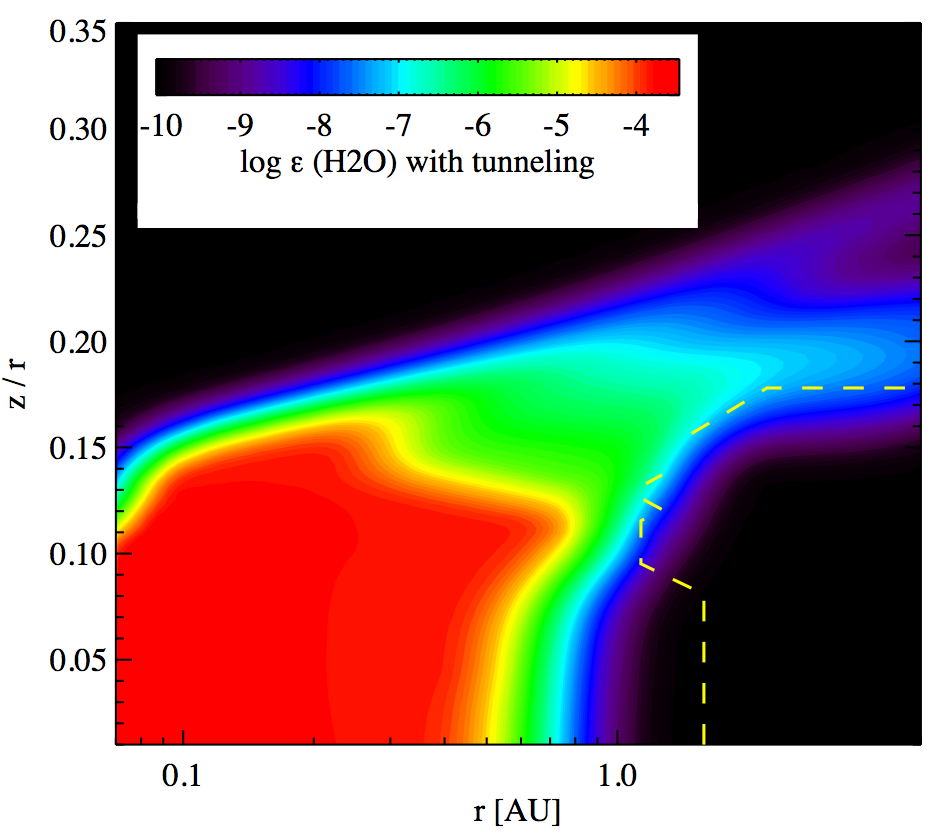
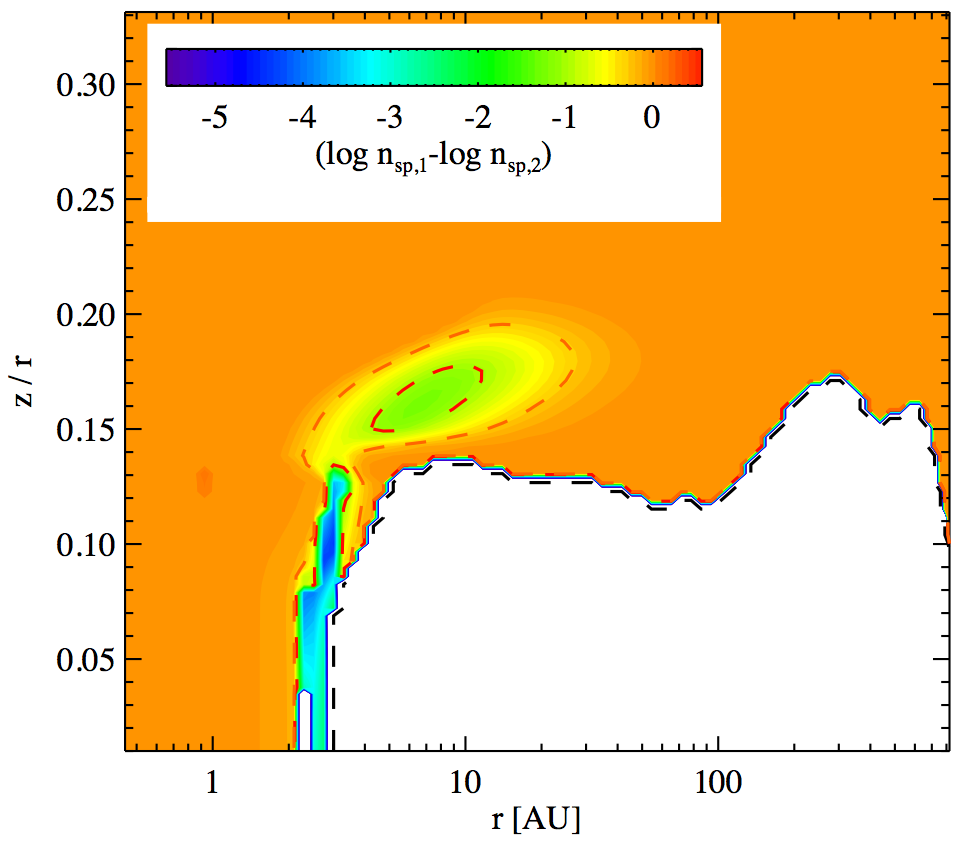
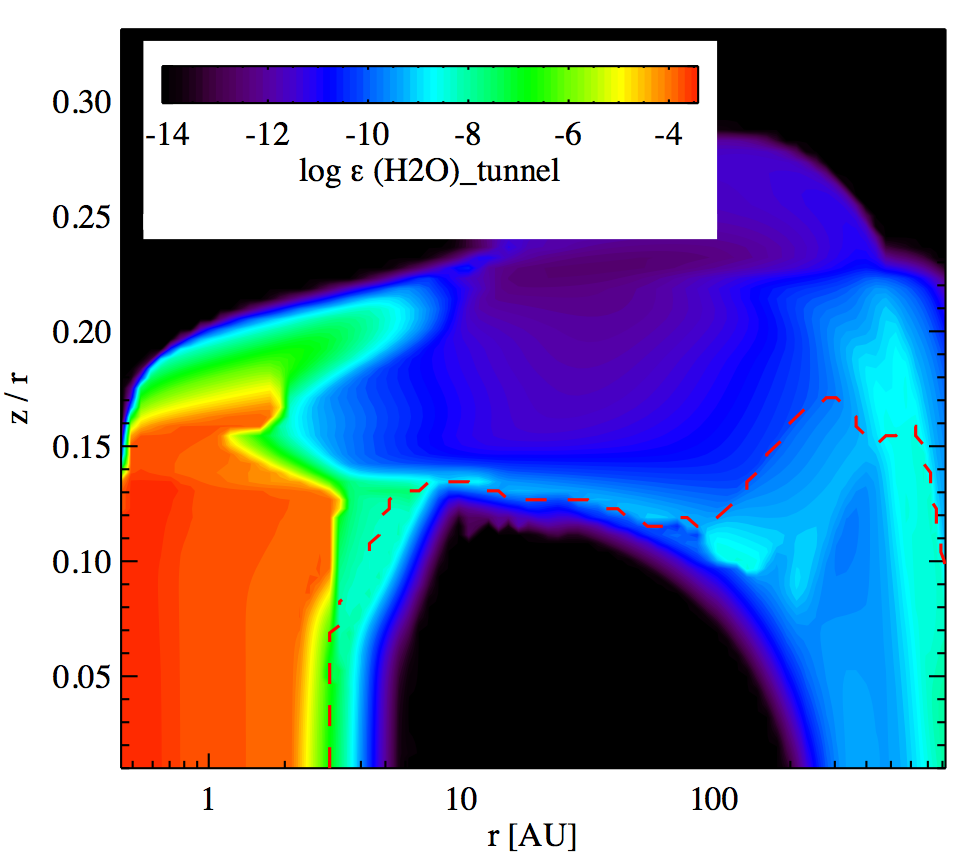
The Herbig disk model is flatter than the T Tauri disk model and has a more extended region where the temperature ranges between 200 K and the freeze-out of water. It is in this relatively cold region around 10 au that the water abundance increases strongly (more than a factor of 2-10) (see Fig. 10). However, in these regions, the water abundance is very low () and the higher rate constants do not improve the efficiency of water formation above abundances of (typical values reached by photodesorption in the outer disk).
3.3.2 CH4 + OH/O/H CH3 + H2O/OH/H2
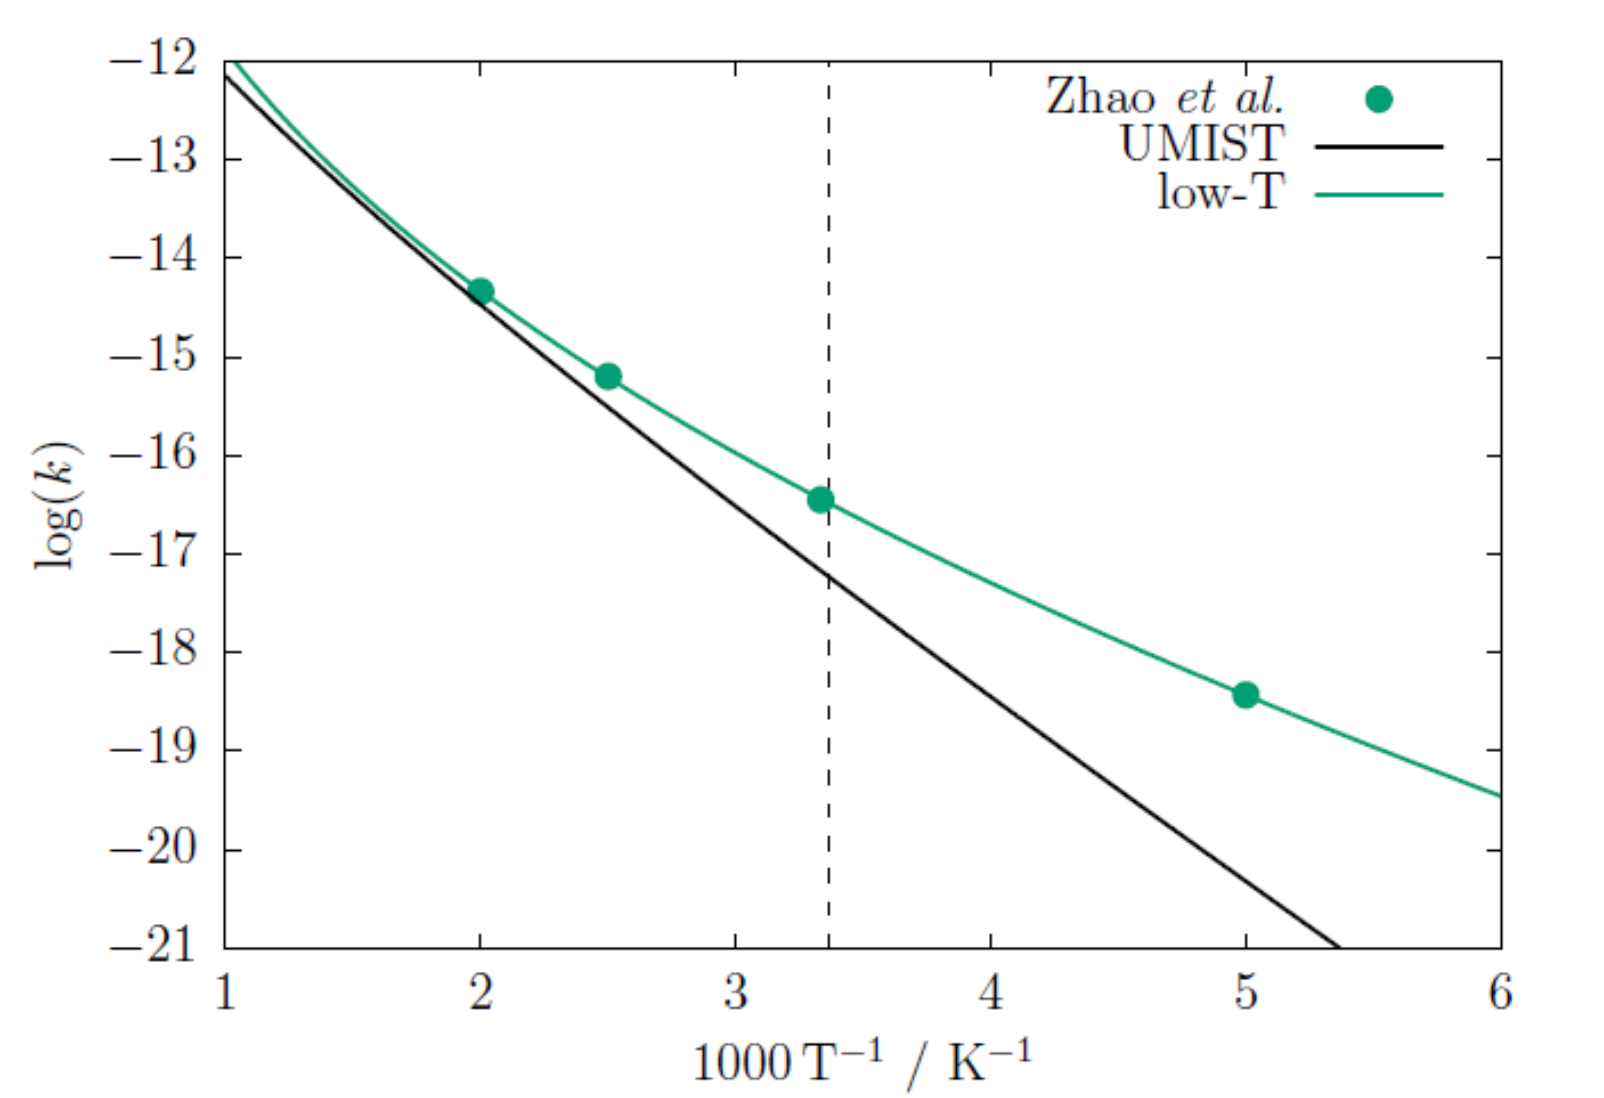
Zhao et al. (2016) calculated rate constants for the reaction O + CH OH + CH3 [41] using the quantum instanton method. For the reaction of CH4 with OH and H we used results based on semi-classical instanton theory from Lamberts et al. (2017) and Beyer et al. (2016), respectively. When using the fits to these rate constants in the T Tauri disk model, we did not find significant differences in the species abundances. If differences occurred, they were restricted to a narrow radial range inside the inner edge of the ice reservoir. For most molecules that are affected, the abundances in these regions are very small .
3.3.3 H2 + CN HCN + H
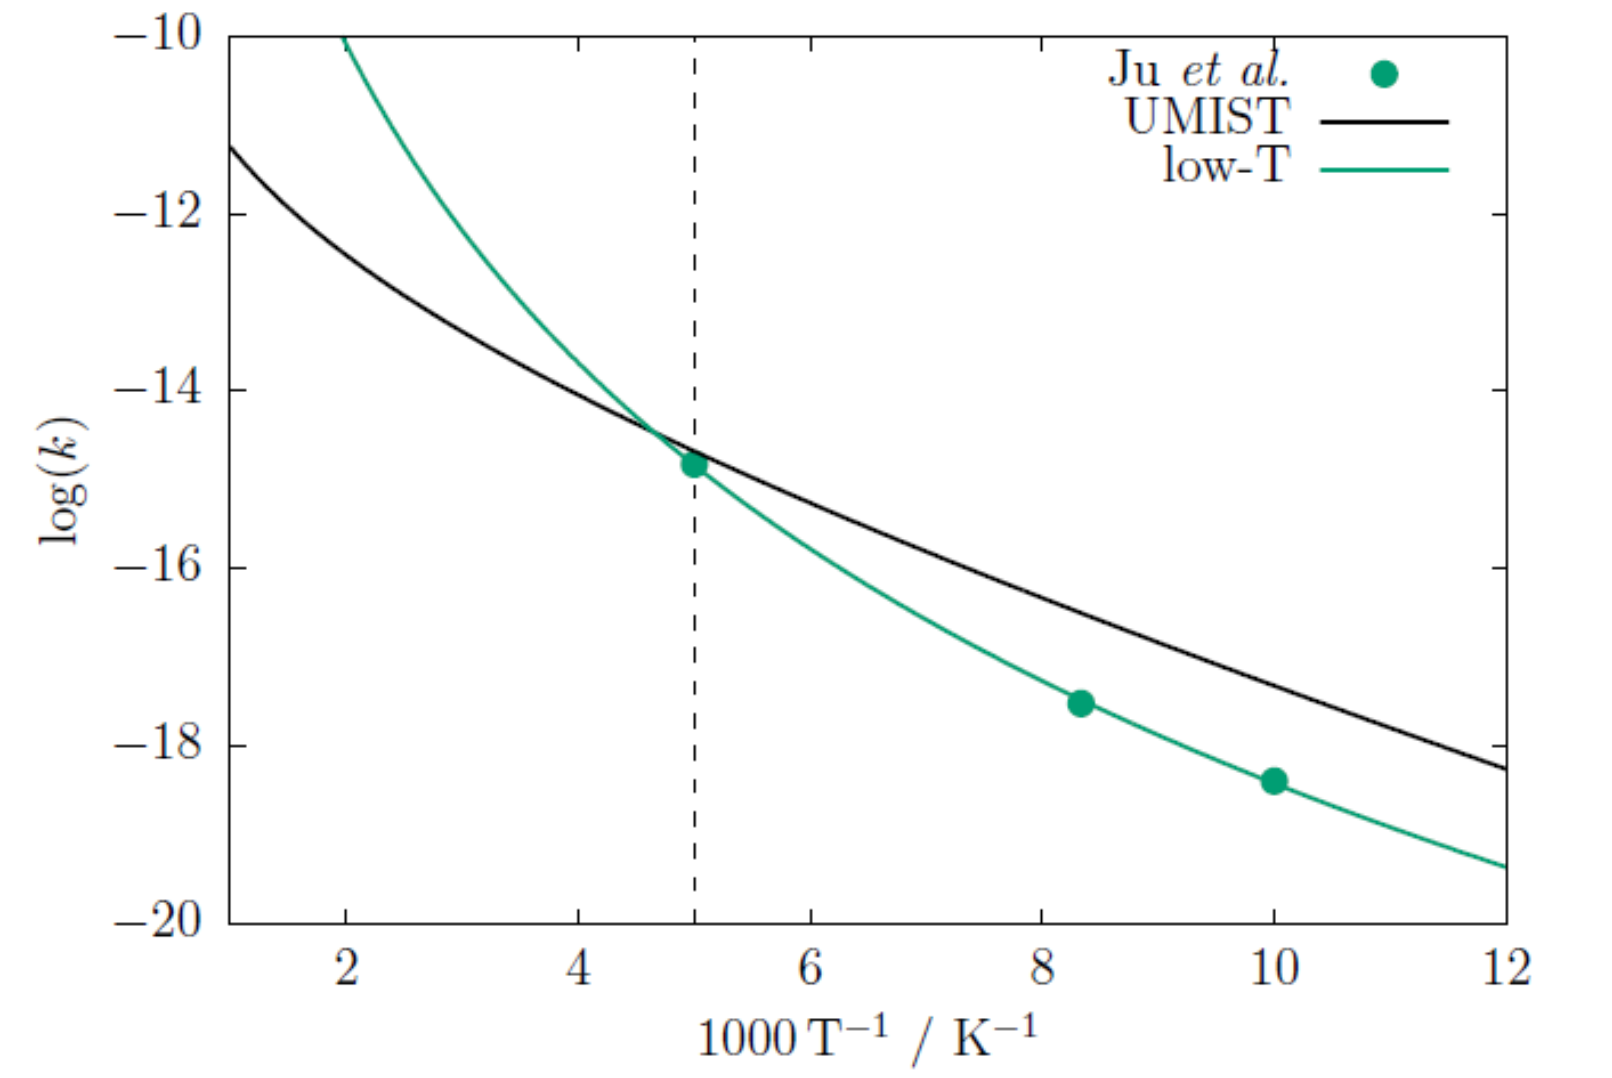
Reaction [24] has already been discussed in the screening approach. For this reaction, Ju et al. (2006) published rate constants down to 100 K using variational transition state theory in combination with the small-curvature tunneling scheme. Even though the authors of this computational study state that “the tunneling effects are […] non-negligible over 100–200K,” the reaction rate constants provided by Ju et al. (2006) are even slightly smaller than the UMIST2012 values in this temperature regime (see Fig. 15). We note that in addition to using the calculated tunneling rate, here we also use the large chemical network; this also affects the outline of the ice reservoir. This is important to provide reliable abundances for CN and HCN as discussed in Greenwood et al. (2017) and Kamp et al. (2017)222The use of the small network in the screening is a valid approach since we are only interested in differential changes modifying one rate at a time. However, when also calculating emergent spectra and/or line fluxes, we do need to use the large network..
As a consequence of the lower rate constants compared to UMIST2012 values, the differences in HCN density become much smaller compared to the screening approach above and they also become negative (Fig. 11). Most density changes stay well below a factor of three. HCN in the outer disk beyond 100 au does not change at all. While the reaction H2+CN is the main HCN formation path in the upper surface layers of the disk, HCN is predominantly formed through C+NH2 and N+CH3 at the outer cold disk edge (Greenwood et al., 2017). As a consequence of the small density changes, HCN line fluxes from low rotational lines do not change due to the new values of the rate constants for this reaction.
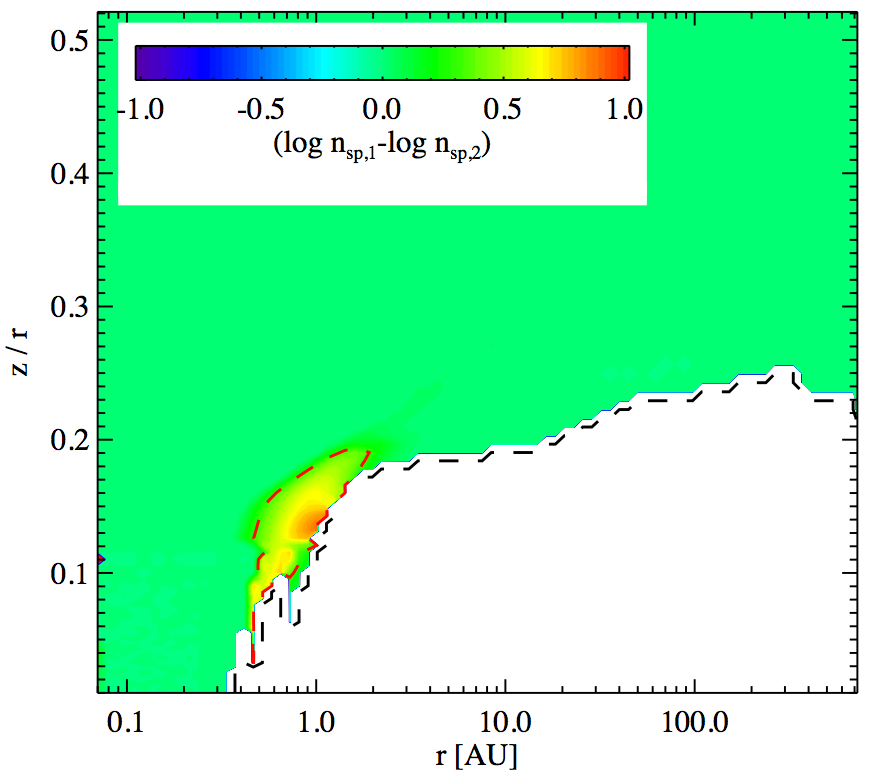
3.3.4 H2 + O H + OH
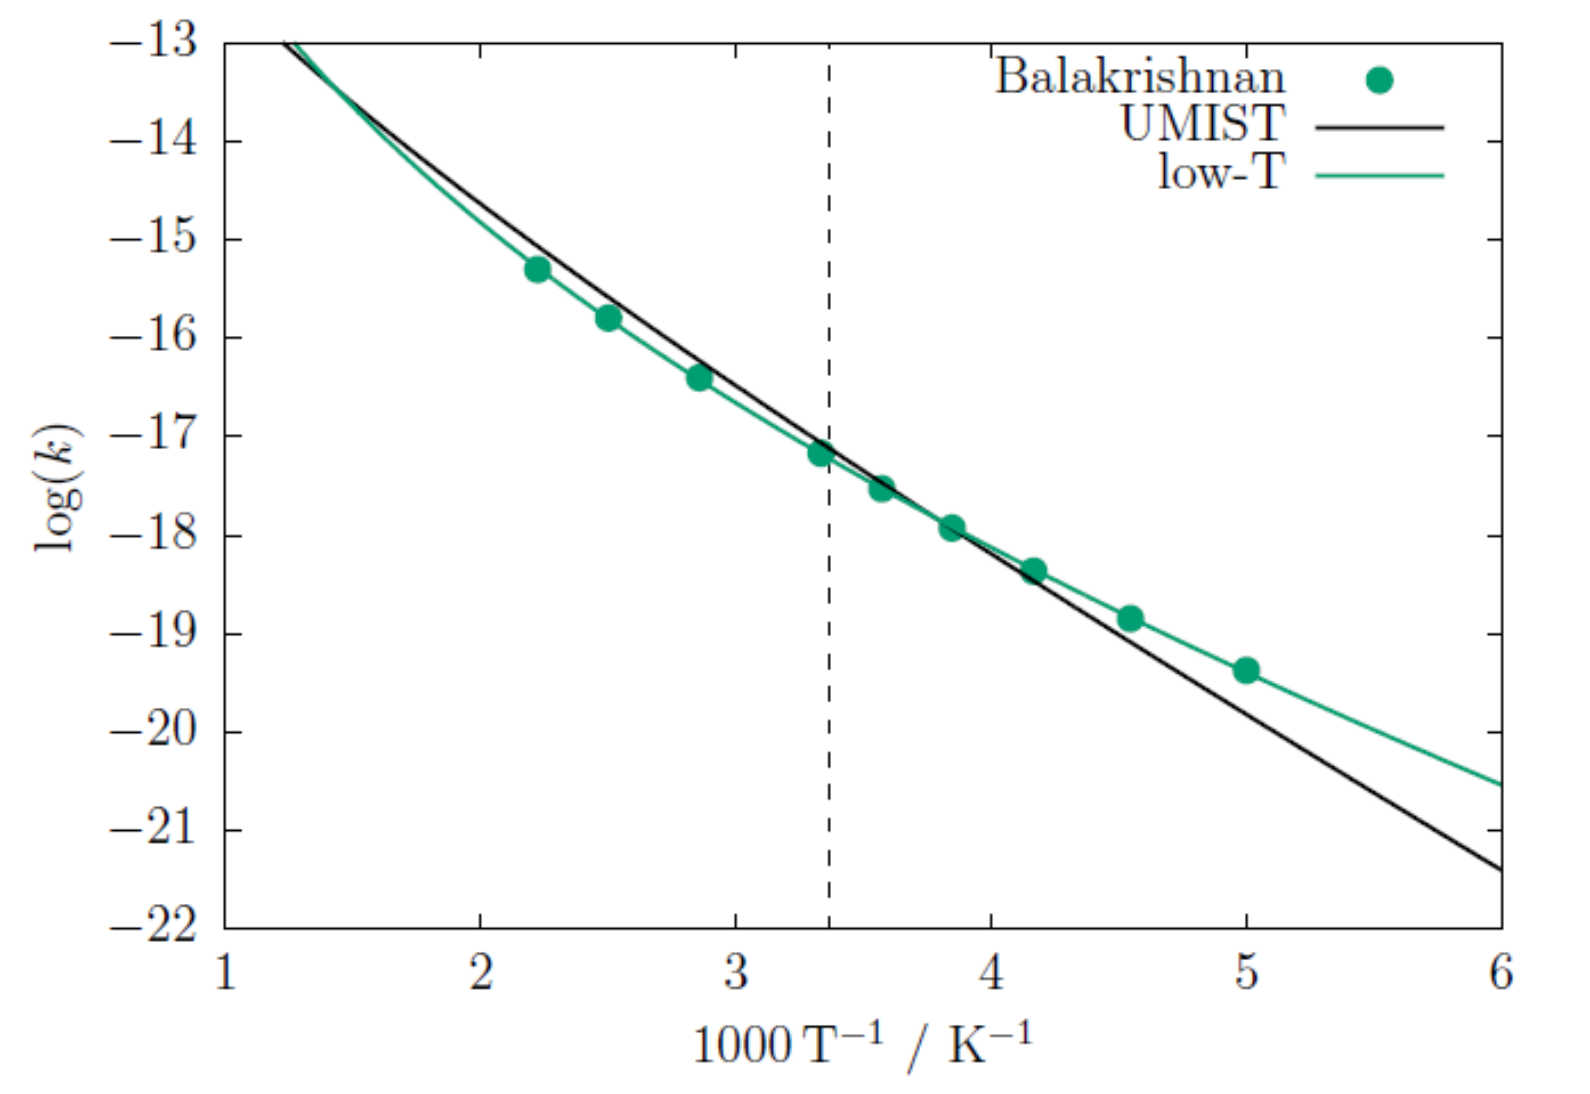
This reaction is endothermic, and therefore the activation energy is not expected to decrease significantly at low temperatures because endothermic reactions require energy to take place, leading to a nonvanishing activation energy (Meisner, 2018). Nevertheless, in general, tunneling effects can also enhance reactivity for endothermic reactions. However, Balakrishnan (2003) provides accurate rate constants for reaction [26] down to 200 K that are in good agreement with the UMIST2012 data, but higher by a factor of at 200 K. It should be noted that the validity range provided in UMIST2012 just extends down to 297 K. We therefore decided to include this reaction in the study even though tunneling is not as pronounced as it would be in an exothermic reaction.
Inclusion of atom tunneling in this reaction enhances the destruction of H2 and leads to higher abundances of atomic hydrogen. It is obvious that this can transmit subsequently into the abundances of many other species including hydrocarbons, for example. In most cases, the abundances of these species is small at the inner snowline; however, we find that CH4, C2H2, C3, and C3H2 as well as HCN, HNC, H2CO, and CH3OH can be abundant in this region and can be affected by this change in rate constant. Given the particular geometry/structure of our T Tauri disk model, this zone is relatively small radially and confined to .
3.4 Time-dependent chemistry versus steady state
We explored the neutral-neutral reaction H2 + OH H2O + H also using time-dependent chemistry in the model with the small chemical network. In that case, we started with initial abundances taken from a molecular cloud run ( cm-3, , and an age of yr). We then evolved the chemistry over an age of yr, for the reference T Tauri disk model and for the model with the tunneling rate. The timescale for reaching steady state increases to a few Myr around the position of the snowline in the midplane. Above the ice reservoir in the disk surface, timescales are even shorter than yr. At timesteps of 0.3, 1, and 3 Myr, differences in the water abundance between UMIST2012 and the new instanton rate inside the snowline and below are slightly larger than in steady state, up to a factor two.
4 Astrophysical Implications
4.1 Emission lines from disks
We compared the emerging line fluxes of the 56 rotational lines of H2, CO, OH, H2O, HCO+, and N2H+ described in Sect. 2.4 from the model with the increased rate constant for the reaction H2 + OH H2O + H with the reference model. In both cases, T Tauri and Herbig disk, none of the line fluxes changes by more than a small percentage which is well within the numerical accuracy of predicting them. When using the updated Arrhenius parameters of the reactions H2 + CN HCN + H [24] and H2 + O OH + H [26] line fluxes also do not change beyond the numerical accuracy.
The line emission generally emerges from surface layers where the chemistry is dominated by ion-molecule reactions. Several molecular rotational lines can probe deeper layers in the outer disk; UV radiation can penetrate deeper in the outer disk, and hence ion-molecule routes often also dominate here. The relative small and spatially confined changes found above occur in regions that do not contribute to the series of lines selected here. Especially in the inner disk, many of the changes in species densities lie in the optically thick part of the disk, so well below the continuum optical depth of one.
4.2 Planet formation
The C-to-O ratio has been identified as a key quantity for linking disk models and exoplanets (e.g., Madhusudhan et al., 2017). It is a quantity that can be inferred from observed exoplanet atmosphere spectra (see a recent review by Deming & Seager, 2017) and is often found to be consistent with solar C-to-O ratio (e.g., Line et al., 2014). Also, it is readily extracted from simple or more complex disk models (Öberg et al., 2011; Helling et al., 2014; Eistrup et al., 2018).
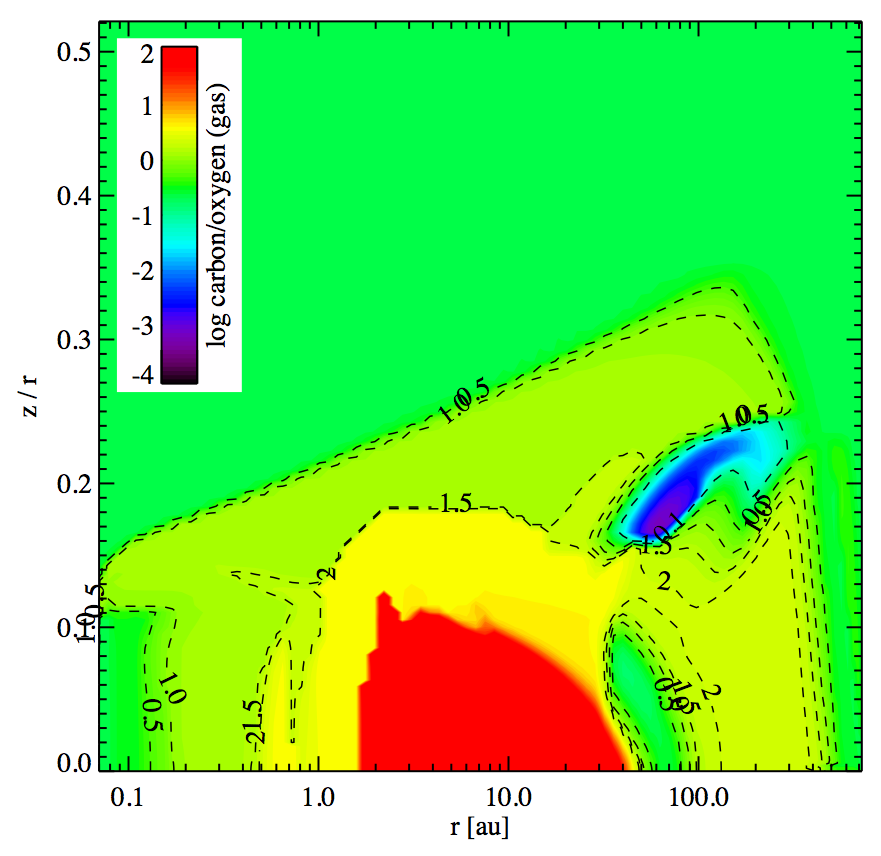
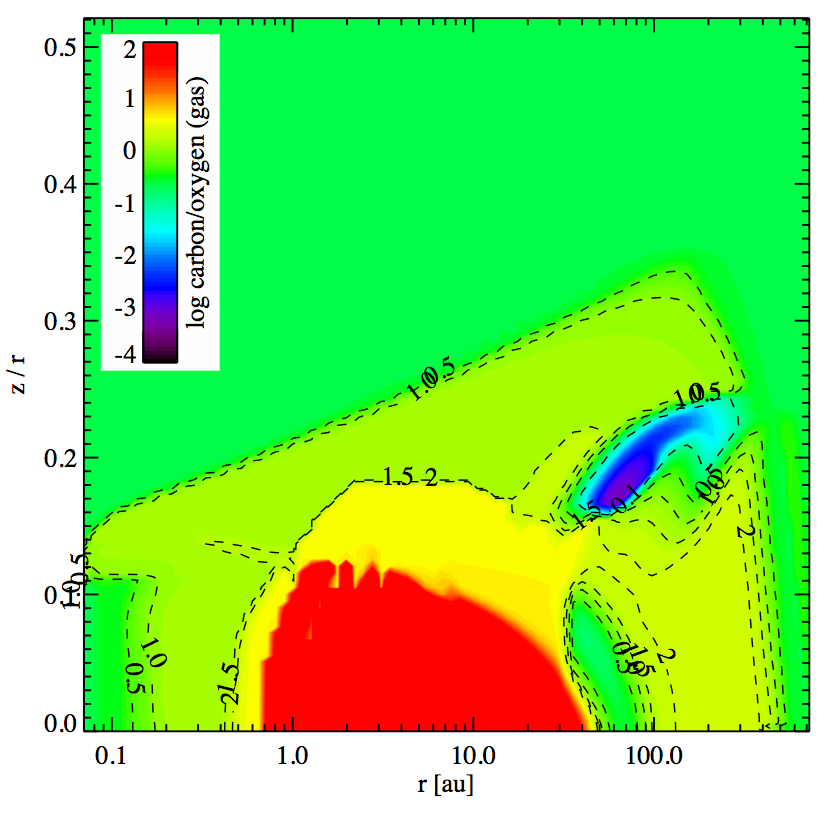
We compared the C-to-O ratio in the gas phase between the reference T Tauri model and the model using the values of the instanton calculations for the reaction H2 + OH H2O + H [1]. Differences occur close to the midplane snowline (below ). Due to an enhanced formation route of water in the gas phase, water ice formation is enhanced, and thus the C-to-O ratio becomes higher than 10 already inside 1 au (Fig. 12). The change in water formation also affects the water ice-to-rock ratio close to the snowline. This ratio determines the enhancement in solid mass available for the formation of planetary embryos (e.g., Ida & Lin, 2008; Benz et al., 2014, for planet population synthesis models). We do not include the formation of water on surfaces through H addition in this work, and hence the results above should be seen as differential rather than absolute.
A change in the water formation around the snowline can also affect the buildup of atmospheres of terrestrial planets. D’Angelo et al. (2018) and Thi et al. (2018) show that the water vapor pressure inside the snowline also affects the formation of phyllosilicates and thus the content of hydrous minerals available for the formation of planetary cores.
5 Conclusion
We provide Arrhenius-type low-temperature fits for rate coefficients of gas-phase reactions that have been identified as being potentially affected by tunneling at low temperature ( ¡ 250 K). For CH4 reacting with OH, H, and O (reactions [2], [3], and [41], respectively) these rate constants become orders of magnitude larger compared to the extrapolated UMIST2012 rate constants. For the reaction H2 + OH H2O + H, this occurs at temperatures below the validity range of 250 K given in the UMIST2012 database. The rate constant for the reaction H2 + CN HCN + H becomes a factor 10 smaller than the UMIST2012 rate constant below their low-temperature limit. We did not identify any ion-molecule reactions that play a relevant role in disk models and that are affected by tunneling. The new Arrhenius parameters fitted to the low-temperature rate constant obtained from the literature could be included in future database releases.
An important result of this study is that in planet-forming disks, the temperature region where atom tunneling in gas-phase chemistry could be important (approximately where K) is generally small. It is either limited by ice formation and hence surface chemistry taking over at low temperatures (ice reservoir) or radiation-dominated environments causing gas temperatures well above 250 K and ion-molecule chemistry to dominate (upper disk surface layers). The transition regime is either radially or vertically very thin except for special disk geometries (e.g., flat disk models).
The regions affected are often below the disk layers that give rise to the wealth of emission lines at IR to submm wavelengths. Thus, predicted changes in emitting line fluxes from key molecules such as CO, OH, H2O, CN, and HCN are smaller than 20%. However, close to the snowline, atom tunneling in one of the main water formation routes that affects the gas-phase C-to-O ratio and the ice-to-rock ratio, both quantities that are relevant for planet and planetary atmosphere formation.
Future steps for planet-forming disks should be a detailed study of the surface chemistry including tunneling effects. This is especially relevant at the interface between gas and ices where, for example, formation of water ice through adsorption from the gas phase can compete with surface formation of water through adsorption of H and O atoms. Surface chemistry can also enhance gas-phase abundances of species like water provided that reactive desorption is efficient. While at greater disk heights the water vapor and ice abundances are affected by surface reactions and nonthermal and reactive desorption, this process is less relevant close to the midplane around the snowline (Walsh et al., 2014, Thi et al. in preparation). Other astrophysical environments such as molecular clouds, hot cores, and hot corinos should also be analyzed in detail since the low densities and/or time-dependence of the warm-up processes of these objects change the pathways of the gas-phase chemistry.
The tunneling effect is mass-dependent, leading to a particularly pronounced kinetic isotope effect for hydrogen. Therefore, the distribution of deuterium atoms in molecules can significantly deviate from the atomic H-to-D ratio. Including D atoms in the chemical network is a project by itself and the HDO-to-H2O ratio is key to many studies on the formation of solar system objects. Therefore, we aim to extend our studies presented here to show how decisive atom tunneling is for H-to-D ratios and how existing reaction networks can be extended to reliably describe deuterium transfer.
Acknowledgements.
We would like to thank Laurent Wiesenfeld, Stephanie Cazaux, Thanja Lamberts, and Tom Millar for the insightful discussions. JM thanks the German Research Foundation (DFG) for financial support within the Cluster of Excellence in Simulation Technology (EXC 310/2) at the University of Stuttgart. JK thanks European Union’s Horizon 2020 Research and Innovation Programme (Grant Agreement 646717, TUNNELCHEM). We thank the COST Action CM1401 “Our Astro-Chemical History” for travel support through two STSMs and stimulating discussions.Appendix A Calculated rate constants
In the following we discuss the Arrhenius plots for reactions [2], [3], [24], [26], [28], [35], and [41]. The values used for the fitting procedure are denoted by dots in the following and are given in the cited literature.
Appendix B Line flux comparison
We present here as an example a complete overview of the changes in line fluxes emergent from the disk model. The reference model is the T Tauri disk and the comparison model is with reaction H2 + OH H2O + H [1] calculated without taking tunneling into account (Sect. 2.1). Figure 20 shows that some high-excitation water lines deviate by up to %.
References
- Álvarez Barcia et al. (2016) Álvarez Barcia, S., Russ, M.-S., Meisner, J., & Kästner, J. 2016, Faraday Discuss., 195, 69
- Andersson et al. (2011) Andersson, S., Goumans, T. P. M., & Arnaldsson, A. 2011, Chem. Phys. Lett., 513, 31
- Aresu et al. (2012) Aresu, G., Meijerink, R., Kamp, I., et al. 2012, A&A, 547, A69
- Balakrishnan (2003) Balakrishnan, N. 2003, J. Chem. Phys., 119, 195
- Bensch (2006) Bensch, F. 2006, A&A, 448, 1043
- Benz et al. (2014) Benz, W., Ida, S., Alibert, Y., Lin, D., & Mordasini, C. 2014, Protostars and Planets VI, 691
- Bergin et al. (2010) Bergin, E. A., Phillips, T. G., Comito, C., et al. 2010, A&A, 521, L20
- Beyer et al. (2016) Beyer, A. N., Richardson, J. O., Knowles, P. J., Rommel, J., & Althorpe, S. C. 2016, J. Phys. Chem. Lett., 7, 4374
- Biczysko et al. (2018) Biczysko, M., Bloino, J., & Puzzarini, C. 2018, Wiley Interdisciplinary Reviews: Computational Molecular Science, 8, e1349
- Borden (2016) Borden, W. T. 2016, WIREs Comput. Mol. Sci., 6, 20
- Carr & Najita (2008) Carr, J. S. & Najita, J. R. 2008, Science, 319, 1504
- Cazaux et al. (2016) Cazaux, S., Minissale, M., Dulieu, F., & Hocuk, S. 2016, A&A, 585, A55
- Cazzoletti et al. (2018) Cazzoletti, P., van Dishoeck, E. F., Visser, R., Facchini, S., & Bruderer, S. 2018, A&A, 609, A93
- Crockett et al. (2014) Crockett, N. R., Bergin, E. A., Neill, J. L., et al. 2014, ApJ, 787, 112
- D’Angelo et al. (2018) D’Angelo, M., Cazaux, S., Kamp, I., Thi, W.-F., & Woitke, P. 2018, ArXiv e-prints
- Deming & Seager (2017) Deming, L. D. & Seager, S. 2017, Journal of Geophysical Research (Planets), 122, 53
- Eistrup et al. (2018) Eistrup, C., Walsh, C., & van Dishoeck, E. F. 2018, A&A, 613, A14
- Gamallo et al. (2012) Gamallo, P., Defazio, P., Akpinar, S., & Petrongolo, C. 2012, J. Phys. Chem. A, 116, 8291
- Goumans (2011) Goumans, T. P. M. 2011, Mon. Notices Royal Astron. Soc., 413, 2615
- Goumans & Kästner (2010) Goumans, T. P. M. & Kästner, J. 2010, Angew. Chem. Int. Ed., 49, 7350
- Goumans & Kästner (2011) Goumans, T. P. M. & Kästner, J. 2011, J. Phys. Chem. A, 115, 10767
- Greenwood et al. (2017) Greenwood, A. J., Kamp, I., Waters, L. B. F. M., et al. 2017, A&A, 601, A44
- Hama & Watanabe (2013) Hama, T. & Watanabe, N. 2013, Chem. Rev., 113, 8783
- Harada et al. (2010) Harada, N., Herbst, E., & Wakelam, V. 2010, ApJ, 721, 1570
- Helling et al. (2014) Helling, C., Woitke, P., Rimmer, P. B., et al. 2014, Life, 4
- Herbst et al. (1998) Herbst, E., DeFrees, D. J., Talbi, D., et al. 1998, J. Chem. Phys., 94, 7842
- Hidaka et al. (2009) Hidaka, H., Watanabe, M., Kouchi, A., & Watanabe, N. 2009, Astrophys. J., 702, 291
- Ida & Lin (2008) Ida, S. & Lin, D. N. C. 2008, ApJ, 685, 584
- Isella et al. (2007) Isella, A., Testi, L., Natta, A., et al. 2007, A&A, 469, 213
- Ju et al. (2006) Ju, L.-P., Han, K.-L., & Zhang, J. Z. H. 2006, J. Chem. Theory Comput., 05, 769
- Kamp et al. (2013) Kamp, I., Thi, W.-F., Meeus, G., et al. 2013, A&A, 559, A24
- Kamp et al. (2017) Kamp, I., Thi, W.-F., Woitke, P., et al. 2017, A&A, 607, A41
- Kamp et al. (2010) Kamp, I., Tilling, I., Woitke, P., Thi, W., & Hogerheijde, M. 2010, A&A, 510, A260000+
- Lamberts et al. (2017) Lamberts, T., Fedoseev, G., Kästner, J., Ioppolo, S., & Linnartz, H. 2017, Astron. Astrophys., 599, A132
- Line et al. (2014) Line, M. R., Knutson, H., Wolf, A. S., & Yung, Y. L. 2014, ApJ, 783, 70
- Madhusudhan et al. (2017) Madhusudhan, N., Bitsch, B., Johansen, A., & Eriksson, L. 2017, MNRAS, 469, 4102
- McElroy et al. (2013) McElroy, D., Walsh, C., Markwick, A. J., et al. 2013, A&A, 550, A36
- Meisner (2018) Meisner, J. 2018, PhD thesis, University of Stuttgart
- Meisner & Kästner (2016a) Meisner, J. & Kästner, J. 2016a, Angew. Chem. Int. Ed., 55, 5400
- Meisner & Kästner (2016b) Meisner, J. & Kästner, J. 2016b, J. Chem. Phys., 144, 174303
- Meisner et al. (2017) Meisner, J., Lamberts, T., & Kästner, J. 2017, ACS Earth Space Chem., 1, 399
- Min et al. (2016) Min, M., Rab, C., Woitke, P., Dominik, C., & Ménard, F. 2016, A&A, 585, A13
- Najita et al. (2011) Najita, J. R., Ádámkovics, M., & Glassgold, A. E. 2011, ApJ, 743, 147
- Nguyen & Stanton (2019) Nguyen, T. L. & Stanton, J. F. 2019, International Journal of Chemical Kinetics, 0
- Oba et al. (2012) Oba, Y., Watanabe, N., Hama, T., et al. 2012, Astrophys. J., 749, 67
- Öberg et al. (2011) Öberg, K. I., Murray-Clay, R., & Bergin, E. A. 2011, ApJ, 743, L16
- Orkin et al. (2006) Orkin, V. L., Kozlov, S. N., Poskrebyshev, G. A., & Kurylo, M. J. 2006, J. Phys. Chem. A, 110, 6978
- Pontoppidan et al. (2010) Pontoppidan, K. M., Salyk, C., Blake, G. A., et al. 2010, ApJ, 720, 887
- Ravishankara et al. (1981) Ravishankara, A. R., Nicovich, J. M., Thompson, R. L., & Tully, F. P. 1981, J. Phys. Chem., 85, 2498
- Shannon et al. (2013) Shannon, R. J., Blitz, M. A., Goddard, A., & Heard, D. E. 2013, Nat. Chem., 5, 745
- Smith & Adams (1981) Smith, D. & Adams, N. G. 1981, Monthly Notices of the Royal Astronomical Society, 197, 377
- Talukdar et al. (1996) Talukdar, R. K., Gierczak, T., Goldfarb, L., et al. 1996, J. Phys. Chem., 100, 3037
- Thi et al. (2018) Thi, W. F., Hocuk, S., Kamp, I., et al. 2018, arXiv e-prints
- Thi et al. (2011) Thi, W.-F., Woitke, P., & Kamp, I. 2011, MNRAS, 412, 711
- Tilling et al. (2012) Tilling, I., Woitke, P., Meeus, G., et al. 2012, A&A, 538, A20
- Tolman (1920) Tolman, R. C. 1920, J. Am. Chem. Soc., 42, 2506
- Truhlar (1978) Truhlar, D. G. 1978, J. Chem. Educ., 55, 309
- Truhlar & Kohen (2000) Truhlar, D. G. & Kohen, A. 2000, Proc. Natl. Acad. Sci. U.S.A., 94, 848
- van Dishoeck et al. (2008) van Dishoeck, E. F., Jonkheid, B., & van Hemert, M. C. 2008, ArXiv e-prints
- van Zadelhoff et al. (2003) van Zadelhoff, G.-J., Aikawa, Y., Hogerheijde, M. R., & van Dishoeck, E. F. 2003, A&A, 397, 789
- Wakelam et al. (2017) Wakelam, V., Bron, E., Cazaux, S., et al. 2017, Molecular Astrophysics, 9, 1
- Wakelam et al. (2012) Wakelam, V., Herbst, E., Loison, J.-C., et al. 2012, ApJS, 199, 21
- Walsh et al. (2014) Walsh, C., Millar, T. J., Nomura, H., et al. 2014, A&A, 563, A33
- Wiesenfeld et al. (2016) Wiesenfeld, L., Thi, W.-F., Caselli, P., et al. 2016, ArXiv e-prints
- Williams et al. (2013) Williams, T., Kelley, C., & many others. 2013, Gnuplot 5.0: an interactive plotting program, http://gnuplot.sourceforge.net/
- Woitke et al. (2009a) Woitke, P., Kamp, I., & Thi, W.-F. 2009a, A&A, 501, 383
- Woitke et al. (2016) Woitke, P., Min, M., Pinte, C., et al. 2016, A&A, 586, A103
- Woitke et al. (2009b) Woitke, P., Thi, W.-F., Kamp, I., & Hogerheijde, M. R. 2009b, A&A, 501, L5
- Woodall et al. (2007) Woodall, J., Agúndez, M., Markwick-Kemper, A. J., & Millar, T. J. 2007, A&A, 466, 1197
- Zhao et al. (2016) Zhao, H., Wang, W., & Zhao, Y. 2016, J. Phys. Chem., 120, 7589, pMID: 27640428
- Zuev et al. (2003) Zuev, P. S., Sheridan, R. S., Albu, T. V., et al. 2003, Science, 299, 867