EXO-200 Collaboration
Search for Neutrinoless Double-Beta Decay with the Complete EXO-200 Dataset
Abstract
A search for neutrinoless double-beta decay () in 136Xe is performed with the full EXO-200 dataset using a deep neural network to discriminate between and background events. Relative to previous analyses, the signal detection efficiency has been raised from to and the energy resolution of the detector at the Q-value of 136Xe has been improved from to with the upgraded detector. Accounting for the new data, the median 90% confidence level half-life sensitivity for this analysis is yr with a total 136Xe exposure of 234.1 kgyr. No statistically significant evidence for is observed, leading to a lower limit on the half-life of yr at the 90% confidence level.
Double-beta decay is a second-order weak transition in which two neutrons simultaneously decay into two protons. While the mode with emission of two electrons and two antineutrinos () has been observed in several nuclides in which single-beta decay is suppressed Tanabashi et al. (2018), the hypothetical neutrinoless mode () Furry (1939) is yet to be discovered. The search for is recognized as the most sensitive probe for the Majorana nature of neutrinos Rodejohann (2011); Vergados et al. (2012); Dell’Oro et al. (2016); Dolinski et al. (2019). Its observation would provide direct evidence for a beyond-the-Standard-Model process that violates lepton number conservation, as well as help constrain the absolute mass scale of neutrinos Engel and Menéndez (2017).
Recent experiments probing a number of nuclides Albert et al. (2018); Gando et al. (2016); Aalseth et al. (2018); Agostini et al. (2018); Alduino et al. (2018) have set lower limits on the half-life with sensitivities in the range yr at 90% confidence level (CL). Exploiting the advantages of a liquid xenon (LXe) cylindrical time projection chamber (TPC) filled with LXe enriched to 80.6% in 136Xe Albert et al. (2014), EXO-200 Auger et al. (2012) achieved a sensitivity of yr with the most recent search Albert et al. (2018), while the most sensitive search to date for the same isotope reached yr Gando et al. (2016). Here we report on a search with similar sensitivity to the previous best search.
In Dec. 2018, EXO-200 completed data taking with the upgraded detector (“Phase II”, May 2016 to Dec. 2018), after collecting an exposure similar to that of its first run (“Phase I”, Sept. 2011 to Feb. 2014). This letter reports a search for using the full EXO-200 dataset, which after data quality cuts Albert et al. (2014) totals 1181.3 d of livetime. This represents approximately a 25% increase in exposure relative to the previous search Albert et al. (2018) that already included nearly half of the Phase II dataset. In addition to the new data acquired between Jun. 2017 and Oct. 2018, this search introduces several analysis developments to optimize the detector sensitivity to , including the incorporation of a deep neural network (DNN) to discriminate between background and signal events.
In the EXO-200 detector, a common cathode splits the LXe TPC into two drift regions, each with radius 18 cm and drift length 20 cm. The TPC is enclosed by a radiopure thin-walled copper vessel. The electric field in the drift regions was raised from 380 V/cm in Phase I to 567 V/cm in Phase II to improve the energy resolution, since it was found that, after the detector was re-started, higher voltage values on the cathode were stable. The ionization produced from interactions in the LXe is read out after being drifted to crossed-wire planes at each anode, while the scintillation light produced at the interaction time is collected by arrays of large area avalanche photodiodes (LAAPDs) Neilson et al. (2009) located behind the wire planes.
The underground location of the experiment, the Waste Isolation Pilot Plant (WIPP) near Carlsbad New Mexico, provides an overburden of 1624 meters of water equivalent Albert et al. (2016). In addition to several layers of passive shielding, including 50 cm of HFE-7000 cryofluid 3M HFE-7000 , 5.4 cm of copper and 25 cm of lead in all directions Auger et al. (2012), an active muon veto system with scintillator panels on four sides allows prompt identification of of the cosmic ray muons passing through the TPC. This system is also used in this analysis to reject background events arising from cosmogenically produced 137Xe, which primarily decays via emission with a half-life of 3.82 min Albert et al. (2018); Carlson et al. (1969).
Each TPC event is reconstructed by grouping charge and light signals into individual energy deposits. Ionization signals measured by two wire planes, an induction plane (V-wires) and a collection plane (U-wires), provide information about the coordinates and perpendicular to the drift field. The position, along the drift direction, is obtained from the time delay between the prompt light and the delayed charge signals together with the measured electron drift velocity Albert et al. (2017). Events reconstructed with single and multiple energy deposit(s) are referred to as “single-site” (SS) and “multi-site” (MS). events are predominantly SS whereas backgrounds are mostly MS. While the main procedures for spatial reconstruction are the same as in previous searches Albert et al. (2014, 2014, 2018), the detection efficiency has been raised to % (%) in Phase I (Phase II) from % (%) Albert et al. (2018) by relaxing two selection criteria. First, the time required for events to be separated from all other reconstructed events has been reduced from s to s. This time cut is still at least two orders of magnitude longer than expected from typical time-correlated backgrounds seen in the detector Albert et al. (2015, 2016), while the efficiency loss due to accidental coincidence is reduced from 7% to 0.5%. Second, the search presented here includes events containing deposits without a detected V-wire signal if these deposits contribute of the total event energy, which were removed in the previous analyses. Because of the higher energy threshold for signal detection on the V-wires (200 keV) versus the U-wires (90 keV), a significant number of events with small energy deposits are well-reconstructed by the U-wires but incompletely on the V-wires, resulting in events with full reconstruction but incomplete reconstruction for smaller energy deposits. Relaxing this 3D-cut criterion only recovers MS events and retrieves almost all potential events with incomplete reconstruction due to small, separated energy deposits from bremsstrahlung. While primarily induces SS events, the smaller fraction of MS events can be distinguished from the dominant backgrounds using a discriminator for MS events (described below), resulting in an enhancement in the half-life sensitivity.
Events within the fiducial volume (FV) are required to lie within a hexagon in the plane with apothem of 162 mm. They are further required to be more than 10 mm away from the cylindrical PTFE reflector, as well as the cathode and the V-wire planes. This FV contains atoms of 136Xe, with an equivalent mass of 74.7 kg. While the incomplete -matched energy deposits may fall outside the FV, this effect is determined by detector simulations to have a negligible effect on the estimated detection efficiency due to the energy requirements imposed on these events. The 136Xe exposure of the entire dataset after data quality cuts and accounting for livetime loss due to vetoing events coincident with the muon veto is 234.1 kgyr, or 1727.5 molyr, with 117.4 (116.7) kgyr in Phase I (Phase II).
The detector response to decays and background interactions is modeled by a detailed Monte Carlo (MC) simulation based on GEANT4 Allison et al. (2006). This MC simulation models the energy deposits produced by interactions in the LXe, then propagates the ionization through the detector to produce waveforms associated to readout channels. These simulated waveforms are input to the same reconstruction and analysis framework used for data waveforms. Calibration data with external sources located 9 (11) cm away from the FV at set positions around the cathode (behind the anodes) Albert et al. (2014) were regularly taken to validate the analysis.
After the previous EXO-200 search Albert et al. (2018), a small fraction of the observed candidate events presented light-to-charge ratios that were not fully consistent with their expected distributions. Using calibration and data, the distribution of the light-to-charge ratio is measured and found to be approximately gaussian around the mean ratio. While keeping the maximal search sensitivity, a cut is imposed requiring that events are within 2.5 of the mean of the distribution. This improves the previous cut Albert et al. (2014), primarily aimed at removing decays, by also removing poorly reconstructed and events with an anomalous light-to-charge ratio. All systematic errors associated with the signal detection efficiency are summarized in Tab. 1.
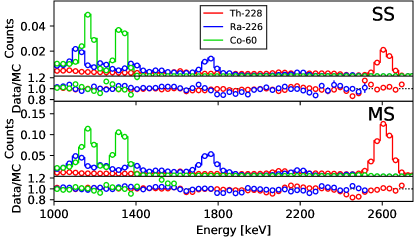
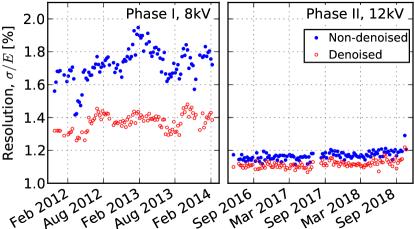
The reconstructed energy is determined by combining the anti-correlated charge and light signals Conti et al. (2003) to optimize the resolution at the decay energy of keV Redshaw et al. (2007). An offline de-noising algorithm Davis et al. (2016), previously introduced to account for excess APD read-out noise observed in Phase I, has been further optimized with measurements of the light response of the detector and adapted for Phase II data. In addition, a proper modeling of mixed signals from the induced and collected charge in wires is introduced to the signal finder in the event reconstruction process. The resulting energy measurement shows good spectral agreement between data and simulation for SS and MS events using 228Th, 226Ra and 60Co calibration sources as shown in Figure 1. The electronics upgrade carried out before Phase II data taking resulted in substantially improved resolution and stability, as illustrated in Figure 2. The average detector resolution is determined by uniformly weighting all calibration data from several positions and accounting for the detector livetime. The averages for Phase I and Phase II are % and %, respectively.
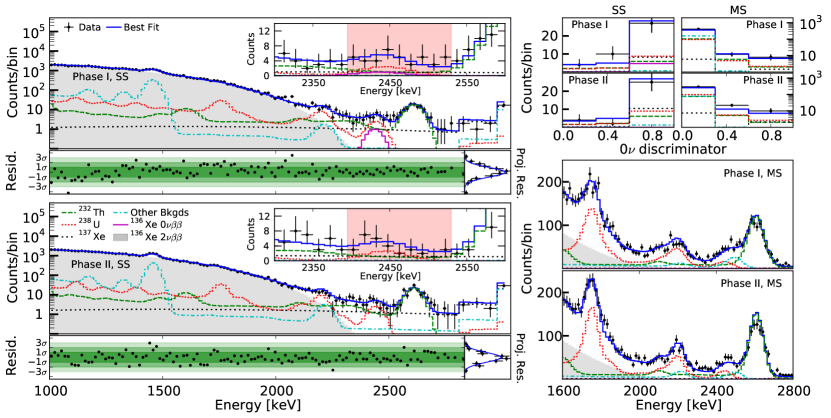
All data, including those previously reported, were blinded to hide all candidate SS events having energy within . No information about such events is used in the development of the techniques for this analysis. New background discriminators are studied to optimize the sensitivity of this search, while minimizing the systematic errors. The search for is performed with a simultaneous maximum-likelihood (ML) fit to the SS and MS energy spectra, with the discriminators added as additional fit dimensions. While Phase I and Phase II are fit independently and then combined by summing their individual profile likelihoods for various signal hypotheses, both use the same background model developed in Albert et al. (2018) composed of decays originating in the detector and surrounding materials. Systematic errors are included in the ML fit as nuisance parameters constrained by normal distributions. The median 90% CL sensitivity is estimated using toy datasets (simulated trial experiments) generated from the MC probability density functions (PDFs) of the background model.
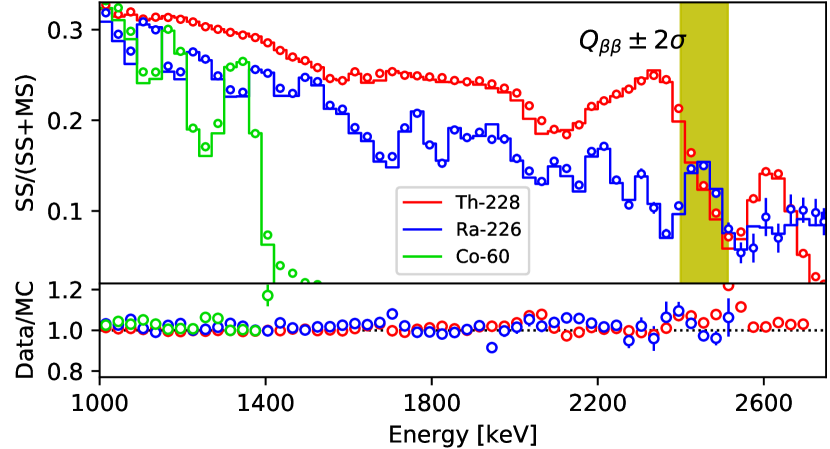
The primary topological discrimination of backgrounds is the SS/MS event classification. Figure 3 shows the agreement between source calibration data and MC for the “SS fraction,” SS/(SS+MS). Because the relaxed 3D-cut recovers MS events, the SS fraction near is lowered from 24% (23%) to 12% (14%) for the 228Th (226Ra) source compared to previous searches. Systematic errors related to the SS fractions are determined by comparisons between data and MC. Taking into account different calibration sources at various positions, these systematics are evaluated to be 5.8% (4.6%) for Phase I (Phase II).
Motivated by the results in Delaquis et al. (2018), this analysis introduces a new discriminator for SS and MS events using a DNN that relies on the waveforms of U-wire signals and is found to outperform the searches in Albert et al. (2014, 2018). The training inputs for the DNN are greyscale images built by arranging neighboring channels next to each other and encoding the amplitudes of U-wire waveforms as pixel values. The training data is produced in MC simulation for two classes of events in equal weights: background-like, composed of events with uniform energy distribution between 1000 keV and 3000 keV; and signal-like events with a random decay energy restricted to the same energy limits. The location of the simulated interactions of both types are drawn uniformly from the detector volume to focus discrimination only on the topological event characteristics. This dataset is divided into 90% for training and 10% for validation. The DNN architecture is inspired by the Inception architecture proposed by Google Szegedy et al. (2014) and implemented with the Keras library Chollet et al. (2015) using the Tensorflow backend Abadi et al. (2015).
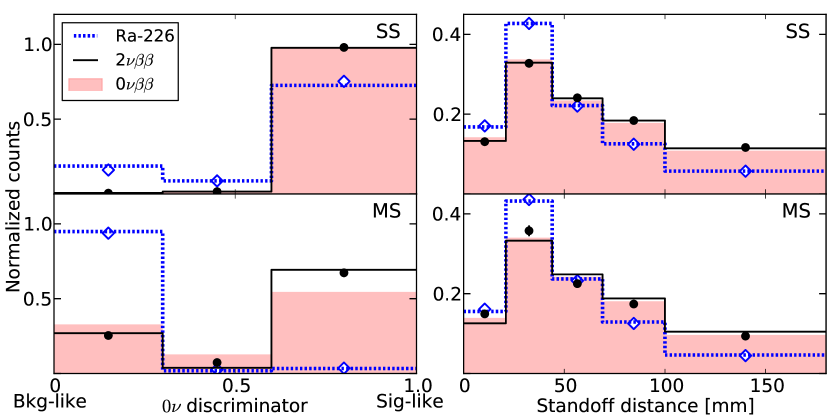
The agreement for the DNN discriminator between data and MC is improved when signals from U-wire waveforms are first identified by the signal finder in the EXO-200 reconstruction framework, and then used to re-generate the images. Since there is no spatial dependence in training the DNN for signal- and background-like events, the standoff distance (minimum distance between the event position and the closest material surface excluding the cathode), is incorporated in the search as a third fit dimension for both SS and MS events. Figure 4 shows a comparison of these two discriminators between simulated and observed data distributions for the 226Ra calibration source, and for the measured background-subtracted distribution. While keeping as much discriminating power as possible, the binning used for each variable is selected to minimize systematic errors arising from imperfections in the MC simulation.
Since the fit cannot resolve the detailed location of backgrounds arising from materials far from the LXe vessel, the 238U, 232Th and 60Co contributions from such components are assigned to fewer representative locations. For example, all far 238U is represented by the decays in the air gap between the cryostats and the lead shielding in the background model. To account for the errors introduced by this approximation, 238U simulated in the cryostats is used to represent all 238U from remote locations. This is taken to represent an extreme deviaion from the more realistic case used in the analysis. The resulting change in the expected number of events near is taken as the systematic error of the background model. This is evaluated to be 4.0% (4.6%) in Phase I (Phase II) by adding contributions from 238U, 232Th and 60Co in quadrature. In addition, toy studies were used to find the average bias in the expected number of events near arising from the measured spectral differences between data and MC for energy, DNN discriminator and standoff distance. The differences between data and MC for their distributions obtained with the calibration sources are used to correct the predicted PDFs, while differences in the background-subtracted distribution are used for -like components. The relative differences between results with toy datasets generated from the corrected PDFs, but fit without this correction, are added in quadrature for all contributors and sum to 5.8% (4.4%) in Phase I (Phase II). Tab. 1 summarizes the contributions to background errors, including other sources unchanged from previous searches.
| Source | Phase I | Phase II |
| Background errors | ||
| Spectral shape agreement | 5.8% | 4.4% |
| Background model | 4.0% | 4.6% |
| Other Albert et al. (2018) | 1.5% | 1.2% |
| Total error | 7.1% | 6.5% |
| Signal detection efficiency | ||
| Fiducial volume | 2.8% | 2.6% |
| Partial 3D cut | ||
| Light-to-charge ratio | 0.9% | 0.9% |
| De-noising mis-rec | - | 1.0% |
| Other Albert et al. (2014) | % | % |
| Total error | 3.1% | 3.1% |
The measured rate of radon decays in the LXe is used to constrain the appropriate background components arising from these atoms, as described in Albert et al. (2014). The relative rate of cosmogenically produced backgrounds is also constrained Albert et al. (2016). In addition, a possible difference between the energy scale from calibration sources () and from single- or double-beta decays () is accounted for by a factor () that scales the energy of the -like components in the ML fit, . is allowed to freely float and found to be consistent with unity to the subpercent level in both phases.
The 90% CL median sensitivity for this search with the DNN discriminator is evaluated to be yr. The coverage is validated with toy MC studies and found to agree with Wilks’s theorem Wilks (1938); Cowan (1998). A secondary analysis is performed using a boosted decision trees (BDT) discriminator for MS events and the BDT discriminator designed in Albert et al. (2018) for SS events as the second fit dimension. The BDT for MS is built on variables containing information on the energy fraction of the most energetic deposit, the spatial spread among deposits and the number of deposits. The BDT analysis provides comparable but slightly worse (3%) sensitivity, suggesting that the discrimination power of the DNN discriminator can be mostly accounted for by careful construction of BDT variables. The DNN analysis was selected as the primary analysis prior to unblinding since it had the best sensitivity.
After unblinding the dataset, the SS candidate events within were examined, which led us to find one event, originally with energy in this region, was mis-reconstructed by the de-noising algorithm. Its impact on the detection efficiency is investigated, and found to only affect Phase II with an efficiency loss . A conservative 1.0% error is also added to the signal detection efficiency.
ML fits are performed to Phase I and Phase II separately, and the best-fit results are shown in Figure 5. No statistically significant evidence for is observed. The best-fit background contributions to are shown in Tab. 2. The rate normalized over the total fiducial Xe mass, including all isotopes, is kg-1yr-1keV-1 and kg-1yr-1keV-1 for Phase I and Phase II respectively. The lower limit on the 136Xe half-life is derived by profiling over all nuisance parameters, and results in yr ( yr) at 90% CL in Phase I (Phase II), while the combined limit is yr. This corresponds to an upper limit on the Majorana neutrino mass of meV Dell’Oro et al. (2016), using the nuclear matrix elements of Barea et al. (2015); Vaquero et al. (2013); Engel et al. (2014); Menéndez et al. (2009); Mustonen and Engel (2013) and phase space factor from Kotila and Iachello (2012).
| (counts) | 238U | 232Th | 137Xe | Total | Data |
|---|---|---|---|---|---|
| Phase I | 12.6 | 10.0 | 8.7 | 32.32.3 | 39 |
| Phase II | 12.0 | 8.2 | 9.3 | 30.92.4 | 26 |
EXO-200 has concluded its operations reaching a sensitivity to Majorana neutrino mass of meV, similar to the most sensitive searches for to date Gando et al. (2016); Aalseth et al. (2018); Agostini et al. (2018); Alduino et al. (2018). The analysis presented here utilizes a DNN, which maximally makes use of detailed event topology information for background rejection, leading to a 25% improvement relative to the sensitivity using only event energy and simple SS/MS discriminators. This performance results from the unique capabilities of a monolithic LXe TPC, which includes good energy resolution, near maximal signal detection efficiency and strong topological discrimination of backgrounds. This combination holds promise for nEXO Al Kharusi et al. (2018); Albert et al. (2018), the planned tonne-scale successor to EXO-200, designed to achieve a sensitivity to half-life of yr in 136Xe.
Acknowledgements.
EXO-200 is supported by DOE and NSF in the United States, NSERC in Canada, SNF in Switzerland, IBS in Korea, RFBR (18-02-00550) in Russia, DFG in Germany, and CAS and ISTCP in China. EXO-200 data analysis and simulation uses resources of the National Energy Research Scientific Computing Center (NERSC). We gratefully acknowledge the KARMEN collaboration for supplying the cosmic-ray veto detectors, and the WIPP for their hospitality.References
- Tanabashi et al. (2018) M. Tanabashi et al. (Particle Data Group), Phys. Rev. D98, 030001 (2018).
- Furry (1939) W. H. Furry, Phys. Rev. 56, 1184 (1939).
- Rodejohann (2011) W. Rodejohann, Int. J. Mod. Phys. E20, 1833 (2011), arXiv:1106.1334 [hep-ph] .
- Vergados et al. (2012) J. D. Vergados, H. Ejiri, and F. Simkovic, Rept. Prog. Phys. 75, 106301 (2012), arXiv:1205.0649 [hep-ph] .
- Dell’Oro et al. (2016) S. Dell’Oro et al., Adv. High Energy Phys. 2016, 2162659 (2016), arXiv:1601.07512 [hep-ph] .
- Dolinski et al. (2019) M. J. Dolinski, A. W. P. Poon, and W. Rodejohann, Submitted to: Ann. Rev. Nucl. Part. Phys. (2019), arXiv:1902.04097 [nucl-ex] .
- Engel and Menéndez (2017) J. Engel and J. Menéndez, Rept. Prog. Phys. 80, 046301 (2017), arXiv:1610.06548 [nucl-th] .
- Albert et al. (2018) J. B. Albert et al. (EXO-200 Collaboration), Phys. Rev. Lett. 120, 072701 (2018), arXiv:1707.08707 [hep-ex] .
- Gando et al. (2016) A. Gando et al. (KamLAND-Zen Collaboration), Phys. Rev. Lett. 117, 082503 (2016), arXiv:1605.02889 [hep-ex] .
- Aalseth et al. (2018) C. E. Aalseth et al. (MAJORANA Collaboration), Phys. Rev. Lett. 120, 132502 (2018), arXiv:1710.11608 [nucl-ex] .
- Agostini et al. (2018) M. Agostini et al. (GERDA Collaboration), Phys. Rev. Lett. 120, 132503 (2018), arXiv:1803.11100 [nucl-ex] .
- Alduino et al. (2018) C. Alduino et al. (CUORE Collaboration), Phys. Rev. Lett. 120, 132501 (2018), arXiv:1710.07988 [nucl-ex] .
- Albert et al. (2014) J. B. Albert et al. (EXO-200 Collaboration), Phys. Rev. C 89, 015502 (2014), arXiv:1306.6106 [nucl-ex] .
- Auger et al. (2012) M. Auger et al., JINST 7, P05010 (2012), arXiv:1202.2192 [physics.ins-det] .
- Neilson et al. (2009) R. Neilson et al., Nucl. Inst. & Meth. A 608, 68 (2009), arXiv:0906.2499 [physics.ins-det] .
- Albert et al. (2016) J. B. Albert et al. (EXO-200 Collaboration), JCAP 1604, 029 (2016), arXiv:1512.06835 [nucl-ex] .
- (17) 3M HFE-7000, https://www.3m.com/3M/en_US/company-us/all-3m-products/~/3M-Novec-7000-Engineered-Fluid/?N=5002385+3290667267&rt=rud.
- Carlson et al. (1969) G. C. Carlson et al., Nucl. Phys. A125, 267 (1969).
- Albert et al. (2017) J. B. Albert et al. (EXO-200 Collaboration), Phys. Rev. C95, 025502 (2017), arXiv:1609.04467 [physics.ins-det] .
- Albert et al. (2014) J. B. Albert et al. (EXO-200 Collaboration), Nature 510, 229 (2014), arXiv:1402.6956 [nucl-ex] .
- Albert et al. (2015) J. B. Albert et al. (EXO-200 Collaboration), Phys. Rev. C 92, 015503 (2015), arXiv:1503.06241 [physics.ins-det] .
- Allison et al. (2006) J. Allison et al., IEEE Trans. Nucl. Sci. 53, 270 (2006).
- Conti et al. (2003) E. Conti et al., Phys. Rev. B 68, 054201 (2003), arXiv:hep-ex/0303008 [hep-ex] .
- Redshaw et al. (2007) M. Redshaw et al., Phys. Rev. Lett. 98, 053003 (2007).
- Davis et al. (2016) C. G. Davis et al. (EXO-200 Collaboration), JINST 11, P07015 (2016), arXiv:1605.06552 [physics.ins-det] .
- Delaquis et al. (2018) S. Delaquis et al., JINST 13, P08023 (2018), arXiv:1804.09641 [physics.ins-det] .
- Szegedy et al. (2014) C. Szegedy et al., CoRR (2014), arXiv:1409.4842 .
- Chollet et al. (2015) F. Chollet et al., https://keras.io (2015).
- Abadi et al. (2015) M. Abadi et al., https://www.tensorflow.org (2015).
- Wilks (1938) S. S. Wilks, Ann. Math. Statist. 9, 60 (1938).
- Cowan (1998) G. Cowan, Statistical Data Analysis, Oxford science publications (Clarendon Press, 1998).
- Barea et al. (2015) J. Barea et al., Phys. Rev. C 91, 034304 (2015), arXiv:1506.08530 [nucl-th] .
- Vaquero et al. (2013) N. L. Vaquero et al., Phys. Rev. Lett. 111, 142501 (2013), arXiv:1401.0650 [nucl-th] .
- Engel et al. (2014) J. Engel et al., Phys. Rev. C 89, 064308 (2014), arXiv:1403.7860 [nucl-th] .
- Menéndez et al. (2009) J. Menéndez et al., Nucl. Phys. A 818, 139 (2009), arXiv:0801.3760 [nucl-th] .
- Mustonen and Engel (2013) M. T. Mustonen and J. Engel, Phys. Rev. C 87, 064302 (2013), arXiv:1301.6997 [nucl-th] .
- Kotila and Iachello (2012) J. Kotila and F. Iachello, Phys. Rev. C 85, 034316 (2012), arXiv:1209.5722 [nucl-th] .
- Al Kharusi et al. (2018) S. Al Kharusi et al. (nEXO Collaboration), pre-print (2018), arXiv:1805.11142 [physics.ins-det] .
- Albert et al. (2018) J. B. Albert et al. (nEXO Collaboration), Phys. Rev. C97, 065503 (2018), arXiv:1710.05075 [nucl-ex] .