OutdoorSent: Sentiment Analysis of Urban Outdoor Images by Using Semantic and Deep Features
Abstract.
Opinion mining in outdoor images posted by users during different activities can provide valuable information to better understand urban areas. In this regard, we propose a framework to classify the sentiment of outdoor images shared by users on social networks. We compare the performance of state-of-the-art ConvNet architectures, and one specifically designed for sentiment analysis. We also evaluate how the merging of deep features and semantic information derived from the scene attributes can improve classification and cross-dataset generalization performance. The evaluation explores a novel dataset, namely OutdoorSent, and other datasets publicly available. We observe that the incorporation of knowledge about semantic attributes improves the accuracy of all ConvNet architectures studied. Besides, we found that exploring only images related to the context of the study, outdoor in our case, is recommended, i.e., indoor images were not significantly helpful. Furthermore, we demonstrated the applicability of our results in the city of Chicago, USA, showing that they can help to improve the knowledge of subjective characteristics of different areas of the city. For instance, particular areas of the city tend to concentrate more images of a specific class of sentiment, which are also correlated with median income, opening up opportunities in different fields.
1. Introduction
Sentiment analysis based on images has an inherent subjectivity since it involves the visual recognition of objects, scenes, actions, and events. Therefore, the algorithms need to be robust, make use of different types of features, and have a generalization capability to cover different domains. Even so, the problem is still challenging because distinct people may have different opinions (in terms of sentiment polarity) about the same image.
Nowadays, a considerable amount of people share their experiences and opinions on the most diverse subjects on online social networks. This generates a vast amount of data, and their proper analysis plays an essential role in several segments, ranging from prediction of spatial events (Zhao et al., 2016), and rumor analysis (Middleton and Krivcovs, 2016) to the study of urban social behavior (Mueller et al., 2017; Cranshaw et al., 2012). Specifically, sentiment analysis expressed by users in social networks has several applications, since a better understanding of their opinions about specific products, brands, places, or events can be useful in decision making.
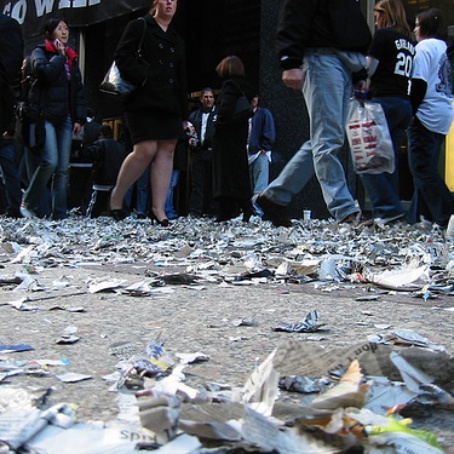
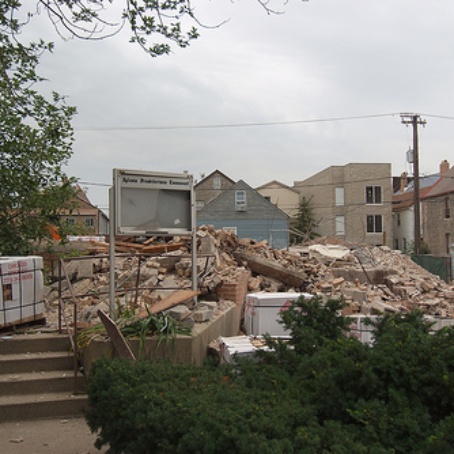
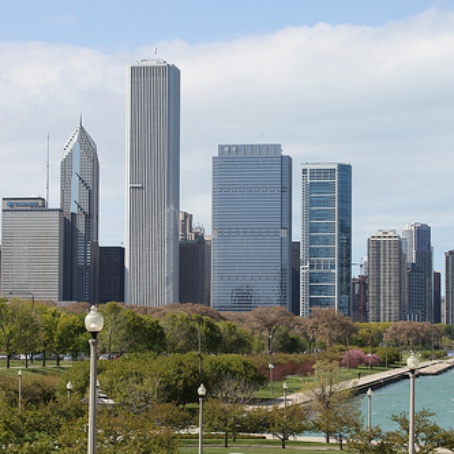
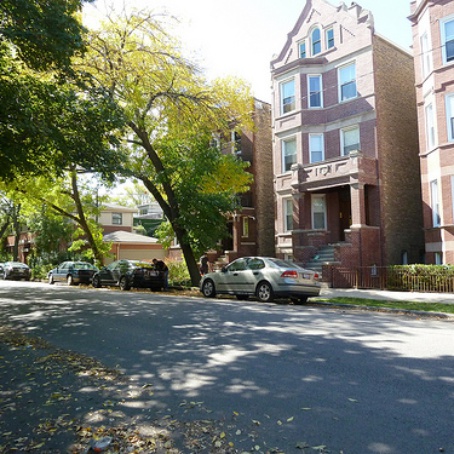
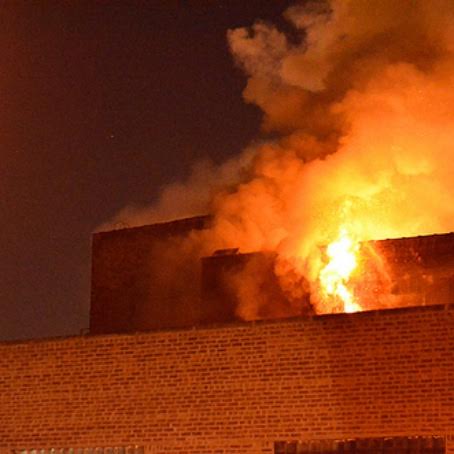
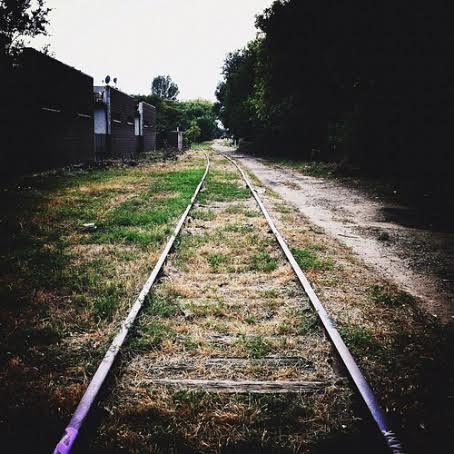
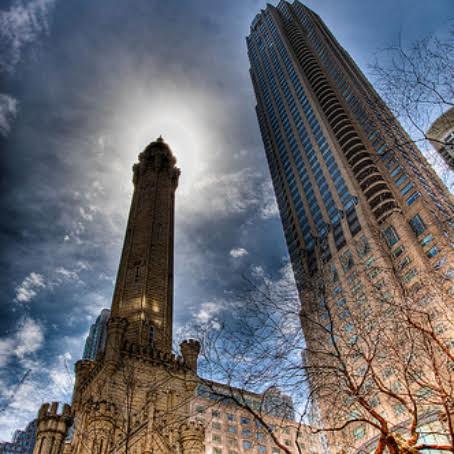
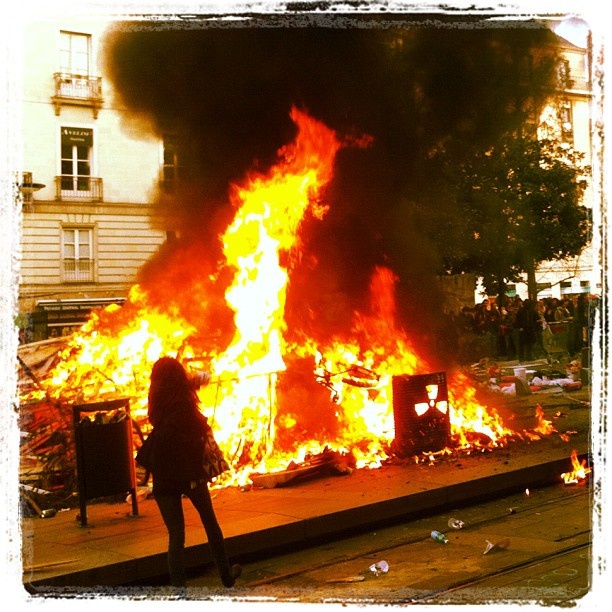
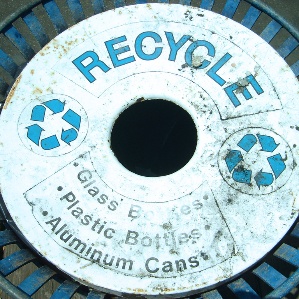
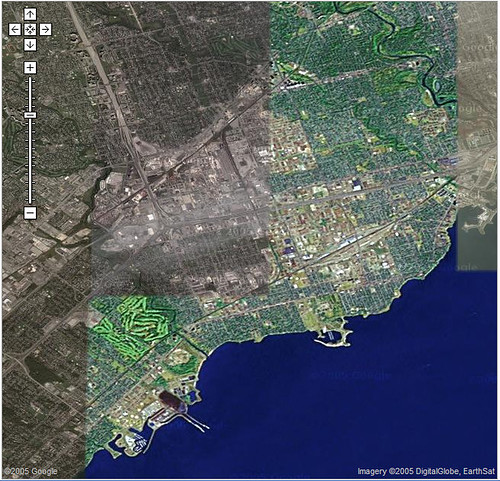
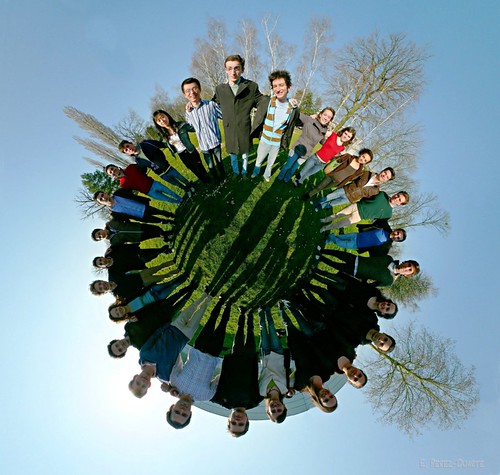
Although sentiment analysis in textual content has already been developed considerably, its use in visual means is a hot-trend topic of research (Campos et al., 2017; Chen et al., 2014; Dhall et al., 2015), inspired by the fact that image sharing has become prevalent (You et al., 2015b; Parrett, 2016). The development of novel techniques for this purpose may complement text-based approaches (Ribeiro et al., 2016; Benevenuto et al., 2015; Zhou and Huang, 2017; Zhan et al., 2019), even those that use deep learning (Huang et al., 2017b; Baly et al., 2016), as well as, enable new services on platforms where the shared content is predominantly visual, such as Instagram, Snapchat, and Flickr111https://www.instagram.com; https://www.snapchat.com and https://www.flickr.com.. For the images illustrated in Figure 1, shared on Flickr, if one considers just the associated textual content, important characteristics of the sentiment visually expressed by users are not captured correctly.
The present study focus on the sentiment understanding of urban outdoor images shared by users on social networks. They can carry valuable information about urban areas since indoor images tend not to reflect specific characteristics of these scenarios (establishments in the same area probably have very different internal appearances). Therefore, it is important to explore the performance of the sentiment analysis techniques in the specific context of outdoor areas to further allow high-level tasks such as the semantic classification of urban areas, for example.
Based on the remarkable advances that deep features (LeCun et al., 2015) are providing in several areas (LeCun et al., 2015), they are used in this work for sentiment classification of urban outdoor images. Five different convolutional neural network (ConvNet) architectures were compared, four widely used in machine learning, and one specifically designed for sentiment analysis (You et al., 2015b). We also explored the use of semantic features, derived from SUN (Scene UNderstanding) (Patterson and Hays, 2012; Patterson et al., 2014) and YOLO (You Only Look Once) (Redmon and Farhadi, 2017) attributes, both designed for high-level scene understanding.
In summary, our main goals are to: (i) study the impact on classification performance in each architecture by taking into account jointly deep and semantic features; (ii) investigate whether images out of context, indoor images in our case, help in the classification results; (iii) analyze what is the impact of different datasets in the results; and (iv) demonstrate an applicability of the results.
In summary, the main contributions of this work are:
-
•
The proposal of a novel dataset of geolocalized urban outdoor images, extracted from Flickr, and labeled as positive, negative, or neutral by at least five different volunteers. Although some initiatives do not consider the neutral polarity (You et al., 2015b; Chen et al., 2014; Borth et al., 2013), we chose to use it to contemplate cases where an image is not associated with extreme polarities, as well as cases where there is no consensus between users about the sentiment expressed. We believe its introduction leads to results closer to reality since the volunteers of our research classified a significant amount of images as neutral.
-
•
The proposal of a framework for sentiment analysis that combines global scene features and high-level semantics. As part of this work, we evaluated four state-of-the-art widely used ConvNet architectures, namely VGG16 (Simonyan and Zisserman, 2014), ResNet50 (He et al., 2016), InceptionV3 (Szegedy et al., 2016), and DenseNet169 (Huang et al., 2017a), all fine-tuned with pre-trained ImageNet weights (Deng et al., 2009), and the state-of-art architecture of You et al. (You et al., 2015b), designed specifically for sentiment analysis.
-
•
An analysis of the impact of merging deep features with semantic features derived from SUN (Patterson and Hays, 2012; Patterson et al., 2014) and YOLO (Redmon and Farhadi, 2017) attributes, both initially designed for high-level scene understanding in terms of categories to describe scenes and objects on images, respectively. We carried out experiments in different datasets and concluded that the incorporation of semantic features in the models improved the accuracy result of previous initiatives for the context studied. Furthermore, we also show that the use of semantic attributes improved the performance of all ConvNets architectures but had a much more significant impact on the most straightforward architectures.
-
•
A cross-dataset generalization study to evaluate the robustness capacity of the proposed architecture when considering different datasets for training and testing. We found that the simplest architecture evaluated, the ConvNet of You et al. (You et al., 2015b), demonstrated to be more robust in all considered scenarios. We also observed that image edition has an influence on the robustness performance, e.g., Instagram images, unlike Flickr images, tend to have filters, written messages, and other resources. Besides, we have an indication that the dataset size plays a positive role in this aspect.
-
•
The evaluation of the influence of indoor images in the sentiment classification of outdoor images. By performing different sets of experiments, we observed that there is no significant gain in using indoor images that pay of the high extra cost demanded.
-
•
The demonstration of the feasibility of our approach in a real-world scenario. We analyzed the sentiment in outdoor images shared on Chicago through Flickr – new images were obtained for this analysis. This evaluation shows that our approach could be useful in understanding the subjective characteristics of areas and their inhabitants. The results suggest that particular areas of the city tend to concentrate more images of a specific class of sentiment, having predominant inherent characteristics.
The ConvNet architectures, trained models, and the proposed outdoor image dataset are publicly available at http://dainf.ct.utfpr.edu.br/outdoorsent. The remainder of this paper is organized as follows. Section 2 reviews the literature on sentiment analysis. Section 3 details the methodology used in this study. Section 4 discusses the results obtained. Section 5 shows the results when evaluating the robustness capacity of the proposed architecture when considering different datasets for training and testing (cross-dataset generalization). Section 6 presents an evaluation of our results in a real-world scenario. Section 7 presents the potential implications and limitations of the study. Finally, Section 8 concludes the study.
2. Related Work
Automated sentiment analysis is essential for several tasks, including those related to the understanding of human behavior and decision-making support. For instance, Kramer et al. (Kramer et al., 2014) suggested that emotions expressed on Facebook can be transferred to other people without their awareness, which could cause large-scale emotional contagion in virtual communities. Choudhury et al. (De Choudhury et al., 2013) estimated the risk of depression by analyzing behavioral attributes such as social engagement, emotion, language, and linguistic styles in tweets from users diagnosed with clinical depression. Golder and Macy (Golder and Macy, 2011) found that positive and negative emotions expressed on Twitter match well-known daytime and seasonal behavioral patterns in different cultures.
Algorithms for this active field of research are mostly concentrated on textual content (Baly et al., 2016; Huang et al., 2017b; Mikolov et al., 2010; Hochreiter and Schmidhuber, 1997). However, there are some limitation on exploring only this source of data for sentiment analysis for various scenarios, mainly where there is limited text, and the content is primarily visual, such as Instagram posts (Ji et al., 2016).
Regarding sentiment analysis on visual content, e.g., images and videos, algorithms for this task, traditionally, were based on low-level visual attributes such as colors (Siersdorfer et al., 2010), texture (Jia et al., 2012), image gradients (Li et al., 2012), metadata and speech transcripts (Hanjalic et al., 2012), and descriptors inspired by psychology and art theory (Machajdik and Hanbury, 2010). There are also studies dedicated to assess the impact of high-level abstraction for sentiment analysis, such as attributes on visual content regarding, for instance, material (e.g., metal), surface (e.g., rusty), as explored by Yuan et al. (Yuan et al., 2013), and visual concepts that are strongly related to sentiments, as used by Borth et al. (Borth et al., 2013).
In recent years, inspired by the breakthroughs of convolutional neural networks (ConvNet) (LeCun et al., 2015) in machine learning, many authors proposed novel architectures for visual sentiment analysis. For example, You et al. (You et al., 2015b) used a probabilistic ConvNet sampling to reduce the impact of noisy data by removing training instances with similar sentiment scores. Chen et al. (Cai and Xia, 2015) used transfer learning from ImageNet weights (Deng et al., 2009) in their ConvNet to deal with biased training data, which only contains images with strong sentiment polarity. Discriminative face features (Wu et al., 2016), extracted from ConvNets architectures, were also used to estimate people’s happiness in the wild. Cai and Xia (Chen et al., 2014) proposed to explore ConvNet to combine visual features with sentiment concepts, automatically identified from the tags available on public images on the Web for detecting sentiments depicted in the images. Song et al. (Song et al., 2018) proposed to include visual attention on images into ConvNets aiming to boost the sentiment classification performance.
In the same direction, some approaches consider the joint representation over multi-modal inputs from microblogs containing video, image, text, and emoticons to sentiment analysis. For instance, Chen et al. (Fuhai Chen et al., 2015) presents a multi-modal classification model for microblog sentiment classification, taking into account the correlation and independence among distinct modalities. Poria et al. (Poria et al., 2017) proposed an approach to extract characteristics from textual and visual modalities using ConvNets. You et al. (You et al., 2015a) introduced a model considering ConvNet that takes into account the modality, text, and image, to classify sentiments. To tackle some of the problems of previous approaches, especially the scalability issue related to human-labeled sentiment data, some approaches propose the exploration of emotion related symbols, such as emoticons, common in specific systems, such as Twitter and Sina Weibo222A Twitter-like system from China. (Lin et al., 2018; Chen et al., 2018). Similarly, Vadicamo et al. (Vadicamo et al., 2017) presented an approach that considers content composed of text and image, e.g., tweets, to extract labels referring to sentiment polarity. Araque (Araque et al., 2017) proposed to fuse deep and classic hand-crafted features for sentiment analysis of textual data in social applications by using an ensemble of classifiers.
In a similar direction, Ortis et al. (Ortis et al., 2018) compared text provided by users to label social images (subjective) and text automatically extracted from the visual content using four deep learning models trained to perform visual inference tasks (objective). They considered different combinations of subjective text, objective text, and visual features for sentiment polarity estimation using an SVM-based image sentiment classifier. One important conclusion is that subjective text introduces noise and affects classification performance. On the other hand, the combination of visual features and objective text produced better results.
While there are some initiatives showing the importance of outdoor images to the semantic classification of urban areas, such as the study of Santani et al. (Santani et al., 2018) that extracts labels for outdoor urban images, none of the previous studies focused on sentiment analysis of urban outdoor images.
In this study, in addition to a comparative study of different ConvNets already consecrated in the area of machine learning, we proposed a novel framework that incorporates into the classification process semantic features extracted directly from the images (without using metadata). Also differentiating from previous studies, we analyzed the impact of considering indoor images in the classification of outdoor ones. Then, we evaluated the cross-dataset generalization for different architectures in different scenarios.
3. Methodology
3.1. Overview
Sentiment analysis based on images has an inherent subjectivity since it involves the visual recognition of objects, scenes, actions, and events. Therefore, learning approaches need to be robust to be able to cover different domains.
In this context, we first evaluate four different experimental setups, illustrated in Figure 2, with varying datasets of images, as well as with and without combining the activation maps of the convolution layers with SUN (Patterson et al., 2014) and YOLO (Redmon and Farhadi, 2017) semantic attributes. SUN attributes represent the principal categories used by people to describe scenes and are intended to be an intermediate representation used in applications such as scene classification, search based on semantics, and automatic labeling, to mention some examples. YOLO attributes, more specifically those extracted using the YOLO9000 network, include many objects of interest for urban sentiment analysis such as guns, fire, homeless, etc. The detection of such semantic attributes incorporates knowledge useful to perform visual inference tasks.
The first two experimental setups (Figures 2(a)-(b)) are based on a publicly available image dataset (DeepSent) where only positive and negative polarities are considered. The last two (Figures 2(c)-(d)) use the novel urban outdoor image dataset proposed in this work (OutdoorSent), a dataset that takes into account an additional polarity: neutral. Section 3.2 details these datasets.
Each setup compared five ConvNet architectures, whose performance has excelled in different areas: VGG16 (Simonyan and Zisserman, 2014), Resnet50 (He et al., 2016), InceptionV3 (Szegedy et al., 2016) and DenseNet169 (Huang et al., 2017a), fine-tuned with pre-trained ImageNet weights (Deng et al., 2009), and the state-of-art architecture of You et al. (You et al., 2015b), designed specifically for sentiment analysis.
Section 3.3 presents the proposed ConvNet framework for sentiment analysis in outdoor images. Next, we evaluate whether indoor images can help in the classification of outdoor images. In addition, we investigate the cross-dataset generalization power of the proposed framework.
3.2. Datasets
In order to evaluate the selected ConvNets and semantic attributes, we used datasets with images from different domains. Specifically, we considered one dataset composed of indoor and outdoor images (Section 3.2.1), and another one containing only outdoor images (Section 3.2.2). All images are in the JPEG format.
3.2.1. Twitter dataset - DeepSent
The first dataset used in this work, known as DeepSent, consists of 1,269 images of Twitter and is available in (You et al., 2015b). All samples were manually labeled as positive or negative by five people using the Amazon Mechanical Turk333https://www.mturk.com. (AMT) crowd-sourcing platform.
The dataset is subdivided according to the consensus of the labels, that is, taking into account the number of people that attributed the same sentiment to a given image. Table 1 details the distribution of the results, where “five agree” indicates that all five AMT workers labeled the image with the same sentiment, “four agree” demonstrates that at least four gave the same label and “three agree” that at least three agreed on the rating.
| Sentiment | Five agree | Four agree | Three agree |
|---|---|---|---|
| Positive | 581 | 689 | 769 |
| Negative | 301 | 427 | 500 |
| Total: | 882 | 1116 | 1269 |
Figure 3 shows examples of images labeled as positive and negative by volunteers of the DeepSent dataset. Note that one could argue that some of the images are more neutral than the sentiment classified.


3.2.2. OutdoorSent
The dataset proposed in this study, called OutdoorSent444 http://dainf.ct.utfpr.edu.br/outdoorsent, is composed only by outdoor images. We aim to facilitate studies that demand more representative characteristics of different urban areas, considering that indoor images of establishments in the same area can be quite different.
For this dataset, we take into account 40,516 publicly available Flickr images, all of them are geolocalized in the city of Chicago. From that initial dataset, we select only the 19,411 classified as outdoor by the ConvNet Places365 (Zhou et al., 2018) pre-trained for the Places2 dataset (a repository of eight million images). Precisely for this task, the Residual Network architecture (WideResNet18) was used because it has obtained the best classification accuracy and speed.
To create a training dataset, a subset of 1,950 images were randomly selected. Each of them was labeled based on the evaluation of at least five different volunteers, who graded each image according to the sentiment it represents: 1 (negative), 2 (slightly negative), 3 (neutral), 4 (slightly positive), and 5 (positive). Since we use five different classes for the characterization of sentiment, the subdivision of the dataset according to the consensus is not feasible. Thus, the final label was defined based on the grade average:
-
•
Average below 2.2: negative;
-
•
Average between 2.2 and 3.8: neutral;
-
•
Average above 3.8: positive.
Each of the 30 volunteers (mostly undergraduate students) labeled 300 images divided into blocks of 15 images to make the process less tiring and error-prone (since users could respond to each block at different times). The interface was built using GoogleForms, with each block of images explaining the purpose of the project and the methodology that should be used, accompanied by an example. The choice of the images that would be shown in each block was random, and the forms were generated automatically with the aid of a script. Thus, it was possible to guarantee that each form contained images without repetitions. Each volunteer received 15 distinct forms, and the responses for each user were counted only once. Using internal management, we ensure that at least five different volunteers answered each form.
Table 2 details the class distribution. The difference between the number of samples in the different classes is due to the nature of the images of the dataset, which has more neutral and positive images.
| Sentiment | Quantity of images |
|---|---|
| Negative | 259 |
| Neutral | 1187 |
| Positive | 504 |
| Total: | 1950 |
Besides, it should be emphasized that the inclusion of the neutral class aims to make the classification more realistic. In addition to allowing people to classify images where it is not possible to attribute a positive or negative sentiment, it enables a very subjective task to be relaxed, since different people may have a different opinion about the same image. It is essential to mention that the volunteers of our research classified a significant amount of images as neutral, demonstrating its relevance.
Although previous studies have considered the neutral sentiment, in some cases, it is attributed to inherently negative scenes, such as photos of fatal accidents that show the victim (Ahsan et al., 2017). Due to that, our dataset is more representative. Figure 4 illustrates examples of images labeled as positive, neutral, and negative.


3.3. ConvNet Framework
Most state-of-the-art architectures for visual content sentiment analysis are shallow, in terms of convolutional layers, to extract deep features that could represent human sentiments. For instance, You et al. (You et al., 2015b) in 2015, used a ConvNet with only two convolutions in a seminal work for the field. However, as observed by Le Cun et al. (LeCun et al., 2015), deep convolutional neural networks are essential for the learning process of complex structures because the first convolutional layers typically represent low-level features such as edges, orientations and spatially, while deep layers combine these coarse features to recognize complex structures.
Therefore, we consider in our framework deep state-of-the-art ConvNet architectures widely used in machine learning: VGG-16 (Simonyan and Zisserman, 2014) (16 layers), Resnet (He et al., 2016) (50 layers), InceptionV3 (Szegedy et al., 2016) (42 layers) and DenseNet (Huang et al., 2017a) (169 layers). These architectures were fine-tuned with pre-trained ImageNet weights (Deng et al., 2009) to speed up the training phase. We also considered the architecture of You et al. (You et al., 2015b) (2 convolutional layers) since it was explicitly designed for sentiment analysis. The ConvNet framework we developed for sentiment analysis of outdoor images is shown in Figure 5, where the convolution maps and SUN + YOLO attributes are connected in a sequence of dense layers for the extraction of negative and positive sentiments (and neutral for OutdoorSent dataset).
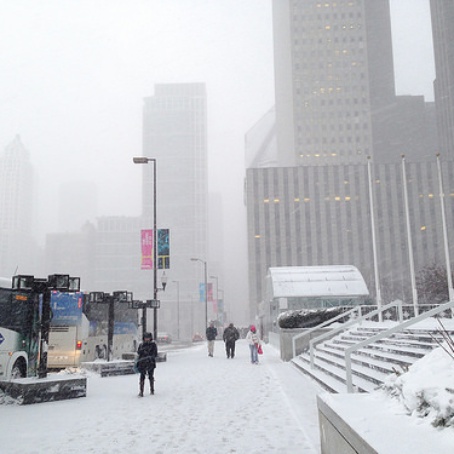
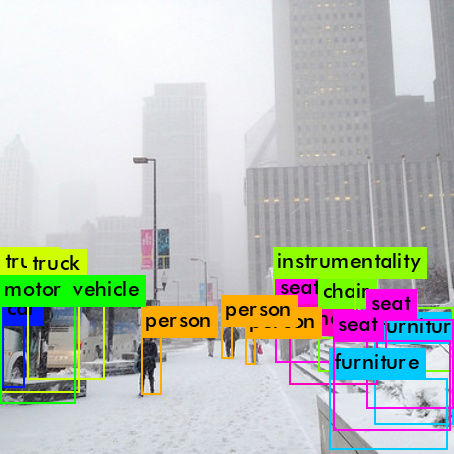
Another key aspect of our framework is the merging process of convolutional activation maps with high-level semantic features, which are crucial to tackling some significant challenges of sentiment analysis concerning visual content. For an example of how the existence of some objects in the scene can be decisive in describing the scene polarity see Figure 6 (a), which shows an image classified with YOLO attributes. However, there are cases where the detection of ordinary objects in a scene by itself might be not enough to indicate certain sentiment polarity, see Figure 6 (b). In this case, to minimize the problem, we must also analyze features from the global scene. Therefore, we believe that the synergistic combination of global scene features, extracted by a ConvNet architecture (deep features), and high-level semantics obtained from general-purpose detectors or specialized networks (semantic features) is a good way to tackle this problem.


As high-level semantics, we used SUN and YOLO attributes. The first one was extracted using the ConvNet Places365 (Zhou et al., 2018) pre-trained for the Places2 dataset. This feature descriptor has dimensions and is related to scene attributes such as materials, surface properties, lighting, affordances, and spatial layout. Furthermore, we used the YOLO9000 network (Redmon and Farhadi, 2017) for object detection because it was trained for 9,418 categories that include many objects of interest for urban sentiment analysis such as guns, fire, homeless, etc. Thus, we have in the first fully connected layer features extracted by the convolutional layers that can be joined with SUN attributes or/and YOLO attributes.
During the initial tests, we observed that sentiment analysis polarization into a binary classification of positive and negative images is not suitable to represent reality; therefore, we created the OutdoorSent image dataset - where the neutral label is considered. To process these images, we extended the proposed framework with a “neutral” state, as done by Ahsan et al. (Ahsan et al., 2017) for social event images (but not focused on outdoor images).
4. Experiments and Results
In this section, we compare the performance of the four experimental setups discussed in the previous section (Figure 2). Besides evaluating the accuracy of the results, we analyze the images classified as most likely to belong to each class.
To achieve more significant results, we used 5-fold cross-validation, that is, each image dataset is first partitioned into k equally sized segments. Then, k iterations of training, validation, and test are performed, and within each iteration a different fold is held-out for test while the remaining k - 1 folds are used for learning (80% of the images for training and 20% for validation). Furthermore, to avoid the class imbalance problem during the training phase, we used a weighted optimization where the importance of each sample is proportional to the number of samples in each class. That is, we give a higher weight to a minority class and lower weight to a majority class.
We performed our experiments on an Intel i7-8700K 3.7GHz, 64GB RAM, with an NVIDIA Titan Xp GPU. For all tests, we used an Adam optimizer with an initial learning rate of 1e-4.
4.1. Experiments on DeepSent - Twitter Dataset
To compare our results with those obtained by (Campos et al., 2017), and (You et al., 2015b), we use the three subsets of the DeepSent dataset (three-agrees, four-agrees, and five-agrees). As this dataset has only two classes (positive and negative), the last layer of each neural network architecture has two neurons.
Table 3 shows the accuracies obtained for each architecture considered in the experimental setups using the DeepSent dataset. The last two rows show the results for two hand-crafted algorithms based on color histograms (GCH and LCH (You et al., 2015b)) by using the same dataset.
| Architecture | 5-agree | 4-agree | 3-agree | |
| You et al. (You et al., 2015b) | without attributes | |||
| with SUN attributes | ||||
| with YOLO attributes | ||||
| YOLO + SUN attributes | ||||
| VGG16 | without attributes | |||
| with SUN attributes | ||||
| with YOLO attributes | ||||
| YOLO + SUN attributes | ||||
| InceptionV3 | without attributes | |||
| with SUN attributes | ||||
| with YOLO attributes | ||||
| YOLO + SUN attributes | ||||
| ResNet50 | without attributes | |||
| with SUN attributes | ||||
| with YOLO attributes | ||||
| YOLO + SUN attributes | ||||
| DenseNet169 | without attributes | |||
| with SUN attributes | ||||
| with YOLO attributes | ||||
| YOLO + SUN attributes | ||||
| GCH (You et al., 2015b) | 68.4 | 66.5 | 66.0 | |
| LCH (You et al., 2015b) | 71.0 | 67.1 | 66.4 | |
The use of attributes improved the results of all ConvNets for the 5-agree subset. In subsets with no consensus (4-agree and 3-agree), the use of semantic attributes improved the accuracy for most of the cases. It is worth noting that the insertion of the SUN + YOLO attributes boost the accuracy of the simplest networks (You et al. (You et al., 2015b) and VGG16) in more than 15% on average. However, in more complex ConvNets, the same attributes did not produce a significant impact. This is an interesting result as it shows that it is possible to use semantic attributes with simple ConvNets (e.g., You et al. (You et al., 2015b)) to produce a faster framework with highly competitive performance. Finally, note that ConvNets approaches improve the performance significantly over the hand-crafted algorithms based on the GCH and LCH descriptors.
For each model that makes use of the YOLO + SUN attributes, the five images that were most likely to belong to each class were selected. Figures 7 and 8 show the selected images to the negative and positive classes, respectively.
As we can see on those figures, there is only one error for DenseNet169 (fifth row) that classified a positive image as negative, probably because of the train smoke. It is interesting to note that not all top-five images appear in more than one architecture for all the scenarios evaluated. This is not necessarily a problem, but just a suggestion that the learning process can be different for each considered architecture.
4.2. Experiments on OutdoorSent
Table 4 shows the accuracy results for all ConvNets in all images of OutdoorSent dataset. As we can see, they are lower than those observed for the DeepSent dataset (the one based on Twitter). This was expected, since this dataset has three classes instead of two and, despite having only outdoor images, has a wider range of scenarios. Again, the use of semantic attributes improved the accuracy for all ConvNets but had a much more significant impact on the simplest architectures.
| Architecture | without attributes | SUN attributes | YOLO attributes | YOLO + SUN attributes |
|---|---|---|---|---|
| You et al. (You et al., 2015b) | 56.24 6.32 | |||
| VGG16 | 60.67 1.92 | |||
| InceptionV3 | 61.38 2.76 | |||
| ResNet50 | 61.38 2.67 | |||
| DenseNet169 | 63.43 3.15 |
For each model that makes use of the YOLO + SUN attributes, the five images that had the highest probability of belonging to each class were selected. Figures 9, 10, and 11 show the selected images to the positive, neutral, and negative classes, respectively. The images are in descending order of the prediction probability given by the network. Among these images, observe that only two are repeated, indicating that each architecture is extracting complementary features for classification.
Considering the results for the positive class, the scenario presenting the best performance for all models, four neutral images were incorrectly included, two by You et al. (You et al., 2015b), and one by ResNet50 and DenseNet169 each. For the case of neutral class, five positive images were wrongly included, two by VGG16, two by ResNet50, and one by DenseNet169. Turning our attention to the images of the negative class, nine neutral images were inserted (the only ConvNet that had no error in the first five images was InceptionV3). All architectures misclassified some images, and, in general, the most problematic case was for negative instances. Note that no extreme cases were observed, i.e., a negative image being classified as positive and vice versa.
4.3. Evaluation of Context Influence
In this section, we envision to answer the following research question: do indoor images can help the classification of outdoor images? By investigating this question, we can gain an understanding of the possible influence of indoor images to classify outdoor images, i.e., images out of the primary scope of interest.
To answer the stated question, we performed two rounds of experiments for each ConvNet. In the first round, we used only outdoor images in a 5-fold cross-validation experiment, where 4-folds were used for training and validation, 80% and 20% of the total images, respectively, and 1-fold for testing. In the second round of experiments, we repeated the first experiment, including all indoor images available for a particular dataset in the training set. Then, we evaluated the impact of this decision by using only outdoor images in the testing set (the same images from the first experiment).
Table 5 present the results. As we can see, the use of indoor images to classify outdoor images contributes positively to certain networks; however, even in these cases, the gain is marginal, especially if we consider the standard deviation interval. It is worth mentioning that in these cases, we used a much larger training set for each experiment, and, thus, we increased considerably the training time (at least double) by using indoor and outdoor images.
| Testing set | |||
| outdoor images | |||
| Architecture | Training set | F-score | Accuracy |
| You et al. (You et al., 2015b) | outdoor images | ||
| indoor + outdoor images | |||
| VGG16 | outdoor images | ||
| indoor + outdoor | |||
| InceptionV3 | outdoor images | ||
| indoor + outdoor | |||
| ResNet50 | outdoor images | ||
| indoor + outdoor | |||
| DenseNet169 | only outdoor images | ||
| indoor + outdoor | |||
The next section approaches another important aspect: the robustness of the proposed architecture when considering different datasets for training and testing.
5. Cross-dataset generalization
The design of architectures that are robust, i.e., able to have acceptable performance on a dataset never seen, is a trending topic on machine learning (Torralba and Efros, 2011; Hoffman et al., 2018), a problem also known as cross-dataset generalization. That is, while a particular architecture can achieve a lot of progress on an individual dataset, it is common to perform worse on a different dataset of the same problem domain, and, thus, requiring substantial fine-tuning. Consequently, this process usually demands a significant amount of time and computational resources.
Towards this direction, we now evaluate the robustness power of the proposed architecture when the images samples used for training and testing are from different benchmarks. For these experiments, besides of DeepSent and OutdoorSent, as detailed in Section 3.2, we considered three new benchmarks proposed specifically for image sentiment analysis:
-
•
ImageSentiment (CrowdFlower, 2015): images classified using CrowdFlower, a crowdsourcing platform. The dataset does not specify the source of the images but comprehends diverse images. In total, it has 12,884 available images (8,507 positives, 2,111 neutral, and 2,266 negatives). We separated outdoor images exploring Places, and obtained 8,001 images (5,710 positives, 1,108 neutral, and 1,183 negatives);
-
•
Flickr-Kat: proposed by Katsurai and Satoh (Katsurai and Satoh, 2016). The authors classified images from Flickr using a crowdsourcing process. In total, it has 90,139 images (48,136 positives, 19,951 neutral, 12,603 negatives, and 9,449 without consensus). We separated outdoor images also exploring Places, and obtained 56,488 images (36,102 positives, 12,757 neutral, and 7,629 negatives);
-
•
Instagram-Kat: also proposed by Katsurai and Satoh (Katsurai and Satoh, 2016). The classification process is similar, but the source is now Instagram. In total, it has 65,439 images (33,076 positives, 17,313 neutral, 9,780 negatives, and 5,270 without consensus). We separated outdoor images exploring Places and obtained 14,801 images (8,589 positives, 3,661 neutral, and 2,551 negatives).
Figure 12 shows some examples of Instagram-kat, Flickr-Kat, and ImageSentiment.


We first evaluated the robustness performance of our architecture by training it with all images from OutdoorSent and testing it on all other benchmarks considered. We repeat this process for all ConvNets under study. Table 6 show the results considering the combination of YOLO + SUN semantic attributes.
| ImageSentiment | Flickr-Kat | Instagram-Kat | DeepSent | ||
| You et al. (You et al., 2015b) | F-score | 45 | 45.67 | 45.67 | 63.5 |
| Accuracy | 62.55 | 57.49 | 51.31 | 57.72 | |
| VGG16 | F-score | 44 | 43.67 | 44.67 | 59 |
| Accuracy | 57.72 | 54.96 | 48.73 | 47.76 | |
| InceptionV3 | F-score | 36.67 | 39 | 37 | 45.5 |
| Accuracy | 46.84 | 46.84 | 42.19 | 32.61 | |
| ResNet50 | F-score | 30.67 | 33.33 | 29.67 | 30.5 |
| Accuracy | 43.59 | 45 | 38.25 | 22.08 | |
| DenseNet169 | F-score | 28 | 30.67 | 25 | 23 |
| Accuracy | 35.95 | 39.08 | 32.05 | 14 | |
As can be seen, the ConvNet of You et al. (You et al., 2015b) outperformed the other architectures in all scenarios evaluated. It is worth noting that this network has only two convolutional layers. Therefore, although well-know and much deeper architectures such as Inception, ResNet and DenseNet outperformed the ConvNet of You et al. when trained, evaluated and tested in the same dataset, see Tables 3 and 4, they were not robust enough to generalize to unknown datasets as this simpler ConvNet did.
Next, we performed a new set of experiments using an all-against-all dataset evaluation. In this way, we gain an understanding of the impact of a certain dataset in the robustness. In these experiments, we only evaluate the ConvNet of You et al. (You et al., 2015b) with YOLO + SUN semantic attributes, the one that was more robust in the previous experiment. Table 7 presents the results.
| OutdoorSent | ImageSentiment | Flickr-Kat | Instagram-Kat | DeepSent | ||
| OutdoorSent | F-score | 57.67† | 45 | 45.67 | 45.67 | 63.5 |
| Accuracy | 61.59† | 62.55 | 57.49 | 51.31 | 57.72 | |
| ImageSentiment | F-score | 46.33 | 59† | 48.67 | 50 | 68 |
| Accuracy | 50.67 | 70.04† | 57.74 | 55.47 | 59.74 | |
| Flickr-Kat | F-score | 49.67 | 50.67 | 53.33† | 49 | 64 |
| Accuracy | 53.59 | 68.49 | 63.4† | 58.17 | 57.86 | |
| Instagram-Kat | F-score | 41 | 46 | 45.67 | 62.33† | 67.5 |
| Accuracy | 40.92 | 61.58 | 57.35 | 67.73† | 65.07 | |
| DeepSent | F-score | 66∗ | 65∗ | 62∗ | 61∗ | 85† |
| Accuracy | 66.71∗ | 77.93∗ | 74.91∗ | 71.39∗ | 85† | |
Not coming with a surprise, the best performances were achieved by training and testing with images from the same dataset. It is also worth noting that the proposed framework with the Flickr-Kat as training set presented the best cross-dataset generalization, with an average error increasing of for F-score and for accuracy.
The worst performance was observed for the Instagram-Kat dataset and could be explained by the particular characteristics of Instagram images, making them quite different from other images under study. For example, they tend to have filters, written messages, photo sequences, and synthetic images. Filter, for instance, it is known to have an impact on the classification (Chen et al., 2015). The other images tend to have more photos with little or no editing (some examples can be seen in Figure 12).
Another fact that might contribute to the good performance using Flickr-Kat is its dataset size, which is several times bigger than the other datasets, for instance, 28 times bigger in the number of images than OutdoorSent. As a particular case, we included in the cross-dataset generalization experiments the DeepSent dataset, which only has images from positive and negative polarities. To make this experiment possible we made the following adaptations: (i) in the experiment ”DeepSent against other datasets” we excluded neutral images from the other datasets since this class does not exist for the training phase; (ii) in the experiment ”Other datasets against DeepSent” we keep the neutral class in our framework, but each image classified as neutral was considered an error.
As expected, the performances were much higher. The reason for that is because this problem is less complex, two classes instead of three. Another reason is that images from the neutral class are hard to classify since they are often classified as positive or negative by the volunteers (they have low consensus). In this direction, it is worth noting that most misclassifications of our experiments occur associating positive and negative classes to neutral ones.
In general, the results of this cross-dataset generalization experiment are promising, given the diversity of such datasets and the simplicity of our framework (we did not use any fine-tuning for any specific dataset).
6. Outdoor Sentiment in the City
To evaluate the results of the proposed approach in a real-world scenario, we select an image subset from a publicly available dataset of media objects (images and videos) posted on Flickr We first extracted only geocoded images posted from Chicago, United States, obtaining 53,550 images. Next, we filter out images where the geolocation matches any building interior of the city. For this task, we explored building footprints of Chicago, which are publicly available in Chicago’s official open data portal555Chicago Open Data – https://data.cityofchicago.org.. After this filter, we ended up with 17,469 images in the dataset. When applying the ConvNet of You et al. (You et al., 2015b) with YOLO + SUN attributes to infer the associated sentiment (our preferable approach due to its simplicity and comparable results with other approaches), we obtained 8,492 positive, 8,584 neutral, and 393 negative images. Figure 13 presents the heatmaps for each class (positive, neutral, and negative) according to image geolocation.

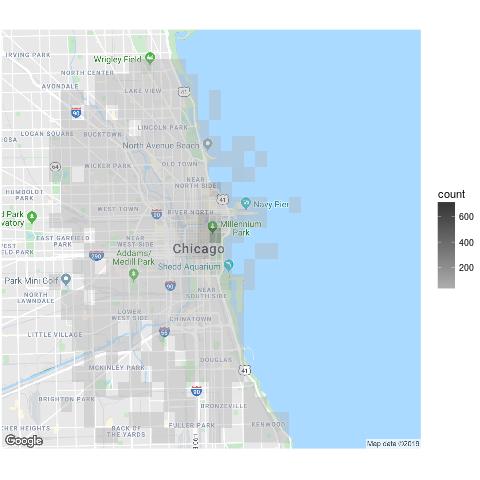

Observe that downtown has a bigger concentration of all sentiment polarities, as expected. However, the higher concentration part in this area is a bit different between all the classes, especially for the negative one. In addition, it is also interesting to note a more prominent occurrence of positive images in the water, a rare phenomenon for negative photos. These differences are an indication that image sentiment could help to understand the subjective characteristics of different areas of the city, as shown by text content (Santos et al., 2018).
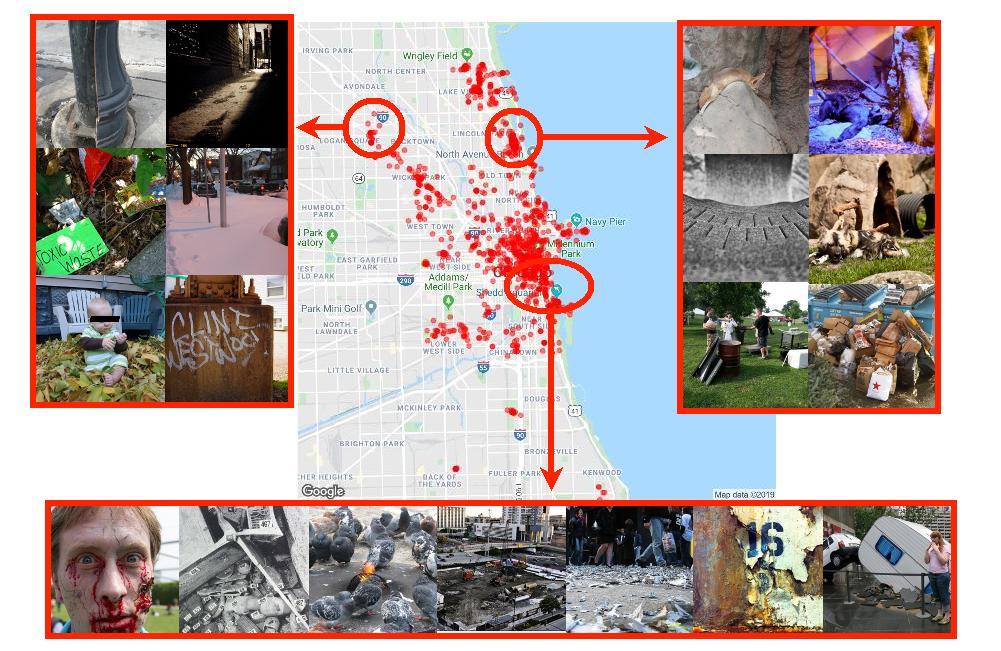
In order to favor this sort of evaluation, we performed a density-based clustering process using DBSCAN (Ester et al., 1996), an algorithm to find high-density regions separated from one another by regions of low-density. Points, images in our case, in low-density regions are classified as noise and ignored. DBSCAN requires two parameters: the minimum number of points needed to form a dense region ; and the radius . We did this clustering process for positive, neutral, and negative images. For the positive and neutral images we set the parameter equal to and considered . For negative images, the and parameters were set to , and , respectively. values were chosen following the approach proposed by Ester et al. (Ester et al., 1996). Figures 14, 15, 16 show the clustering results for positive, neutral, and negative images, respectively, thus highlighting areas according to this feature. Apart from downtown and some parts of the coast, we do not see much agreement between negative clusters and positive (and neutral) ones.
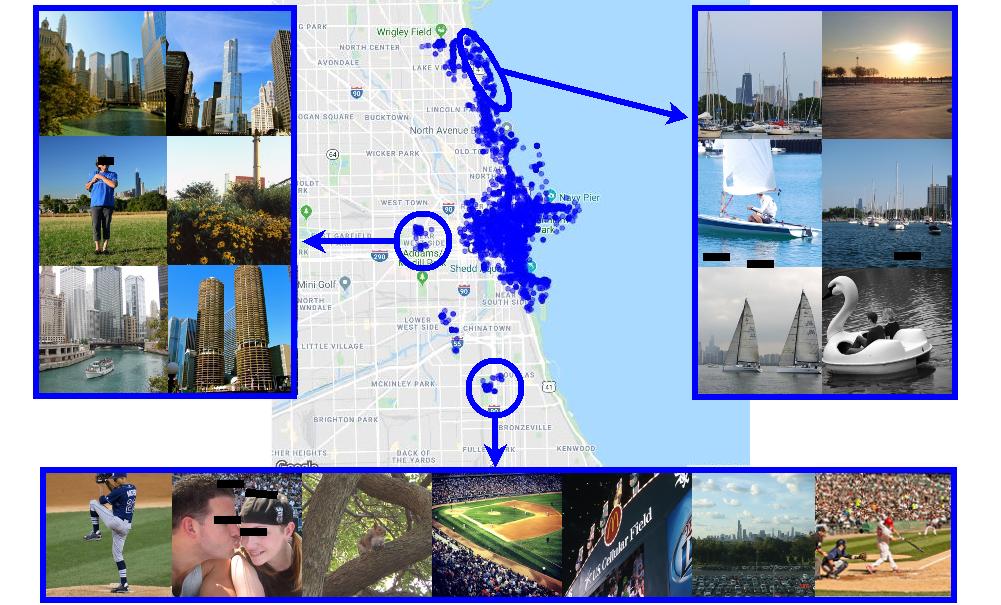
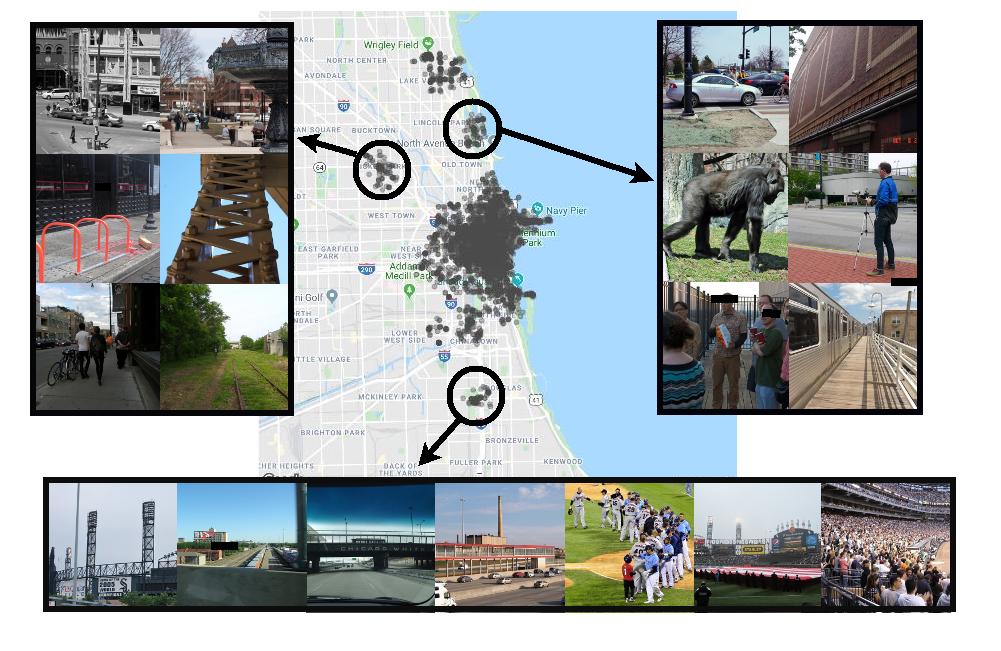
The performance of the positive and neutral classification, in general, is good. However, one could argue that a few positive images should be neutral and vice versa. For instance, most people could classify the baseball stadium at the bottom of Figure 15 as positive. Those cases are expected to happen due to the subjective nature of the problem.
Analyzing the negative images reported by our classifier (Figure 16), we can find more significant mistakes. For instance, a baby smiling, a family making a picnic in the park, and some animals resting in the zoo.
Despite these problems, we believe that the performance is acceptable for a wide range of tasks because most of the instances were correctly classified as negative. A possible way to minimize such errors would be to perform aggregated analysis, for example, consider a group of nearby images in the same area. The design of new semantic features, explicitly oriented for the sentiment analysis of outdoor urban scenes, could also help in this context.
To investigate the association of the classified images with some demographic characteristics of geographic areas, we also performed an analysis considering the median income of households per census tract. We got the publicly available data provided in the American Community Survey, administered by the United States Census Bureau666https://www.census.gov/programs-surveys/acs.. We considered the study of 2015 because it covers the most recent period of the Flickr dataset studied.
We then mapped each image in one census tract, grouping each class of image in: Low Income, where the median household income per year is less than ; Medium Income, with ; and High Income where the median household income is bigger than .
Figure 17 presents the results, as well as some representative images (indicated by arrows) for low and high income. In general, in the low income areas, we have fewer images of all sentiment classes and a slightly smaller number of positive images.
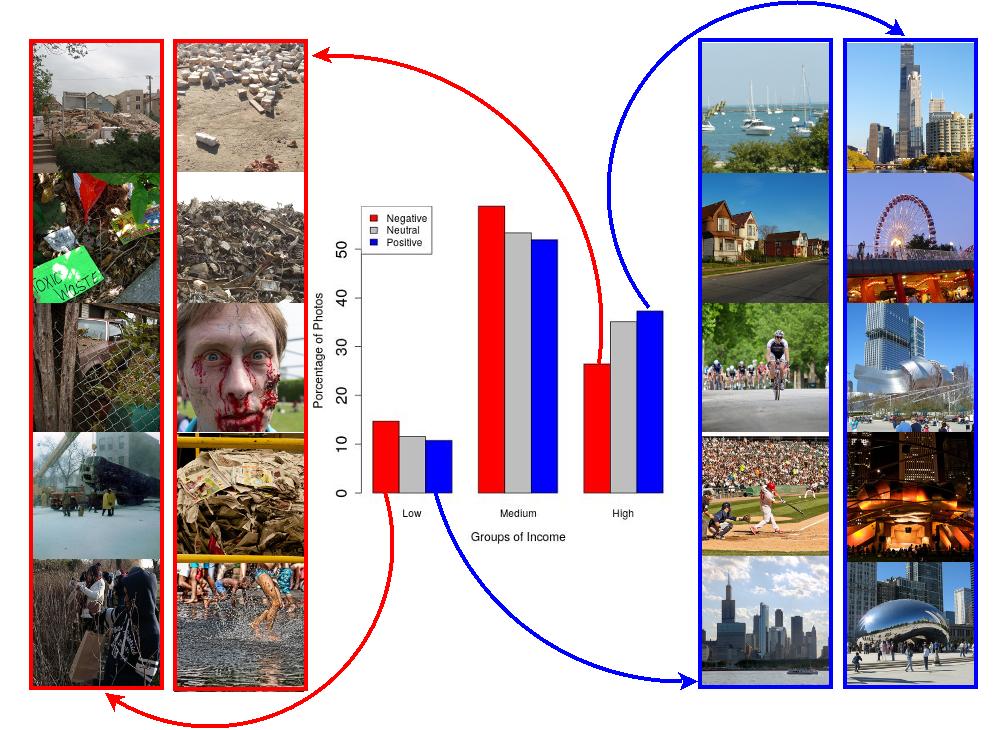
This tendency is also observed for the medium income areas. However, when looking at the high income areas, this tendency is inverse, and we have a significantly bigger number of positive images. This result is interesting because it suggests that different classes of images correlate with certain areas of the city.
Investigating the images of the low and high income groups, we find that the overall classification is coherent. As illustrated in Figure 17, most of the negative and positive images in all groups tend to reflect correctly the sentiment associated, especially in the positive ones. Again, we find that more probably mistakes are observed in the negative class, especially in the high income group. One could argue, for example, that the three bottom examples for the negative class of the high income group might be incorrectly classified. The same is valid for the bottom image of the examples for the negative class of the low income group.
We also observe some differences between groups regarding the same sentiment. For instance, positive images in the low income group tend to reflect more outdoor sports, nature, and houses. Nevertheless, for the high income group, we tend to observe more images related to sculptures, buildings, and sights. These aspects can be further explored in other works, where more information about the groups is available.
7. Discussion
Recent studies have shown that some information obtained from social media has the power to change our perceived physical limits as well as to help better understand the dynamics of cities. In this direction, there are some efforts to classify city areas under different aspects, for example, regarding the smell, cultural habits, noise, and visual aspects (Maisonneuve et al., 2009; Quercia et al., 2014; Quercia et al., 2015; Le Falher et al., 2015; Silva et al., 2017; Mueller et al., 2017).
This classification of urban areas may be useful for a variety of new applications and services. An example would be a new route suggestion tool that suggests the most visually pleasing way, which might be interesting for users in leisure time in the city, as was discussed in (Quercia et al., 2014). Our study has the potential to complement these proposals, considering another aspect in this direction: the sentiment about urban outdoor environment.
In addition, the information that can be obtained automatically from our work can help fields of study where the collection of similar information occurs in ways that do not scale easily, such as interviews and questionnaires. From the categorization of outdoor areas of the city according to the sentiment opinion understood by users, new socioeconomic studies on a large scale can be developed. By correlating these results with demographic indicators such as income and occurrence of crimes, non-obvious patterns can be understood, which may be useful in better urban planning and strategic public policies.
In this sense, it is worth mentioning the theory of “broken windows” proposed by Kelling & Coles. The idea behind this theory is that the appearance of outdoor areas can impact on neighborhood safety reality: a broken window leads to another and, in turn, to future crimes (Kelling and Coles, 1997). This and other theories can be revisited on a large scale by exploring our study.
Our study has some possible limitations. One is concerning the labeling of the OutdoorSent dataset. Although we have counted on the collaboration of a diverse group of volunteers, we do not have the opinion of all the population strata. This means that the labels can be biased to specific groups of people. Another limiting factor of our proposal is the performance of our classifier. This is associated with the type of chosen images that becomes more challenging because of the greater diversity of possible variations.
It is noteworthy that we improved the state-of-the-art. Still, we believe it may be possible to improve the classification performance with other approaches and techniques in future efforts.
As another contribution, we conducted a detailed analysis to understand the main elements shared by users on social networks for outdoor scenes and their connection with sentiment polarity.
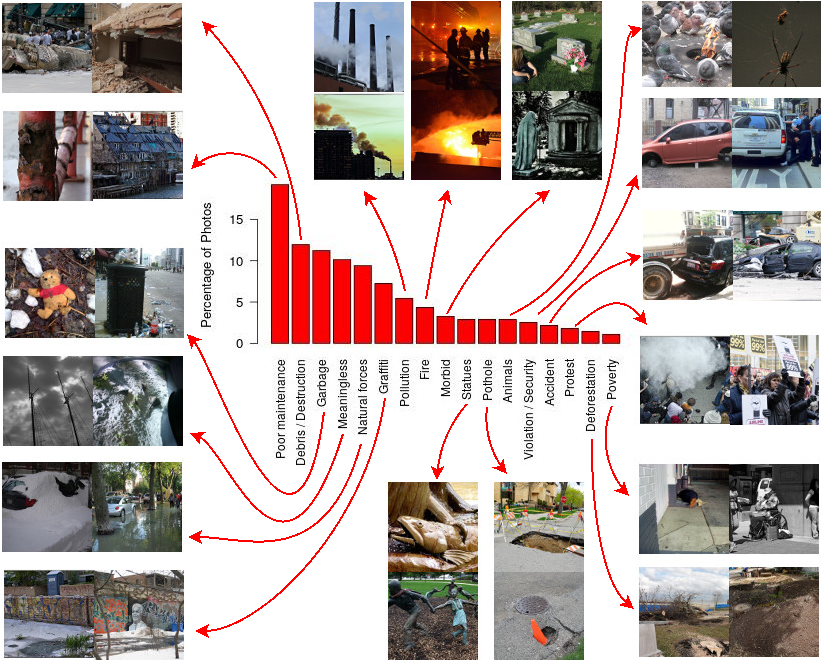
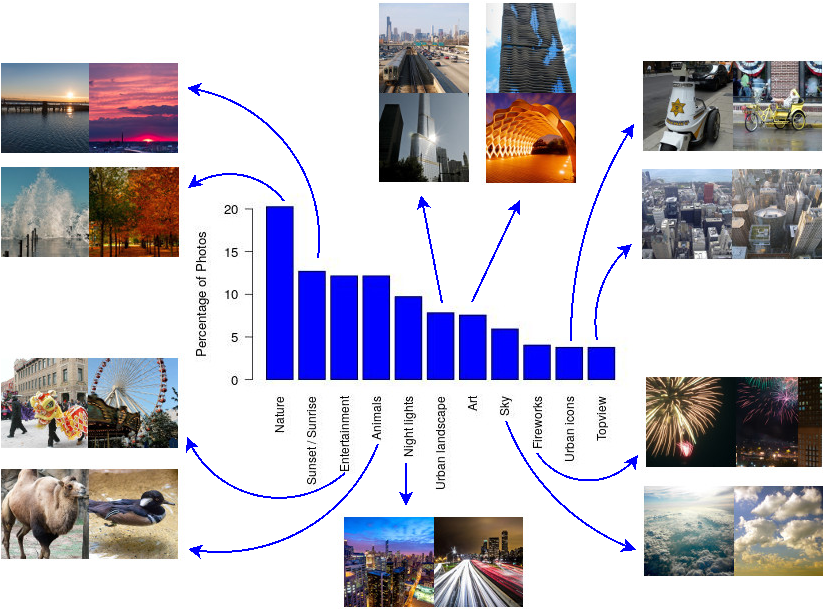
From this study, using the proposed OutdoorSent dataset, we noticed that the majority part of negative images posted by the Flickr users could be mapped in a few classes. Most of them ( 80%) are related to common problems of big cities, such as poor maintenance, debris from construction sites, garbage, disturbances due to natural forces, graffiti, pollution, fire, and potholes (see Figure 18 for some examples of each class). On the other hand, images classified as positive can be mapped in an even smaller number of classes. We observe that most of them ( 83% of total images) are related to nature views, sunset pictures, entertainment activities, animals, panoramic views of the city during the night, urban landscapes, and art monuments, see Figure 19.
Such understanding may have important implications for the design of new semantic features, explicitly oriented for the sentiment analysis of outdoor urban scenes. For instance, we noted that the problem domain addressed by YOLO9000 (You et al., 2015b) is too broad, being many categories related to indoor scenes, leading to many false detections and misclassifications, see Figure 20. On the other hand, important categories related to sentiment analysis in outdoor scenes are missing, such as pollution, debris/rubble, and poor/bad maintenance.
The same conclusions hold for the SUN (Patterson and Hays, 2012; Patterson et al., 2014) network, were some scene attributes do not seem to have a strong connection with our problem domain, such as carpet, vinyl, and gaming. Although the improvement of such features is beyond the scope of this work, we believe that the design of semantic concepts more focused on a cohesive set of urban scene elements is a promising direction for future research on this field and can be explored in further research works on image-based sentiment analysis.
8. Conclusion
This study investigates if semantic attributes (YOLO and SUN) help to enhance the performance of ConvNets for sentiment analysis in outdoor images. Our experiments considered five different ConvNets, four frequently used in the machine learning area, and one designed for sentiment analysis in images. We examined different datasets in the experiments, one of them proposed in this study (OutdoorSent). We find that semantic features improved the performance results of previous initiatives. Furthermore, we also show that the use of semantic attributes improved the performance of all ConvNets architectures but had a much more significant impact on the most straightforward architectures. Besides, we studied the impact on classification results of considering indoor images in the learning phase, not observing significative gain that justifies the higher cost demanded. We also performed a cross-dataset generalization investigation. Surprisingly, the simplest ConvNet, was the most robust in this regard in all considered scenarios. In this direction, we found an indication that in this task, image editions, such as filters, and also the dataset size, plays an important role. In general, the results of this cross-dataset generalization experiment are promising, given the diversity of such datasets and the low average error. We also showed in a real-world scenario that our results can help to understand the subjective characteristics of different areas of the city, helping to leverage new services. As future studies, there are several directions. In particular, by analyzing the OutdoorSent dataset carefully, we observed that the most negative and positive images could be mapped in a few classes. This indicates an opportunity of extending YOLO/SUN-like architectures with more specific classes for the outdoor context. This might also be the case for other contexts.
Acknowledgements
This study was financed in part by the Coordenação de Aperfeiçoamento de Pessoal de Nível Superior - Brasil (CAPES) - Finance Code 001. This work is also partially supported by the project URBCOMP (Grant #403260 /2016-7 from CNPq agency) and GoodWeb (Grant #2018/23011-1 from São Paulo Research Foundation - FAPESP). We gratefully acknowledge the support of NVIDIA Corporation with the donation of the Titan Xp GPU used for this research. The authors would like to thank also the research agency Fundação Araucária.
References
- (1)
- Ahsan et al. (2017) Unaiza Ahsan, Munmun De Choudhury, and Irfan Essa. 2017. Towards using visual attributes to infer image sentiment of social events. In International Joint Conference on Neural Networks (IJCNN). IEEE, Anchorage, Alaska, United States, 1372–1379. https://doi.org/10.1109/IJCNN.2017.7966013
- Araque et al. (2017) Oscar Araque, Ignacio Corcuera-Platas, J. Fernando Sánchez-Rada, and Carlos A. Iglesias. 2017. Enhancing deep learning sentiment analysis with ensemble techniques in social applications. Expert Systems with Applications 77 (2017), 236 – 246. https://doi.org/10.1016/j.eswa.2017.02.002
- Baly et al. (2016) Ramy Baly, Roula Hobeica, Hazem Hajj, Wassim El-Hajj, Khaled Bashir Shaban, and Ahmad Al-Sallab. 2016. A Meta-Framework for Modeling the Human Reading Process in Sentiment Analysis. ACM Transactions on Information Systems (TOIS) 35, 1, Article 7 (Aug. 2016), 21 pages. https://doi.org/10.1145/2950050
- Benevenuto et al. (2015) Fabrício Benevenuto, Matheus Araújo, and Filipe Ribeiro. 2015. Sentiment Analysis Methods for Social Media. In Proceedings of Brazilian Symposium on Multimedia and the Web (WebMedia). ACM, Manaus, Brazil, 11–11. https://doi.org/10.1145/2820426.2820642
- Borth et al. (2013) Damian Borth, Rongrong Ji, Tao Chen, Thomas Breuel, and Shih-Fu Chang. 2013. Large-scale Visual Sentiment Ontology and Detectors Using Adjective Noun Pairs. In ACM International Conference on Multimedia. ACM, Barcelona, Spain, 223–232. https://doi.org/10.1145/2502081.2502282
- Cai and Xia (2015) Guoyong Cai and Binbin Xia. 2015. Convolutional Neural Networks for Multimedia Sentiment Analysis. In Natural Language Processing and Chinese Computing. Springer International Publishing, Cham, 159–167. https://doi.org/10.1007/978-3-319-25207-0_14
- Campos et al. (2017) Víctor Campos, Brendan Jou, and Xavier Giró i Nieto. 2017. From pixels to sentiment: Fine-tuning CNNs for visual sentiment prediction. Image and Vision Computing 65 (2017), 15 – 22. https://doi.org/10.1016/j.imavis.2017.01.011
- Chen et al. (2018) Fuhai Chen, Rongrong Ji, Jinsong Su, Donglin Cao, and Yue Gao. 2018. Predicting Microblog Sentiments via Weakly Supervised Multimodal Deep Learning. IEEE Transactions on Multimedia 20, 4 (April 2018), 997–1007. https://doi.org/10.1109/TMM.2017.2757769
- Chen et al. (2014) Tao Chen, Damian Borth, Trevor Darrell, and Shih-Fu Chang. 2014. DeepSentiBank: Visual Sentiment Concept Classification with Deep Convolutional Neural Networks. CoRR abs/1410.8586 (2014), 1–7. arXiv:1410.8586 http://arxiv.org/abs/1410.8586
- Chen et al. (2015) Yu-Hsiu Chen, Ting-Hsuan Chao, Sheng-Yi Bai, Yen-Liang Lin, Wen-Chin Chen, and Winston H. Hsu. 2015. Filter-Invariant Image Classification on Social Media Photos. In ACM International Conference on Multimedia (MM ’15). ACM, Brisbane, Australia, 855–858. https://doi.org/10.1145/2733373.2806348
- Cranshaw et al. (2012) Justin Cranshaw, Raz Schwartz, Jason I. Hong, and Norman M. Sadeh. 2012. The Livehoods Project: Utilizing Social Media to Understand the Dynamics of a City. In International AAAI Conference on Weblogs and Social Media. AAAI Press, Dublin, Ireland, 1–8.
- CrowdFlower (2015) CrowdFlower. 2015. Image sentiment polarity classification (dataset). CrowdFlower. https://data.world/crowdflower/image-sentiment-polarity.
- De Choudhury et al. (2013) Munmun De Choudhury, Michael Gamon, Scott Counts, and Eric Horvitz. 2013. Predicting Depression via Social Media. In International AAAI Conference on Weblogs and Social Media. AAAI press, Boston, United States, 1–10.
- Deng et al. (2009) Jia Deng, Wei Dong, Richard Socher, Li-Jia Li, Kai Li, and Li Fei-Fei. 2009. ImageNet: A large-scale hierarchical image database. In 2009 IEEE Conference on Computer Vision and Pattern Recognition. IEEE, Miami, United States, 248–255. https://doi.org/10.1109/CVPR.2009.5206848
- Dhall et al. (2015) Abhinav Dhall, Roland Goecke, and Tom Gedeon. 2015. Automatic Group Happiness Intensity Analysis. IEEE Transactions on Affective Computing 6, 1 (Jan 2015), 13–26. https://doi.org/10.1109/TAFFC.2015.2397456
- Ester et al. (1996) Martin Ester, Hans-Peter Kriegel, Jörg Sander, and Xiaowei Xu. 1996. A Density-based Algorithm for Discovering Clusters in Large Spatial Databases with Noise. In International Conference on Knowledge Discovery and Data Mining. AAAI Press, Portland, Oregon, 226–231. http://dl.acm.org/citation.cfm?id=3001460.3001507
- Fuhai Chen et al. (2015) Fuhai Chen, Yue Gao, Donglin Cao, and Rongrong Ji. 2015. Multimodal hypergraph learning for microblog sentiment prediction. In IEEE International Conference on Multimedia and Expo (ICME). IEEE, Turin, Italy, 1–6. https://doi.org/10.1109/ICME.2015.7177477
- Golder and Macy (2011) Scott A. Golder and Michael W. Macy. 2011. Diurnal and seasonal mood vary with work, sleep, and daylength across diverse cultures. Science 333, 6051 (2011), 1878–1881. https://doi.org/10.1126/science.1202775
- Hanjalic et al. (2012) Alan Hanjalic, Christoph Kofler, and Martha Larson. 2012. Intent and Its Discontents: The User at the Wheel of the Online Video Search Engine. In ACM International Conference on Multimedia. ACM, Nara, Japan, 1239–1248. https://doi.org/10.1145/2393347.2396424
- He et al. (2016) K. He, X. Zhang, S. Ren, and J. Sun. 2016. Deep Residual Learning for Image Recognition. In IEEE Conference on Computer Vision and Pattern Recognition (CVPR). IEEE, Las Vegas, United States, 770–778. https://doi.org/10.1109/CVPR.2016.90
- Hochreiter and Schmidhuber (1997) Sepp Hochreiter and Jürgen Schmidhuber. 1997. Long Short-Term Memory. Neural Computation 9, 8 (1997), 1735–1780. https://doi.org/10.1162/neco.1997.9.8.1735
- Hoffman et al. (2018) Steven Hoffman, Renu Sharma, and Arun Ross. 2018. Convolutional Neural Networks for Iris Presentation Attack Detection: Toward Cross-Dataset and Cross-Sensor Generalization. In IEEE Conference on Computer Vision and Pattern Recognition (CVPR) Workshops. IEEE, Washington, DC, USA, 1620–1628. https://doi.org/10.1109/CVPRW.2018.00213
- Huang et al. (2017a) Gao Huang, Zhuang Liu, Laurens Van Der Maaten, and Kilian Q Weinberger. 2017a. Densely connected convolutional networks. In IEEE conference on computer vision and pattern recognition (CVPR). IEEE, Salt lake city, USA, 4700–4708. https://doi.org/10.1109/CVPR.2017.243
- Huang et al. (2017b) Minlie Huang, Qiao Qian, and Xiaoyan Zhu. 2017b. Encoding Syntactic Knowledge in Neural Networks for Sentiment Classification. ACM Transactions on Information Systems (TOIS) 35, 3, Article 26 (June 2017), 27 pages. https://doi.org/10.1145/3052770
- Ji et al. (2016) Rongrong Ji, Donglin Cao, Yiyi Zhou, and Fuhai Chen. 2016. Survey of visual sentiment prediction for social media analysis. Frontiers of Computer Science 10, 4 (01 Aug 2016), 602–611. https://doi.org/10.1007/s11704-016-5453-2
- Jia et al. (2012) Jia Jia, Sen Wu, Xiaohui Wang, Peiyun Hu, Lianhong Cai, and Jie Tang. 2012. Can We Understand Van Gogh’s Mood?: Learning to Infer Affects from Images in Social Networks. In ACM International Conference on Multimedia. ACM, Nara, Japan, 857–860. https://doi.org/10.1145/2393347.2396330
- Katsurai and Satoh (2016) M. Katsurai and S. Satoh. 2016. Image sentiment analysis using latent correlations among visual, textual, and sentiment views. In IEEE International Conference on Acoustics, Speech and Signal Processing (ICASSP). IEEE, Shanghai, China, 2837–2841. https://doi.org/10.1109/ICASSP.2016.7472195
- Kelling and Coles (1997) George L. Kelling and Catherine M. Coles. 1997. Fixing broken windows: Restoring order and reducing crime in our communities. Simon and Schuster, New York, USA.
- Kramer et al. (2014) Adam D. I. Kramer, Jamie E. Guillory, and Jeffrey T. Hancock. 2014. Experimental evidence of massive-scale emotional contagion through social networks. Proceedings of the National Academy of Sciences 111, 24 (2014), 8788–8790.
- Le Falher et al. (2015) Géraud Le Falher, Aristides Gionis, and Michael Mathioudakis. 2015. Where is the Soho of Rome? Measures and algorithms for finding similar neighborhoods in cities. In International AAAI Conference on Weblogs and Social Media. AAAI press, Oxford, UK, 1–23.
- LeCun et al. (2015) Yann LeCun, Yoshua Bengio, and Geoffrey Hinton. 2015. Deep learning. Nature 521, 7553 (May 2015), 436–444. http://dx.doi.org/10.1038/nature14539
- Li et al. (2012) Bing Li, Songhe Feng, Weihua Xiong, and Weiming Hu. 2012. Scaring or pleasing: exploit emotional impact of an image. In ACM international conference on Multimedia. ACM, Nara, Japan, 1365–1366.
- Lin et al. (2018) Dazhen Lin, Lingxiao Li, Donglin Cao, Yanping Lv, and Xiao Ke. 2018. Multi-modality weakly labeled sentiment learning based on Explicit Emotion Signal for Chinese microblog. Neurocomputing 272 (2018), 258 – 269. https://doi.org/10.1016/j.neucom.2017.06.078
- Machajdik and Hanbury (2010) Jana Machajdik and Allan Hanbury. 2010. Affective image classification using features inspired by psychology and art theory. In ACM international conference on Multimedia. ACM, Firenze, Italy, 83–92. https://doi.org/10.1145/1873951.1873965
- Maisonneuve et al. (2009) Nicolas Maisonneuve, Matthias Stevens, Maria E Niessen, and Luc Steels. 2009. NoiseTube: Measuring and mapping noise pollution with mobile phones. In Information technologies in environmental engineering. Springer, Thessaloniki, Greece, 215–228. https://doi.org/10.1007/978-3-540-88351-7_16
- Middleton and Krivcovs (2016) Stuart E. Middleton and Vadims Krivcovs. 2016. Geoparsing and Geosemantics for Social Media: Spatiotemporal Grounding of Content Propagating Rumors to Support Trust and Veracity Analysis During Breaking News. ACM Transactions on Information Systems (TOIS) 34, 3, Article 16 (April 2016), 26 pages. https://doi.org/10.1145/2842604
- Mikolov et al. (2010) Tomas Mikolov, Martin Karafiát, Lukás Burget, Jan Cernocký, and Sanjeev Khudanpur. 2010. Recurrent neural network based language model.. In INTERSPEECH, Takao Kobayashi, Keikichi Hirose, and Satoshi Nakamura (Eds.). ISCA, Chiba, Japan, 1045–1048. http://dblp.uni-trier.de/db/conf/interspeech/interspeech2010.html#MikolovKBCK10
- Mueller et al. (2017) Willi Mueller, Thiago H. Silva, Jussara M. Almeida, and Antonio A. F. Loureiro. 2017. Gender matters! Analyzing global cultural gender preferences for venues using social sensing. EPJ Data Science 6, 1 (2017), 5. https://doi.org/10.1140/epjds/s13688-017-0101-0
- Ortis et al. (2018) Alessandro Ortis, Giovanni M. Farinella, Giovanni Torrisi, and Sebastiano Battiato. 2018. Visual Sentiment Analysis Based on on Objective Text Description of Images. In International Conference on Content-Based Multimedia Indexing (CBMI). IEEE, La Rochelle, France, 1–6. https://doi.org/10.1109/CBMI.2018.8516481
- Parrett (2016) George Parrett. 2016. 3.5 million photos shared every minute in 2016. Deloitte. https://goo.gl/uwF81P.
- Patterson and Hays (2012) Genevieve Patterson and James Hays. 2012. SUN Attribute Database: Discovering, Annotating, and Recognizing Scene Attributes. In IEEE Conference on Computer Vision and Pattern Recognition (CVPR). IEEE, Rhode Island, Greece, 2751–2758. https://doi.org/10.1109/CVPR.2012.6247998
- Patterson et al. (2014) Genevieve Patterson, Chen Xu, Hang Su, and James Hays. 2014. The SUN Attribute Database: Beyond Categories for Deeper Scene Understanding. International Journal of Computer Vision (IJCV) 108, 1-2 (2014), 59–81. https://doi.org/10.1007/s11263-013-0695-z
- Poria et al. (2017) Soujanya Poria, Haiyun Peng, Amir Hussain, Newton Howard, and Erik Cambria. 2017. Ensemble application of convolutional neural networks and multiple kernel learning for multimodal sentiment analysis. Neurocomputing 261 (2017), 217 – 230. https://doi.org/10.1016/j.neucom.2016.09.117 Advances in Extreme Learning Machines (ELM 2015).
- Quercia et al. (2014) Daniele Quercia, Rossano Schifanella, and Luca Maria Aiello. 2014. The shortest path to happiness: Recommending beautiful, quiet, and happy routes in the city. In ACM conference on Hypertext and social media. ACM, Santiago, Chile, 116–125. https://doi.org/10.1145/2631775.2631799
- Quercia et al. (2015) Daniele Quercia, Rossano Schifanella, Luca Maria Aiello, and Kate McLean. 2015. Smelly maps: the digital life of urban smellscapes. In International Conference on Web and Social Media (ICWSM), Vol. 1. AAAI press, Oxford, UK, 327–336.
- Redmon and Farhadi (2017) Joseph Redmon and Ali Farhadi. 2017. YOLO9000: Better, Faster, Stronger. In IEEE Conference on Computer Vision and Pattern Recognition (CVPR). IEEE, Washington, DC, USA, 7263–7271. https://doi.org/10.1109/CVPR.2017.690
- Ribeiro et al. (2016) Filipe N. Ribeiro, Matheus Araújo, Pollyanna Gonçalves, Marcos André Gonçalves, and Fabrício Benevenuto. 2016. SentiBench - a benchmark comparison of state-of-the-practice sentiment analysis methods. EPJ Data Science 5, 1 (2016), 1–29. https://doi.org/10.1140/epjds/s13688-016-0085-1
- Santani et al. (2018) Darshan Santani, Salvador Ruiz-Correa, and Daniel Gatica-Perez. 2018. Looking South: Learning Urban Perception in Developing Cities. ACM Trans. Soc. Comput. 1, 3, Article 13 (Dec. 2018), 23 pages. https://doi.org/10.1145/3224182
- Santos et al. (2018) Frances A. Santos, Thiago H. Silva, Antonio A. F. Loureiro, and Leandro A. Villas. 2018. Uncovering the Perception of Urban Outdoor Areas Expressed in Social Media. In International Conference on Web Intelligence (WI), Vol. 1. IEEE/WIC/ACM, Santiago, Chile, 120–127. https://doi.org/10.1109/WI.2018.00-99
- Siersdorfer et al. (2010) Stefan Siersdorfer, Enrico Minack, Fan Deng, and Jonathon Hare. 2010. Analyzing and predicting sentiment of images on the social web. In ACM international conference on Multimedia. ACM, Firenze, Italy, 715–718. https://doi.org/10.1145/1873951.1874060
- Silva et al. (2017) Thiago H. Silva, Pedro O. S. Vaz de Melo, Jussara M. Almeida, Mirco Musolesi, and Antonio A. F. Loureiro. 2017. A large-scale study of cultural differences using urban data about eating and drinking preferences. Information Systems 72, Supplement C (2017), 95 – 116. https://doi.org/10.1016/j.is.2017.10.002
- Simonyan and Zisserman (2014) Karen Simonyan and Andrew Zisserman. 2014. Very Deep Convolutional Networks for Large-Scale Image Recognition. CoRR abs/1409.1556 (2014), 1–14. arXiv:1409.1556 http://arxiv.org/abs/1409.1556
- Song et al. (2018) Kaikai Song, Ting Yao, Qiang Ling, and Tao Mei. 2018. Boosting image sentiment analysis with visual attention. Neurocomputing 312 (2018), 218 – 228. https://doi.org/10.1016/j.neucom.2018.05.104
- Szegedy et al. (2016) Christian Szegedy, Vincent Vanhoucke, Sergey Ioffe, Jon Shlens, and Zbigniew Wojna. 2016. Rethinking the Inception Architecture for Computer Vision. In 2016 IEEE Conference on Computer Vision and Pattern Recognition (CVPR). IEEE, Las Vegas, United States, 2818–2826. https://doi.org/10.1109/CVPR.2016.308
- Torralba and Efros (2011) Antonio Torralba and Alexei A. Efros. 2011. Unbiased Look at Dataset Bias. In IEEE Conference on Computer Vision and Pattern Recognition (CVPR). IEEE Computer Society, Washington, DC, USA, 1521–1528. https://doi.org/10.1109/CVPR.2011.5995347
- Vadicamo et al. (2017) Lucia Vadicamo, Fabio Carrara, Andrea Cimino, Stefano Cresci, Felice Dell’Orletta, Fabrizio Falchi, and Maurizio Tesconi. 2017. Cross-Media Learning for Image Sentiment Analysis in the Wild. In IEEE International Conference on Computer Vision Workshops (ICCVW), Vol. 1. IEEE, Venice, Italy, 308–317. https://doi.org/10.1109/ICCVW.2017.45
- Wu et al. (2016) Jianlong Wu, Zhouchen Lin, and Hongbin Zha. 2016. Multi-view common space learning for emotion recognition in the wild. In ACM International Conference on Multimodal Interaction. ACM, ACM, Tokyo, Japan, 464–471. https://doi.org/10.1145/2993148.2997631
- You et al. (2015a) Quanzeng You, Jiebo Luo, Hailin Jin, and Jianchao Yang. 2015a. Joint Visual-Textual Sentiment Analysis with Deep Neural Networks. In ACM International Conference on Multimedia (MM ’15). ACM, New York, NY, USA, 1071–1074. https://doi.org/10.1145/2733373.2806284
- You et al. (2015b) Quanzeng You, Jiebo Luo, Hailin Jin, and Jianchao Yang. 2015b. Robust Image Sentiment Analysis Using Progressively Trained and Domain Transferred Deep Networks. In AAAI Conference on Artificial Intelligence (AAAI’15). AAAI Press, Austin, Texas, 381–388. http://dl.acm.org/citation.cfm?id=2887007.2887061
- Yuan et al. (2013) Jianbo Yuan, Sean Mcdonough, Quanzeng You, and Jiebo Luo. 2013. Sentribute: Image Sentiment Analysis from a Mid-level Perspective. In International Workshop on Issues of Sentiment Discovery and Opinion Mining. ACM, Chicago, Illinois, Article 10, 8 pages. https://doi.org/10.1145/2502069.2502079
- Zhan et al. (2019) Xueying Zhan, Yaowei Wang, Yanghui Rao, and Qing Li. 2019. Learning from Multi-annotator Data: A Noise-aware Classification Framework. ACM Transactions on Information Systems (TOIS) 37, 2, Article 26 (Feb. 2019), 28 pages. https://doi.org/10.1145/3309543
- Zhao et al. (2016) Liang Zhao, Feng Chen, Chang-Tien Lu, and Naren Ramakrishnan. 2016. Online Spatial Event Forecasting in Microblogs. ACM Transactions on Spatial Algorithms and Systems (TSAS) 2, 4, Article 15 (Nov. 2016), 39 pages. https://doi.org/10.1145/2997642
- Zhou et al. (2018) Bolei Zhou, Agata Lapedriza, Aditya Khosla, Aude Oliva, and Antonio Torralba. 2018. Places: A 10 Million Image Database for Scene Recognition. IEEE Transactions on Pattern Analysis and Machine Intelligence 40, 6 (June 2018), 1452–1464. https://doi.org/10.1109/TPAMI.2017.2723009
- Zhou and Huang (2017) Guang-You Zhou and Jimmy Xiangji Huang. 2017. Modeling and Mining Domain Shared Knowledge for Sentiment Analysis. ACM Transactions on Information Systems (TOIS) 36, 2, Article 18 (Aug. 2017), 36 pages. https://doi.org/10.1145/3091995