Radio emission features in different modes of PSR J0826+2637 (B0823+26)
Abstract
We report on a detailed analysis of the radio emission during the different modes of the pulsar J0826+2637 (B0823+26), observed using the Giant Meterwave Radio Telescope at 306-339 MHz observing frequencies. The pulsar profile has a postcursor and interpulse emission in addition to the main pulse. The single pulses showed the presence of nulling, periodic fluctuation in the emission as well as two prominent modes. In addition the pulsar also showed the presence of a null state where no emission was seen for roughly an hour which was immediately followed by a short duration (5 minutes) bright state termed the Q-bright state. The nulling varied significantly in the two modes, from a few percent nulls in B-mode to more than 90 percent nulling during the Q-mode. Additionally, the pulsar showed the presence of low level emission in both the interpulse and postcursor components when the main pulse nulled in B-mode. We detected periodic fluctuations in both the main pulse and postcursor during B-mode which were most likely a form of periodic amplitude modulation unrelated to subpulse drifting. We have also detected the appearance of periodicity during the transitions from the null to the burst states in the Q-mode, which was longer than the B-mode modulations. Our analysis further revealed a significant increase in the main pulse and post-cursor intensity during the transition from the Q-mode to the short duration Q-bright mode. On the other hand no commensurate variation was visible in the interpulse intensity.
keywords:
pulsars: general - pulsars: individual: PSR J0826+2637 (B0823+26)1 Introduction
In rotation powered pulsars the coherent radio emission is typically a tiny fraction (1%) of the rotational energy, and is thought to arise due to growth of instabilities in relativistically flowing pair-plasma. When several thousand individual pulses are averaged a stable pulse profile is formed. The shape of the profile appears to remain identical across assorted observations at various observing times. However, a small subsample ( 30 pulsars) shows transitions between more than one stable state with distinct emission properties and profile shapes. This phenomenon is known as emission mode changing, also sometimes called state change (Backer, 1970a; Bartel et al. , 1982; Wang et al. , 2007). There is also the phenomenon of nulling where the pulsar switches to a state where the radio emission disappears completely, or at least goes below detection limits (Backer, 1970b; Bigg, 1992; Wang et al. , 2007; Gajjar et al. , 2012; Basu et al. , 2017). The durations of the modes last between several minutes to hours at a time, and the transition between them is very rapid, usually within one rotation period. One of the prominent examples of mode changing is seen in the pulsar J0826+2637 (B0823+26), where at least two distinct modes are present characterised by their ‘Quiet’ and ‘Bright’ emission states lasting for hours at a time (Sobey et al. , 2015). In a recent study by Hermsen et al. (2018) the radio mode changing in this pulsar is also seen to be accompanied by synchronous variation in the X-ray emission. The X-ray emission is incoherent in nature and carries a larger fraction of the rotational energy of the pulsar compared to the coherent radio emission. Hence, the synchronous X-ray and radio mode changes suggest that the physical mechanism responsible for this phenomenon affects both the coherent and incoherent emission processes. There are also a few pulsars which exhibit intermittent behaviour where they spend large amounts of time (months to years) in the radio active and null states, respectively (Kramer et al. , 2006; Lyne et al. , 2010). The state changes in these systems were accompanied by changes in their rotational energies. A detailed timing analysis was carried out for PSR J0826+2637 by Young et al. (2012), but the authors failed to uncover any detectable changes in the spin-down rate. There are also examples of quasi-periodic variations in intensity in the form of periodic amplitude modulation and periodic nulling. In a series of studies Basu et al. (2016, 2017); Mitra & Rankin (2017); Basu & Mitra (2018b); Basu et al. (2019a, b) have identified and delineated the properties of these phenomena whose physical properties were clearly different from subpulse drifting.111The phenomenon of subpulse drifting is associated with plasma columns performing drift at the surface of the polar cap and is identified as a local phenomenon (see e.g. Ruderman & Sutherland, 1975), unrelated to mode changing.
In order to explain mode changes, one needs to appeal to a mechanism
which causes the radio emission to change rapidly, and subsequently exhibit
stable radio emission with different modal characteristics. The mode changes
are most likely associated with sudden changes in the properties of the radio
emitting relativistic plasma as suggested by Bartel et al. (1982); Basu & Mitra (2018b); Brinkman et al. (2019).
However, no physical mechanism has been identified that can explain :
(a) what triggers the fast change in the plasma flow;
(b) what decides the stability of the plasma flow when the pulsar resides in a
certain mode;
(c) and what causes it to switch back and forth between the different modes.
In the literature there are a few suggestions regarding processes that can
change the plasma flow resulting in mode changing. The changes in conditions of
the partially screened gap (PSG, Gil et al. , 2003; Szary et al. , 2015) in the inner
acceleration region, or variations in the non-dipolar magnetic fields above the
polar cap due to Hall-drift (Geppert & Viganò, 2014, Geppert et al. in preparation)
are examples of local changes occurring above the polar cap. Alternatively,
changes in viewing geometry that arise due changes of size of the global
magnetosphere (Timokhin, 2010), or transition from a non-corotating to co-rotating
magnetosphere (Yuen & Melrose, 2017) are other examples of such variations in the larger
magnetosphere. Thus intensive studies of the emission properties in known
objects like PSR J0826+2637 as well as uncovering other diverse examples of
these phenomena will be important to test the viability of the different models
explaining the physical processes in the pulsar magnetosphere.
The average profile of PSR J0826+2637 shows the presence of a post-cursor component and an inter-pulse along with the main pulse (Backer et al. , 1973). The inter-pulse is roughly separated by 180° in longitude from the main pulse indicating a nearly orthogonal emission geometry (Hankins & Fowler, 1986). The main pulse shows the presence of lower linear polarization as well as sign changing circular polarization which are indicative of a core component. The polarization position angle (PPA) shows complicated behaviour due to the presence of orthogonal polarization modes. Rankin & Rathnasree (1995) have carried out detailed polarization mode separated studies to estimate around 120° swing of the PPA across the main pulse. This is consistent with a central line of sight traverse of the emission beam as suggested by the rotating vector model (Radhakrishnan & Cooke, 1969). This clearly suggests that the main pulse corresponds to a core single (St) profile. The post-cursor has significant evolution and apparently its separation from the main pulse changes as a function of frequency. However, careful studies by Basu et al. (2015) revealed the outer edge of the post-cursor component to be frequency invariant, thereby indicating a constant separation from the main pulse. The pulsar also shows large diversity in its single pulse behaviour. In addition to the mode changing mentioned earlier the pulsar exhibits the presence of nulling at both long and short intervals (Young et al. , 2012). The single pulses fluctuate periodically which are likely to be manifestation of the periodic amplitude modulation (Weltevrede et al. , 2006, 2007b; Sobey et al. , 2015). Mitra et al. (2015) have carried out careful analysis of the stronger single pulses from this source and identified the presence of micro-structures in the main pulse. The micro-structures were interpreted as signatures of temporal modulations in the plasma flow responsible for the radio emission.
In the recent study reported by Hermsen et al. (2018) a comprehensive observing campaign was undertaken to monitor the pulsar J0826+2637 at X-ray frequencies using XMM-Newton, which was shadowed at radio frequencies primarily by the Giant Meterwave Radio Telescope (GMRT) and supported with LOw Frequency ARray (LOFAR) international stations. The primary goal of the radio observations in this work was to identify the intervals of the different modes and determine the commensurate X-ray variations. In the process the GMRT performed highly sensitive observations of a large number of single pulses in different emission states. In this paper we have concentrated on understanding the detailed nature of radio emission observed using GMRT during the different emission modes. We have analysed the single pulses to characterise the different phenomena like nulling, periodic fluctuations, etc., in the different modes. In section 2 we have summarized the observing details and the principal modal behaviour discussed in the previous work. Section 3 reports the nulling properties during each observing session while section 4 details the periodic modulations in the single pulse behaviour. In section 5 we investigate the bursts seen in the post-cursor component particularly at the start of the B-mode as well as the inter-pulse. We have carried out a detailed discussion (section 6) of the physical implications of the single pulse behaviour seen in the different emission modes. Finally, we summarize the results of our studies in section 7.
2 Observation and Emission states
| Date | Duration | Pulses | Mode |
|---|---|---|---|
| (hrs) | |||
| 20 April, 2017 | 8.1 | 41470 | B |
| 22 April, 2017 | 5.1 | 32046 | B |
| 24 April, 2017 | 8.3 | 32181 | Q, Q-Bright |
| 26 April, 2017 | 4.0 | 26001 | B |
| 28 April, 2017 | 6.7 | 30637 | B |
| 30 April, 2017 | 3.9 | 24656 | B |
 |
|


| MODE | Main Pulse | Postcursor | Inter Pulse | PC-MP | IP-MP | |||||
|---|---|---|---|---|---|---|---|---|---|---|
| W50 | W10 | W50 | PC/MP | W50 | W10 | IP/MP | W | W | W | |
| (°) | (°) | (°) | (%) | (°) | (°) | (%) | (°) | (°) | (°) | |
| B | 4.150.33 | 9.940.33 | 7.450.33 | 2.360.01 | 13.820.33 | 31.850.33 | 0.410.01 | 30.700.33 | 40.720.33 | 178.830.33 |
| Q-Bright | 4.520.33 | 10.370.33 | 10.750.33 | 2.770.11 | — | — | 0.640.11 | 31.030.33 | 40.570.33 | 178.170.33 |
| Q | 6.770.33 | 14.750.67 | — | — | — | — | — | — | — | — |
We observed total intensity single pulses from the pulsar using GMRT on six separate occasions in April, 2017, as listed in Table 1. The GMRT consists of 30 antennas distributed in a Y-shaped array, with 14 antennas located within a central square kilometer area and the remaining 16 spread along three arms (Swarup et al. , 1991). The observations were carried out in the 306-339 MHz frequency band, with a time resolution of approximately 0.5 milliseconds. For these observations we used around 20 antennas, the available central square antennas and the first 2 arm antennas, whose recorded signals were co-added in the ‘Phased-Array’ mode to improve detection sensitivity of the single pulses. The antenna phases were aligned by observing a strong nearby point like source, and the process was repeated every one and half hours (or roughly ten thousand pulses for the period of 0.53 seconds). The phasing durations lasted between 5 to 15 minutes at a time, during which the pulsar emission could not observed. One of the drawbacks of these studies was the lack of any absolute flux calibration. This required interferometric observations with suitable phase and flux calibrators observed at regular intervals to scale the observed counts accordingly. Though the GMRT is capable of simultaneous observations in both ‘Interferometric’ and ‘Phased-Array’ modes, this would have required additional down time for calibration setups. The option of flux calibration was forfeited in order to maximize the duration of synchronous observations with XMM-Newton. Additionally, the telescope performance was also reset after every phasing interval, implying the the single pulse intensities could not be directly compared for different intervals. However, the average profile of this pulsar is remarkably constant over time and at our observing frequencies scintillation effects were negligible (Daszuta et al. , 2013; Sobey et al. , 2015). As a result we could compare the single pulse properties across phasing intervals after normalizing using the profile peak for that duration. This was particularly applicable for the B-mode which was prevalent during these observations. We were allotted approximately 8-9 hours of observing time on each day with the exception of 26 April when only 5 hours of observations were scheduled. The initial telescope setup took between 30 minutes to 1 hour. On two sessions, 22 and 30 April, the observations had to be truncated by 2-3 hours due to recording malfunction and high winds. The presence of radio frequency interference (RFI) during certain intervals affected our ability to observe the pulsar. In Table 1 we have listed the effective single pulses observed during each observing session, excluding RFI affected pulses and phasing intervals, which amounts to roughly 187,000 pulses over the entire observations.
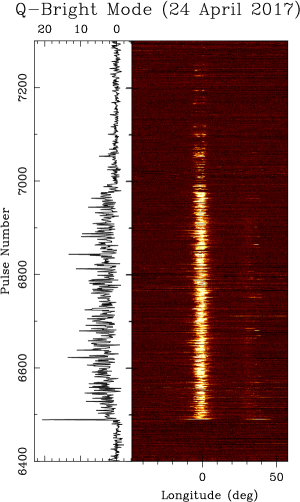
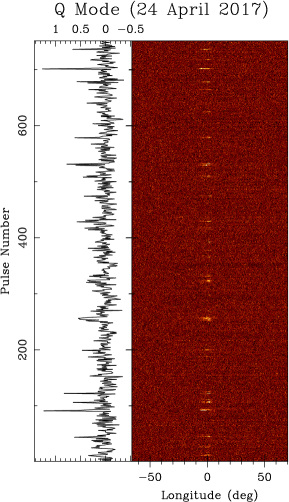
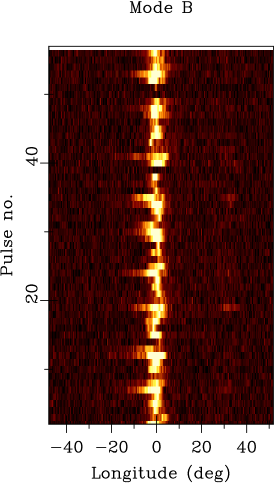
As detailed in Hermsen et al. (2018), the pulsar was primarily seen in the B-mode during most of the observing run. The only exception was 24 April when the pulsar was in the Q-mode. A short duration bright emission state was seen on this day starting from pulse number 6490 and lasting for roughly 500 periods as shown in figure 1 (left panel). The emission gradually transitioned to the typical Q-mode emission, which was characterised by short duration low level emission interspersed between nulls (see figure 1, right panel). Before the start of the bright phase the pulsar was in the null state starting around pulse number 982 and lasting for around 5500 pulses (see figure 1, left panel, the initial pulses). Hermsen et al. (2018) classified this short duration burst as a Q-bright state to distinguish from the B-mode which lasts for hours at a time. The modal behaviour of the pulsar during these observations were more protracted compared to previous studies (Sobey et al. , 2015). During the entire observing run we were not able to observe any clear transition from Q-mode to B-mode or vice versa. The average profiles in the Q-mode and the nulling preceding the bright state in Q-mode is shown in figure 2. The postcursor and interpulse emission were not seen in the average profile of Q-mode, which was likely due to the emission being much weaker as well as being dominated by null pulses. The profile corresponding to the long duration null state did not reveal the presence of any low level emission. In figure 3 the profiles of the bursting state in Q-mode and the more conventional B-mode are shown, where we have highlighted the postcursor and interpulse component. In Table 2 we have estimated the widths of the different components and their separations during the different emission states, including the widths for the main pulse at 50% (W50) and 10% (W10) level of peak intensity in all three modes. The postcursor width was only estimated at 50% level since the bridge emission was above the 10% level of the postcursor peak. On the other hand the interpulse was only prominent in the B-mode for estimating the widths. The main pulse showed a single component feature during both the Q-Bright and B-mode, with the former having a sightly larger width. However, the main pulse showed considerable evolution during the Q-mode with the width becoming almost 50% wider and resembling a barely resolved double shape. The postcursor component also became wider during the Q-Bright state compared to the B-mode. The Table also shows the ratio of the peak values of the main pulse compared to the postcursor (PC/MP) as well as the interpulse (IP/MP) expressed as a percentage of the main pulse peak. The ratios were calculated for the B-mode and the Q-bright mode profiles. The error bars were estimated from the 1- variations of the baseline for the different profiles and is larger for the Q-bright due to the relatively small number of pulses used in the profile ( 500). Both the postcursor and interpulse are brighter in the Q-bright mode compared to the B-mode. The single pulse emission showed large fluctuations (see section 4) and the variations seen in the profile shape and intensities of different components between the Q-bright mode and the B-mode could also result from the small number of pulses available to form the former profile. We have also estimated the separation between the postcursor component and the main pulse peak at two realizations, between the two peaks and from the main pulse peak to the trailing edge of the postcursor component (see discussion in Basu et al. , 2015), which were similar in the two modes and consistent with previous estimates. The separations between the main pulse and interpulse peaks were around 178° for both the B-mode and Q-Bright mode which were also similar to earlier measurements (Hankins & Fowler, 1986; Sobey et al. , 2015), and suggests the rotation and magnetic axes to be nearly perpendicular to each other.
3 Nulling
 |
 |
 |
 |
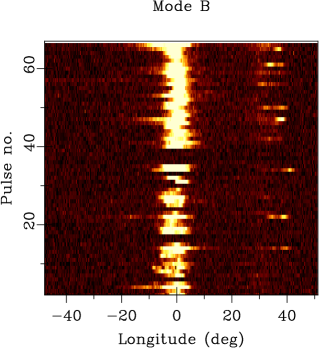
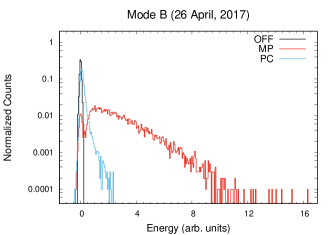
The nulling varies a lot between the different emission modes. The nulling was more prominent during 24 April, 2017 when the pulsar was primarily in the Q-mode. A long duration nulling state was also observed on this day, lasting roughly 5500 periods ( 48.6 minutes), before the onset of the Q-Bright mode. The pulsar showed nulls lasting tens of periods in between bursts of emission in the Q-mode. The B-mode on the other hand showed short duration nulls typically lasting one or two periods. The long duration nulls preceding the Q-Bright mode has also been reported in Sobey et al. (2015) with durations of roughly an hour, and appears to be a separate emission state. The folded profile (see figure 2) did not show the presence of any low level emission during the long duration null state. Figure 1 (right panel) shows the presence of nulling during the Q-mode, while figure 4 shows examples of short nulls during B-mode. We have carried out a detailed analysis of nulling using the techniques described in Basu et al. (2017); Basu & Mitra (2018b); Basu et al. (2019b). This included estimating the energy distributions for the on and off-pulse windows to determine the nulling fractions as well as the distribution for consecutive null and burst pulses (Ritchings, 1976). An example of the energy distributions during B-mode is shown in figure 5, where the main pulse and postcursor distributions are shown along with the off-pulse window. The nulling analysis was carried out for the main pulse since both the postcursor and the interpulse were not detected consistently at the single pulse level.
| Date | Mode | NF | ||
|---|---|---|---|---|
| () | () | (%) | ||
| 20 April | B | 28.5 | 1.12 | 3.8 |
| 22 April | B | 31.8 | 1.11 | 3.4 |
| 24 April | Q-Bright | 35.2 | 1.00 | 2.8 |
| Q | 1.69 | 19.0 | 91.9 | |
| 26 April | B | 26.7 | 1.12 | 4.0 |
| 28 April | B | 24.8 | 1.14 | 4.4 |
| 30 April | B | 29.2 | 1.14 | 3.7 |
Table 3 lists the nulling behaviour during the different observing sessions, the average duration of the burst () and null () states and the nulling fractions (NF) during each mode. The pulsar was in B-mode on five out of the six observing sessions and the nulling usually lasted for short durations typically one or two periods. The burst states were usually of longer duration lasting several tens of periods which extended to a few hundred pulses on rare instances. In figure 6 we show one example of the null length and burst length histograms during the B-mode, for the observations on 26 April, 2017. The nulling behaviour was largely consistent for the different observing sessions in the B-mode. However, small variations were seen with the average burst lengths being shorter on 26 and 28 April, 26.7 and 24.8 respectively, and relatively longer, about 31.8 , on 22 April. Similarly, the nulling fractions were also higher on 26 and 28 April, 4.0% and 4.4% respectively, compared to 22 April with nulling fraction of 3.4%. The short duration Q-Bright mode had similar nulling behaviour to the B-mode, with the nulling being less frequent. Only single period nulls were seen in this mode while the average burst length was 35.2 , which was higher compared to the B-mode. The nulling fraction was 2.8% which was also comparatively lower. In figure 7 the nulling behaviour during Q-mode is shown, where the null and burst length histograms show contrasting behaviour to the B-mode. The bursts were usually of short durations lasting one or more periods, while the nulls lasted for tens of periods at a time. The average null length was 19.0 and the burst length was 1.69 during the Q-mode. The nulling fraction was also more than 90% during this mode. Sobey et al. (2015) also estimated the nulling behaviour for the different emission modes. They reported nulling fraction of 1.80.5% which is smaller than our observations. However, our results show that the nulling behaviour does not remain constant during B-mode but shows variations across different observing sessions. They also reported nulling fraction of 809% during the Q-mode which is consistent with our estimates within measurement errors.
 |
 |
We have also estimated the folded profiles using just the null and burst pulses in each of the modes to detect the presence of any low level emission during nulling. The average profiles in each case are shown in figure 8. In the Q-mode there was no emission seen during nulling for any of the three components. The postcursor component was clearly seen in the burst profile of the Q-mode which was not detected in the average profile (see figure 2). The relative intensity of the postcursor component compared to the main pulse was more than 2-3 times higher in the Q-mode than in B-mode. The null profile in the B-mode on the other hand showed the presence of low level emission in the postcursor as well as the interpulse. However, no emission was seen in the main pulse during nulling as expected. The postcursor component in the null profile was much weaker and only around 5% level of the burst profile. The interpulse on the other hand was comparable in the two profiles with the null profile showing more than 50% of the burst profile intensity.
 |
|
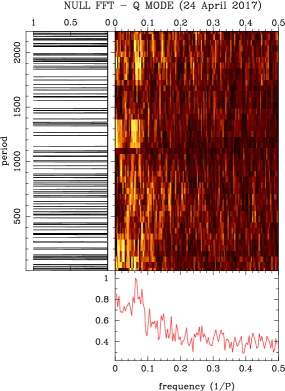
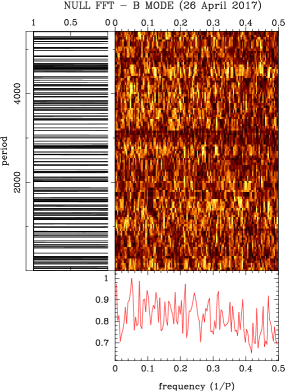
We have also analysed the nulling behaviour during both the modes to investigate the appearance of periodicity during the transitions from null to burst states. The null and burst pulses were identified with ‘0’ and ‘1’ respectively, and Fourier transforms were carried out on these sequences as detailed in Basu et al. (2017). In figure 9 we show the results of this analysis on Q-mode (left panel) and B-mode (right panel). We report for the first time the appearance of periodic/quasi-periodic nulling in the Q-mode of the pulsar. No periodicity could be associated with transitions from the null to burst states in B-mode. In table 4 we have estimated the properties of the periodic nulling feature seen in Q-mode. The nulling periodicity was estimated to be 14.23.3 , which is higher than the periodic amplitude modulation in B-mode. The periodic nulling/amplitude modulation in many cases (Basu et al. , 2017; Mitra & Rankin, 2017) is not seen consistently over the entire duration of observation but becomes more prominent at certain sequences. This is also seen for the Q-mode observations where in certain intervals the periodic behaviour almost vanishes.
4 Periodic Modulation of Single Pulses
 |
|
 |
|
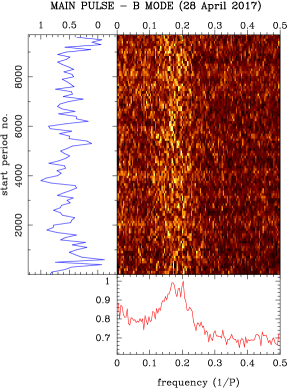
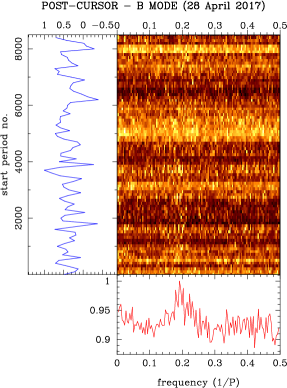
We have carried out a detailed analysis to study the periodic variations during the different emission modes. We have used the fluctuation spectral analysis to estimate the periodicity in the single pulse behaviour as described in Basu et al. (2016). The longitude resolved fluctuation spectra (LRFS, Backer, 1973) were estimated for sequences of 256 consecutive pulses at a time. Subsequently, the starting period was shifted by 100 pulses and the process was repeated to generate a time evolution of the LRFS. In figure 10 we show the average LRFS as a function of pulse period during the B-mode. We have separately estimated the spectra for the main pulse (left panel) as well as the postcursor component (right panel). The average spectra show the presence of a wide periodic structure seen in both the main pulse and the postcursor component. Table 4 details the nature of the periodic structure, including the median peak frequency ( = 0.18 cycles/), Full width half maximum (FWHM = 0.08 cycles/) of the peak, the factor defined as the ratio between peak value and width, and the estimated periodicity ( = 5.51.0 ). The error in the peak frequency () was estimated as =FWHM/2 (Basu et al. , 2016). The estimated periodicity during this mode was consistent with earlier measurements (Sobey et al. , 2015). No clear periodicity was seen in the average fluctuation spectra during the Q-mode. The periodic phenomenon seen in the B-mode was a form of periodic amplitude modulation since no systematic drift band was seen in the single pulse sequence (see figure 11, right panel). The main pulse has been identified as a core component with the profile type being core single (Rankin, 1990). The subpulse drifting is only seen in conal components of pulsar profile with the effect absent in core (Rankin, 1986; Basu et al. , 2019a). This further indicates the phenomenon to be periodic amplitude modulation. We have also estimated phase variations across the pulse window corresponding to the peak frequency using the technique described in Basu & Mitra (2018a). The phase behaviour is shown in figure 11 (left panel, middle window) and represents a bell shaped curve across the main pulse. This behaviour was different from the periodic amplitude modulation cases studied in the past which usually show a constant phase value across the pulse window (Basu et al. , 2016, 2019b). The single pulse sequence shown in the right panel of the figure sheds light into this unique phase behaviour. As the pulse intensity increases the pulse also becomes wider at both the leading and trailing edge of the main pulse, with the stronger pulses being much wider. This results in the phases showing an increasing slope in the leading edge and a decreasing slope towards the trailing side. The increased intensities in the single pulses do not necessarily mean that the peak amplitude is systematically changing. The increase in intensity can also arise from the emission originating from a wider region of the pulse window. This is contrary to subpulse drifting where the subpulse width does not change drastically between pulses but the subpulses usually shift from one edge of the window to the other resulting in systematic phase variations across the the entire component. The diffuse nature of the periodic behaviour indicates deviation from the usual behaviour, as seen in figure 4, with possibilities of narrow, bright pulses. There have been previously reported cases of phase reversals in the form of bi-drifting where the phases show opposite slopes (Basu & Mitra, 2018a). However, the different phase behaviours are associated with different components and not within the same component as seen in this pulsar. Weltevrede et al. (2006, 2007b) have carried out the 2-Dimensional Fluctuation spectrum (Edwards & Stappers, 2002) for this pulsar, at 325 MHz and 1.4 GHz observing frequencies. They classified the pulsar as a diffuse drifter with a definite drift direction and large separation between adjacent drift bands, 70° and 55° respectively. The detailed phase behaviour reported in our study argues against the drifting interpretation reported in these earlier works.
| Type | MODE | FWHM | S | PM | |
|---|---|---|---|---|---|
| () | () | () | () | ||
| Amp. Mod. | B | 0.1820.035 | 0.082 | 1.88 | 5.511.05 |
| Periodic Null | Q | 0.0700.016 | 0.038 | 15.96 | 14.23.3 |
5 High Intensity Emission in Single Pulses
 |
 |
One of the features of the mode changing event from the null state to the Q-Bright state was the significant increase in the intensities of the main pulse and the postcursor component at the start of this mode (see the intensity variations in figure 1, left panel). We have examined the properties of the first pulse in the Q-Bright mode in greater detail. In figure 12 (left panel) we compare the first pulse with the average profile, while the estimates of the relative intensities are shown in table 5. The main pulse intensity was more than 5 times compared to the average profile, but the postcursor component showed even more dramatic increase of almost 50 times the average. At this instance the postcursor peaked near the trailing edge of the average component where negligible emission was seen otherwise. The bridge emission between the main pulse and the postcursor was barely detectable in this pulse. There was also no detectable emission seen in the interpulse region at the start of the Q-Bright mode. The interpulse emission in the average profile is much weaker at these observing frequencies and is not detected at the single pulse level. However, if the interpulse increased in an equivalent manner to the postcursor component then it would have likely been detected.
| PCBur | |||||
| W50 (°) | W10 (°) | ||||
| 5.56 | 47.60 | 36.1 | 4.2 | 5.20.3 | 17.70.3 |
| Date | Mode | NBursts | Burst Rate | |||
|---|---|---|---|---|---|---|
| MP+PC | PC | IP | PC | IP | ||
| (/1000) | (/1000) | |||||
| 20 April | B | 23 | 189 | 3 | 4.56 | — |
| 22 April | B | 27 | 144 | — | 4.49 | — |
| 24 April | Q-Bright | 2 | 3 | — | 5.91 | — |
| 26 April | B | 14 | 96 | 20 | 3.69 | 0.77 |
| 28 April | B | 20 | 151 | 6 | 4.93 | — |
| 30 April | B | 23 | 104 | 6 | 4.21 | — |
The lack of increased intensity in the interpulse component might suggest the mode changing from the null state to the Q-Bright state to be restricted to a single pole of the pulsar. Alternatively, the increased intensities of the main pulse and particularly the postcursor component at the start of the mode could also be merely coincidental. Other observations during the transition to the Q-Bright state are necessary to validate whether such transitions are always associated with increased intensities. However, in the absence of such observations we have investigated in detail the occurrence of increased intensities of the different components in the single pulse behaviour of the pulsar particularly in the B-mode. The pulse energy distributions of the different components have been reported in previous studies (Sobey et al. , 2015), where the main pulse and the postcursor exhibited log-normal distributions. Our estimates of the distributions were also consistent with the earlier studies. The main pulse had maximum intensities around 10-15 times the average intensity. However, more dramatic increases in intensities were seen in the postcursor component. In addition to the first pulse in the Q-Bright mode, which had a peak intensity of 47.60 times the average intensity, there were several instances where the postcursor intensity exceeded 100 times the average value, an order of magnitude greater than the main pulse high intensity emission. In these rare bright cases the postcursor peaked near the trailing edge of the average component. We have listed in Table 6 the number of pulses during each observing run where the postcursor intensity exceeded 20 times the average value, as well as the rate of such events every 1000 periods. As expected the high intensity in the postcursor were extremely rare with roughly 4-5 such instances seen every 1000 periods. The Table also lists the number of pulses where both the postcursor and the main pulse have increased intensity, i.e the postcursor with more than 20 times its average value and the main pulse with more than 5 times its average intensity. Such cases accounted for 15-20% of the total instances of bright postcursor events. We have estimated the average profile from the pulses with these bright postcursor components as shown in figure 12 (right panel). The postcursor in this average profile was stronger near the trailing edge similar to the first pulse in the Q-Bright mode. The main pulse was also stronger than the average suggesting that the overall intensity increases during these events. However, the interpulse did not show any discernible increase in intensity indicating that these bright emission states were restricted to a single pole.

We have also investigated the interpulse emission in the single pulses to check the possibility of increased emission. This was particularly challenging due to the interpulse being intrinsically very weak and not visible at the single pulse level. The single pulse emission with 20 times the average interpulse intensity was just at the detection limit. We report the presence of such bright interpulse emission in the B-mode of this pulsar. An example is shown in figure 13 between pulse 14285 and 14286, observed on 26 April. The interpulse in this instance was around 15% of the average main pulse intensity and more than 40 times the average interpulse intensity. The baseline level was particularly stable on 26 April with few systematics affecting the observations and was most conducive for these studies. We observed around 20 cases of interpulse emission which were more than 20 times the average intensity and hence detectable. This suggested such high intensity emission states in the interpulse to be extremely rare with less than 1 such event every 1000 periods. On the other observing days the noise at the baseline levels were higher and we could only detect a few of the stronger intensity events from the interpulse region. We did not detect any significantly increased emission in either the main pulse or the postcursor component for any of the instances where the interpulse was very bright. We have estimated the peak intensities of the two main pulses preceding and following the 20 very bright interpulse events on 26 April. The preceding main pulses had minimum intensity of 0.5 times the average profile peak, maximum peak of 4.0 times the average peak with mean ratio being 1.7. In the case of the main pulses following these events the minimum peak was 0.1 times the average profile peak, the maximum ratio was 1.7 times and the mean value being 0.8. This indicates that the preceding main pulse corresponding to the bright interpulse events might be more energetic than the pulses following these events. However, this dependence cannot be claimed with great confidence due to the small number of such high intensity interpulse events observed. There are also no clear indication of the main pulse energies on either side of these bright interpulses to be along any narrow region of the main pulse energy distribution.
6 Discussion
6.1 The periodic modulations in the different Emission Modes
The periodic variations in the single pulse sequences of pulsars have many different forms with likely varying underlying physical mechanisms responsible for them. The most well known is the phenomenon of subpulse drifting where one or more subpulses within the pulse window shows systematic drift bands. The subpulse drifting is believed to originate due to ExB drift of the sparking discharges in the inner acceleration region (IAR, Ruderman & Sutherland, 1975). The sparks subsequently generate the plasma responsible for the radio emission where the drifting behaviour is imprinted (Melikidze et al. , 2000; Lakoba et al. , 2019). In addition to subpulse drifting certain pulsars also show the presence of periodic amplitude modulations and periodic nulling (Basu et al. , 2016, 2017). In these cases the pulse intensities show periodic/quasi-periodic variations in intensity without any systematic subpulse motion within the pulse window. It is believed that the periodic amplitude modulation/nulling is not related to the ExB drift of the sparks but rather due to a triggering mechanism periodically modifying the pair production process in the pulsar magnetosphere (Basu et al. , 2017). It has also been found in recent works that there are clear physical differences seen in subpulse drifting and periodic amplitude modulation/nulling. Subpulse drifting is only seen in the conal components of pulsars, while the central core component does not exhibit drifting. Periodic amplitude modulation as well as periodic nulling encompasses the entire pulse window (Basu et al. , 2019a). Additionally, subpulse drifting shows subpulse motion or shifts within the pulse window. In fluctuation spectral analyses (Backer, 1973; Basu et al. , 2016) the subpulse motion within the pulse window is reflected as systematic phase variations corresponding to the peak frequency. Periodic amplitude modulation and periodic nulling are usually phase stationary since they affect the entire pulse window. There are also clear differences in the physical properties of pulsars showing these different phenomena. Drifting is primarily seen in pulsars with spin down energy loss () 51032 erg s-1 (Basu et al. , 2016, 2019a). On the other hand pulsars with periodic amplitude modulation/periodic nulling do not show any such cutoff in their values. There is also a correlation seen between the drifting periodicities with , such that pulsars with lower tend to have higher drifting periodicities. Such dependence of periodicity on the is absent for the periodic amplitude modulations and nulling.
The periodic amplitude modulations and nulling seen in the different emission modes of the pulsar J0826+2637 exhibit a consistent behaviour. The pulsar has = 4.51032 erg s-1 which is at the boundary for drifting pulsars and its main pulse corresponds to a core component. However, the periodic behaviour still provides a lot of variations from typical examples. As discussed earlier the phase variations corresponding to the amplitude modulations in B-mode are not flat but show phase changes at both the leading and trailing edges of the main pulse. This is one of the first examples where we see not only a periodic change in intensity but also single pulse width. Incidentally a U-shaped phase behaviour is also seen for the periodic modulations of the main pulse in the pulsar J17051906 (B170219), another pulsar with interpulse emission (Weltevrede et al. , 2007a). The modulations are most prominent in the trailing edge and seems to be a form of periodic amplitude modulations. However, it is not clear if an equivalent change in the single pulse widths can be associated with them. The periodicity of the modulations in the B-mode of PSR J0826+2637 (5.5) is higher than expected from subpulse drifting (2 at the boundary), but are still at the lower end for typical amplitude modulation and periodic nulling cases which have periodicities between 10-100. In addition to the main pulse the postcursor component also exhibits periodic amplitude modulations. This is one of the few instances where such periodic behaviour has been associated with either pre/postcursor (PPC) features. As discussed in Basu et al. (2015) the PPC emission originates outside the conventional emission region of the main pulse and hence is expected to have a different emission mechanism. The presence of periodic amplitude modulations in the postcursor further reiterates the proposition in Basu et al. (2017) that the underlying physical processes are related to plasma generation in the IAR and independent of the radio emission mechanism. On the other hand the periodic nulling seen in the Q-mode has higher periodicities (14.2) compared to the modulations in the B-mode, and is a more typical example of this phenomenon. The difference in the periodicities suggests that during mode changing the underlying triggering mechanism also undergoes changes. A number of pulsars have been studied where the periodic amplitude modulations and periodic nulling seem to show temporal changes in their periodic properties. As discussed in more detail in the next subsection, the two modes of PSR J18250935 (B182209) show the presence of periodic modulations with different periodicities (Latham et al. , 2012). The core/cone Triple pulsar J1948+3540 (B1946+35) shows the presence of wide and diffuse periodic amplitude modulations in the average fluctuation spectra (Mitra et al. , 2016). However, there are instances when very sharp features resembling highly ordered periodic behaviours are seen. However, no associated mode changing was reported for this source. The presence of periodic nulling was also reported for the pulsar J20060807 (B200308) with a Multiple profile comprising of a central core and two pairs of conal components (Basu et al. , 2019b). The pulsar exhibits the presence of four clear emission modes two of which, A-mode and B-mode, show the presence of subpulse drifting. The periodic nulling is only seen in C-mode and D-mode. The pulsar J0826+2637 provides another important addition to this newly emergent phenomenon in pulsars.
6.2 The relation between the radio emission from the two poles
The relationship between the radio emission from the main pulse and interpulse has important implications for understanding the physical processes in pulsars. There have been reports of interaction between the main pulse and interpulse particularly in three pulsars J10575226 (B105552) (Bigg, 1990; Weltevrede & Wright, 2009; Weltevrede et al. , 2012), J17051906 (Weltevrede et al. , 2007a) and J18250935 (Fowler & Wright, 1982; Gil et al. , 1994; Backus et al. , 2010; Latham et al. , 2012; Hermsen et al. , 2017; Yan et al. , 2019). In case of PSR J10575226 both the main pulse and the interpulse show prominent profiles with the main pulse having four components and the interpulse with three components in the average profile. Both the main pulse and the interpulse show roughly phase stationary, periodic amplitude modulations of 20. Additionally, the phases between the main pulse and the interpulse are offset by 40° which remains constant over time. Periodic amplitude modulations are also observed for pulsar J17051906 where the main pulse as well as the interpulse show periodic variations of 10, and they appear to be phase locked over observations spanning several years. PSR J18250935 has a precursor component preceding the main pulse in addition to the interpulse emission. The pulsar exhibits two modes, B-mode and Q-mode similar to PSR J0826+2637 and shows periodic amplitude modulations of 40 in the Q-mode for both the interpulse and the main pulse component which also seem to be phase locked. The precursor emission is absent during the Q-mode. On the contrary the interpulse vanishes during the B-mode when the precursor is most prominent. The B-mode also shows periodic amplitude modulation with a different periodicity 70. The emission modes are short lived lasting several hundred periods at a time. Latham et al. (2012) have also reported instances of mode mixing when both the precursor and interpulse exist simultaneously. These observations suggest that there is a possibility of interaction between the two poles of the pulsar magnetosphere in a manner that periodically affects the radio emission. All three pulsars seem to exhibit periodic amplitude modulations and not subpulse drifting.
In the case of PSR J0826+2637 it was not possible to detect any modulation features for its weak interpulse emission. But the modal behaviours still provided interesting insights regarding the interaction between the two poles. Firstly, no interpulse emission was seen during the null state preceding the Q-bright mode on 24 April, 2017, suggesting that the radio emission was absent or greatly reduced beyond detection limits for both poles. Additionally, during the Q-mode when the main pulse and postcursor intensity decreased significantly, the interpulse was not detected in our observations. However, there was also differing behaviour between the main pulse and the interpulse emission particularly during the B-mode. Both the postcursor component and the interpulse showed higher intensity emission in the single pulses which was at least 20 times greater than the average value. The only instance of transition from the null state to the Q-bright mode showed increased intensity from both the main pulse and the postcursor component but no such variation was seen in the interpulse. There was no clear evidence of any association between the high intensity emission from the two poles during B-mode. Additionally, during the short duration nulls of the main pulse in this mode the interpulse emission did not seem to change. On the other hand, during nulls in the Q-mode no emission was seen in the interpulse as well. The longer nulls in Q-mode were periodic in nature while the short duration nulls in the B-mode did not show any periodicity. There are indications that the emission changes are affected simultaneously in the main pulse and interpulse. However, the interpulse emission in most of our observations is too weak to draw any definitive conclusions regarding the interaction between them and more sensitive observations are required to answer this question.
The different emission features seen in pulsar J0826+2637 indicate the presence of diverse physical mechanisms within the pulsar magnetosphere. There is increasing observational evidence that the changes in the radio emission are driven by variations seen at different scales within the pulsar magnetosphere. Phenomena such as subpulse drifting, micro-structures in the single pulses, short duration nulls not associated with periodicity, etc., are likely affected by local variations related to the plasma generation and the subsequent radio emission mechanism (Lakoba et al. , 2019). These variations generally affect a few pulses at a time. On the other hand a separate class of emission properties have emerged which seem to be pan-magnetospheric. These include the intermittent behaviour in pulsars which show changes in period derivatives during long nulling intervals lasting from weeks to months (Kramer et al. , 2006; Lyne et al. , 2017), the transition of the pulsar between different emission modes, including long duration null modes, with modal durations from several hundred periods to several hours at a time, the periodic intensity modulations with durations of 10-100 periods, amongst others. The pan-magnetospheric nature of the later two phenomena, mode changing and periodic intensity modulation, is highlighted by the interaction between the main pulse and the interpulse which appear to be simultaneously affected during these changes. The radio emission shows different emission behaviour during mode changing, like changes in emission intensity, the nature of subpulse drifting, etc. However, the radio emission heights and the corresponding location of the emission region remains largely unchanged during the different modes (Basu & Mitra, 2018b; Basu et al. , 2019b).
6.3 The X-ray variation during the different emission modes
Pulsar J0826+2637 was observed simultaneously in the 0.2-2 keV X-ray band (Hermsen et al. , 2018). The pulsar exhibited synchronous mode changing in radio and X-ray frequencies, with the X-ray emission showing significant detection during the B-mode and Q-bright mode and non-detection during the null and Q-mode. The X-ray observations were separated into one hour durations and showed up to 20% variability during the B-mode. It was speculated that such variations were closely connected with the dynamics of the radio emission. The lack of absolute flux calibration during the radio observations make it difficult to verify whether an equivalent change in intensity was present in the radio emission. However, we investigated correlations between other aspects of the emission dynamics during the B-mode. The B-mode showed short duration nulls which were present in less than 5% of the total pulses. The X-ray intensities on 20 and 22 April had instances of 15-20% higher intensities compared to the observations on the remaining days. The nulling fractions also showed slightly lower values on these days. We have estimated the nulling fractions corresponding to the one hour windows over which the X-ray variability were calculated. The nulling fractions varied between 3-5% within each observing session as well as across all the sessions. However, no discernible trend with the X-ray variability was seen. Additionally, there was no clear difference in the rate of high intensity postcursor emission during the different days when the pulsar was observed in the B-mode. We conclude that given the low counting statistics of the X-ray observations ( 0.01 counts/sec), no clear evidence of correlated short-term variability of the radio and X-ray emission during B-mode could be detected.
The synchronous X-ray and radio mode switching from PSR J0826+2637 makes it only the second pulsar after J0946+0951 (B0943+10) (Hermsen et al. , 2013) where such behaviour could be detected. Both these sources exhibit two distinct modes characterized by their ‘Quiet’ and ‘Bright’ emission states which can last for several hours at a time (Backus et al. , 2011; Sobey et al. , 2015). The X-ray emission on the other hand has contrasting behaviour for the two pulsars. The X-ray was not detectable in the Q-mode of PSR J0826+2637 which was at least 9 times less than the detected flux during the B-mode. While in the case of PSR J0946+0951 the X-ray emission showed an increment of 2.4 times in the Q-mode compared to the B-mode, with the X-ray pulsed fraction changing as a function of energy (Mereghetti et al. , 2016). Additionally, simultaneous radio and X-ray observations were also conducted for PSR J18250935 which exhibits shorter duration modes lasting several hundred periods (Hermsen et al. , 2017). However, no variation in the X-ray emission during mode changing was detected for this source. Similar studies were carried out for the pulsar J0614+2229 (B0611+22) which show presence of quasi-periodic bursting emission (Rajwade et al. , 2016). The pulsar was observed simultaneously with XMM-Newton, but no detectable X-ray emission could be seen. At present our understanding of the physical processes in the pulsar magnetosphere is limited and hence any possible explanations for the simultaneous radio and X-ray mode changing is mostly speculative222Hermsen et al. (2018) have discussed a number of possible scenarios leading to simultaneous radio and X-ray mode changing.. Though it seems more likely that the X-ray variations reflect the pan-magnetospheric changes discussed earlier. There does not appear to be a short duration association between the radio and X-ray emission, however, more detailed studies with (future) X-ray missions with larger sensitive areas as well as flux calibrated radio observations are necessary to further explore any such correlation. There is one aspect of the physical parameters that have not gathered much attention but seems interesting and relevant for this phenomenon. There is increasing evidence that a phase transition in the emission properties of pulsars is seen between 1032-1033 erg s-1. As discussed earlier the subpulse drifting is only seen in pulsars with below this range. A change in the average polarization behaviour has also been reported associated with (Weltevrede & Johnston, 2008; Mitra et al. , 2016). The percentage polarization in pulsars is high usually exceeding 60% in the high range, but decreases near the transition region to less than 20% and subsequently increases slightly to around 30% for lower pulsars. Additionally, the five pulsars which show intermittent behaviour, i.e where the radio emission vanishes for long durations, all lie in this narrow range (Lyne et al. , 2017). Of the three pulsars J0826+2637, J0946+0951 and J1825-0935, where detailed simultaneous radio and X-ray studies have been carried out the first two showed synchronous variations. The three pulsars have values of 4.521032 erg s-1, 1.041032 erg s-1 and 4.561033 erg s-1, respectively, indicating a possible connection with this narrow boundary. However, it is clear that this association is mostly speculative without any detailed models explaining the origin of such transitions in the parameter and the lack of simultaneous radio and X-ray observations from a significant number of pulsars.
7 Summary and Conclusion
We have carried out a detailed study of the single pulse behaviour from the different emission states of the pulsar J0826+2637. The pulsar exhibited two prominent modes, B-mode and Q-mode which lasted for hours at a time, in addition to a short lived null state as well as the Q-bright mode. The two primary modes were distinguished by the nature of nulling behaviour. In B-mode the main pulse nulled for short durations lasting a few periods and nulling fraction less than 5%. In contrast, the pulsar nulled for more than 90% of duration in Q-mode which was interspersed with short bursts of emission. The nulling during B-mode was localised to the main pulse with the postcursor showing lower level emission and the interpulse emission was unchanged during the main pulse nulls. On the contrary no emission was seen in any of the components during the nulls in the Q-mode. We have verified the presence of periodic amplitude modulations of intensity (5) in the main pulse during B-mode, which was also seen to be present in the postcursor component. It was found that during these periodic modulations in addition to change in intensity the main pulse also showed systematic variation in widths. Additionally, we have also discovered the appearance of periodic nulling in the Q-mode with a different periodicity (14). The pulsar joins a small group where different periodic amplitude modulations/periodic nulling are seen to develop in their single pulse behaviour. There were instances where the postcursor and the interpulse components showed higher intensity emission which were at least more than 20 times the average value. The most prominent amongst these was the first pulse during the transition from the null mode to the Q-bright state where the main pulse also had around five times the average intensity. However, more observations are required to verify if this was a coincidental effect or a by-product of the underlying physical processes responsible for such changes. The main pulse also had higher intensities during the high intensity emission from the postcursor, but no connection was seen between increased emission states from the two poles. Apart from the large scale synchronous variations in the radio and X-ray emission during the Q-mode and B-mode, we did not detect any clear indications of small scale (15-20%) X-ray variations in the single pulse dynamics of the radio emission. There has been evidence for periodic amplitude modulations to be correlated in the two poles of the pulsar magnetosphere. Despite the lack of single pulse emission in the interpulse, we have found indications of the periodic nulling in Q-mode to be present in both poles. The periodic amplitude modulations and periodic nulling are believed to be a result of a triggering mechanism periodically modifying the pair production process in the pulsar magnetosphere. These observations indicate that the triggering mechanism is pan-magnetospheric, affecting both the poles at the same time.
Acknowledgments
We thank the referee for the comments which helped to improve the paper. We thank Prof. Wim Hermsen and Prof. Joanna Rankin for their comments. DM acknowledges funding from the grant “Indo-French Centre for the Promotion of Advanced Research - CEFIPRA”. We thank the staff of the GMRT who have made these observations possible. The GMRT is run by the National Centre for Radio Astrophysics of the Tata Institute of Fundamental Research.
References
- Backer (1970a) Backer, D.C. 1970a, Nature, 228, 1297
- Backer (1970b) Backer, D.C. 1970b, Nature, 228, 42
- Backer (1973) Backer, D.C. 1973, ApJ, 182, 245
- Backer et al. (1973) Backer D.C.; Boriakoff V.; Manchester R.N. 1973, Nat. Phys. Sci., 243, 77
- Backus et al. (2010) Backus, I.; Mitra, D.; Rankin, J.M. 2010, MNRAS, 404, 30
- Backus et al. (2011) Backus, I.; Mitra, D.; Rankin, J.M. 2011, MNRAS, 418, 1736
- Bartel et al. (1982) Bartel, N.; Morris, D.; Sieber, W.; Hankins, T.H. 1982, ApJ, 258, 776
- Basu et al. (2015) Basu, R.; Mitra, D.; Rankin, J.M. 2015, ApJ, 798, 105
- Basu et al. (2016) Basu, R.; Mitra, D.; Melikidze, G.I.; Maciesiak, K.; Skrzypczak, A.; Szary, A. 2016, ApJ, 833, 29
- Basu et al. (2017) Basu, R.; Mitra, D.; Melikidze, G.I. 2017, ApJ, 846, 109
- Basu & Mitra (2018a) Basu, R.; Mitra, D. 2018a, MNRAS, 475, 5098
- Basu & Mitra (2018b) Basu, R.; Mitra, D. 2018b, MNRAS, 476, 1345
- Basu et al. (2019a) Basu, R.; Mitra, D.; Melikidze, G.I.; Skrzypczak, A. 2019a, MNRAS, 482, 3757
- Basu et al. (2019b) Basu, R.; Paul, A.; Mitra, D. 2019b, MNRAS, 486, 5216
- Bigg (1990) Biggs, J.D. 1990, MNRAS, 246, 341
- Bigg (1992) Biggs, J.D. 1992, ApJ, 394, 574
- Brinkman et al. (2019) Brinkman, C.; Mitra, D.; Rankin, J. 2019, MNRAS, 484, 2725
- Daszuta et al. (2013) Daszuta, M.; Lewandowski, W.; Kijak, J. 2013, MNRAS, 436, 2492
- Edwards & Stappers (2002) Edwards, R.T.; Stappers, B.W. 2002, A&A, 393, 733
- Fowler & Wright (1982) Fowler, L.A.; Wright, G.A.E. 1982, A&A, 109, 279
- Gajjar et al. (2012) Gajjar, V.; Joshi, B.C.; Kramer, M. 2012, MNRAS, 424, 1197
- Geppert & Viganò (2014) Geppert, U.; Viganò, D. 2014, MNRAS, 444, 3198
- Gil et al. (1994) Gil, J.A.; Jessner, A.; Kijak, J.; Kramer, M.; Malofeev, V.; Malov, I.; Seiradakis, J.H.; Sieber, W.; Wielebinski, R. 1994, A&A, 282, 45
- Gil et al. (2003) Gil, J.; Melikidze, G.I.; Geppert, U. 2003, A&A, 407, 315
- Hankins & Fowler (1986) Hankins, T.H.; Fowler, L.A. 1986, ApJ, 304, 256
- Hermsen et al. (2013) Hermsen, W.; Hessels, J. W. T.; Kuiper, L. et al. 2013, Science, 339, 436
- Hermsen et al. (2017) Hermsen, W.; Kuiper, L.; Hessels, J. W. T.; et al. 2017, MNRAS, 466, 1688
- Hermsen et al. (2018) Hermsen, W.; Kuiper, L.; Basu, R. et al. 2018, MNRAS, 480, 3655
- Kramer et al. (2006) Kramer M.; Lyne A.G.; O’Brien J.T.; Jordan C.A.; Lorimer D.R. 2006, Science, 312, 549
- Latham et al. (2012) Latham, C.; Mitra, D.; Rankin, J. 2012, MNRAS, 427, 180
- Lakoba et al. (2019) Lakoba, T.; Mitra, D.; Melikidze, G. 2019, MNRAS, 480, 4526
- Lyne et al. (2010) Lyne A.; Hobbs G.; Kramer M.; Stairs I.; Stappers B. 2010, Science, 329, 408
- Lyne et al. (2017) Lyne, A.G.; Stappers, B.W.; Freire, P.C.C., et al. 2017, ApJ, 834, 72
- Mereghetti et al. (2016) Mereghetti S., et al. 2016, ApJ, 831, 21
- Melikidze et al. (2000) Melikidze, G.I.; Gil, J.A.; Pataraya, A.D. 2000, ApJ, 544, 1081
- Mitra et al. (2016) Mitra, D.; Basu, R.; Maciesiak, K.; Skrzypczak, A.; Melikidze, G.I.; Szary, A.; Krzeszowski, K. 2016, ApJ, 833, 28
- Mitra et al. (2015) Mitra, D.; Arjunwadkar, M.; Rankin, J. 2015, ApJ, 806, 236
- Mitra & Rankin (2017) Mitra, D.; Rankin, J. 2017, ApJ, 468, 4601
- Radhakrishnan & Cooke (1969) Radhakrishnan, V.; Cooke, D.J. 1969, ApL, 3, 225
- Rankin (1986) Rankin, J.M. 1986, ApJ, 301, 901
- Rankin (1990) Rankin, J.M. 1990, ApJ, 352, 247
- Rankin & Rathnasree (1995) Rankin, J.M.; Rathnasree, N. 1995, JApA, 16, 327
- Rajwade et al. (2016) Rajwade, K.; Seymour, A.; Lorimer, D.R.; Karastergiou, A.; Serylak, M.; McLaughlin, M.A.; Griessmeier, J.-M. 2016, MNRAS, 462, 2518
- Ritchings (1976) Ritchings, R.T. 1976, MNRAS, 176, 249
- Ruderman & Sutherland (1975) Ruderman, M.A.; Sutherland, P.G. 1975, ApJ, 196, 51
- Swarup et al. (1991) Swarup, G., Ananthakrishnan, S., Kapahi, V. K., et al. 1991, Current Science, 60, 95
- Szary et al. (2015) Szary, A.; Melikidze, G.I.; Gil, J. 2015, MNRAS, 447, 2295
- Sobey et al. (2015) Sobey, C.; Young, N.J.; Hessels, J.W.T et al. 2015, MNRAS, 451, 2493
- Timokhin (2010) Timokhin, A. 2010, MNRAS, 408, 41
- Weltevrede et al. (2006) Weltevrede, P.; Edwards, R. T.; Stappers, B. W. 2006, A&A, 445, 243
- Wang et al. (2007) Wang, N.; Manchester, R. N.; Johnston, S. 2007, MNRAS, 377, 1383
- Weltevrede et al. (2007a) Weltevrede, P.; Wright, G.A.E; Stappers, B.W. 2007a, A&A, 467, 1163
- Weltevrede et al. (2007b) Weltevrede, P.; Edwards, R. T.; Stappers, B. W. 2007b, A&A, 469, 607
- Weltevrede & Johnston (2008) Weltevrede, P.; Johnston, S. 2008, MNRAS, 391, 1210
- Weltevrede & Wright (2009) Weltevrede, P.; Wright, G.A.E 2009, MNRAS, 395, 2117
- Weltevrede et al. (2012) Weltevrede, P.; Wright, G.A.E; Johnston, S. 2012, MNRAS, 424, 843
- Yan et al. (2019) Yan, W.M.; Manchester, R.N.; Wang, N.; Yuan, J.P.; Wen, Z.G.; Lee, K.J. 2019, MNRAS, 485, 3241
- Yuen & Melrose (2017) Yuen, R.; Melrose, D.B. 2017, MNRAS, 469, 2049
- Young et al. (2012) Young, N.J.; Stappers, B.W.; Weltevrede, P.; Lyne A.G.; Kramer, M. 2012, MNRAS, 427, 114