Evaluation and Improvement of Chatbot Text Classification Data Quality Using Plausible Negative Examples
Abstract
We describe and validate a metric for estimating multi-class classifier performance based on cross-validation and adapted for improvement of small, unbalanced natural-language datasets used in chatbot design. Our experiences draw upon building recruitment chatbots that mediate communication between job-seekers and recruiters by exposing the ML/NLP dataset to the recruiting team. Evaluation approaches must be understandable to various stakeholders, and useful for improving chatbot performance. The metric, nex-cv, uses negative examples in the evaluation of text classification, and fulfils three requirements. First, it is actionable: it can be used by non-developer staff. Second, it is not overly optimistic compared to human ratings, making it a fast method for comparing classifiers. Third, it allows model-agnostic comparison, making it useful for comparing systems despite implementation differences. We validate the metric based on seven recruitment-domain datasets in English and German over the course of one year.
1 Introduction
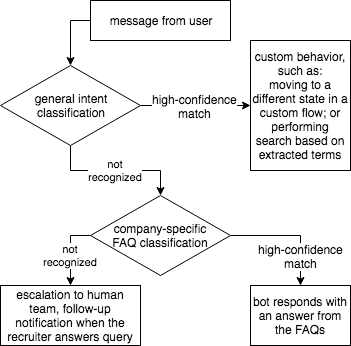
Smart conversational agents are increasingly used across business domains Jain et al. (2018). We focus on recruitment chatbots that connect recruiters and job-seekers. The recruiter teams we work with are motivated by reasons of scale and accessibility to build and maintain chatbots that provide answers to frequently asked questions (FAQs) based on ML/NLP datasets. Our enterprise clients may have up to employees, and commensurate hiring rate. We have found that almost of end-user (job-seeker) traffic occurs outside of working hours Liu (2019), which is consistent with the anecdotal reports of our clients that using the chatbot helped reduce email and ticket inquiries of common FAQs. The usefulness of these question-answering conversational UIs depends on building and maintaining the ML/NLP components used in the overall flow (see Fig. 1).
In practice, the use of NLP does not improve the experience of many chatbots Pereira and Díaz (2018), which is unsurprising. Although transparency (being “honest and transparent when explaining why something doesn’t work”) is a core design recommendation DialogFlow (2018), the most commonly available higher-level platforms Canonico and De Russis (2018) do not provide robust ways to understand error and communicate its implications. Interpretability is a challenge beyond chatbots, and is a prerequisite for trust in both individual predictions and the overall model Ribeiro et al. (2016). The development of the nex-cv metric was driven by a need for a quantification useful to developers, as well as both vendor and client non-developer staff.
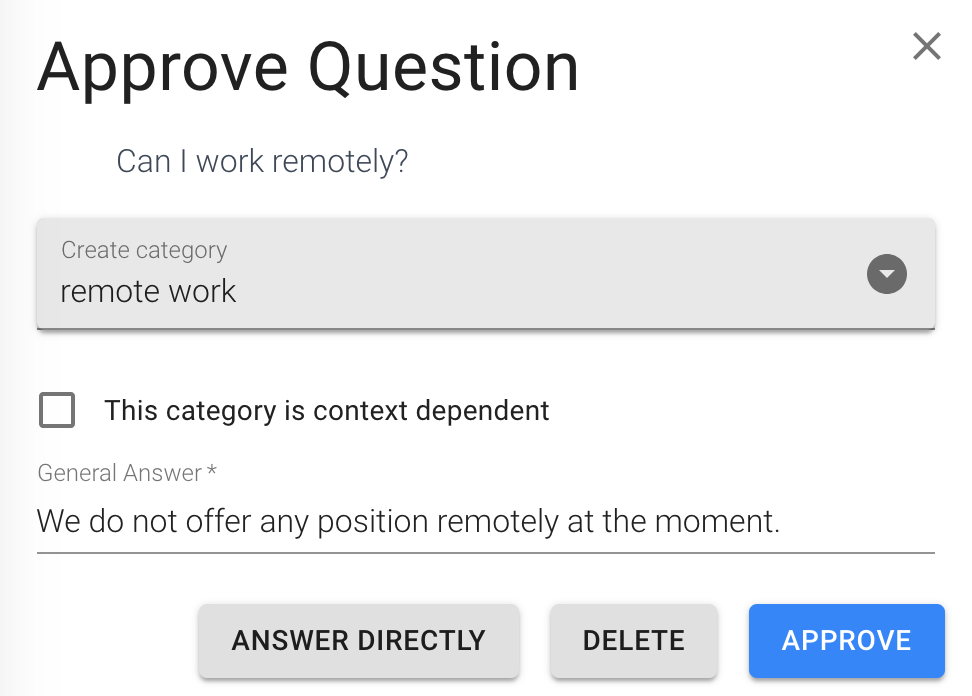
The nex-cv metric uses plausible negative examples to perform actionable, model-agnostic evaluation of text classification as a component in a chatbot system. It was developed, validated, and used at jobpal, a recruiting chatbot company, in projects where a client company’s recruiting team trains and maintains a semi-automated conversational agent’s question-answering dataset. Use of ML and NLP is subject to conversation flow design considerations, and internal and external transparency needs Kuksenok and Praß (2019). The chatbots do not generate answers, but provide all responses from a bank that can be managed by client staff. Each of about a dozen live chatbots answers about of incoming questions without having to defer to a human for an answer. About two thirds of the automated guesses are confirmed by recruiters; the rest are corrected (Fig. 3).
In “Background”, we relate our work to prior research on curated ML/NLP datasets and evaluation in chatbots. In “Approach”, we describe the metric and provide its application and data context of use. In “Validation Datasets”, we describe the datasets with which this metric has been validated. In “Validation”, we provide results from experiments conducted while developing and using the metric for over a year, addressing each of the needs of the metric, which make it a useful tool for multiple stakeholders in the chatbot design and maintenance process.
We contribute a metric definition, its validation with six real projects over the course of one year (2018.Q2 through 2019.Q1), as well as an extensible implementation111http://github.com/jobpal/nex-cv and testing plan, which is described in “Metric Definition” below.
2 Background
Chatbots, or “text messaging-based conversational agents”, have received particular attention in 2010s Jain et al. (2018). Many modern text-based chatbots use relatively simple NLP tools Abdul-Kader and Woods (2015), or avoid ML/NLP altogether Pereira and Díaz (2018), relying on conversation flow design and non-NLP inputs like buttons and quick-replies. Conversational natural-language interfaces for question-answering have an extensive history, which distinguishes open-domain and closed-domain systems Mishra and Jain (2016). ML-based chatbots rely on curated data to provide examples for classes (commonly, “intents”), and must balance being widely-accessible to many end-users, but typically specialized in the domain and application goal Serban et al. (2015). In practice, design and development of a chatbot might assume a domain more focused, or different, than real use reveals.
In the chatbot application context, the training dataset of a text classifier may be modified to improve that classifier’s performance. The classes — “intents” — are trained with synthetic data and constitute anticipated, rather than actual, use. Existing general-purpose platforms include this synthetic data step as part of design and maintenance Canonico and De Russis (2018). For example, when it comes to invocations for a voice agent Ali et al. (2018), dataset construction encodes findings about how users might imagine asking for some action: the authors use a crowd-sourcing mechanism to achieve both consistency useful for classification, and reflection of user expectations in the dataset. We adopt a similar approach: enabling domain-experts (recruiters) to maintain the dataset helps map end-user (job-seeker) needs to recruiters’ goals.
Data cleaning is not only relevant to chatbots. Model-agnostic systems for understanding machine learning can help iteratively develop machine learning models Zhang et al. (2019). Developers tend to overlook data quality in favor of focusing on algorithmic improvements in building ML systems Patel et al. (2008). Feature engineering can be made accessible to non-developers or domain experts, e.g. Ribeiro et al. (2016). We make use of representative examples in the process that surfaces nex-cv to non-developers; in describing this process in “Metric Application”, we map it to the inspection-explanation-refinement process employed in Zhang et al. (2019). Enabling non-developers to perform data cleaning effectively allows developers to focus on model adjustments and feature engineering.
There are many ways to measure overall chatbot quality, such as manual check-lists of high-level feature presence Kuligowska (2015); Pereira and Díaz (2018). Static analysis and formal verification may be used with a specified flow Porfirio et al. (2018). User behavior measurements — both explicit, like ratings or feedback, and implicit, like timing or sentiment — are explored in Hung et al. (2009). During metric development, we used qualitative feedback from domain-expert users, and key performance indicators (KPIs), such as automatic response rate. Regardless of overall evaluation approach, the use of a classifier as a component in a complex flow demands robust and actionable evaluation of that component.
3 Approach
The nex-cv algorithm selects some classes as plausible sources of negative examples, and then uses those to partition the given dataset into training and test data (Alg. 1). Negative examples are useful in chatbot component evaluation: the end-user interaction with a chatbot is open-ended, so the system is expected to encounter input that it should recognize as outside its domain.
Low-membership classes are candidates for being ignored in training and used as negative examples in testing. Two mutually-exclusive variations use the parameter for cutoff-based negative example selection (Alg. 2); and the parameter for proportional negative example selection (Alg. 2). We focus on three settings, with set to , , and . The values were tuned for typical distributions (see “Validation Datasets”), and the is a validating measure that is comparable to -fold CV (see “Metric Definition”).
We assume that low-population classes are all in the same domain as the rest. There may be exceptions: in some cases a new, small category may be created in response to new questions on an emergent topic well outside of the core domain. In our experience, this happens when there is a technical issue elsewhere on the site and the chatbot channel is used as an alternative to escalate the issue. In practice, our system handles this case well, even if the evaluation is less applicable. Such emergent categories either disappear over time: the topic is temporary; or grow: the topic becomes part of the domain.
3.1 System Overview
A chatbot (Fig. 2) is based on two datasets (Fig. 1), each maintained using a data management tool (Fig. 3). Traffic varies widely between projects, but is typically consistent within a project. To provide a range: in one quarter in 2018, the highest traffic chatbot had about active users, of which about (ca. ) asked questions. The lowest-traffic chatbot saw weekly active users, of which (ca. ) asked questions. In both cases, a small number (2-4) of recruiters were responsible for maintaining the dataset.
The training set of the FAQ portion of each project contains between and training examples across between and distinct classes, usually starting with about classes and creating new classes after the system goes live and new, unanticipated user needs are encountered. To build classifiers on datasets of this size, we use spaCy Honnibal and Montani (2017) and fastText Bojanowski et al. (2016) for vectorization, with transformation for improved performance Arora et al. (2016), and logistic regression with L2 regularization Pedregosa et al. (2011).
The dataset for shared general intents is maintained through the data management tool by jobpal staff. One such classifier is shared by all companies that use a particular language; projects span English, German, Chinese, and French. About general intents are trained with a total of about to training examples per language. These include intents that control the conversation (e.g., ‘stop’, ‘help’). This shared language-specific classification step includes entity extraction of profession and city of interest to job-seekers; for example, statements like ‘I want a [profession] job in [city]‘ and ‘do you have any [profession] openings?’ should all resolve to ‘job search’ along with extracted keywords. Lastly, this classifier also identifies very common questions that affect all chatbots222This was another outcome of the case study summarized in Fig. 4: we identified four categories of questions that we could anticipate in all projects, but that were not in the expert domain of the FAQ, so we made modifications to the flow, the way the existing classifiers were used, and the general intents training data, to help keep company-specific FAQ datasets more focused., but which are not in the recruitment domain: e.g., ‘how are you?’ and ‘is this a robot?’.
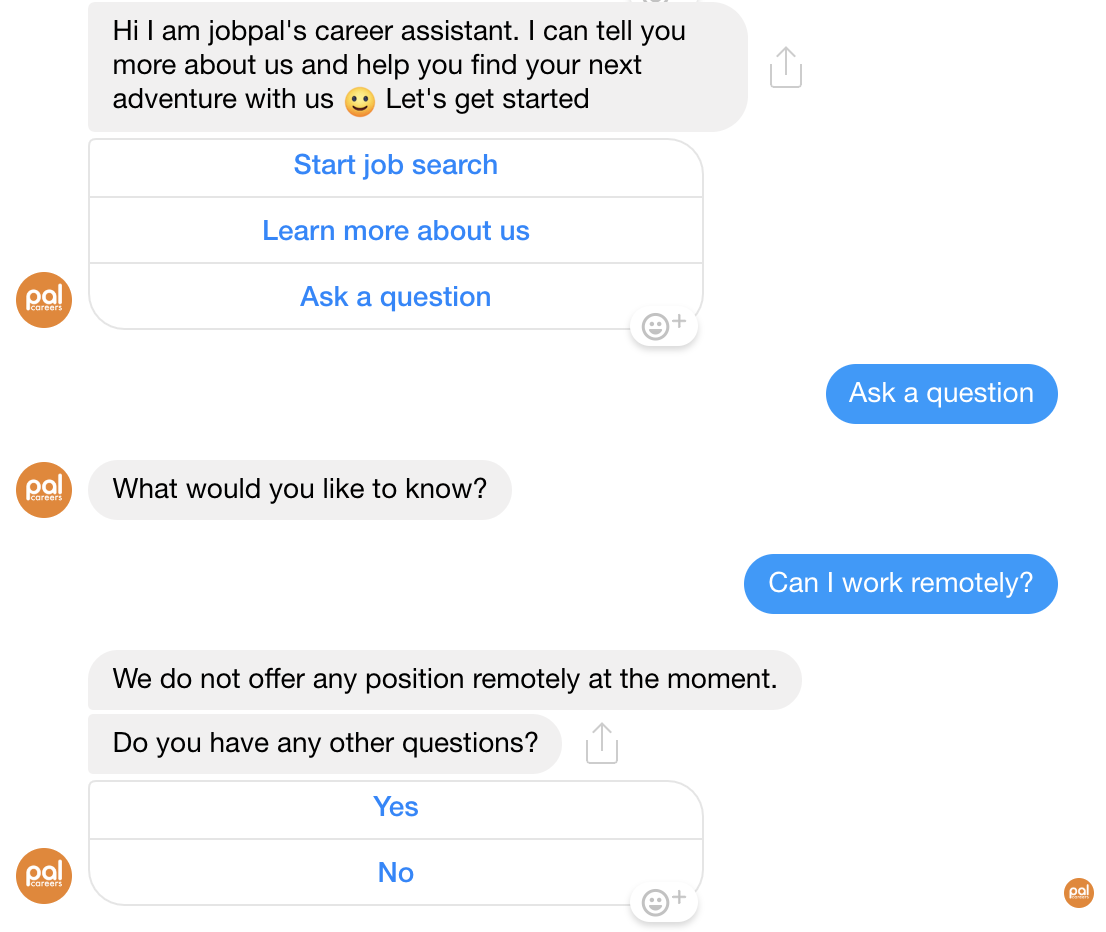
The dialog in Fig. 2 shows the FAQ functionality of the chatbots, powered by classification using company-specific FAQ datasets (see also Fig. 1). In most projects, users who ask question ask between 1 and 2 questions. The FAQ functionality is typically an addition to any existing information displays. Many of our chatbots also feature job discovery, including search and subscriptions. Job search may be triggered by clicking on the button [Look for a job], or writing something like “I would like a [profession] job in [location]” at almost any point in the flow. If either of location or profession is not specified, the user is prompted, and the responses are used to search current openings, which are then shown. The user may submit application or follow external links; the user may also ask questions about specific jobs or the employer more generally.
3.2 Metric Definition
The code available online333http://github.com/jobpal/nex-cv provides the evaluation implementation, an abstract black-box definition for a classifier, and two strategies to help test an implementation. For integration testing, CustomClassifier.test() can be used to check consistency of classifier wrapper. For functional testing, nex-cv both (Alg. 2) and (Alg. 2) should yield comparable results to -fold cross-validation.
In -fold cross-validation, data is partitioned into sets of such that (let the test fraction ), and the training sets do not overlap. Then, each set of training data is evaluated using the corresponding test set. Evaluation can include many possible measures: accuracy or ; representative examples; confusion matrix; timing data; etc.
In nex-cv, test fraction is a setting ( for all reported experiments), and data partitions may overlap. As shown in Alg. 1, representation of high-population classes is enforced. Then, low-population classes are also split using , and included either in the training set with their ground truth label; or in the test set as a negative example. In practice, this results in about of the data being in training. Some low-population classes in the training set should be included as this is representative of the dataset shape; many low-population classes may affect the classification and confidence overall, depending on classification approach. Low-population classes are typically rare or relatively recent topics, so interpreting them as plausible negative examples helps to test the classifier, and its measure of confidence.
3.3 Validation Datasets
The seven datasets to which we report having applied the nex-cv metric are in the recruitment domain. Each dataset has about classes, and most have classes with 5-10 members as well as classes with over a hundred. To characterize the content, we trained a classifier on an anonymous benchmark dataset 444The clean, anonymized recruitment-domain-specific dataset in English was built by anonymizing and aggregating all FAQ datasets; using pairwise similarity between categories to group them. For an initial clustering, we used Jaccard index with a minimum of , which balanced the goals of high coverage of example data () and reasonable sizes of classes ( examples per class); then, this dataset was subject to iterative data quality improvements as described further and exemplified in Fig. 4 until a final set of about examples over about categories was developed. This initial domain-specific clustering was performed on English, but has since been extended to other supported languages; the results reported are specific to English, however. and used it to classify a random recent sample of English-language questions.
About of recent end-user queries in English fall into categories: (1) Application Process; (2) Salary; (3) Professional Growth and Development; (4) Internships; (5) Contact a Human.
Another of end-user queries fall into categories: Application Evaluation; Application Deadline; Application Delete or Modify; How Long to Apply and Hear Back; Qualification; Application Documents; Language Expectations; Thesis; Working Hours; Location; Starting at the Company; Commute; Equipment; Benefits.
About of overall requests were not recognized (with a confidence of or higher) as any of the categories in the anonymous benchmarking set. Upon manual inspection, some of these test questions were noise, and many were topics specific to particular company FAQs, such as concerning specific work-study programs; details of the application software; and other more niche topics.
The classification datasets share some overlapping topics; each also has a specific set of additional topics. Each dataset has the typical shape of a few larger classes, and many smaller ones, which have an indirect relationship to what data is expected. The use of low-population classes as plausible negative examples takes advantage of both the content of the data (closed-domain, with a topic-specific core but a considerable number of additional, outlying topics) and the membership distribution of the classes (a few well-populated ones, and many much smaller classes).
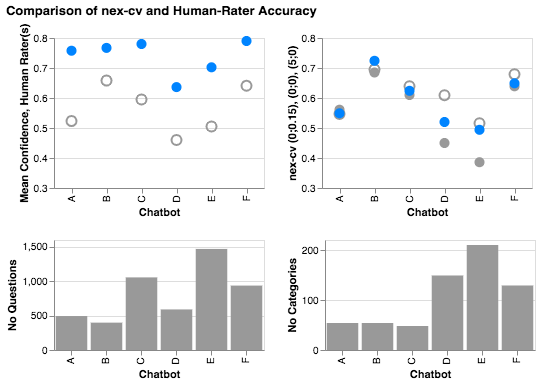
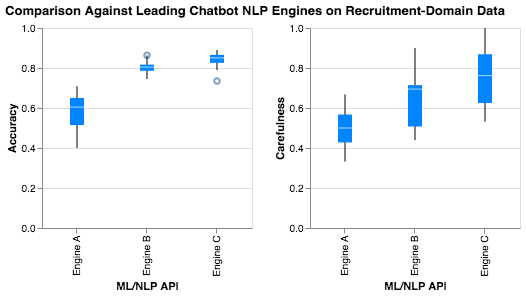
The nex-cv metric may apply in other problems or domains, but we developed and validated it in a series of experiments with six live datasets, in English and German (see Fig. 5, of which chatbot E is also the subject of Fig. 4), in addition to the seventh aggregate anonymous benchmark dataset described above, which was used for the comparison in Fig. 6.
4 Validation
The following case studies validate the metric relative to each of three requirements: (1) enable data quality improvements, as in Fig. 4, (2) not be overly-optimistic, as in Fig. 5, (3) enable model-agnostic comparison, as in Fig. 6.
4.1 Metric Application
The goal of usefulness includes interpretability: “provid[ing] qualitative understanding between the input variables and the response… [taking] into account the user’s limitations in Ribeiro et al. (2016). Usefulness combines this with actionable support of chatbot design. The users include, in this case, non-developer staff on both vendor and client side: recruiters and project managers.
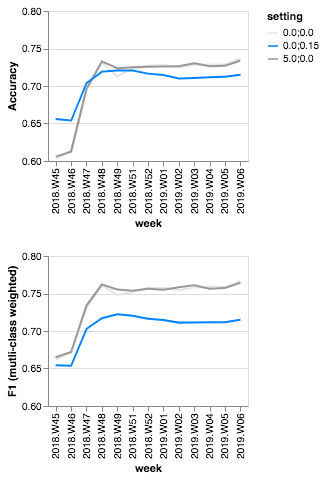
Through iteration on internal tools, we found that displaying performance information in the form of, “which 2-3 topics are the biggest problem?” was most effective for understanding, communication, and action. Over the course of a year, the nex-cv metric informed this analysis. During this time, both qualitative feedback and KPIs have validated that it was effective both for trust and for the end-user experience. The automation rate KPI — proportion of incoming queries that did not need deferral to a human, but answered immediately, as in Fig. 2 — has risen to and remained at across projects mainly555The data training UI design contributes to data quality; in the months following the intervention shown in Fig. 4, the UI was redesigned to address outstanding usability problems, with very positive feedback from domain-expert users. A more in-depth discussion of the role of human factors in human-in-the-loop systems is out of scope for this paper. due to data quality support during both design and maintenance.
In one illustrative project (Fig. 4) the automation rate had become as low as . The recruiters responsible for dealing with escalated questions became frustrated to see questions come up that had been asked before. Action needed to be taken, and this project became one of the first case studies for developing the application of nex-cv internally. After intervention, automated response rate rose into the desirable s range and remained. The quality improvements were explained and implemented by an internal project manager, who pro-actively included client domain-expert users in explanations over calls and emails over what improvements were made and why. Initially, classes were trained with examples, with long tail of low-population classes. Following intervention, dataset grew by and, despite concept drift risk, did not deteriorate.
To use nex-cv, we aggregate the confusion matrix from the setting and rank how confused a pair of categories is. The most confused 2-3 pairs of classes are then the focus of conceptual, manual review in the dataset. Evaluation is performed again, producing a new ranking that guides the next 2-3 classes to focus on, until the metric falls below an acceptable threshold. There are other sources of classification error, but overlap between conceptually related pairs of classes accounts for most of the data quality problems we encounter in the datasets in practice, and are particularly understandable than other forms of error. This relatively simple approach is implemented as a Jupyter notebook accessible to non-developers (internal project managers).
The details of pairwise measures and acceptability threshold were developed iteratively based on project manager feedback. The project managers also honed processes and intuitions for communicating this information to clients effectively. In extreme situations as that shown in Fig. 4 the project managers made a presentation to get buy-in and implemented data quality improvements on their own. However, the typical practice now is to provide explanations, in calls and emails, of the “confusions” between one or few pairs of specific categories to the client. This practice builds awareness of data quality across stakeholders, and the domain-experts (recruiters) are better able to use the system to create the envisioned chatbot functionality without major intervention. As the number of projects grows, the metric can be used by project managers to monitor and prioritize data quality improvement tasks.
4.2 Metric is not Overly Optimistic
One of the practical motivations for a new metric was the sense that the existing metrics were too optimistic to be useful to improve chatbot behavior in response to overall qualitative feedback. As shown in Fig. 4, for example, the typical metric is more optimistic than nex-cv.
As an initial step of validating the metric, we applied it in the case of six under-performing datasets that required some intervention. Fig. 4 shows the differences in data abundance and classifier quality across these six pseudonymized snapshots. Internal QA staff gave the human rating scores by considering whether a question-answer pairs seemed reasonable: they could pick “yes” “no” and “can’t tell”; in most cases, the appropriateness was not ambiguous. As shown in Fig. 5, the human-rater estimate of quality is consistently more lenient than any of the automated measures. The Chatbot E in this case is the same project as shown in Fig. 4, prior to improvements.
Four of the six datasets analyzed had a very big difference between the human estimate of quality and the automated estimate, which, upon investigation, revealed that there were significant conceptual overlaps in the classes that the recruiters had trained, and the answers given. So, indeed, the classifier was making surprisingly adequate guesses, but which were very low-confidence. Following the intervention described in the previous section, which includes ongoing communication of any outstanding problems by project managers to recruiter teams, this type of error became rare and quickly-addressed.
4.3 Metric can be used for Internal and External Comparison
We used the nex-cv metric to help compare the performance of our classification component with two leading vendors for general-purpose chatbot development. Fig. 6 shows the comparison between jobpal and 2 leading vendors in the space. The three settings of the metric666Where are , , and , respectively, as differentiated in both Fig. 4 and Fig. 5. were aggregated to provide a plausible range of estimated performance. The range of accuracy was significantly higher for our domain-specific classifier, than those trained using general-purpose tools.
Aside from being useful to classify into known classes, the metric must account for fallback or escalation. This may be modeled as a separate class (as one of the external engines does with the “fallback” intent), or by relying on confidence scores from classifiers that produce measures of confidence (all engines provide some estimate of confidence that may be used). The “carefulness” score was included to represent how useful the confidence score is for deciding when to decline an answer: the number of incorrect guesses that were rejected due to too-low confidence scores divided by total no-answer-given cases (no guess or low-confidence guess).
Fig. 6 shows that the performance of our ML/NLP component on our domain-specific dataset is better than that of two popular general-purpose platforms, both in terms of classification accuracy, and rate of deferral due to low-confidence answers. This comparison mechanism validates our system relative to existing external services in a way that is interpretable by various internal stakeholders, not only the developer staff.
5 Conclusion
We described and validated the nex-cv metric, which is a modification of cross-validation that makes use of plausible negative examples from low-population classes in the datasets typical of our application area and domain.
Existing chatbot guidelines leave error handling to the designer: “transparency” is included as an important topic DialogFlow (2018), but, in practice, why something does not work, and under what conditions, can puzzle designers and developers, not just end-users. We presented on a metric that can be used by a variety of relevant stakeholders to understand, communicate, and improve text classifier performance by improving data quality.
In future work, we aim to explore other text classifier and chatbot evaluation strategies, keeping in mind the needs for understandability and transparency in this multi-stakeholder design process and maintenance practice.
References
- Abdul-Kader and Woods (2015) Sameera A Abdul-Kader and JC Woods. 2015. Survey on chatbot design techniques in speech conversation systems. International Journal of Advanced Computer Science and Applications, 6(7).
- Ali et al. (2018) Abdullah X Ali, Meredith Ringel Morris, and Jacob O Wobbrock. 2018. Crowdsourcing similarity judgments for agreement analysis in end-user elicitation studies. In The 31st Annual ACM Symposium on User Interface Software and Technology, pages 177–188. ACM.
- Arora et al. (2016) Sanjeev Arora, Yingyu Liang, and Tengyu Ma. 2016. A simple but tough-to-beat baseline for sentence embeddings.
- Bojanowski et al. (2016) Piotr Bojanowski, Edouard Grave, Armand Joulin, and Tomas Mikolov. 2016. Enriching word vectors with subword information. arXiv preprint arXiv:1607.04606.
- Canonico and De Russis (2018) Massimo Canonico and Luigi De Russis. 2018. A comparison and critique of natural language understanding tools. Cloud Computing 2018, page 120.
- DialogFlow (2018) DialogFlow. 2018. Dialogflow design guidelines. conversational components - error handling. designguidelines.withgoogle.com/ conversation/conversational-components/ errors.html. Accessed: 2018-09-02.
- Honnibal and Montani (2017) Matthew Honnibal and Ines Montani. 2017. spacy 2: Natural language understanding with bloom embeddings, convolutional neural networks and incremental parsing. To appear.
- Hung et al. (2009) Victor Hung, Miguel Elvir, Avelino Gonzalez, and Ronald DeMara. 2009. Towards a method for evaluating naturalness in conversational dialog systems. In Systems, Man and Cybernetics, 2009. SMC 2009. IEEE International Conference on, pages 1236–1241. IEEE.
- Jain et al. (2018) Mohit Jain, Pratyush Kumar, Ramachandra Kota, and Shwetak N Patel. 2018. Evaluating and informing the design of chatbots. In Proceedings of the 2018 on Designing Interactive Systems Conference 2018, pages 895–906. ACM.
- Kuksenok and Praß (2019) Kit Kuksenok and Nina Praß. 2019. Transparency in maintenance of recruitment chatbots. arXiv preprint arXiv:1905.03640.
- Kuligowska (2015) Karolina Kuligowska. 2015. Commercial chatbot: performance evaluation, usability metrics and quality standards of embodied conversational agents.
- Liu (2019) Ching-Ju Liu. 2019. Behind the screen: When do applicants approach you? https://jobpal.ai/en/blog/when-do-applicants-approach-you/. Accessed: 2019-05-01.
- Mishra and Jain (2016) Amit Mishra and Sanjay Kumar Jain. 2016. A survey on question answering systems with classification. Journal of King Saud University-Computer and Information Sciences, 28(3):345–361.
- Patel et al. (2008) Kayur Patel, James Fogarty, James A Landay, and Beverly L Harrison. 2008. Examining difficulties software developers encounter in the adoption of statistical machine learning. In AAAI, pages 1563–1566.
- Pedregosa et al. (2011) F. Pedregosa, G. Varoquaux, A. Gramfort, V. Michel, B. Thirion, O. Grisel, M. Blondel, P. Prettenhofer, R. Weiss, V. Dubourg, J. Vanderplas, A. Passos, D. Cournapeau, M. Brucher, M. Perrot, and E. Duchesnay. 2011. Scikit-learn: Machine learning in Python. Journal of Machine Learning Research, 12:2825–2830.
- Pereira and Díaz (2018) Juanan Pereira and Oscar Díaz. 2018. A quality analysis of facebook messenger’s most popular chatbots. In Proceedings of the 33rd Annual ACM Symposium on Applied Computing, pages 2144–2150. ACM.
- Porfirio et al. (2018) David Porfirio, Allison Sauppé, Aws Albarghouthi, and Bilge Mutlu. 2018. Authoring and verifying human-robot interactions. In The 31st Annual ACM Symposium on User Interface Software and Technology, pages 75–86. ACM.
- Ribeiro et al. (2016) Marco Tulio Ribeiro, Sameer Singh, and Carlos Guestrin. 2016. Why should i trust you?: Explaining the predictions of any classifier. In Proceedings of the 22nd ACM SIGKDD international conference on knowledge discovery and data mining, pages 1135–1144. ACM.
- Serban et al. (2015) Iulian Vlad Serban, Ryan Lowe, Peter Henderson, Laurent Charlin, and Joelle Pineau. 2015. A survey of available corpora for building data-driven dialogue systems. arXiv preprint arXiv:1512.05742.
- Zhang et al. (2019) Jiawei Zhang, Yang Wang, Piero Molino, Lezhi Li, and David S Ebert. 2019. Manifold: A model-agnostic framework for interpretation and diagnosis of machine learning models. IEEE transactions on visualization and computer graphics, 25(1):364–373.