The Evolution of the Interstellar Medium in Post-Starburst Galaxies
Abstract
We derive dust masses (Mdust) from the spectral energy distributions of 58 post-starburst galaxies (PSBs). There is an anticorrelation between specific dust mass (Mdust/M⋆) and the time elapsed since the starburst ended, indicating that dust was either destroyed, expelled, or rendered undetectable over the 1 Gyr after the burst. The Mdust/M⋆ depletion timescale, 205 Myr, is consistent with that of the CO-traced M/M⋆, suggesting that dust and gas are altered via the same process. Extrapolating these trends leads to the Mdust/M⋆ and M/M⋆ values of early-type galaxies (ETGs) within 1-2 Gyr, a timescale consistent with the evolution of other PSB properties into ETGs. Comparing Mdust and M for PSBs yields a calibration, log = 0.45 log + 6.02, that allows us to place 33 PSBs on the Kennicutt-Schmidt (KS) plane, . Over the first 200-300 Myr, the PSBs evolve down and off of the KS relation, as their star formation rate (SFR) decreases more rapidly than M. Afterwards, continues to decline whereas the SFR levels off. These trends suggest that the star-formation efficiency bottoms out at 10 and will rise to ETG levels within 0.5-1.1 Gyr afterwards. The SFR decline after the burst is likely due to the absence of gas denser than the CO-traced H2. The mechanism of the Mdust/M⋆ and M/M⋆ decline, whose timescale suggests active galactic nucleus (AGN) or low-ionization nuclear emission-line region (LINER) feedback, may also be preventing the large CO-traced molecular gas reservoirs from collapsing and forming denser star forming clouds.
1 Introduction
Lying in the ‘green valley’ (Wong et al., 2012) of the galaxy color-magnitude diagram, post-starburst (PSB) galaxies (Dressler & Gunn, 1983) is a transitioning phase between star-forming spirals and gas-poor quiescent galaxies (Yang et al. 2004, 2008, and references therein). The absence of significant nebular emission lines (e.g., [O II], H) is indicative of little-to-no ongoing star formation. However, the presence of strong Balmer absorption reveals young and recently formed A-stars (Dressler & Gunn, 1983; Couch & Sharples, 1987). These signatures indicate a recent starburst within the last Gyr. Although PSBs are a rare species at almost all redshifts (1% by z 0.5, Wild et al. 2016), the shortness of the PSB phase suggests that a large fraction (25-40%) of field galaxies at z 1 may have passed through it (Zabludoff et al. 1996; Tran et al. 2004; Snyder et al. 2011). Thus, PSBs are important to understanding the evolutionary path from star-forming galaxies to early-type galaxies (ETGs).
Over the past decade, many attempts have been made to study the interstellar medium (ISM) properties of PSBs. The existence of atomic gas (HI) has been confirmed in several small samples of PSBs (e.g., Chang et al. 2001; Buyle et al. 2006; Zwaan et al. 2013). Recent work has also revealed the existence of large molecular gas (H2) reservoirs in PSBs (e.g., French et al. 2015; Rowlands et al. 2015). French et al. (2018a) even discovered that the CO-traced H2 declines with post-burst age over a timescale that would lead to ETG levels in 0.7-1.5 Gyr. However, as obtaining gas masses requires large amounts of radio telescope time, these studies are limited to small sample sizes. Alternatively, dust mass (Mdust) can be used to track the ISM evolution for a larger sample of PSBs, as it is more easily measured, i.e., by fitting the galaxy’s spectral energy distributions (SED) over mid-infrared (MIR) to far-infrared (FIR) wavelengths. Archival data are now available for a statistically significant PSB sample, making it possible to calibrate the relation between Mdust and CO-traced M for the first time, as well as to examine the evolution of Mdust over a wide range of post-burst ages.
Smercina et al. (2018) derived Mdust for 33 PSBs with CO detections from French et al. (2015) and investigated the evolution of their ISM properties in detail. In contrast, here we search all available archival IR data for three large PSB samples from French et al. (2018a), Alatalo et al. (2016a), and Rowlands et al. (2015) and derive Mdust for those 58 PSBs with sufficient IR data. Thus, we study the evolution of Mdust with a larger sample size and a wider age baseline.
As Kennicutt (1998) points out, there is a universal correlation between the surface density of gas and star formation rate (SFR) for local normal star-forming galaxies and starburst galaxies (the Kennicutt-Schmidt relation, or the KS relation). For a sample of PSBs, French et al. (2015) observed a significant offset from the KS relation. But what is the evolutionary track for PSBs in the KS plane? The tight correlation between gas and dust that we observe here makes it possible for us to map this evolution for the first time and to connect it to changes in the star formation efficiency (SFE).
In this paper, we derive Mdust for 58 PSBs by performing ultraviolet (UV) to FIR SED fitting. We study the evolution of Mdust and SFE after the burst ends. We also investigate the dust-derived KS relation. In Section 2, we summarize our PSB sample selection criteria. In Section 3, we describe the archival fluxes and errors used to construct full SED of our sample. In Section 4, we discuss the CIGALE-based (Code Investigating GALaxy Emission; Noll et al. 2009; Boquien et al. 2019) SED fitting procedure and present the results. In Section 5, we consider the evolution of Mdust, the position on the KS plane, and the SFE of our PSB sample. Section 6 lists our conclusions. Throughout this paper we adopt a flat CDM cosmology with = 0.308, = 0.692, and = 67.8 km s-1 Mpc-1 (Planck Collaboration et al., 2016).
2 Sample Selection
In this work, we combine three well-studied PSB samples from French et al. (2018a), Alatalo et al. (2016a), and Rowlands et al. (2015) to make the time baseline since the starburst ends as wide as possible. Our combined PSB sample ranges in post-burst age from -100 to 800 Myr, which enables us to sample any significant trends. The general idea of constructing PSB samples is requiring strong Balmer absorption lines (suggesting recent starbursts), and weak nebular emission (indicating little ongoing star formation). Specifically, French et al. (2018a) use H - (H) 4 Å (where (H) is the measurement error of the H index) and H rest-frame equivalent width, EW(H) 3 Å as their selection criteria, which yield a sample of real post-starburst galaxies. Alatalo et al. (2016a) allow for emission lines from shocks and use H Å after emission-line correction; as this emission also may arise from star formation, their sample could still have ongoing starbursts. These objects turn out to be at earlier PSB stages, while some even have negative post-burst ages, signifying an ongoing burst (French et al., 2018a). Thus, they serve as crucial links between the cessation of the recent burst and the subsequent decline in star formation. Rowlands et al. (2015) use a Principal Component Analysis (PCA) technique at 3175 – 4150 Å, which essentially requires strong Balmer absorption and weak 4000 Å break strength; such a selection focuses on young stellar ages and thus, like the Alatalo et al. (2016a) sample, includes transitioning galaxies from a starbursting to PSB phase.
One of the primary goals of our work here is to derive Mdust. As previous studies have shown that FIR (40m) photometry is crucial (da Cunha et al., 2008; Dale et al., 2012), we define our sample as those galaxies among the aforementioned three samples of PSBs with archival FIR data. In addition to utilizing the processed WISE and Herschel data from Smercina et al. (2018) for 33 PSBs from French et al. (2015), we searched for Herschel observations of other galaxies in these three samples in the PACS Point Source Catalog (Marton et al., 2017) and SPIRE Point Source Catalog (Schulz et al., 2017), available at the NASA/IPAC Infrared Science Archive (IRSA)111http://irsa.ipac.caltech.edu/.. As a result, 37 PSBs from French et al. (2018a), 12 PSBs from Alatalo et al. (2016a), and 11 PSBs from Rowlands et al. (2015) have detections in 3 Herschel bands222We will justify the necessity of using at least three Herschel bands in Appendix A., constituting our final sample of 58 PSBs in total333Two objects (R8/A11 and R11/A12) are in both the Alatalo et al. (2016a) and Rowlands et al. (2015) samples, and we refer to them as A11 and A12 in this paper.. The 37 PSBs from French et al. (2018a) are labeled EAH01-EAH18 and EAS01-EAS15, consistent with the nomenclature in French et al. (2015) and Smercina et al. (2018), and F34-F37, for those without previous names. Their redshifts are 0.02 z 0.11. The 12 PSBs from Alatalo et al. (2016a) are A1-A12, with 0.02 z 0.18. The 11 PSBs from Rowlands et al. (2015) are R1-R11, with 0.03 z 0.05.
3 Multiwavelength Data
We establish UV to FIR SEDs for our PSB sample. We incorporate the processed WISE and Herschel data from Smercina et al. (2018) for 33 PSBs from French et al. (2015) and compile other data from different catalogs. In addition to compiling the Herschel data from PACS/SPIRE Point Source Catalogs, we utilize the archival photometric data from GALEX, SDSS, 2MASS, and WISE. We have also calculated the flux uncertainties by combining in quadrature the cataloged measurement uncertainties with different systematic uncertainties in each band, which are described individually in the following paragraphs.
For GALEX data, we search for NUV and FUV detections from the GALEX All-Sky Survey Source Catalog (GASC) and the Medium Imaging Survey Catalog (GMSC)444http://galex.stsci.edu/galexview/.. We use the mag_FUV and mag_NUV magnitudes, which should be representative of the total galaxy flux. We further add zero-point calibration errors of 0.052 and 0.026 mag to the FUV and NUV photometry errors, respectively (Morrissey et al., 2007).
For SDSS data, we search for ugriz photometry in the Photoobjall catalog of the SDSS 14th Data Release (DR14, Abolfathi et al. 2018). We adopt the modelmag magnitudes, as they provide reliable colors and represent the total light of our sources555http://www.sdss.org/dr14/algorithms/magnitudes/.. To ensure all the magnitudes are on the AB system, we add -0.04 to measured u-band magnitudes and 0.02 to z-band magnitudes666http://www.sdss.org/dr14/algorithms/fluxcal/.. Zero-point calibration errors of 5%, 2%, 2%, 2%, and 3% are added to the photometry errors of ugriz bands, respectively (Blanton & Roweis, 2007).
For 2MASS data, we search for JHKs photometry from the 2MASS Point Source Catalog (PSC; Skrutskie et al. 2006) and Extended Source Catalog (XSC; Jarrett et al. 2000). If the source is cataloged in PSC, we adopt the standard aperture, which is measured in a 4 radius aperture, but has already been corrected to an infinite aperture. If the source is cataloged in XSC, we choose the extrapolated total magnitude x_m_ext, which should represent the total flux777https://www.ipac.caltech.edu/2mass/releases/allsky/doc/sec4_5e.html.. We convolve a 5% calibration error (Dale et al., 2009) with the photometry error in quadrature.
For WISE data, we search for W1-W4 photometry in the ALLWISE Source Catalog (Mainzer et al., 2011). We use the magnitudes measured with profile-fitting photometry (wxmpro) for point sources (defined with ext_flg = 0). For extended sources (ext_flg 0), we follow the instructions from the WISE official website888http://wise2.ipac.caltech.edu/docs/release/allsky/faq.html.: when ext_flg = 5, we adopt the wxgmag measured with an elliptical aperture; when 0 ext_flg 5, we choose the circular aperture magnitude that best matches the extrapolated total radius r_ext provided in 2MASS. We correct zero-point errors by adding 0.03, 0.04, 0.03, and -0.03 mag to the measured WISE W1-W4 bands, respectively (Jarrett et al., 2012). We add an overall 6% calibration error for the W1-W4 bands to the photometry error (Cutri et al., 2015).
For Herschel data, we adopt the quantity flux from the PACS/SPIRE Point Source Catalogs. The PACS flux uncertainties are derived by convolving the snrnoise (including sky confusion and instrumental error) and the background rms. The SPIRE ‘total’ flux uncertainties flux_err include instrumental noise and background confusion noise. We add a 7% calibration error to the PACS and SPIRE flux uncertainties (Ciesla et al., 2012; Balog et al., 2014).
All the data are presented in Tables 2 and 3. We do not apply any correction for Galactic extinction, because it is only nonnegligible for several sources and only affects the UV and optical data, which do not affect (see Appendix B). To characterize the amount of internal extinction, we have incorporated the Calzetti et al. (2000) law into our SED fitting (Section 4.1).
4 SED Fitting
In this work, we perform UV-FIR SED fitting on our sample using CIGALE (Code Investigating GALaxy Emission; Noll et al. 2009). Below we provide a detailed description of our SED fitting procedure in terms of the models and input priors, and present our fitting results.
4.1 Models
For galaxy SED fitting, in general, CIGALE requires four models in total, which describe the star-formation history (SFH), stellar populations, dust emission, and dust extinction, respectively. We do not use CIGALE’s default nebular emission model, as our sources do not exhibit strong nebular emission lines.
For SFH, we use two types of models: one or two exponentially declining recent bursts, with a main stellar population formed earlier (French et al., 2018a). We refer to these two kinds of models as ‘single-burst’ or ‘double-burst’ models hereafter. The common free parameters in both models are:
(1) e-folding time of the main stellar population, ;
(2) e-folding time of the most recent starburst population, ;
(3) mass fraction of the recent burst(s) relative to the total stellar mass, ;
(4) age of the main stellar population (the time elapsed since it formed), ;
(5) age of the most recent burst (the time elapsed since it started), .
An additional free parameter, , is set in the double-burst model. It describes the time separation between the two recent bursts.
For stellar populations, we incorporate the BC03 (Bruzual & Charlot, 2003) model assuming a Chabrier (2003) initial mass function (IMF). For dust emission, we choose the DL07 (Draine & Li, 2007) model. For dust extinction, we use the Calzetti et al. (2000) law to model the internal extinction of our sources.
4.2 Input Priors
All of the input priors are summarized in Table 1. The prior values given are the allowed discrete values for CIGALE. For SFH, we refer to French et al. (2018a) for the number of recent bursts inferred for each galaxy. We give fairly large prior ranges for , , , , , and to enlarge the parameter space.
For the BC03 model, we offer a range of three metallicities closest to that inferred from the mass-metallicity relation for each object. The stellar masses come from the SDSS MPA-JHU catalogs (Brinchmann et al. 2004; Tremonti et al. 2004). The mass-metallicity relation is from Gallazzi et al. (2005).
For the DL07 model, the mass fraction of PAH, qPAH, is allowed to vary from 0.47 to 4.58. The discrete values in Table 1 come directly from Draine & Li (2007). The prior range of the minimum radiation field (Umin) is set to [0.1, 25.0]. The fraction illuminated from Umin to Umax () is allowed to vary between [0.0001, 0.1]. We fix the maximum radiation field (Umax) to be 106.
For the dust extinction model, we follow the default setting in CIGALE, which assumes that the stars younger than 10 Myr are subject to more extinction than the stars older than 10 Myr. We allow the color excess of the stellar continuum light for the young population, E(B–V)young, to vary from 0.01 to 2. As the majority of our sample have E(B–V)young 0.1, we input six evenly distributed prior values from 0.1 to 2, and two values from 0.01 to 0.05. The reduction factor for the color excess of the old population compared to the young one, , is allowed to vary from 0.3 to 1. We do not add any UV bump or power law to the original Calzetti et al. (2000) law.
| Model | Parameter | Symbol | Prior Values |
|---|---|---|---|
| (1) | (2) | (3) | (4) |
| SFH | e-folding time of the main stellar population | 1.0, 2.0, 3.0 Gyr | |
| e-folding time of the recent burst | single-burst: 25, 50, 100, 200, 500 Myr double-burst: 25 Myr | ||
| Mass fraction of the recent burst(s) | 0.01, 0.05, 0.1, 0.3, 0.5, 0.7, 0.9 | ||
| Age of the main stellar population | 6.0, 9.0, 11.0 Gyr | ||
| Age of the most recent burst | 30, 100, 200, 500, 1000, 1500, 2000 Myr | ||
| Separation between two recent bursts | double-burst: 100, 300, 500, 800, 1000 Myr | ||
| BC03 | Metallicity | [Fe/H] | 3 values inferred from Gallazzi et al. (2005) |
| DL07 | Mass fraction of PAH | 0.47, 1.12, 1.77, 2.50, 3.19, 4.58 | |
| Minimum radiation field | 0.10, 0.50, 1.00, 2.50, 5.0, 10.0, 25.0 | ||
| Maximum radiation field | 106 | ||
| Dust fraction illuminated from Umin to Umax | 0.0001, 0.001, 0.01, 0.05, 0.1 | ||
| Power-law slope dU/dM Uα | 2.0 | ||
| Dust extinction | Color excess of stellar continuum light for young stars | E(B – V)young | 0.01, 0.05, 0.1, 0.4, 0.7, 1, 1.5, 2.0 |
| Reduction factor for E(B – V) of old stars to young stars | 0.3, 0.5, 0.8, 1.0 |
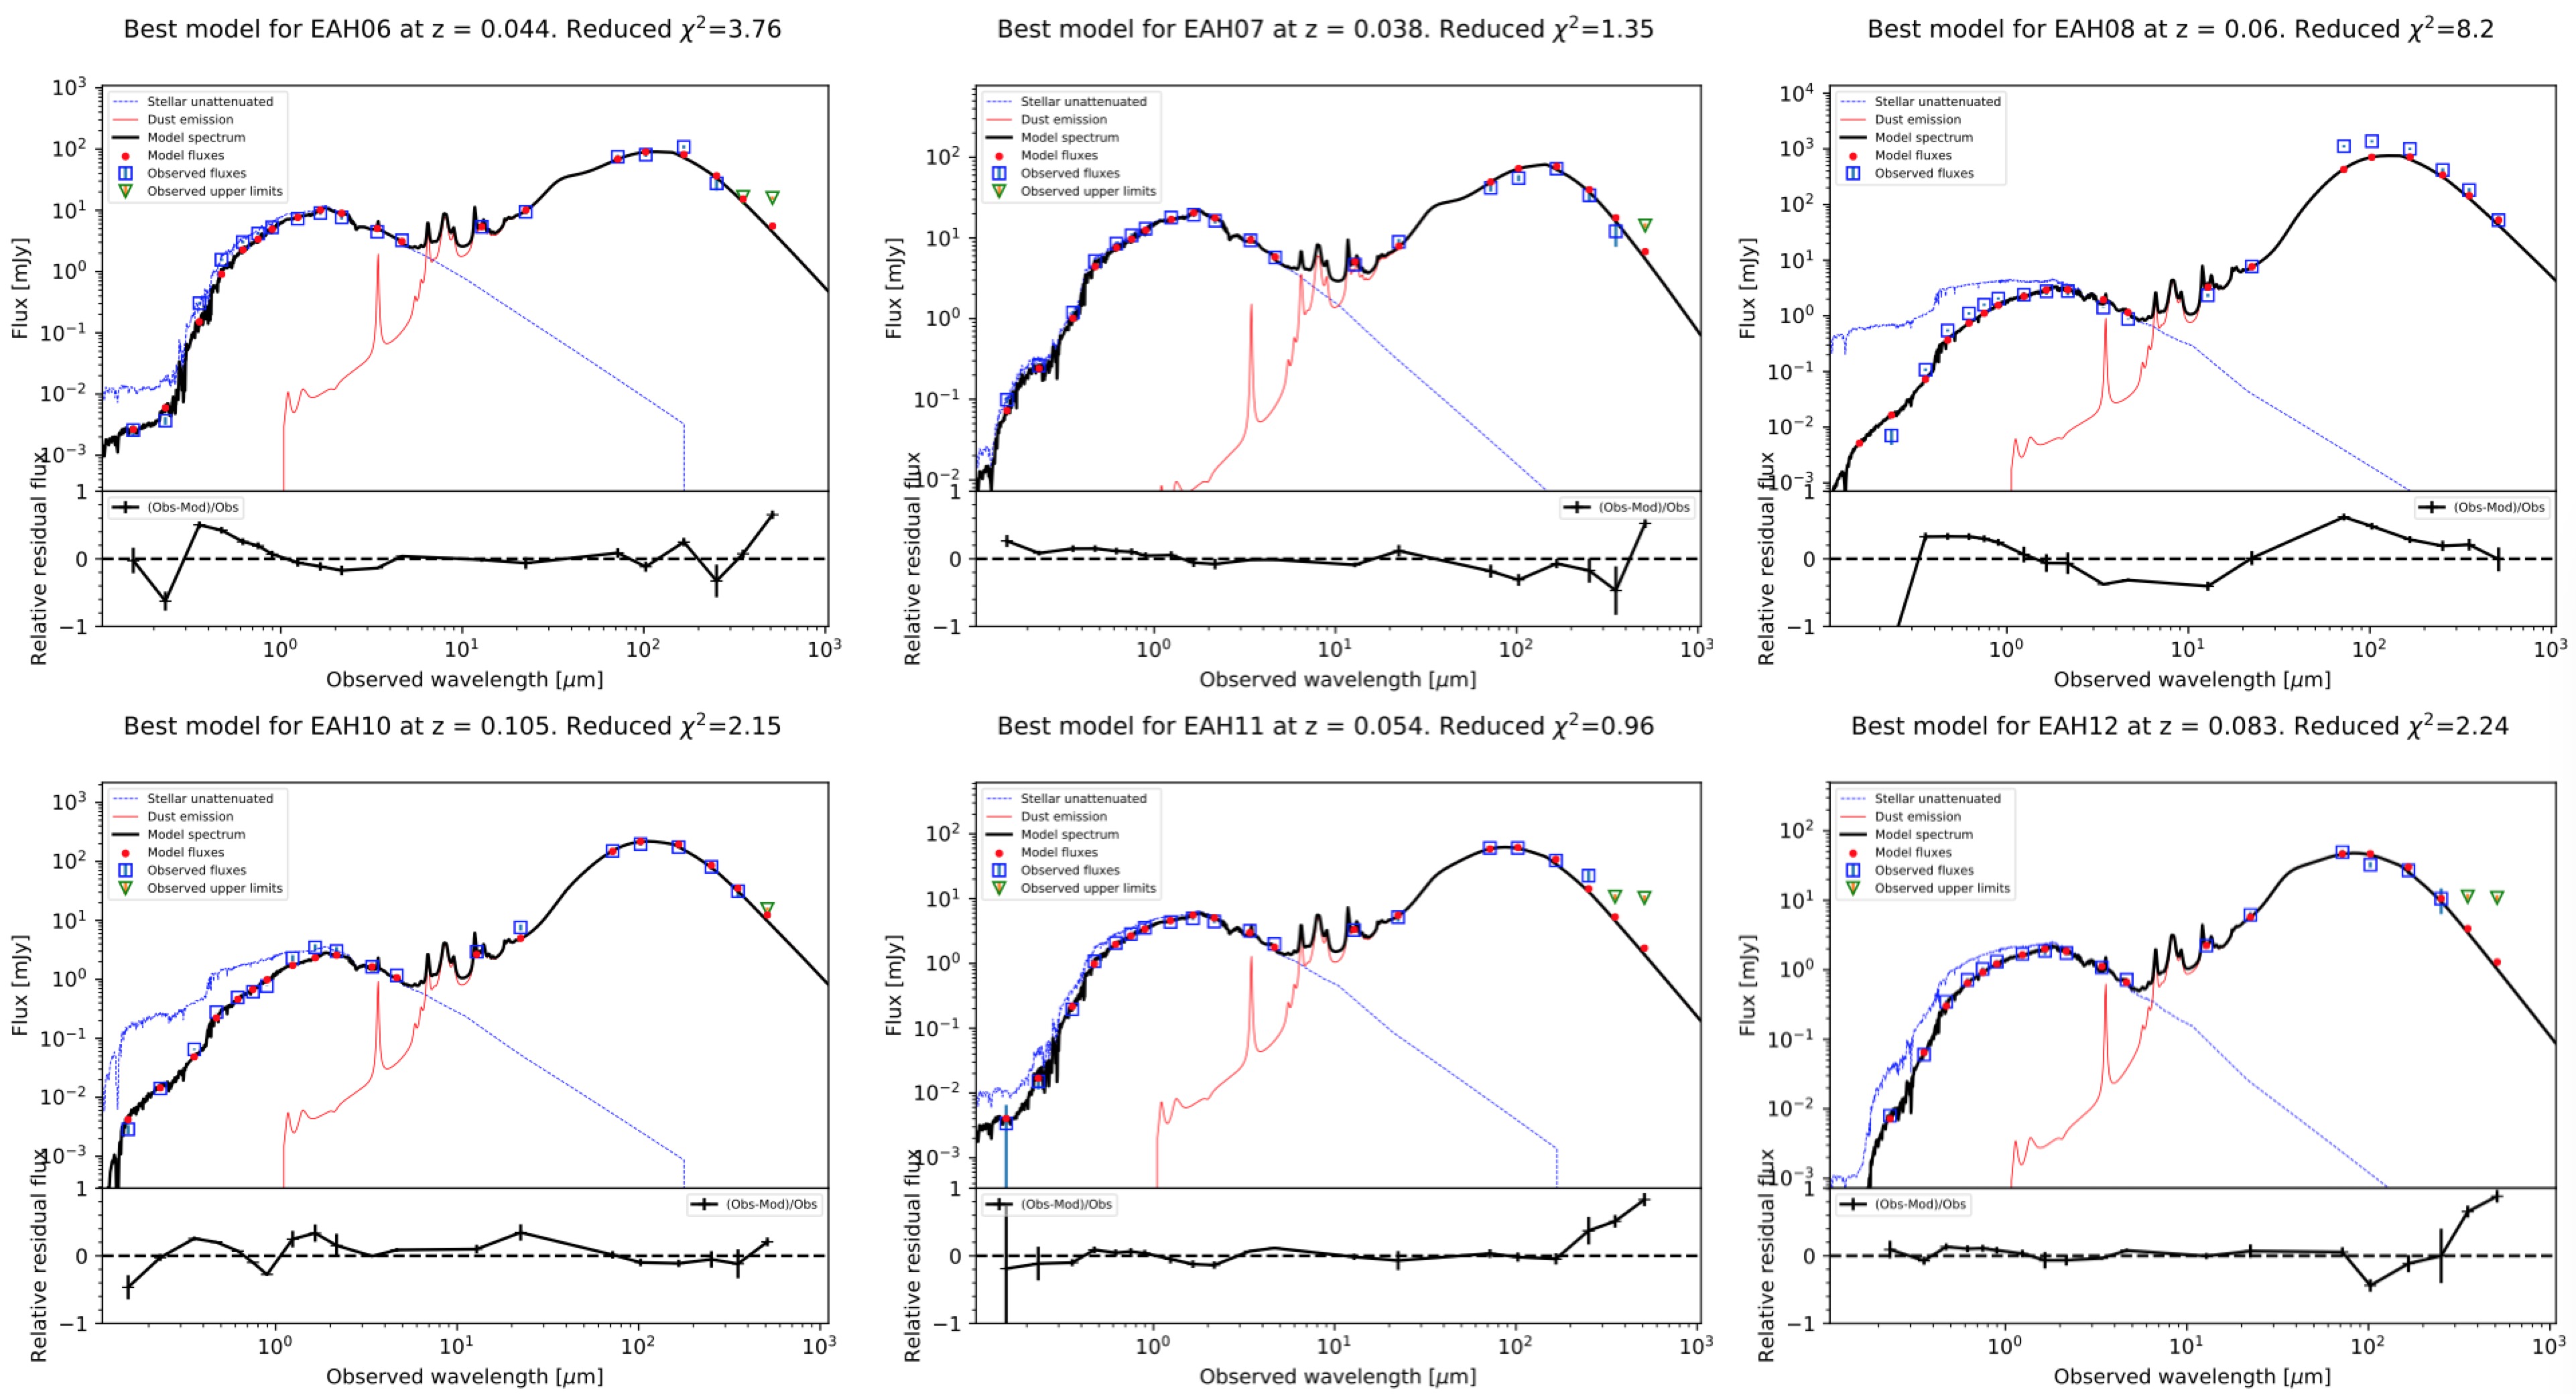
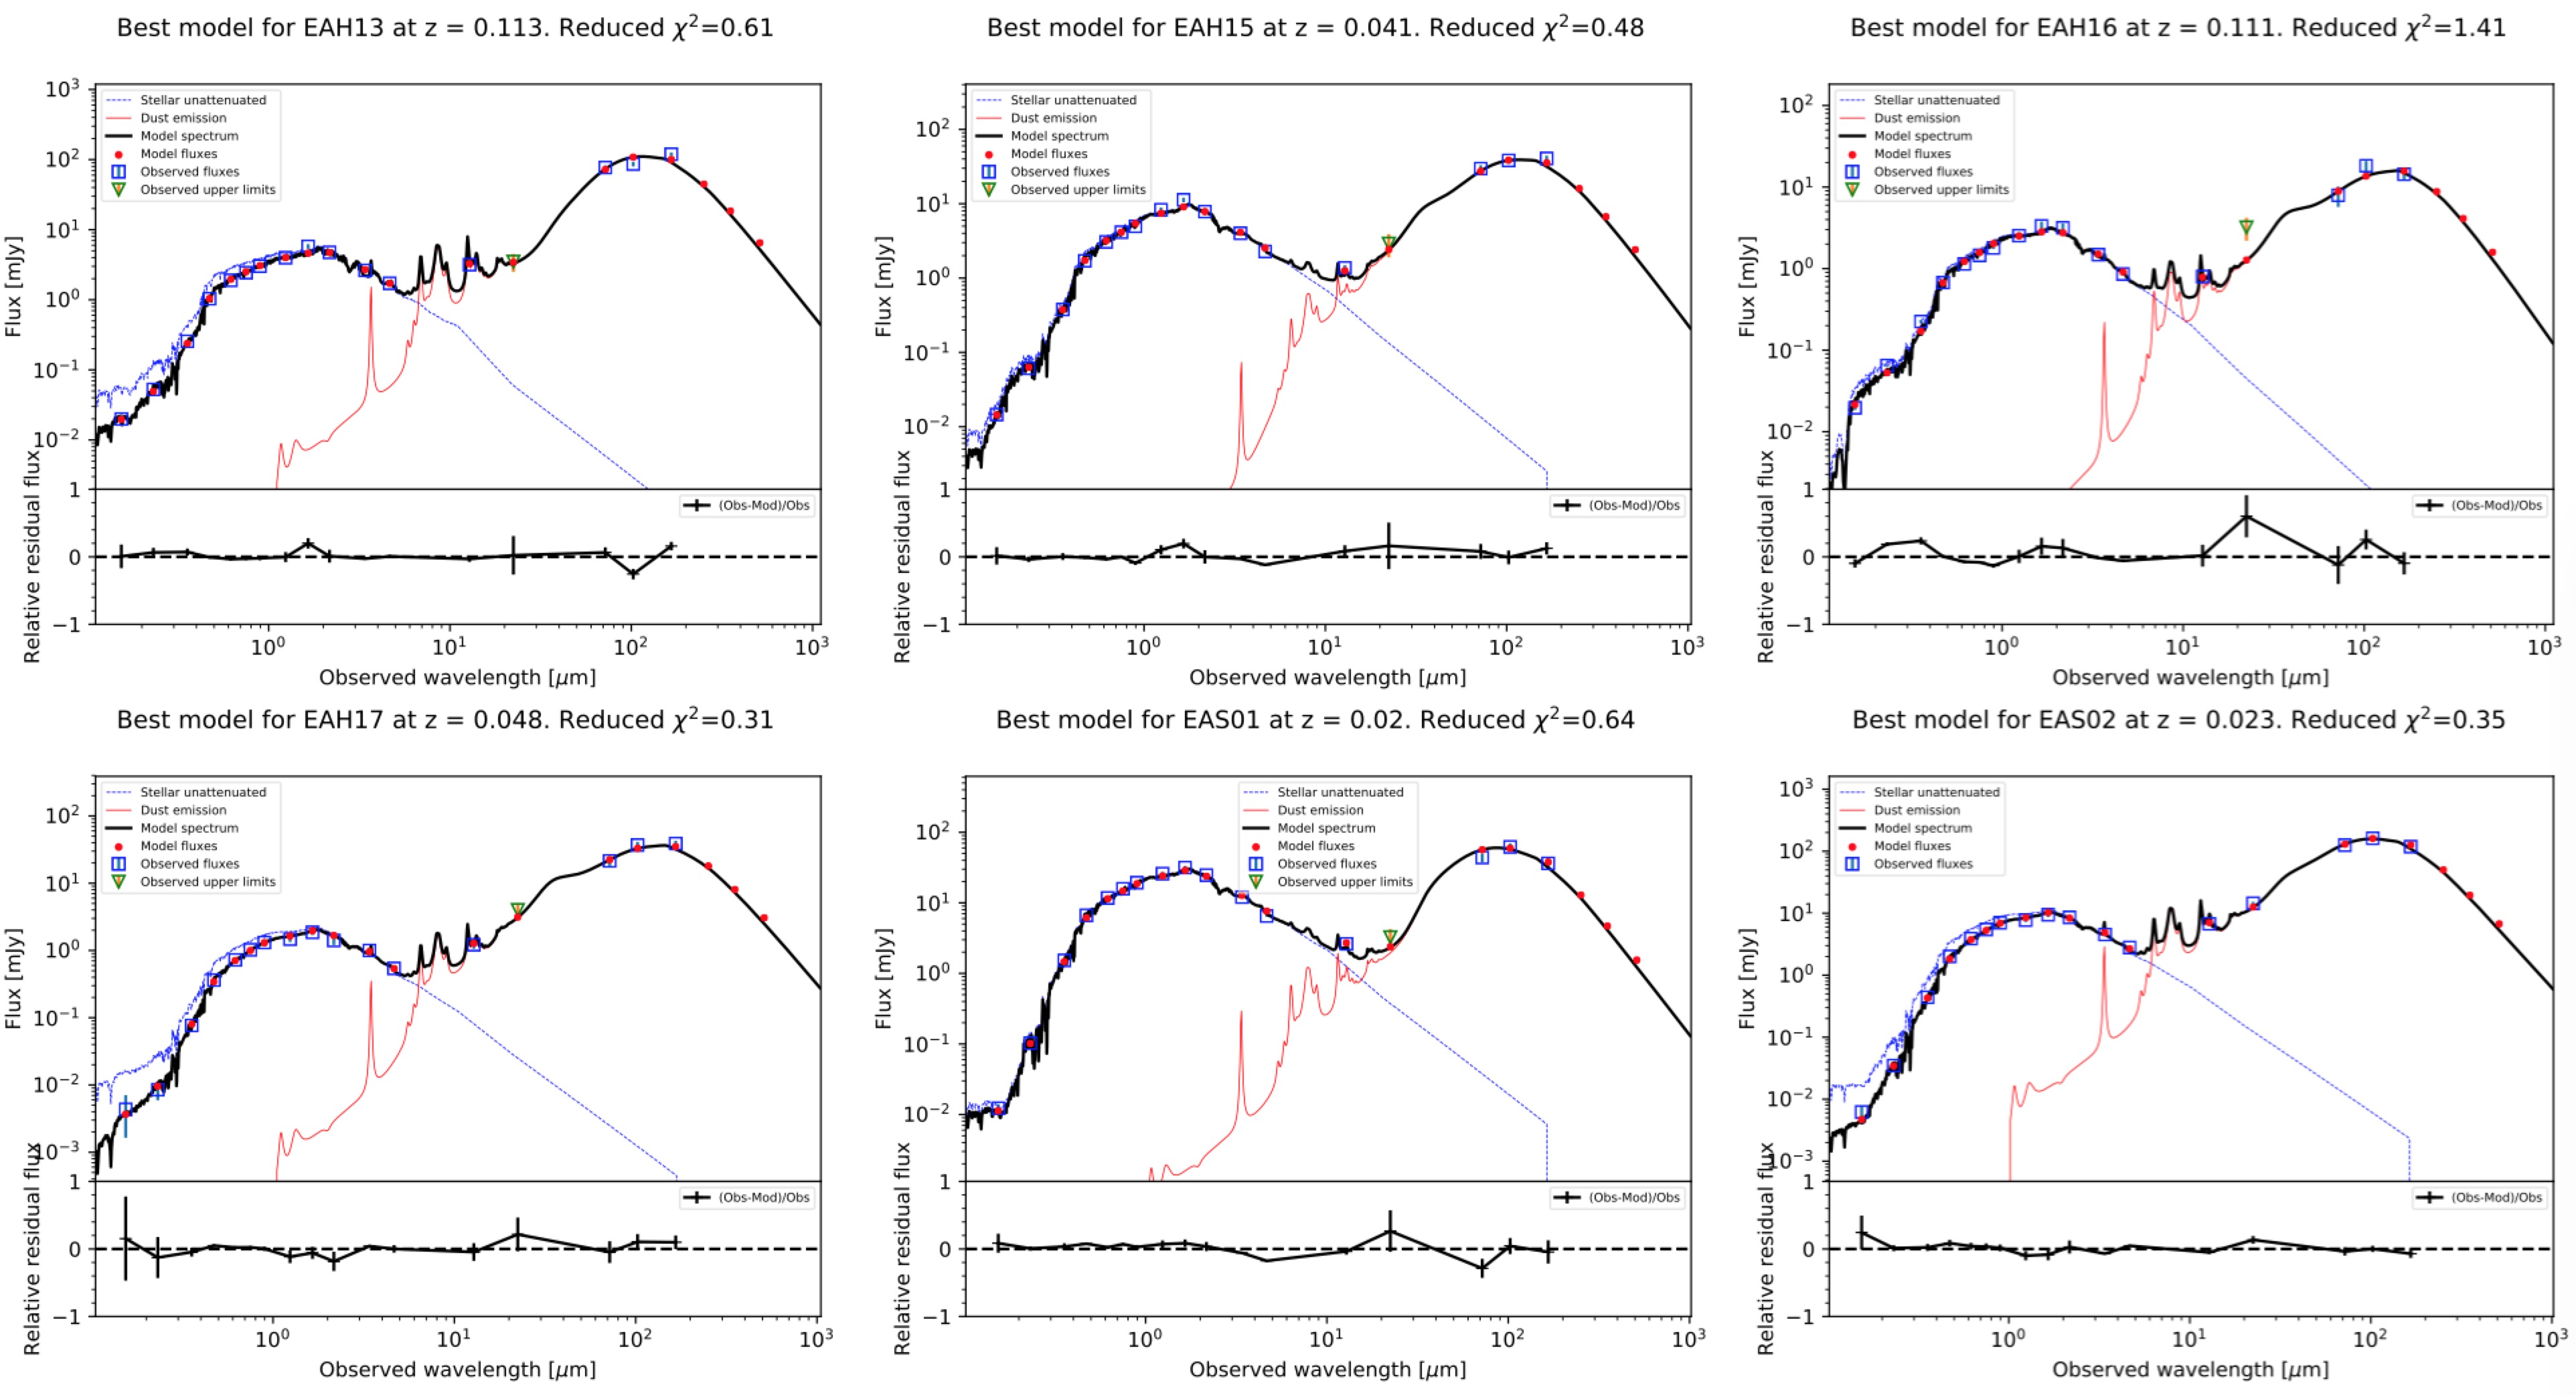
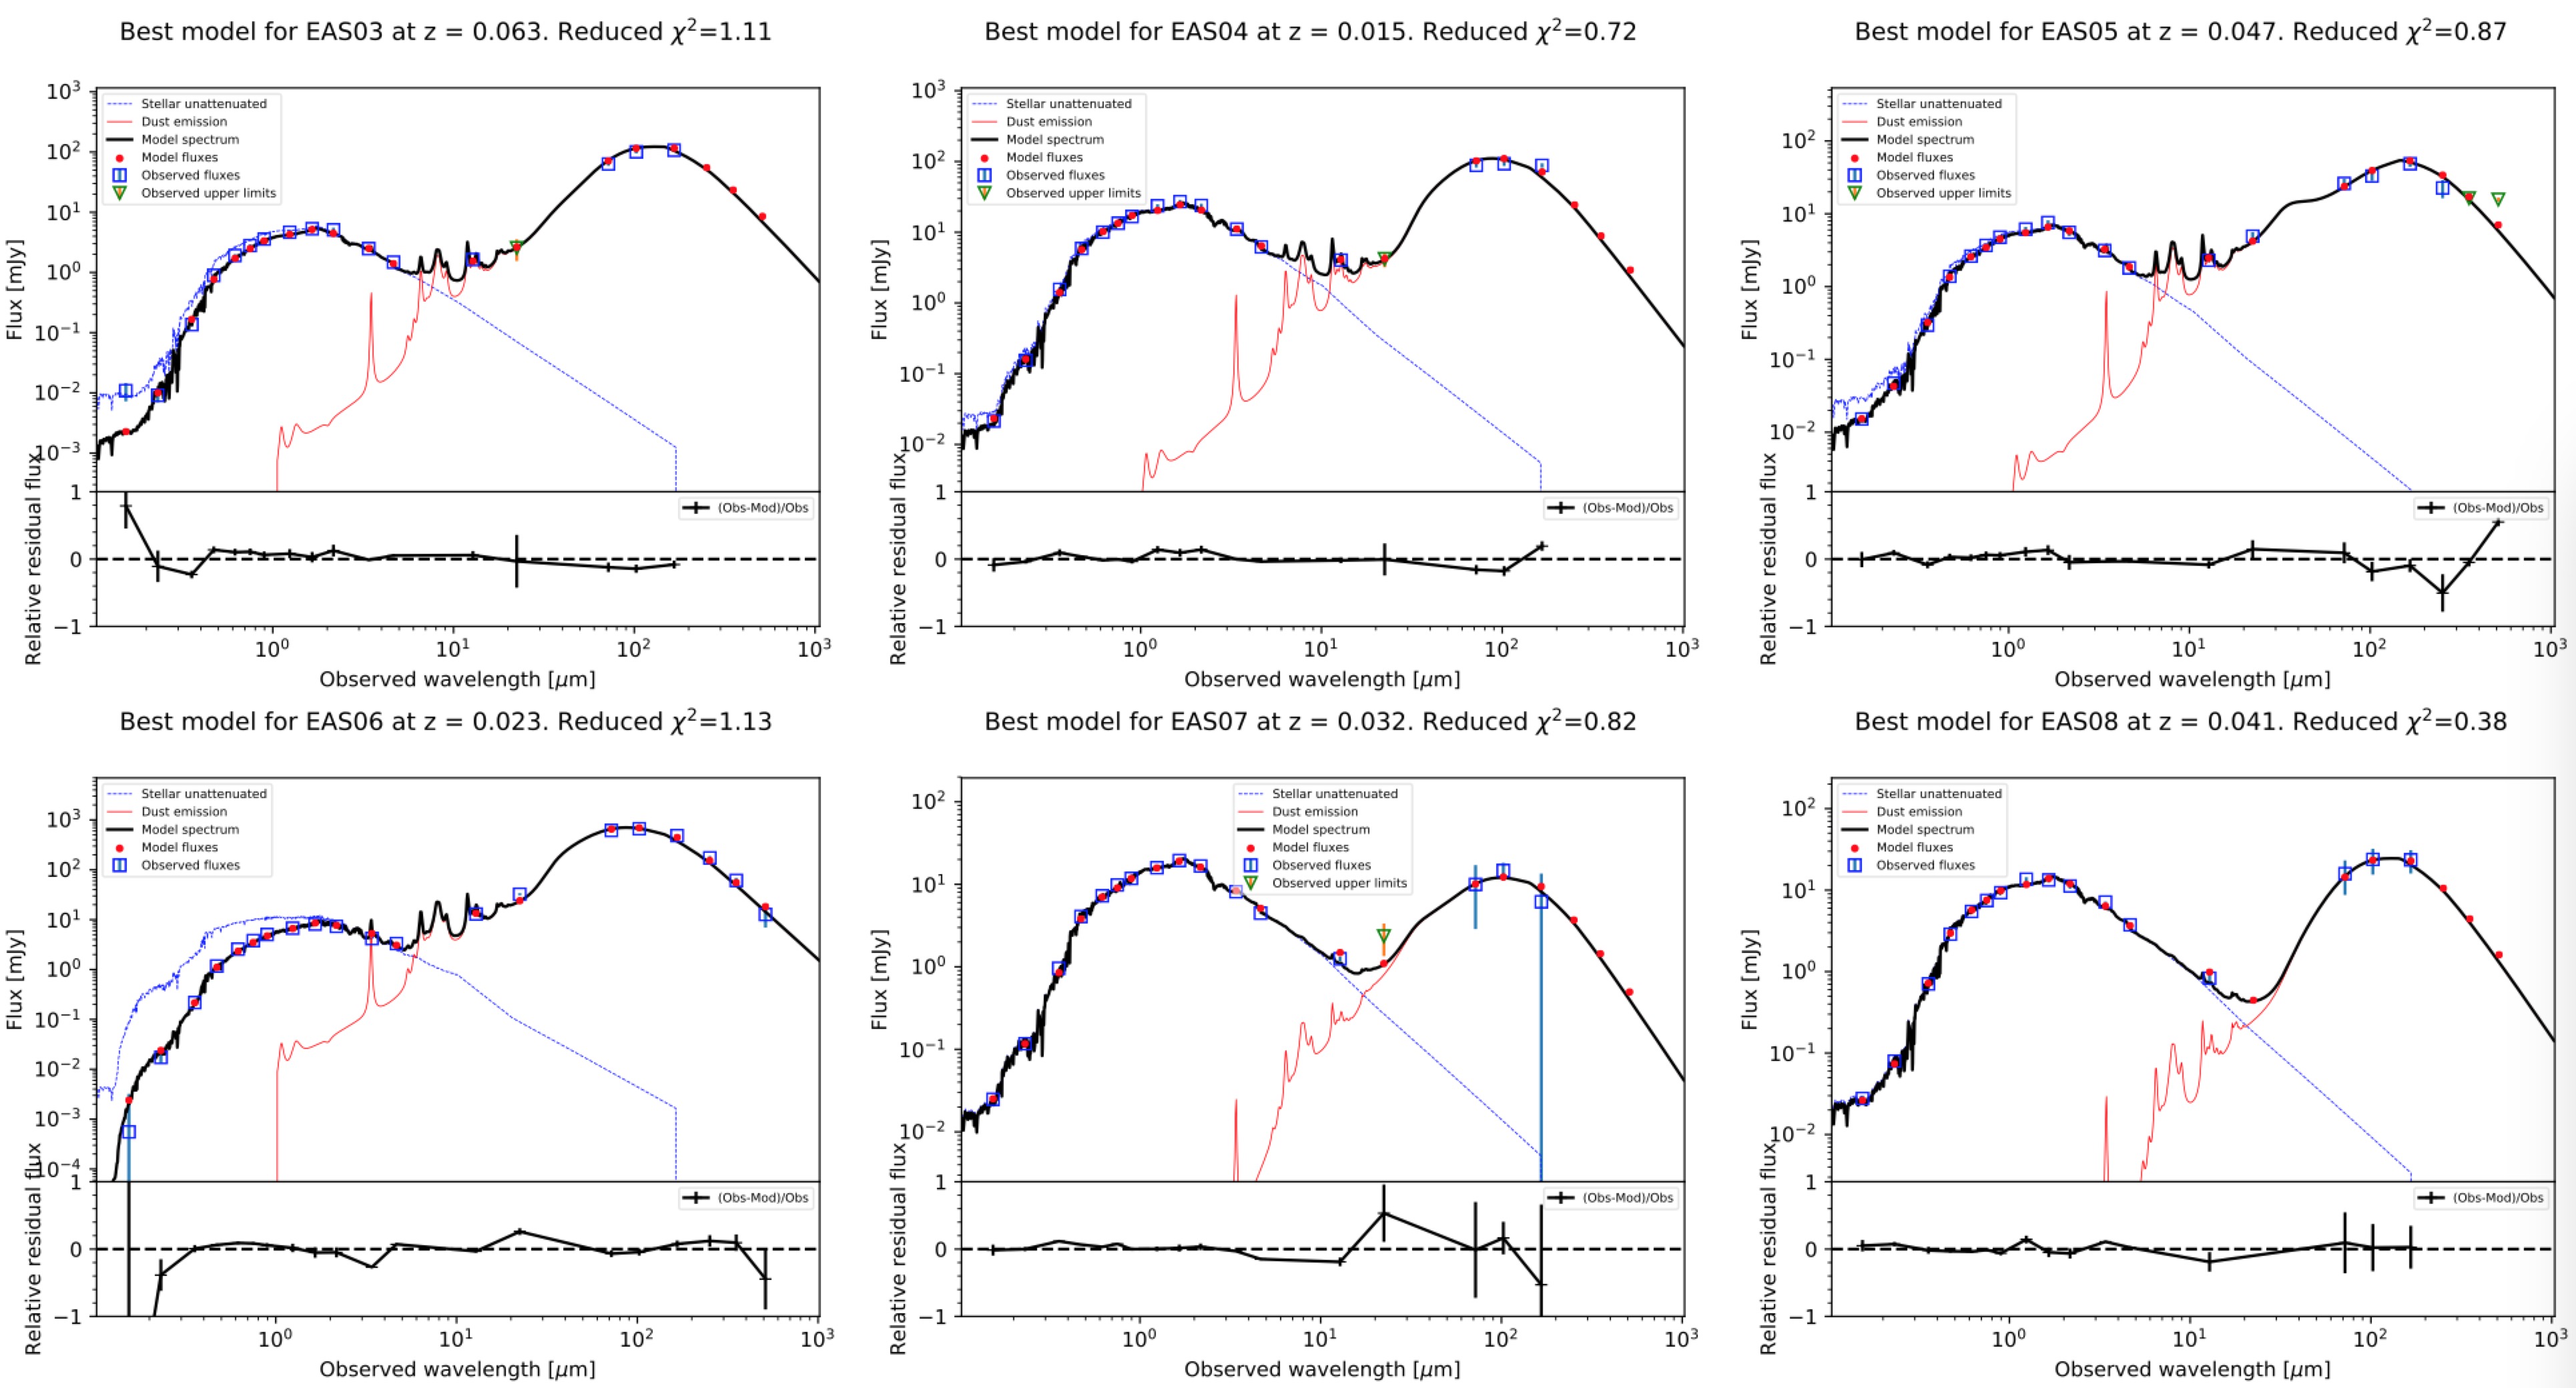
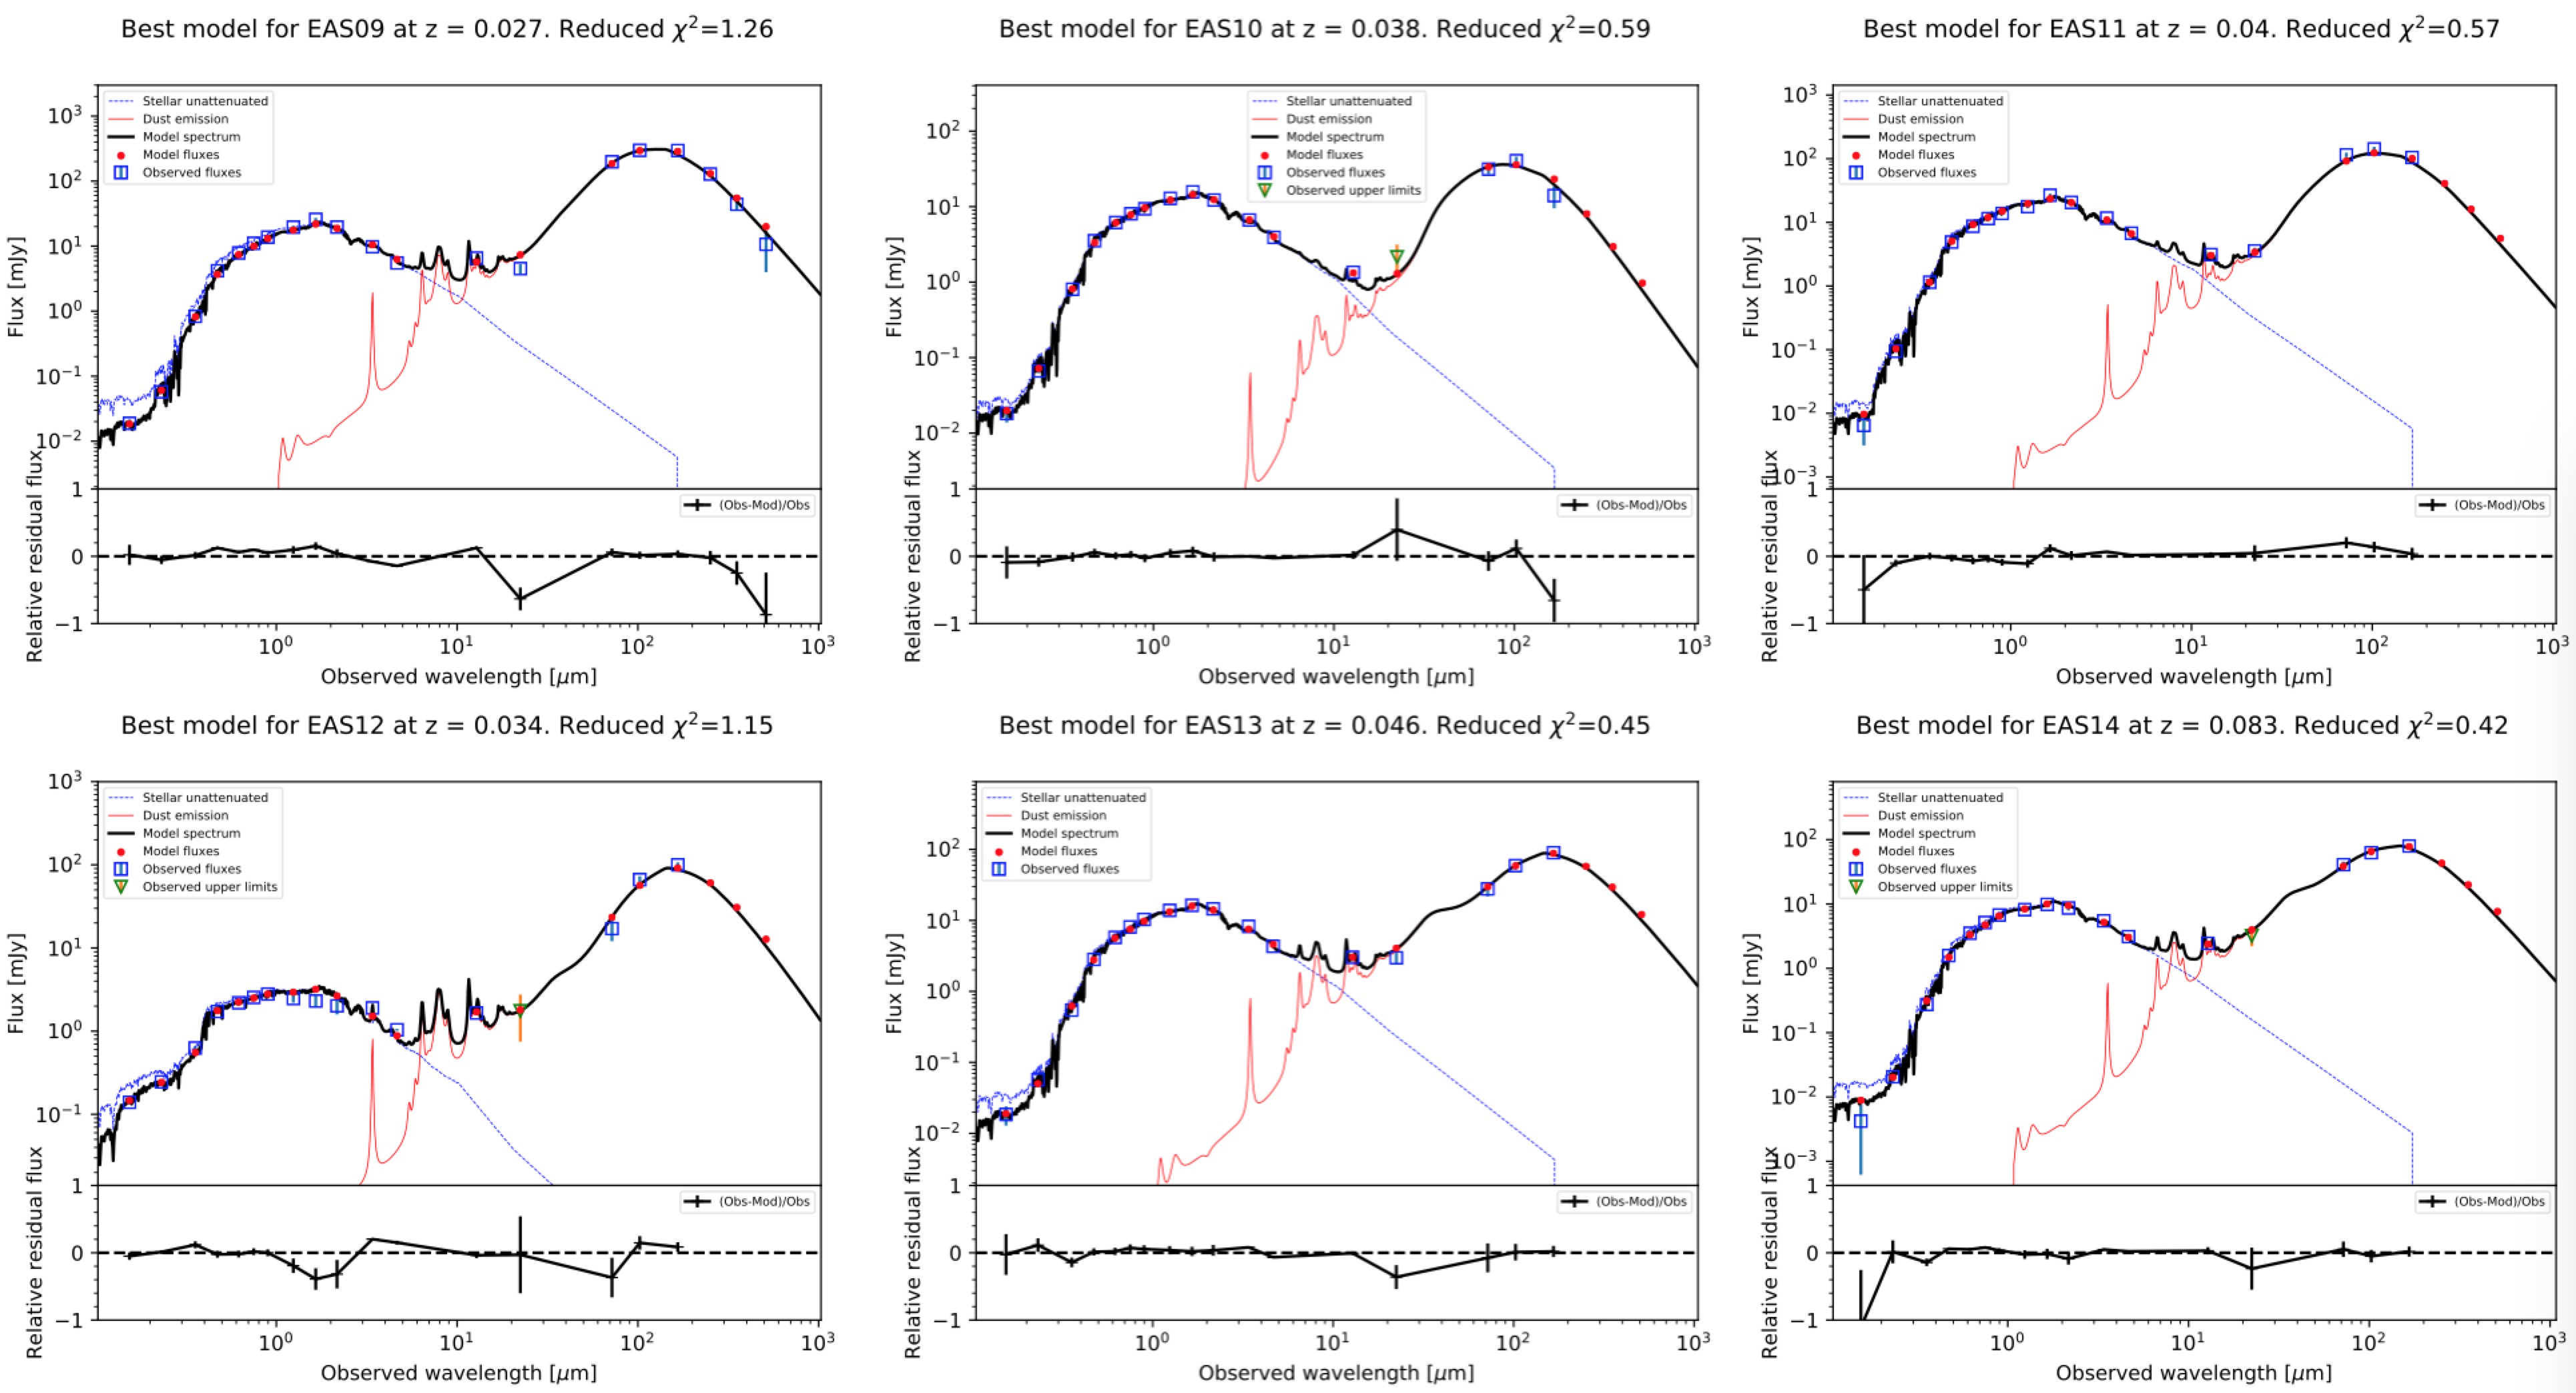
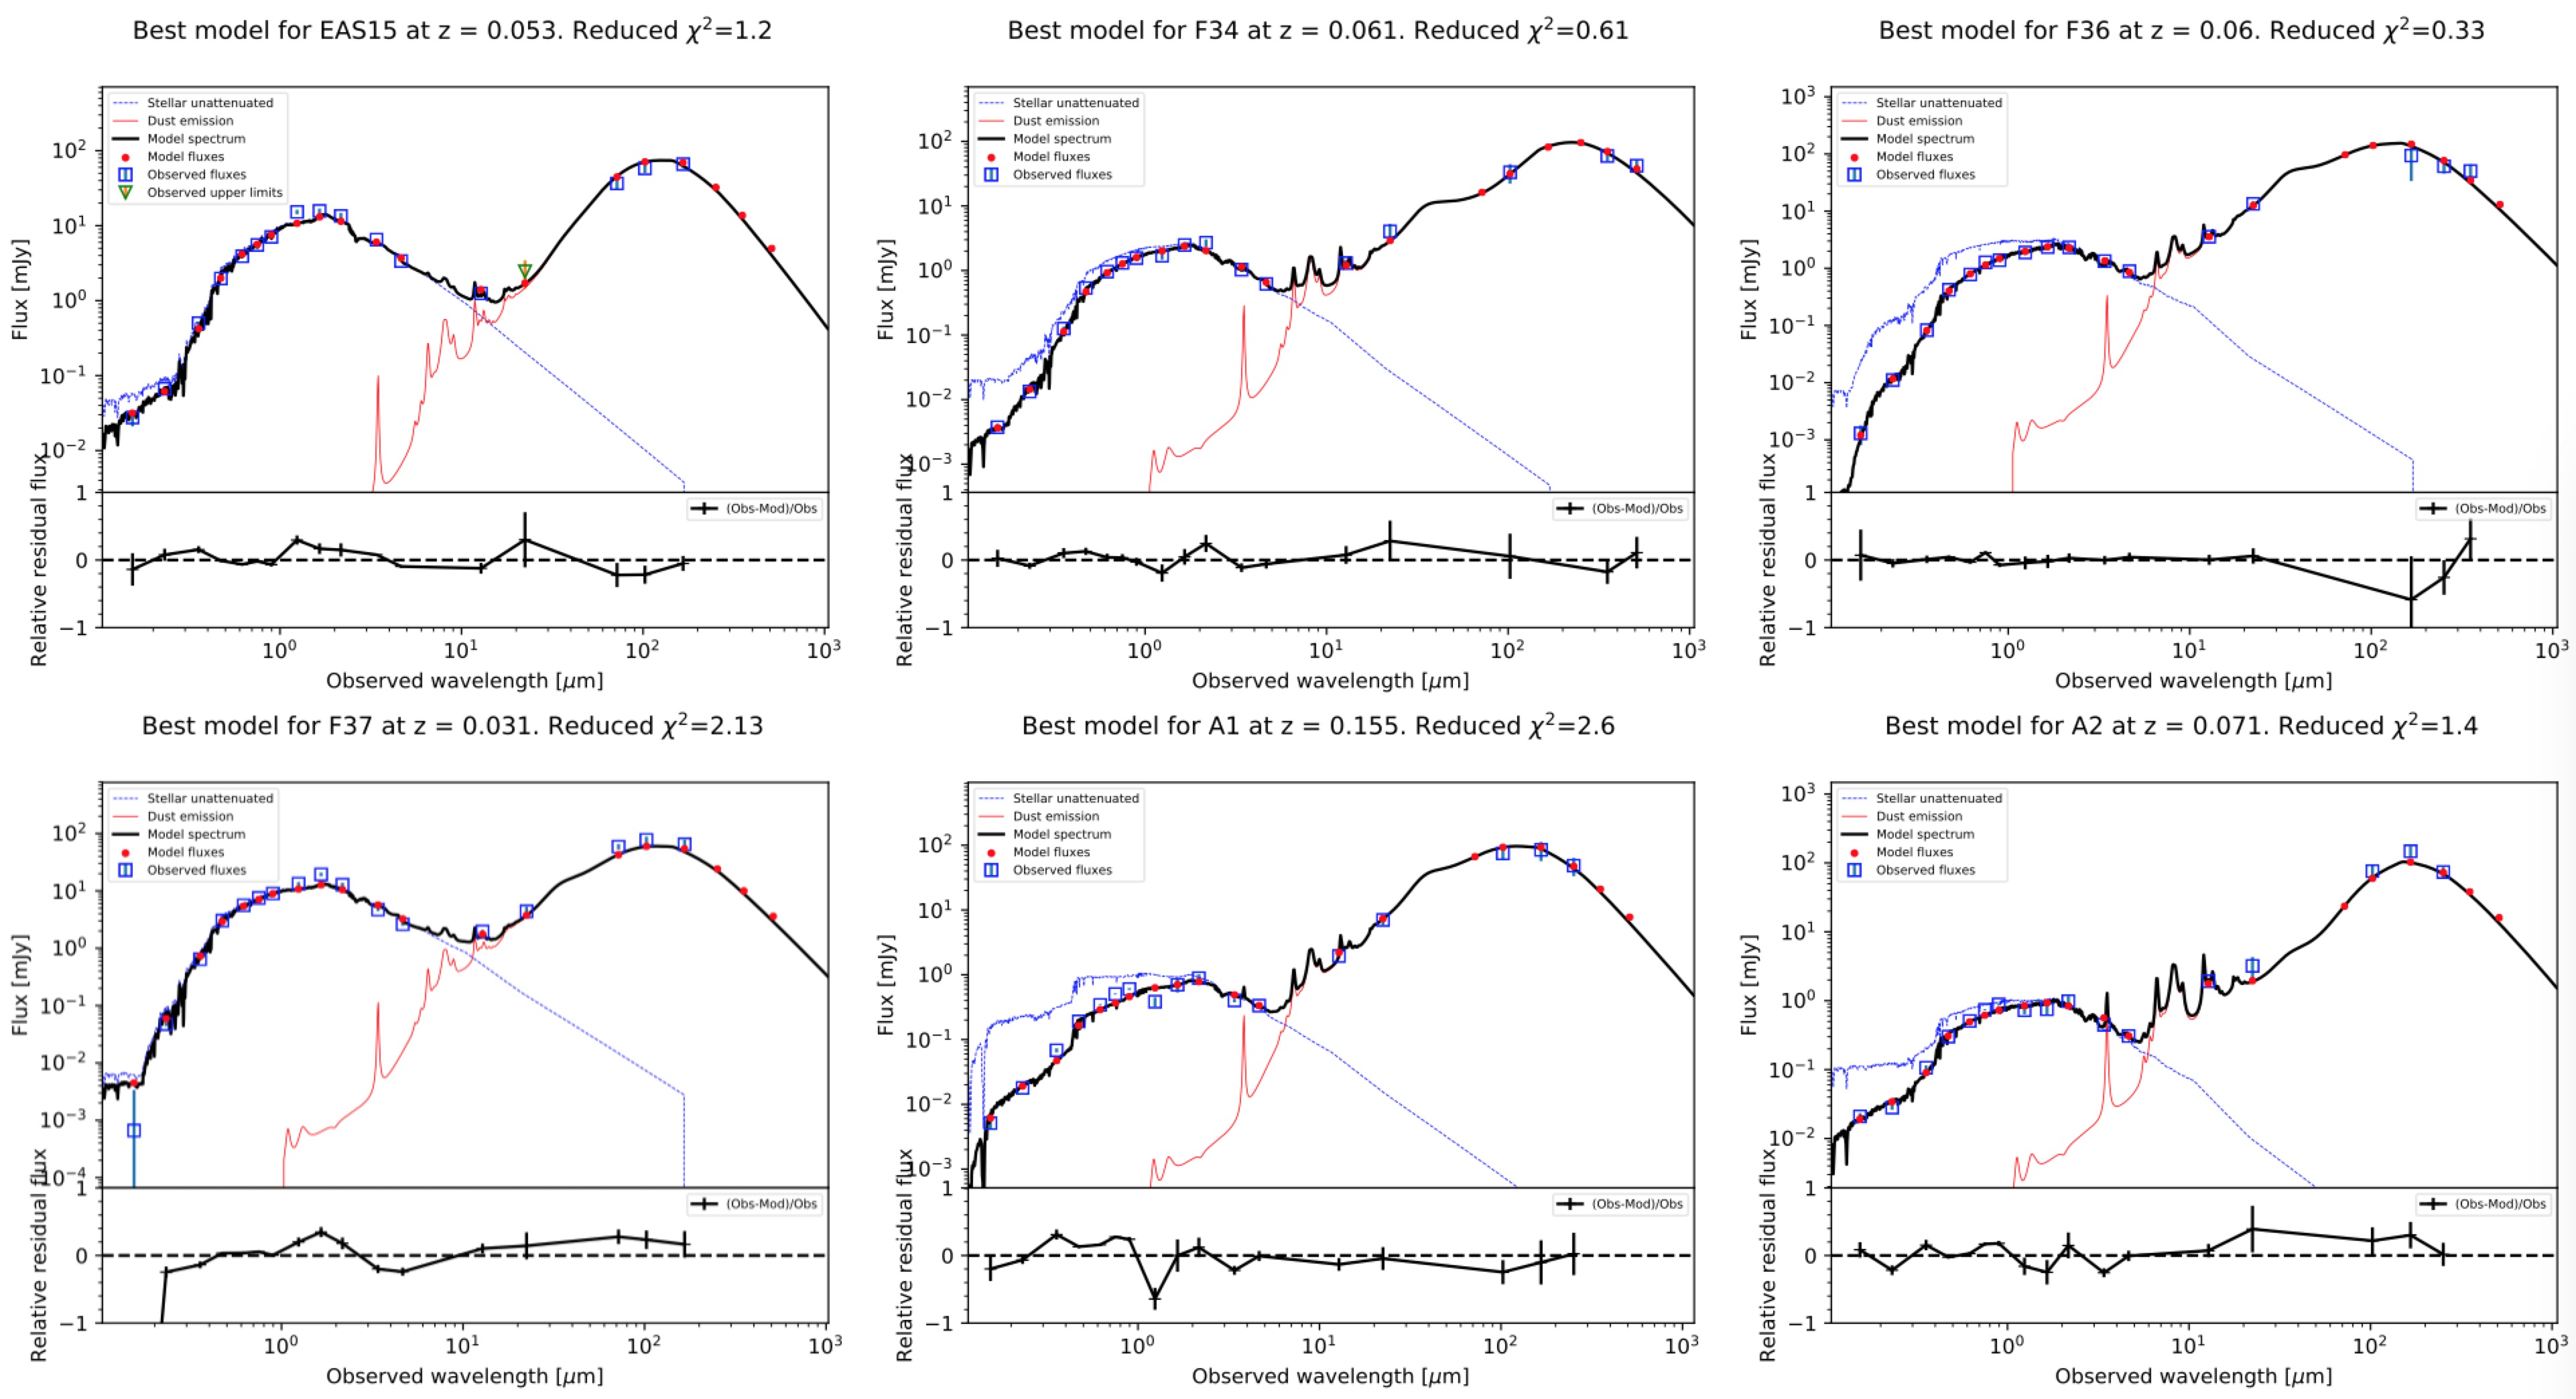
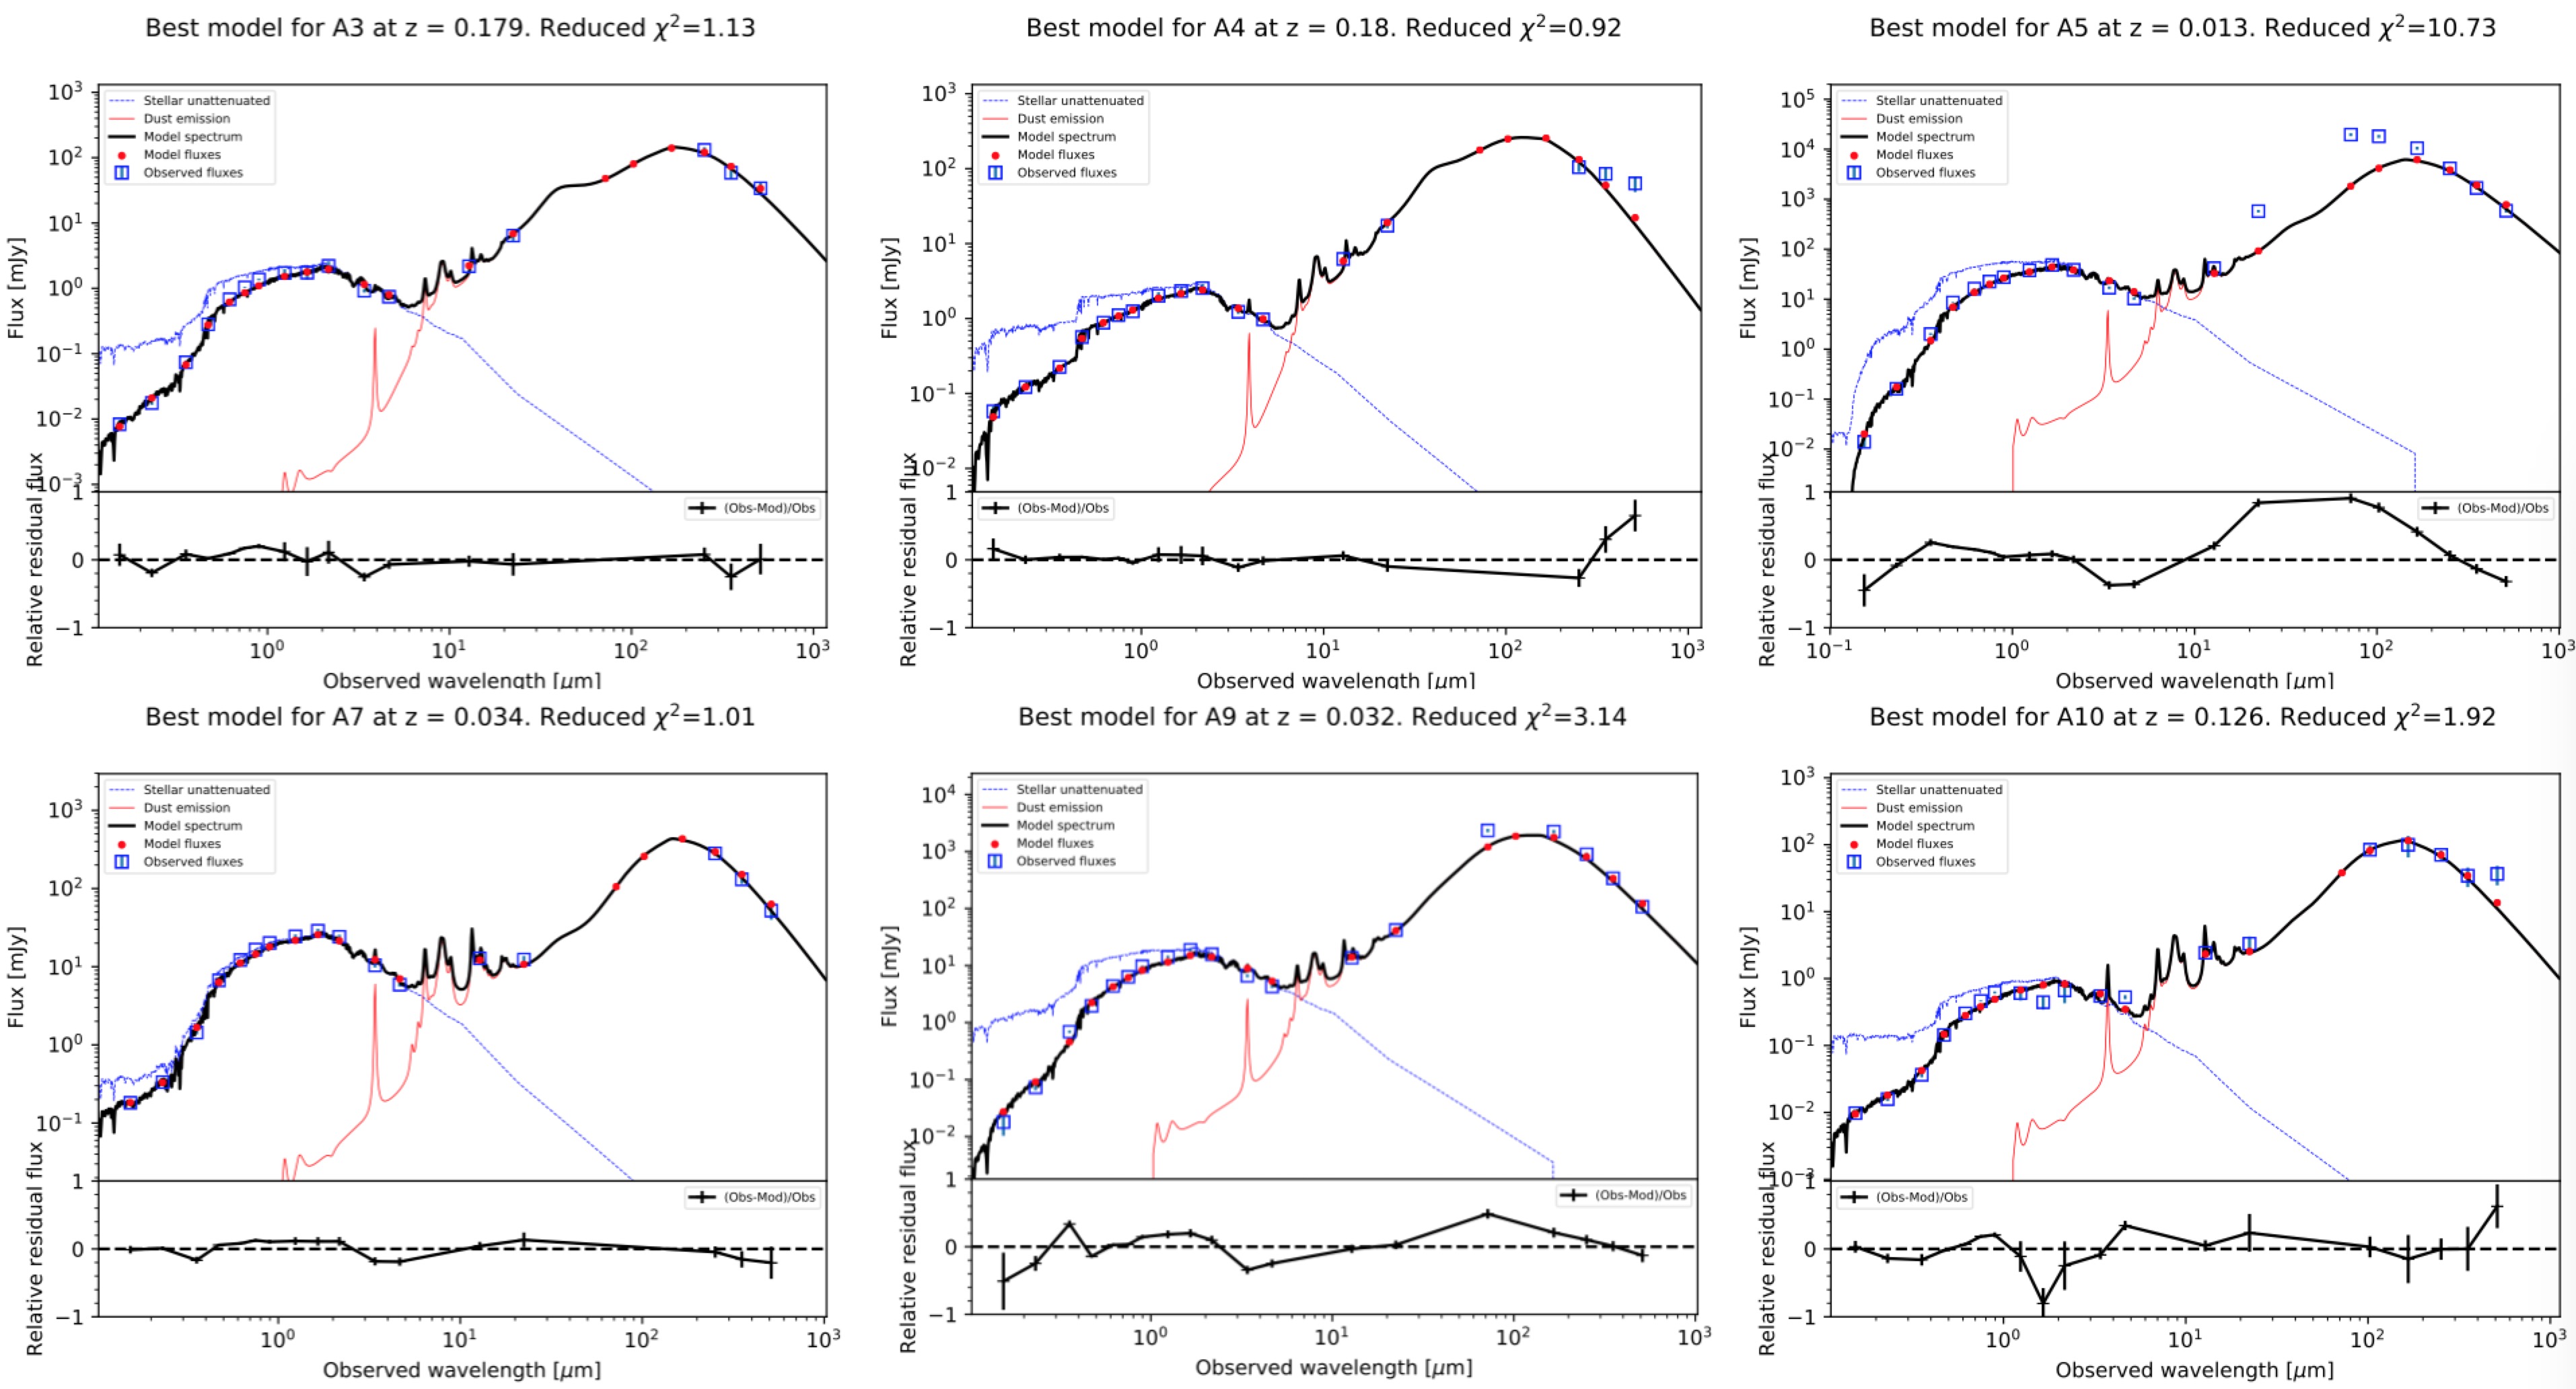
4.3 Fitting Results
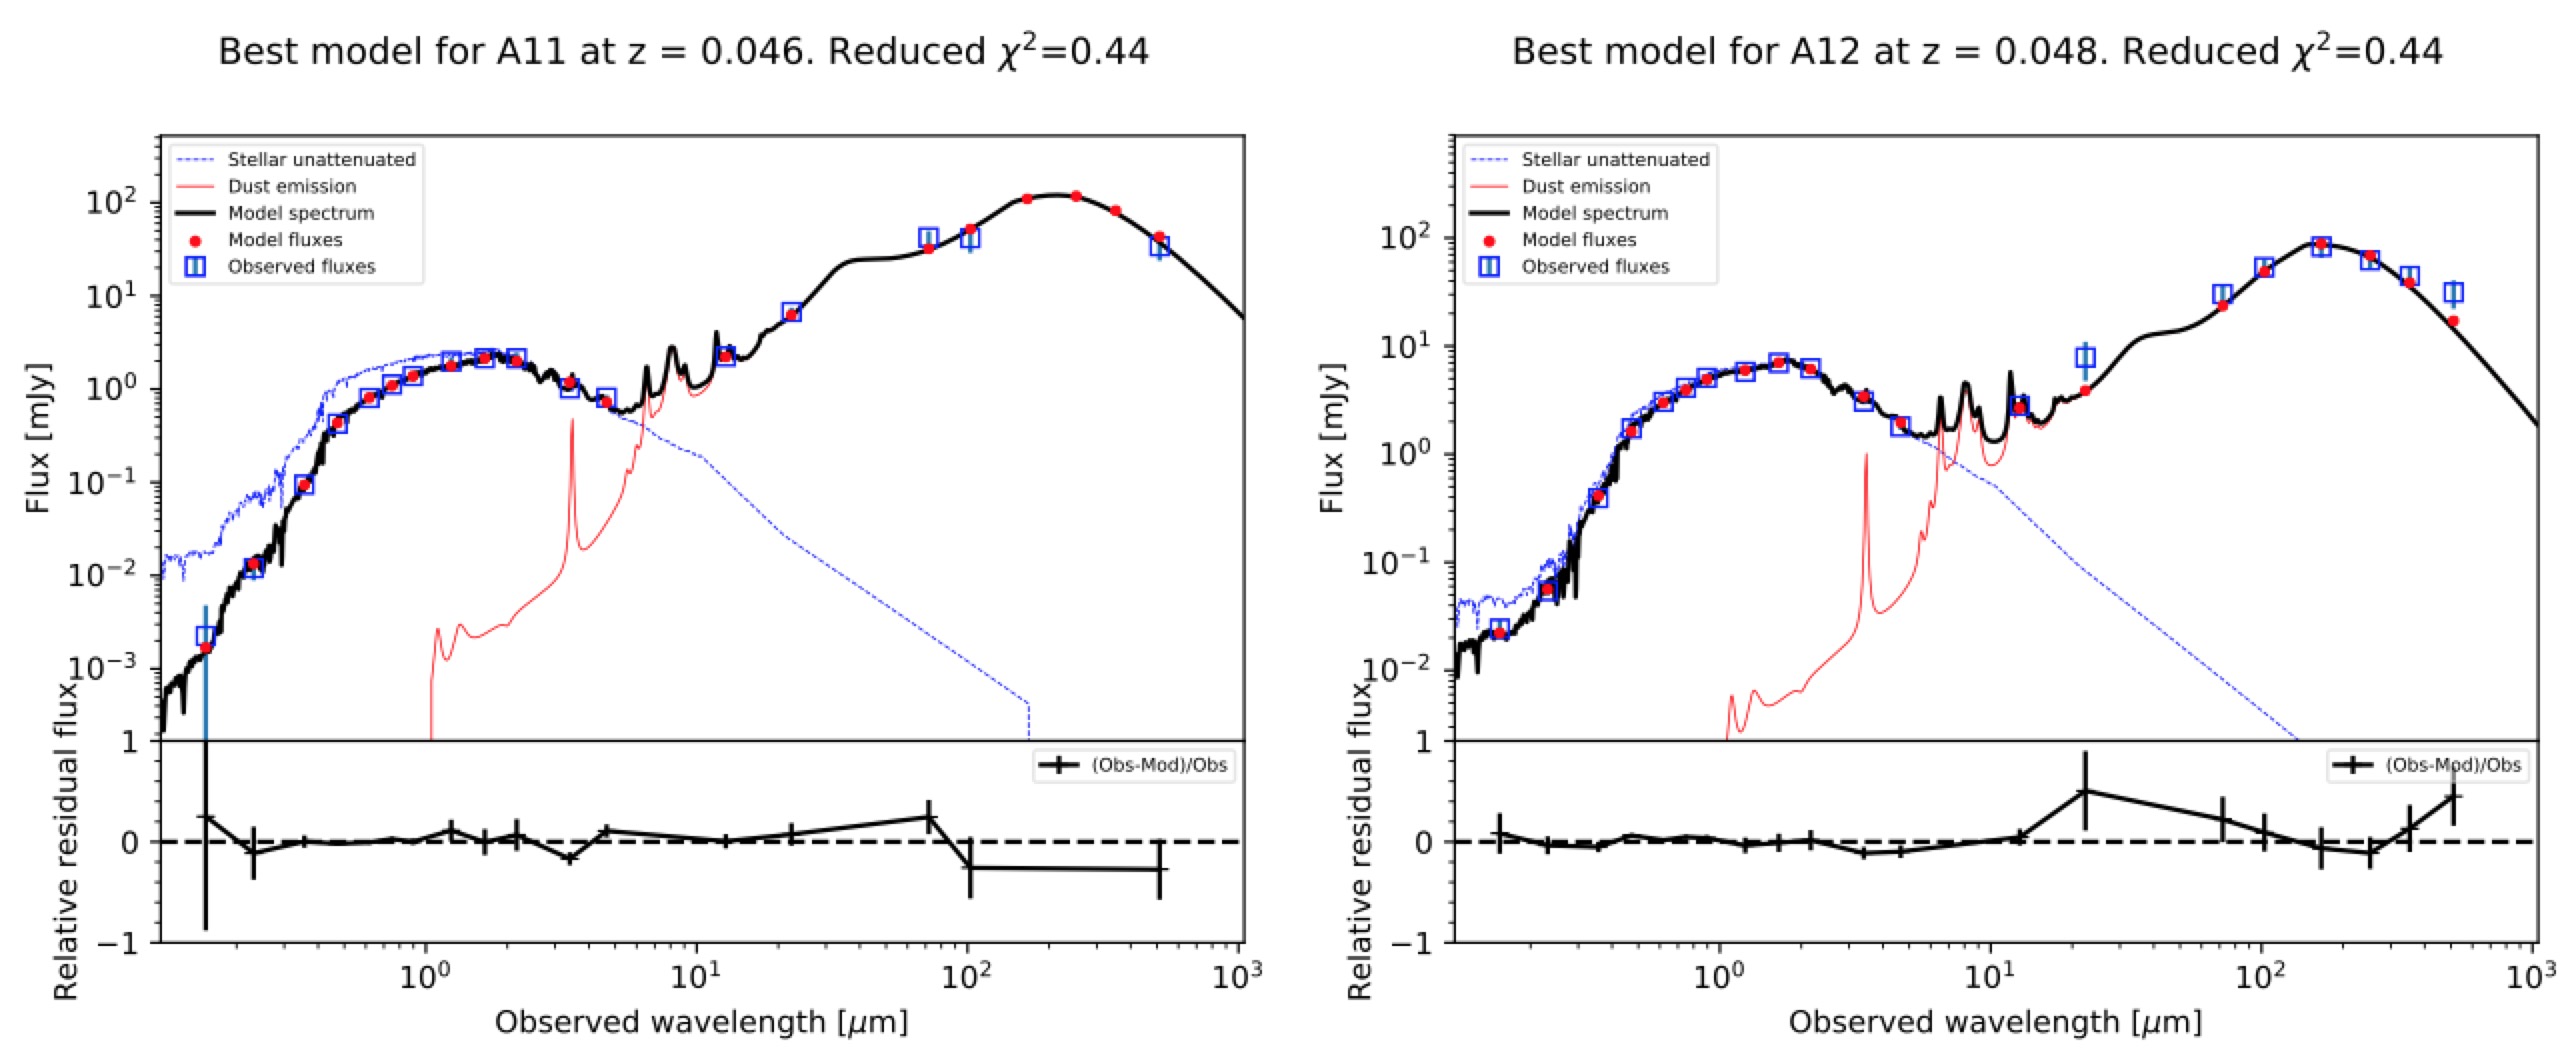
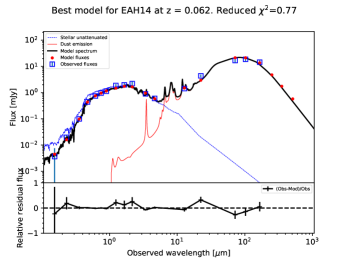
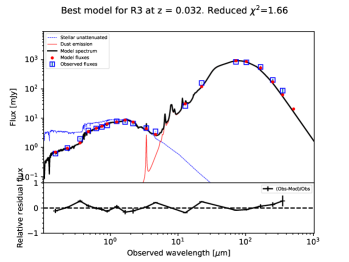
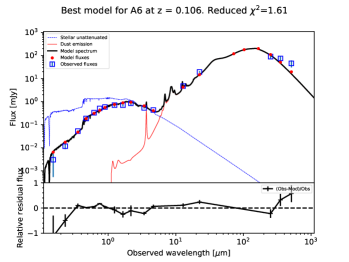
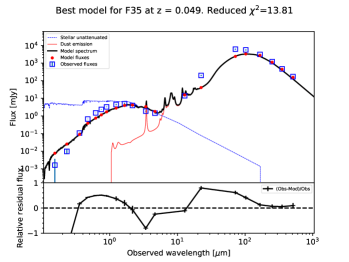
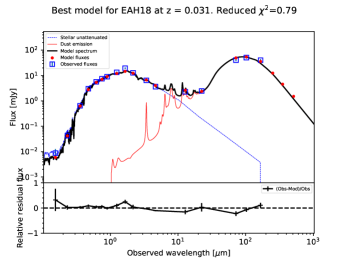
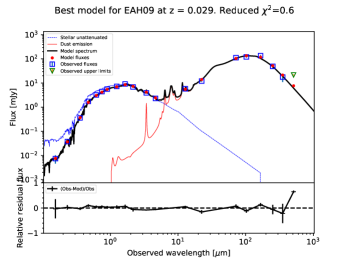
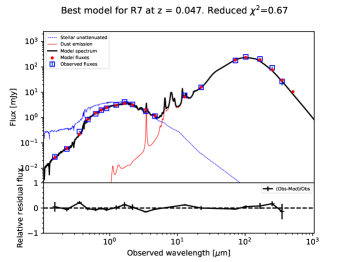
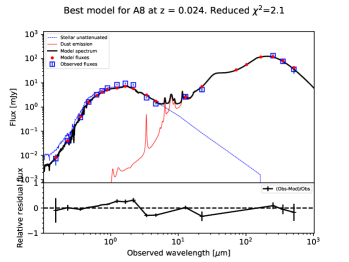
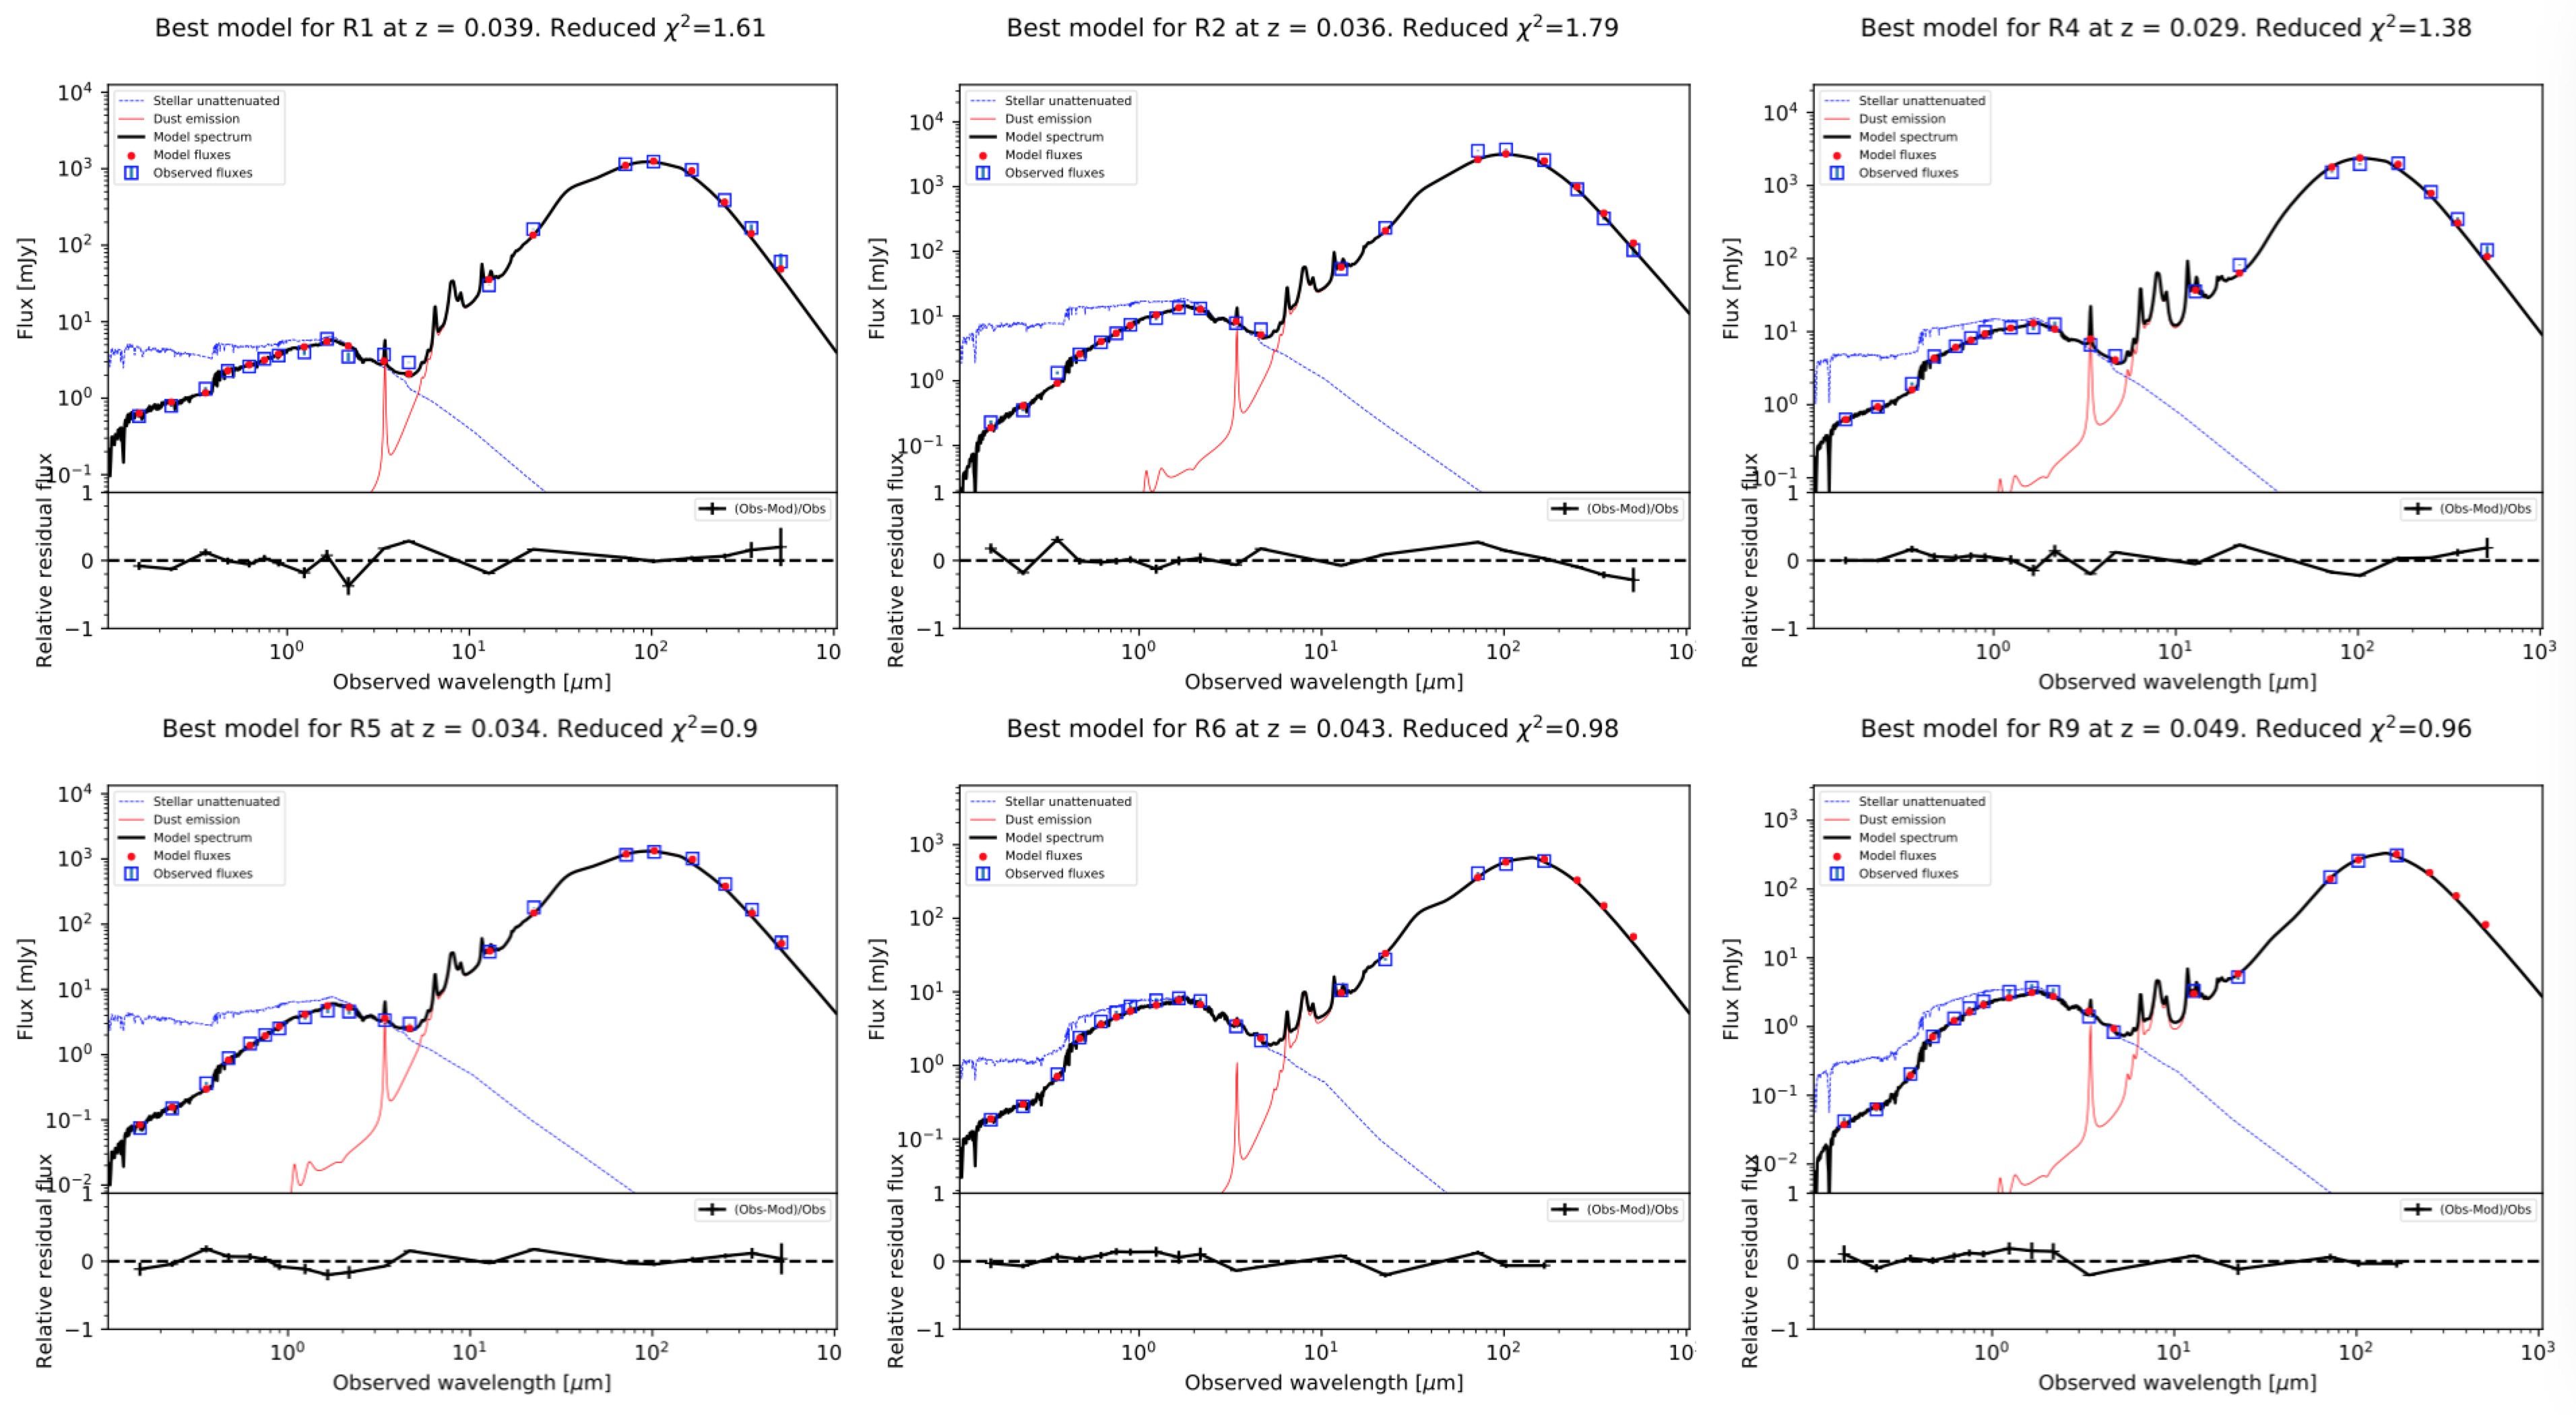
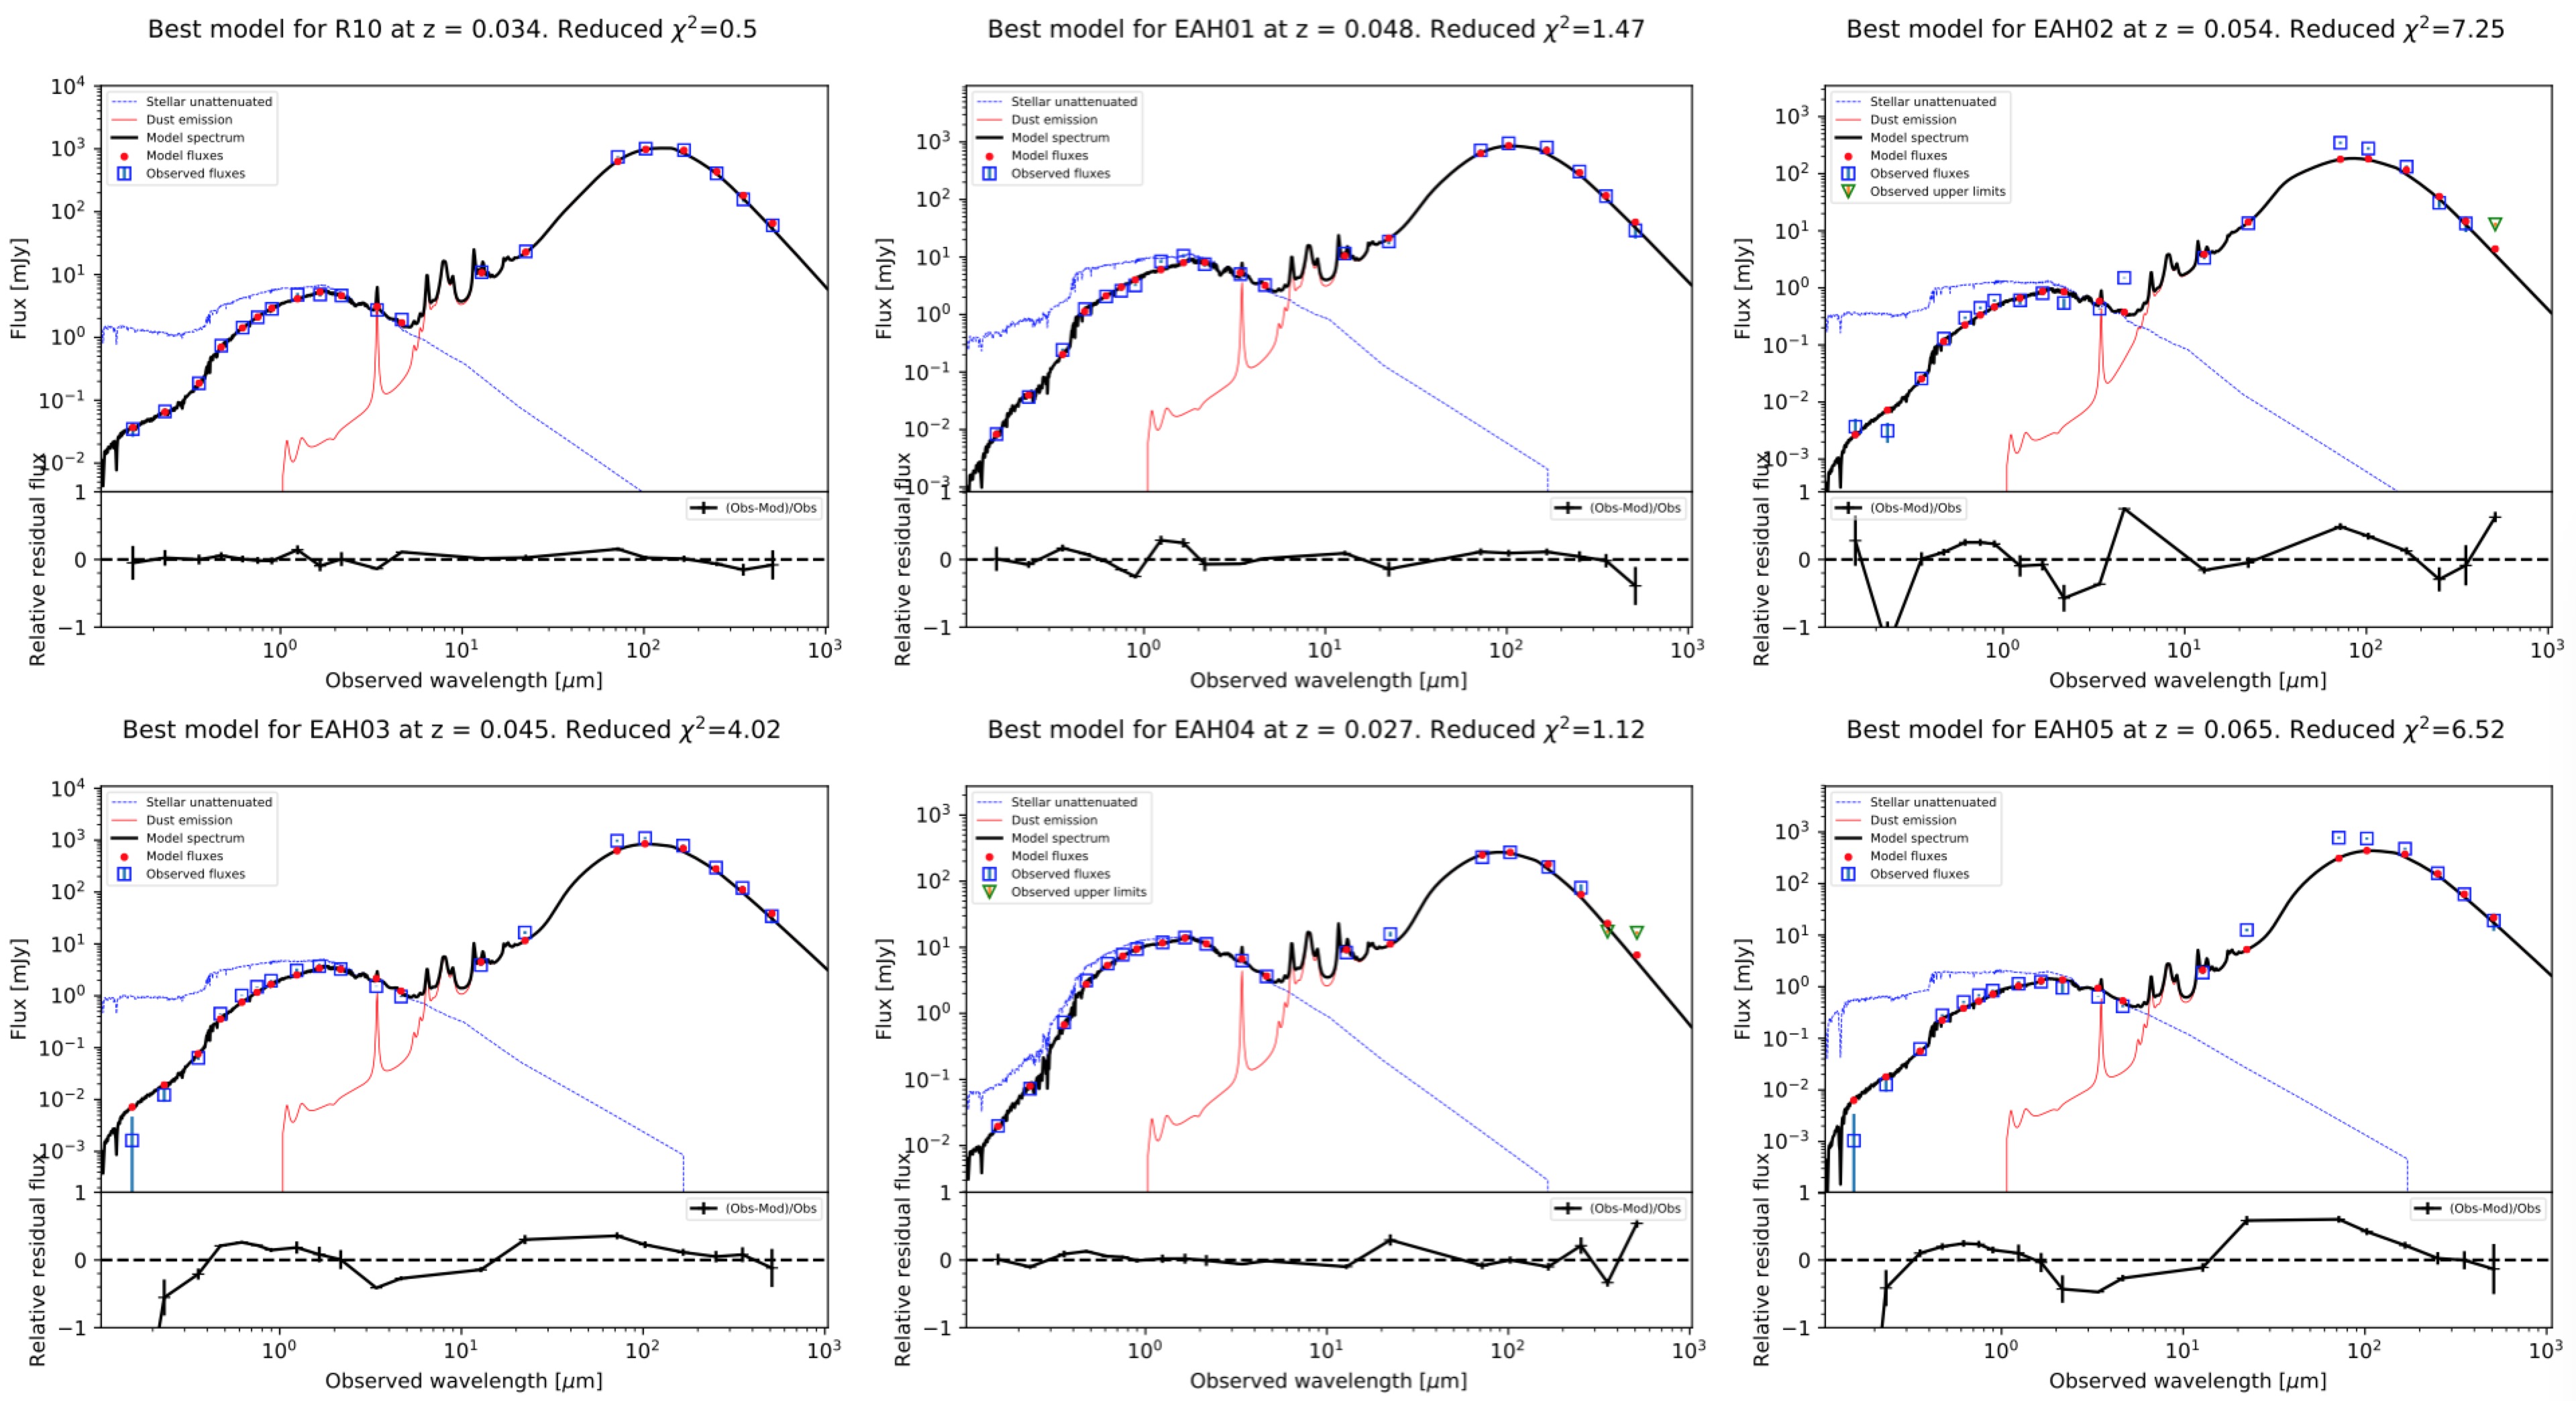
In Figure 1, we present eight typical SED fits of our sample. Their Mdust’s range from 105.78 M☉ to 108.18 M☉, while the full range of Mdust of our sample is 105.32 M☉ to 108.89 M☉. According to French et al. (2018a), the optimal choice of a recent SFH model for EAH14, R3, A6, and F35 is “single-burst”, whereas for EAH18, EAH9, R7, and A8 it is “double-burst”.
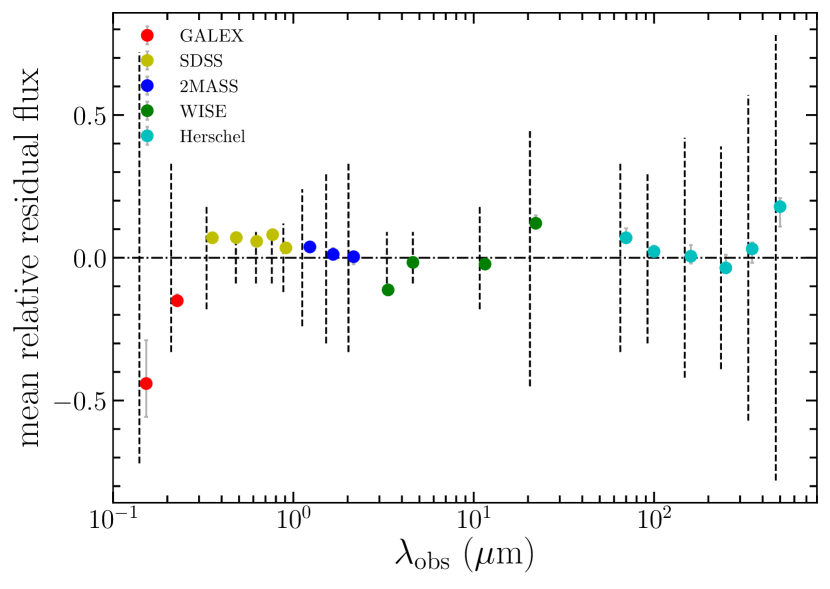
To quantify the quality of our SED fits, we calculate the mean relative residual flux for our sample, as shown in Figure 2. We define the relative residual flux to be , in which is the observed flux and is the model flux predicted by CIGALE. To determine the uncertainty of the mean relative residual flux, we use the Monte Carlo method to generate realizations of the fluxes and construct probability distributions for each individual flux and the mean relative residual flux. The error bars of the mean relative residual flux in Figure 2 represent their 68% confidence level uncertainties.
From Figure 2 we conclude that in general (i.e., for 19/20 bands), the mean relative residual flux is consistent with the 3 average percentage flux uncertainty (defined as , where is the total flux uncertainty in that band). For the W1 band, the mean relative residual flux is barely consistent with the 3 average percentage flux uncertainty. Such systematics could be due to the uncertainties in the data, the limitations of the stellar population model, or the dust model.
In terms of reduced , of all 58 SED fits, only five of the PSBs (EAH02, EAH05, EAH08, A5, and F35) have reduced 5.0. Our tests show that their Mdust does not change much if we only fit their IR SED (see Appendix B). All five EAH sources with reduced 3.0 have Mdust consistent with Smercina et al. (2018) (see Appendix C). So we conclude that the relatively large reduced of this small fraction of our sample does not affect the robustness of our derived Mdust or any conclusions in general.
 |
 |
 |
 |
 |
 |
 |
 |
5 Results and Discussion
5.1 versus post-burst age
Having derived for our sample using CIGALE, we examine the evolution of specific dust mass (=) versus post-burst age, 999We use the more accurate derived in French et al. (2018a) by including optical spectral information (see Appendix D).. Here we define the ‘post-burst age’ to be the time elapsed since the majority (90%) of the stars formed in the recent burst(s). Thus, for the single-burst model, we have:
| (1) |
while for the double-burst model101010Here is fixed to 25 Myr.:
| (2) |
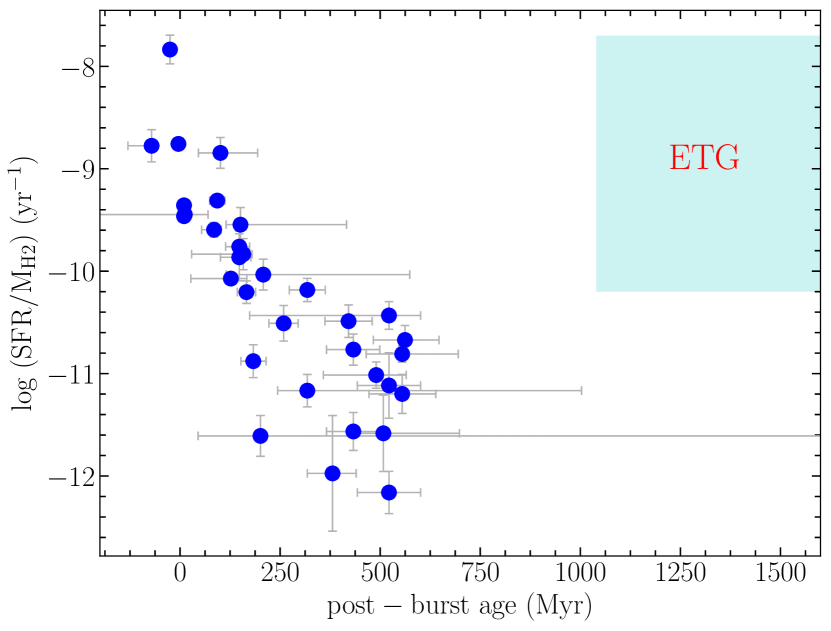
As shown in Figure 3, there is a declining trend between specific dust mass and . To quantify the significance of this relation, we perform a Spearman rank test and linear fitting using the method in Cappellari et al. (2013), which takes errors in both and into account. The fitting result is in the form of log() = a (- x0) + b + , where a = -0.00212 0.00047, b = -3.28 0.10, x0 = 316, and intrinsic scatter = 0.68 0.09. We also use the ASURV survival analysis package to calculate the Spearman’s rank correlation (Isobe et al., 1986; Lavalley et al., 1992), and perform bootstrap analysis (1000 samples) to derive the confidence intervals of the Spearman correlation coefficient and the null hypothesis probability (Lanz et al., 2019). The null hypothesis is that there is no monotonic relation between two parameters. We define a significant correlation as one that rejects this hypothesis by having a probability 3 10-3 (log(p) -2.52), corresponding to approximately 3. The Spearman coefficients are r = -0.39 0.13 and log(p) = -2.54 1.24. To compare our results with previous work, we overplot three other samples following Rowlands et al. (2015). They are the average for z 0.1 spiral galaxies detected in Rowlands et al. (2012), for 0.01 z 0.06 dusty ETGs from Agius et al. (2013), and for nondusty ETGs (representative of red sequence galaxies) for a range of dust temperatures from Rowlands et al. (2012).
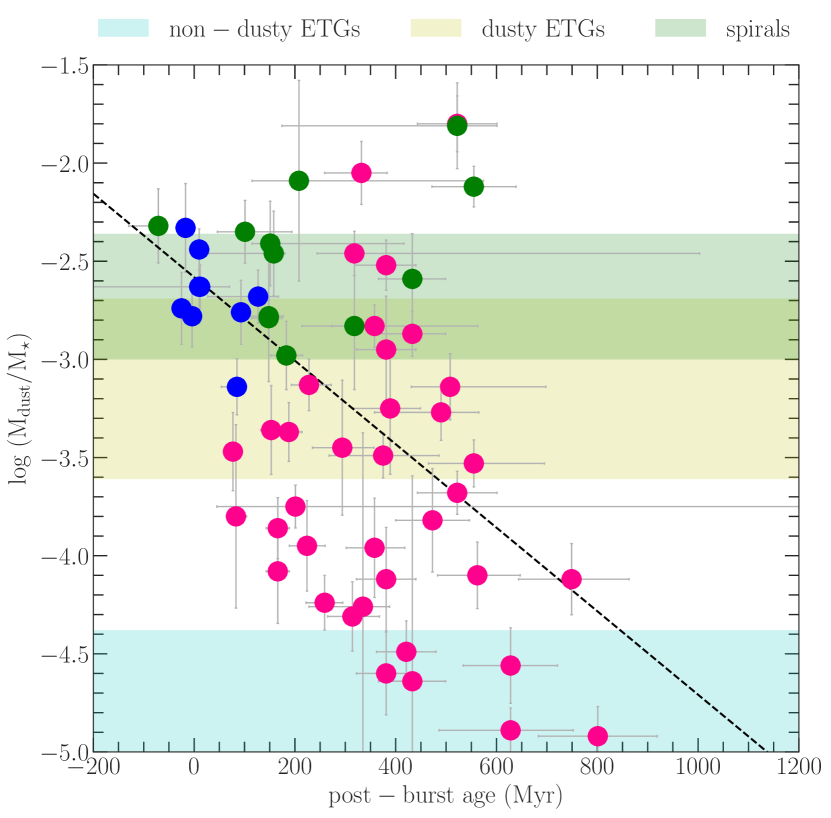
The significant anti-correlation between Mdust/M⋆ and suggests that the dust is either destroyed, expelled, or rendered undetectable over the 1 Gyr after the burst. Assuming the Mdust/M⋆ depletes exponentially after the burst ends, the fitting yields a depletion timescale of 205 Myr. Such a timescale is consistent with the M/M⋆ depletion timescale (117-230 Myr) derived in French et al. (2018a). Considering the typical Mdust/M⋆ of our sample at zero ( -2.5) and the Mdust/M⋆ range of non-dusty ETGs, it should take 1-2 Gyr for PSBs reach early-type levels of Mdust/M⋆. This result is consistent with previous claims that PSB stellar populations, color gradients, morphologies, kinematics, and molecular gas (Norton et al. 2001; Yang et al. 2004, 2008; Pracy et al. 2013; Pawlik et al. 2016; French et al. 2018a) will resemble the properties of ETGs in a few Gyr.
The derived Mdust/M⋆ depletion timescale may be, at least partly, due to the low-ionization nuclear emission-line region (LINER) or active galactic nucleus (AGN) feedback, as gas consumption by residual star formation would take much longer time (French et al., 2018a). The depletion time associated with AGN driven outflows in non-AGN-dominated starburst galaxies could be up to several hundred Myr (Cicone et al., 2014; Baron et al., 2017, 2018), which is consistent with our case here.
We do not find any significant correlation between M/Mdust and (Spearman coefficients r = 0.11 0.16, log(p) = -0.33 0.54). The decrease in Mdust/M⋆ and M/M⋆ with and the constancy of the gas-to-dust ratio suggest that the dust and gas decline is driven by the same physical mechanism. Furthermore, the close mutual tracking of the gas and dust indicates that the mechanism removes, consumes, or expels the ISM material, instead of merely altering its state and rendering it undetectable.
5.2 versus SFR and
Molecular gas, interstellar dust, and star formation are strongly correlated with each other in galaxies. The dust grains produced in supernovae can protect molecular hydrogen from UV radiation and contribute to the formation of molecular clouds, which collapse to form new stars. To quantify these relationships in PSBs, we consider here the relations between and SFR and between and molecular gas mass, . The latter relation is a useful calibration to convert into harder-to-measure .
To consider the SFR- relation for our sample, we convert the H fluxes from the MPA-JHU catalog (Aihara et al., 2011) to SFR using the relation from Kennicutt et al. (1994)111111We do not use IR-derived SFRs in this paper, because (1) they are prone to overestimation (Hayward et al. 2014; Smercina et al. 2018), and (2) we want to avoid the intrinsic correlation between IR-derived and IR-derived SFRs.. We estimate the amount of internal dust extinction from the observed Balmer decrement, H/H. Assuming the hydrogen nebular emission follows Case B recombination, the intrinsic Balmer flux ratio (H/H)0 = 2.86 for = 104 K. Following French et al. (2015), we adopt the reddening curve of O’Donnell (1994)121212Using Calzetti et al. (2000) would yield a negligible difference: AHα/AV = 0.82 instead of 0.84, assuming RV = 4.05.. When the H line flux is uncertain, we follow French et al. (2015) using the mean value of E(B–V) of the other PSBs in French et al. (2015). The mean attenuation is AV = 0.92 mag (or AHα = 0.77 mag).
We further correct for potential underlying AGN contribution to H fluxes following the methodology from Wild et al. (2010). We calculate the emission-line ratios [O III]5007/H and [N II]6583/H of our PSBs to pinpoint them on the BPT diagram (Baldwin et al., 1981; Veilleux & Osterbrock, 1987), and determine the AGN contribution to their H luminosities. In some cases, a negative SFR correction factor is derived, of which the corresponding 1 upper limit is positive. We designate the SFR in these cases to be 1 upper limit values. In addition, when the H line is not well detected, we use its uncertainty as the 1 flux upper limit to determine the corresponding 1 upper limit for the correction factor. Note that all the SFR 1 upper limits are due to AGN correction, instead of low S/N H detections. In fact, all of our PSBs have 9 H detections, except for two 5 detections (EAS07 and EAS08) and two 4 detections (EAS10 and EAH10). All the SFR values are provided in Table 4.
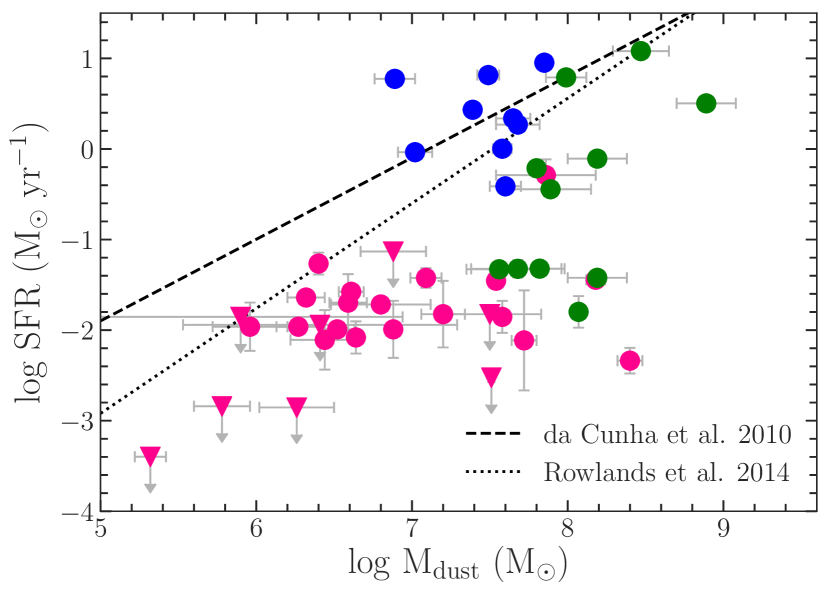
Our results are shown in Figure 4. For comparison, we plot the lines fit to 1658 local star-forming galaxies from da Cunha et al. (2010) and to 843 z 0.5 H-ATLAS star-forming galaxies from Rowlands et al. (2014). At fixed Mdust, our PSBs tend to have lower SFR than the local star-forming galaxies. This reflects the nature of PSBs, which have low SFRs by definition. The Spearman coefficients for the PSB log SFR-log relation are r = 0.56 0.12 and log(p) = -3.70 1.34, indicating a significant correlation. Even for the French et al. (2018a) sample alone, PSBs with the lowest generally have the lowest SFRs.
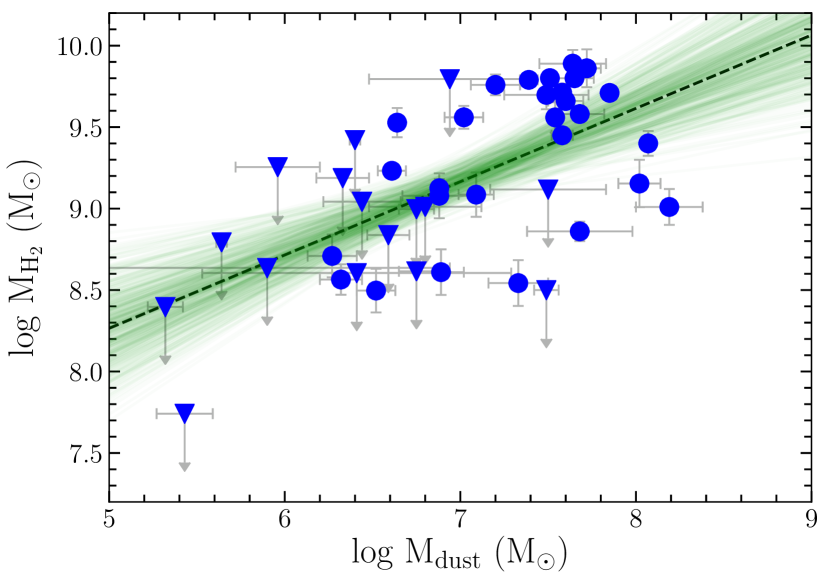
Next we fit the relationship between and for those 44 PSBs with both dust and CO measurements (the latter from French et al. 2015, Rowlands et al. 2015, and Alatalo et al. 2016b). We adopt the linear regression method from Kelly (2007), which takes both detections and upper limits into account. The best-fitting result is in the form of log = a log + b + , where a = 0.45 0.10, b = 6.02 0.68, and intrinsic scatter = 0.42 0.05 (see Figure 5). The Spearman coefficients are r = 0.69 0.08 and log(p) = -5.15 1.03. We use this significant correlation between and as a calibration, applying it to those 14 PSBs without molecular gas measurements to derive their .
5.3 Kennicutt-Schmidt relation
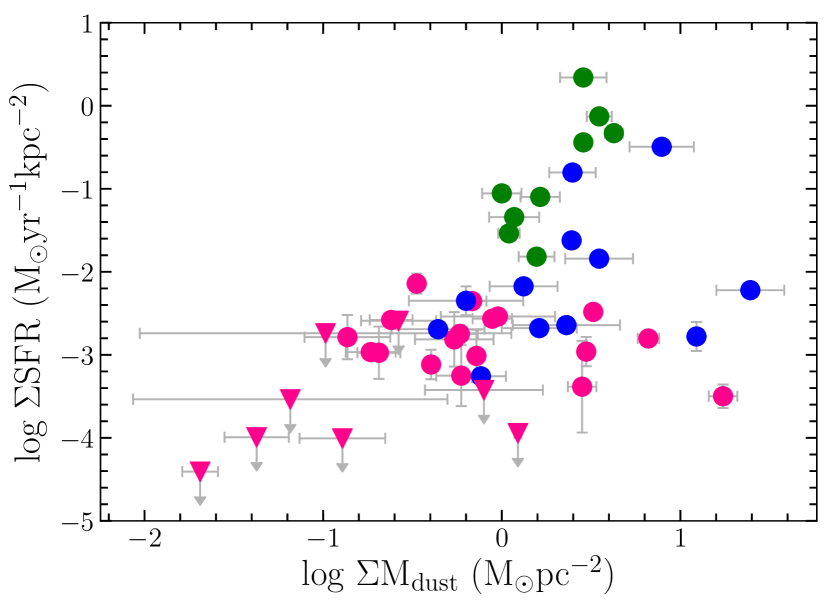
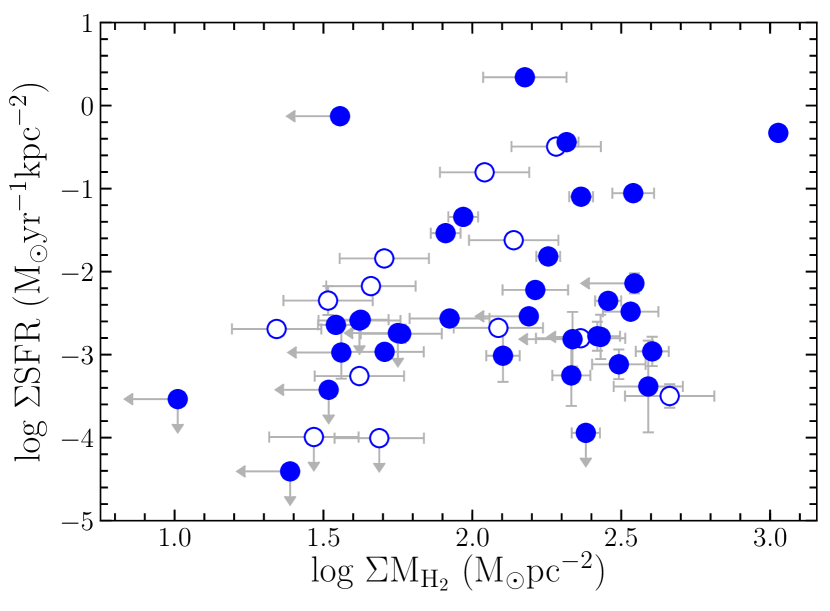
The relationships among SFR, , and for PSBs motivate us to explore the KS relation131313The version of the KS relation (Kennicutt, 1998) for SFR and in local normal disk galaxies is SFR (Leroy et al., 2013), where the exact slope is sensitive to the tracer (e.g., Gao & Solomon 2004) and the CO-to-H2 conversion factor (e.g., Bolatto et al. 2013).. With our - calibration, we deduce for those PSBs without CO detections, and use the SDSS Petrosian radius141414Without resolved IR, CO, and H observations for all of our sample, we assume that the dust, molecular gas, and star formation regions are roughly comparable in size and lie within . We do know that, for a subsample of these galaxies, the dust typically subtends a radius 3-4 smaller than (Smercina et al., 2018) and that, for four (EAS02, 04, 11, 13), the H emission does not extend much beyond in archival MaNGA (Bundy et al., 2015) data. (r50) to convert , , and SFR into surface mass densities. The resulting SFR- and SFR- relations are in Figure 6.
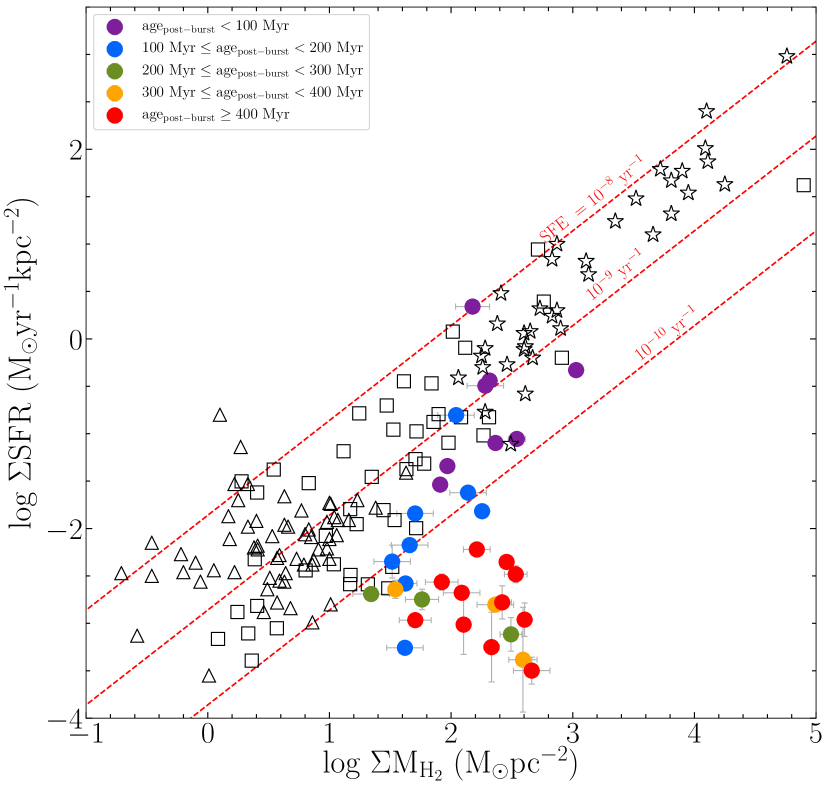
Next we compare our 33 PSBs that have SFR detections and measurements from either CO emission or the - calibration with normal star-forming galaxies and starbursts from Kennicutt (1998) and with ETGs from Davis et al. (2014). For the ETG sample, we recalculate and using r50 to ensure a direct comparison to the PSB sample. For the Kennicutt (1998) sample, we use the original surface densities normalized by the RC2 isophotal radius (where the B-band surface brightness drops to 25 mag arcmin-2), which is comparable to the H emitting region for normal spiral galaxies, as the r50 is unavailable in the SDSS. French et al. (2015) explored the effects of assuming different radii and found consistent results.
Figure 7 shows that the locus of our PSBs lies below the KS relation for the other galaxies (as was seen by French et al. 2015). Scaling the surface densities of these galaxies with a different radius would move them along the KS relation, which does not eliminate the observed offset for our PSBs. Remarkably, when we consider their post-burst ages, the PSBs evolve downward during the first 200-300 Myr, due to the faster decrease in SFR relative to . This evolution also implies a decreasing SFE, defined here as (or . The SFE later reaches and remains at a low value, , Myr after the burst.
5.4 Star formation efficiency
The evolution of SFE for our PSB sample is shown directly in Figure 8. SFE drops significantly with post-burst age. After the first 200-300 Myr, the SFE decline slows151515The apparent SFE floor is not due to a limit in our SFR measurement sensitivity: across the ranges of SFEs and post-burst ages plotted here, the S/N of the H detections is similar and high (see section 5.2).. To ultimately reach the SFE level of ETGs, there must be an increase in SFE later.
The fast initial SFE decline arises from SFR decreasing more quickly than . The decoupling of SFR from suggested by this result is consistent with French et al. (2018a), who found that the decline of /M⋆ is too quick to arise from consumption by star formation and is similar to the observed outflow rates of AGN/LINERs. Such outflows may not only drive the /M⋆ decline, but also prevent the large CO-traced molecular gas reservoirs from collapsing and forming denser, star-forming clouds. The rapid drop in SFR is in fact likely due to the absence of denser gas (as traced by HCO+/HCN; French et al. 2018b). Any successful feedback model will need to reproduce these behaviors, namely that /M⋆ and /M⋆ decline similarly over a timescale of several hundred Myr and that denser gas and SFR decline faster than and .
The slowing of the SFR decline, after the first 200-300 Myr, was also seen in Figure 7. If we assume that the SFR’s value at 500 Myr remains constant thereafter, and that the depletion of continues (French et al., 2018a), then the SFE will rise to ETG levels within 0.5-1.1 Gyr (or equivalently, 1-1.6 Gyr after the most recent burst ends).
6 Conclusions
By performing UV-FIR SED fitting for a sample of 58 PSBs, we have determined Mdust and quantified the relationship between Mdust and CO-traced . We have also observed evolution with post-burst age in Mdust/M⋆, SFE, and the KS plane. Our main results are:
(1) There is a significant anticorrelation between the Mdust/M⋆ and the time elapsed since the end of the recent starburst (), indicating that the dust is either destroyed, expelled, or rendered undetectable over the 1 Gyr after the burst. Assuming that the Mdust/M⋆ depletes exponentially after the burst ends yields a depletion timescale of 205 Myr. This timescale is consistent with the CO-traced M/M⋆ depletion timescale (French et al., 2018a), suggesting that these dust and molecular gas evolution trends are real and due to the same mechanism. Intriguingly, this observed decline will reduce the dust and CO reservoirs of a PSB to that of an ETG within 1-2 Gyr, when the PSB stellar populations, color gradients, morphologies, and kinematics will likewise resemble those of ETGs.
(2) We determine the - relation from our 44 PSBs with both and CO detections, and apply this calibration to estimate for the remainder of the sample. We then place the PSBs in the KS plane and find that over time, they move down and away from the KS relation defined by normal star-forming galaxies and starbursts. This evolution is principally due to a rapid drop in the SFR, at least for the first 200-300 Myr after the burst ends.
(3) Direct examination of the evolution of SFE (the ratio of SFR to the CO-traced ) reveals a sharp drop during those first 200-300 Myr, i.e., the SFR is decoupled from the and declines faster. The decrease in SFR in PSBs is likely due to the absence of denser gas (French et al., 2018b). It is possible that the same mechanism responsible for the decline in /M⋆ and /M⋆, whose common short timescale is consistent with AGN/LINER feedback, also prevents the large CO-traced molecular gas reservoirs from collapsing and forming denser, star-forming clouds. After 200-300 Myr, the continues to decline, but the SFR levels off, suggesting an SFE floor of 10. If we assume that the SFR remains constant at this late level, and that the depletion rate of does not change, then the SFE will rise to ETG levels within 0.5-1.1 Gyr, a timescale consistent with the evolution of other PSB properties into ETGs.
| ID | R.A. | Decl. | GALEX (mJy) | SDSS (mJy) | 2MASS (mJy) | |||||||
|---|---|---|---|---|---|---|---|---|---|---|---|---|
| (J2000 deg) | (J2000 deg) | FUV | NUV | u | g | r | i | z | J | H | Ks | |
| R1 | 233.13199 | 57.88292 | 5.84E-01 | 7.92E-01 | 1.33E+00 | 2.27E+00 | 2.60E+00 | 3.26E+00 | 3.62E+00 | 3.97E+00 | 5.96E+00 | 3.50E+00 |
| (3.40E-02) | (2.32E-02) | (6.69E-02) | (1.14E-01) | (1.30E-01) | (1.63E-01) | (1.82E-01) | (3.24E-01) | (4.78E-01) | (4.62E-01) | |||
| R2 | 228.95127 | 20.02236 | 2.28E-01 | 3.50E-01 | 1.33E+00 | 2.56E+00 | 3.93E+00 | 5.40E+00 | 7.32E+00 | 9.27E+00 | 1.35E+01 | 1.31E+01 |
| (1.67E-02) | (1.22E-02) | (6.71E-02) | (1.28E-01) | (1.97E-01) | (2.70E-01) | (3.67E-01) | (6.24E-01) | (8.83E-01) | (9.76E-01) | |||
| R3 | 225.40127 | 16.72968 | 6.18E-01 | 9.56E-01 | 1.97E+00 | 3.79E+00 | 4.45E+00 | 5.01E+00 | 5.65E+00 | 7.83E+00 | 7.37E+00 | 6.56E+00 |
| (4.94E-02) | (3.53E-02) | (9.89E-02) | (1.90E-01) | (2.23E-01) | (2.51E-01) | (2.83E-01) | (4.82E-01) | (6.17E-01) | (6.45E-01) | |||
| R4 | 246.45527 | 40.34521 | 6.29E-01 | 9.35E-01 | 1.93E+00 | 4.60E+00 | 6.33E+00 | 8.19E+00 | 9.89E+00 | 1.13E+01 | 1.14E+01 | 1.26E+01 |
| (3.38E-02) | (2.49E-02) | (9.77E-02) | (2.30E-01) | (3.17E-01) | (4.10E-01) | (4.96E-01) | (7.76E-01) | (9.43E-01) | (1.13E+00) | |||
| R5 | 244.39756 | 14.05230 | 7.48E-02 | 1.50E-01 | 3.64E-01 | 8.82E-01 | 1.48E+00 | 2.00E+00 | 2.52E+00 | 3.73E+00 | 4.70E+00 | 4.58E+00 |
| (7.20E-03) | (6.11E-03) | (1.87E-02) | (4.42E-02) | (7.39E-02) | (1.00E-01) | (1.27E-01) | (2.88E-01) | (3.86E-01) | (4.32E-01) | |||
| R6 | 252.92373 | 41.66838 | 1.83E-01 | 2.78E-01 | 7.59E-01 | 2.39E+00 | 3.96E+00 | 5.28E+00 | 6.36E+00 | 7.66E+00 | 8.22E+00 | 7.54E+00 |
| (1.35E-02) | (1.00E-02) | (3.86E-02) | (1.20E-01) | (1.98E-01) | (2.64E-01) | (3.19E-01) | (5.60E-01) | (7.75E-01) | (7.35E-01) | |||
| R7 | 249.49529 | 13.85942 | 2.80E-02 | 5.77E-02 | 2.82E-01 | 8.37E-01 | 1.42E+00 | 1.97E+00 | 2.33E+00 | 3.14E+00 | 4.15E+00 | 3.31E+00 |
| (5.29E-03) | (4.40E-03) | (1.48E-02) | (4.19E-02) | (7.12E-02) | (9.87E-02) | (1.17E-01) | (2.60E-01) | (4.02E-01) | (3.71E-01) | |||
| R9 | 239.56848 | 52.48926 | 4.20E-02 | 6.23E-02 | 2.04E-01 | 7.16E-01 | 1.32E+00 | 1.85E+00 | 2.32E+00 | 3.22E+00 | 3.69E+00 | 3.21E+00 |
| (5.36E-03) | (3.81E-03) | (1.09E-02) | (3.59E-02) | (6.59E-02) | (9.29E-02) | (1.17E-01) | (2.91E-01) | (4.59E-01) | (3.89E-01) | |||
| R10 | 247.17897 | 22.39712 | 3.50E-02 | 6.66E-02 | 1.87E-01 | 7.41E-01 | 1.43E+00 | 2.09E+00 | 2.84E+00 | 4.78E+00 | 4.82E+00 | 4.63E+00 |
| (8.76E-03) | (7.68E-03) | (1.36E-02) | (3.76E-02) | (7.19E-02) | (1.05E-01) | (1.44E-01) | (3.22E-01) | (3.72E-01) | (4.78E-01) | |||
| EAH01 | 128.64046 | 17.34621 | 8.34E-03 | 3.69E-02 | 2.43E-01 | 1.24E+00 | 2.06E+00 | 2.60E+00 | 3.22E+00 | 8.42E+00 | 1.05E+01 | 7.52E+00 |
| (1.48E-03) | (1.89E-03) | (1.27E-02) | (2.51E-02) | (4.17E-02) | (5.26E-02) | (9.83E-02) | (5.67E-01) | (7.22E-01) | (7.63E-01) | |||
| EAH02 | 141.58038 | 18.67806 | 3.71E-03 | 3.13E-03 | 2.58E-02 | 1.29E-01 | 3.01E-01 | 4.46E-01 | 6.00E-01 | 6.08E-01 | 8.06E-01 | 5.44E-01 |
| (1.38E-03) | (1.20E-03) | (2.59E-03) | (6.58E-03) | (1.52E-02) | (2.25E-02) | (3.15E-02) | (9.61E-02) | (6.93E-02) | (1.08E-01) | |||
| EAH03 | 222.06686 | 17.55165 | 1.63E-03 | 1.23E-02 | 6.33E-02 | 4.51E-01 | 1.01E+00 | 1.49E+00 | 1.96E+00 | 3.08E+00 | 3.71E+00 | 3.28E+00 |
| (3.06E-03) | (3.28E-03) | (5.16E-03) | (9.36E-03) | (2.08E-02) | (3.03E-02) | (6.09E-02) | (2.79E-01) | (4.25E-01) | (4.62E-01) | |||
| EAH04 | 318.50226 | 0.53511 | 1.98E-02 | 7.23E-02 | 7.33E-01 | 3.16E+00 | 5.65E+00 | 7.71E+00 | 9.37E+00 | 1.18E+01 | 1.41E+01 | 1.12E+01 |
| (1.65E-03) | (2.14E-03) | (3.72E-02) | (6.35E-02) | (1.14E-01) | (1.55E-01) | (2.83E-01) | (7.33E-01) | (1.04E+00) | (9.08E-01) | |||
| EAH05 | 184.26012 | 39.07704 | 1.04E-03 | 1.27E-02 | 6.24E-02 | 2.80E-01 | 5.08E-01 | 6.86E-01 | 8.41E-01 | 1.14E+00 | 1.26E+00 | 9.52E-01 |
| (2.40E-03) | (3.38E-03) | (3.57E-03) | (1.41E-02) | (2.55E-02) | (3.44E-02) | (4.29E-02) | (1.45E-01) | (1.78E-01) | (1.93E-01) | |||
| EAH06 | 116.45627 | 31.37838 | 2.59E-03 | 3.68E-03 | 3.04E-01 | 1.57E+00 | 3.03E+00 | 4.18E+00 | 5.29E+00 | 7.29E+00 | 9.03E+00 | 7.65E+00 |
| (4.89E-04) | (5.16E-04) | (1.57E-02) | (7.84E-02) | (1.52E-01) | (2.09E-01) | (2.65E-01) | (4.34E-01) | (5.71E-01) | (5.50E-01) | |||
| EAH07 | 167.82484 | 11.55439 | 9.85E-02 | 2.63E-01 | 1.19E+00 | 5.19E+00 | 8.54E+00 | 1.08E+01 | 1.30E+01 | 1.79E+01 | 1.94E+01 | 1.64E+01 |
| (8.80E-03) | (9.57E-03) | (6.00E-02) | (2.60E-01) | (4.27E-01) | (5.40E-01) | (6.54E-01) | (1.05E+00) | (1.27E+00) | (1.28E+00) | |||
| EAH08 | 147.07782 | 2.50116 | … | 7.08E-03 | 1.08E-01 | 5.47E-01 | 1.11E+00 | 1.58E+00 | 2.05E+00 | 2.40E+00 | 2.76E+00 | 2.78E+00 |
| … | (2.28E-03) | (6.36E-03) | (2.75E-02) | (5.55E-02) | (7.94E-02) | (1.04E-01) | (2.79E-01) | (3.62E-01) | (4.43E-01) | |||
| EAH09 | 227.22954 | 37.55827 | 7.42E-03 | 3.76E-02 | 3.61E-01 | 1.74E+00 | 3.22E+00 | 4.44E+00 | 5.64E+00 | 7.27E+00 | 9.19E+00 | 6.90E+00 |
| (2.82E-03) | (3.36E-03) | (1.85E-02) | (8.72E-02) | (1.61E-01) | (2.22E-01) | (2.83E-01) | (4.25E-01) | (5.80E-01) | (5.38E-01) | |||
| EAH10 | 158.42798 | 21.12799 | 2.87E-03 | 1.41E-02 | 6.51E-02 | 2.79E-01 | 4.94E-01 | 6.17E-01 | 7.71E-01 | 2.30E+00 | 3.49E+00 | 3.03E+00 |
| (5.14E-04) | (7.24E-04) | (1.89E-03) | (1.51E-03) | (2.23E-03) | (3.07E-03) | (7.09E-03) | (2.82E-01) | (4.46E-01) | (5.21E-01) | |||
| EAH11 | 166.41962 | 5.99841 | 3.39E-03 | 1.52E-02 | 1.96E-01 | 1.08E+00 | 2.07E+00 | 2.85E+00 | 3.53E+00 | 4.37E+00 | 4.97E+00 | 4.44E+00 |
| (3.16E-03) | (3.80E-03) | (1.03E-02) | (5.41E-02) | (1.04E-01) | (1.42E-01) | (1.77E-01) | (2.83E-01) | (2.84E-01) | (2.48E-01) | |||
| EAH12 | 223.77269 | 13.28101 | … | 7.95E-03 | 6.02E-02 | 3.48E-01 | 7.16E-01 | 1.03E+00 | 1.32E+00 | 1.69E+00 | 1.87E+00 | 1.74E+00 |
| … | (1.03E-03) | (3.60E-03) | (1.75E-02) | (3.59E-02) | (5.18E-02) | (6.67E-02) | (9.50E-02) | (2.30E-01) | (1.37E-01) | |||
| EAH13 | 155.50328 | 22.16318 | 1.99E-02 | 5.26E-02 | 2.56E-01 | 1.03E+00 | 1.89E+00 | 2.44E+00 | 3.02E+00 | 3.98E+00 | 5.78E+00 | 4.75E+00 |
| (3.48E-03) | (3.62E-03) | (1.34E-02) | (2.09E-02) | (3.82E-02) | (4.94E-02) | (9.19E-02) | (2.97E-01) | (4.51E-01) | (4.52E-01) | |||
| EAH14 | 178.27686 | 64.29903 | 3.65E-03 | 1.98E-02 | 9.91E-02 | 4.41E-01 | 7.43E-01 | 9.64E-01 | 1.14E+00 | 1.88E+00 | 1.99E+00 | 2.21E+00 |
| (3.90E-03) | (4.78E-03) | (5.44E-03) | (9.01E-03) | (1.51E-02) | (1.96E-02) | (3.51E-02) | (2.33E-01) | (3.33E-01) | (3.93E-01) | |||
| EAH15 | 163.08520 | 5.82822 | 1.46E-02 | 6.10E-02 | 3.78E-01 | 1.71E+00 | 3.07E+00 | 4.14E+00 | 4.97E+00 | 8.31E+00 | 1.13E+01 | 7.83E+00 |
| (1.88E-03) | (2.48E-03) | (1.93E-02) | (3.45E-02) | (6.19E-02) | (8.34E-02) | (1.50E-01) | (5.70E-01) | (8.02E-01) | (7.76E-01) | |||
| EAH16 | 141.74037 | 42.52684 | 1.97E-02 | 6.49E-02 | 2.24E-01 | 6.75E-01 | 1.14E+00 | 1.46E+00 | 1.79E+00 | 2.54E+00 | 3.34E+00 | 3.16E+00 |
| (1.25E-03) | (1.95E-03) | (1.17E-02) | (1.37E-02) | (2.31E-02) | (2.96E-02) | (5.48E-02) | (2.51E-01) | (4.28E-01) | (4.26E-01) | |||
| EAH17 | 191.21539 | -1.75990 | 4.35E-03 | 8.52E-03 | 7.68E-02 | 3.63E-01 | 7.25E-01 | 1.02E+00 | 1.31E+00 | 1.47E+00 | 1.86E+00 | 1.41E+00 |
| (2.71E-03) | (2.59E-03) | (5.08E-03) | (7.50E-03) | (1.48E-02) | (2.09E-02) | (4.16E-02) | (1.39E-01) | (1.65E-01) | (2.02E-01) | |||
| EAH18 | 245.25338 | 21.16836 | 8.73E-03 | 4.26E-02 | 6.43E-01 | 3.02E+00 | 5.62E+00 | 7.51E+00 | 9.01E+00 | 1.34E+01 | 1.94E+01 | 1.28E+01 |
| (3.85E-03) | (3.63E-03) | (3.27E-02) | (1.51E-01) | (2.81E-01) | (3.76E-01) | (4.51E-01) | (9.00E-01) | (1.45E+00) | (1.11E+00) | |||
| EAS01 | 11.24684 | -8.88968 | 1.23E-02 | 1.02E-01 | 1.53E+00 | 6.67E+00 | 1.18E+01 | 1.58E+01 | 1.93E+01 | 2.59E+01 | 3.16E+01 | 2.47E+01 |
| (1.74E-03) | (3.33E-03) | (7.71E-02) | (1.34E-01) | (2.36E-01) | (3.18E-01) | (5.80E-01) | (1.43E+00) | (1.77E+00) | (1.67E+00) | |||
| EAS02 | 49.22881 | -0.04198 | 6.23E-03 | 3.49E-02 | 4.41E-01 | 2.01E+00 | 3.89E+00 | 5.45E+00 | 6.99E+00 | 7.72E+00 | 9.43E+00 | 8.54E+00 |
| (1.57E-03) | (1.54E-03) | (2.28E-02) | (1.00E-01) | (1.95E-01) | (2.73E-01) | (3.51E-01) | (5.34E-01) | (7.82E-01) | (8.26E-01) | |||
| EAS03 | 117.80962 | 34.41820 | 1.09E-02 | 9.09E-03 | 1.36E-01 | 8.93E-01 | 1.91E+00 | 2.79E+00 | 3.58E+00 | 4.65E+00 | 5.31E+00 | 5.09E+00 |
| (3.68E-03) | (2.12E-03) | (7.66E-03) | (4.47E-02) | (9.57E-02) | (1.40E-01) | (1.80E-01) | (3.16E-01) | (4.10E-01) | (4.45E-01) | |||
| EAS04 | 126.75582 | 21.70678 | 2.14E-02 | 1.55E-01 | 1.56E+00 | 5.88E+00 | 1.00E+01 | 1.34E+01 | 1.66E+01 | 2.36E+01 | 2.71E+01 | 2.39E+01 |
| (2.14E-03) | (4.50E-03) | (7.84E-02) | (1.18E-01) | (2.02E-01) | (2.69E-01) | (5.01E-01) | (1.27E+00) | (1.57E+00) | (1.40E+00) | |||
| EAS05 | 146.11234 | 4.49912 | 1.52E-02 | 4.71E-02 | 2.96E-01 | 1.39E+00 | 2.62E+00 | 3.68E+00 | 4.78E+00 | 6.17E+00 | 7.59E+00 | 5.56E+00 |
| (1.73E-03) | (2.00E-03) | (1.54E-02) | (6.94E-02) | (1.31E-01) | (1.84E-01) | (2.40E-01) | (4.43E-01) | (5.55E-01) | (6.13E-01) | |||
| EAS06 | 159.48898 | 46.24451 | 5.55E-04 | 1.72E-02 | 2.18E-01 | 1.18E+00 | 2.56E+00 | 3.81E+00 | 5.03E+00 | 6.74E+00 | 8.13E+00 | 7.34E+00 |
| (2.65E-03) | (4.05E-03) | (1.17E-02) | (2.39E-02) | (5.15E-02) | (7.68E-02) | (1.52E-01) | (4.22E-01) | (6.28E-01) | (5.47E-01) | |||
| EAS07 | 169.78174 | 58.05397 | 2.49E-02 | 1.17E-01 | 9.60E-01 | 4.08E+00 | 7.24E+00 | 9.81E+00 | 1.18E+01 | 1.59E+01 | 1.95E+01 | 1.67E+01 |
| (2.01E-03) | (3.47E-03) | (6.27E-03) | (8.26E-03) | (1.33E-02) | (1.80E-02) | (3.25E-02) | (5.40E-01) | (1.00E+00) | (8.14E-01) | |||
| EAS08 | 189.90020 | 12.43889 | 2.77E-02 | 7.96E-02 | 7.05E-01 | 2.88E+00 | 5.48E+00 | 7.47E+00 | 9.30E+00 | 1.36E+01 | 1.33E+01 | 1.12E+01 |
| (2.35E-03) | (2.67E-03) | (3.61E-02) | (5.80E-02) | (1.10E-01) | (1.50E-01) | (2.81E-01) | (7.85E-01) | (9.38E-01) | (8.45E-01) | |||
| EAS09 | 191.61182 | 50.79206 | 1.88E-02 | 5.76E-02 | 8.32E-01 | 4.18E+00 | 7.86E+00 | 1.10E+01 | 1.38E+01 | 1.95E+01 | 2.58E+01 | 1.96E+01 |
| (2.82E-03) | (3.53E-03) | (4.21E-02) | (8.41E-02) | (1.58E-01) | (2.21E-01) | (4.15E-01) | (1.08E+00) | (1.46E+00) | (1.27E+00) | |||
| EAS10 | 196.35760 | 53.59176 | 1.82E-02 | 6.65E-02 | 8.05E-01 | 3.53E+00 | 6.17E+00 | 8.02E+00 | 9.36E+00 | 1.29E+01 | 1.57E+01 | 1.22E+01 |
| (4.35E-03) | (4.53E-03) | (5.72E-02) | (1.90E-01) | (3.32E-01) | (4.32E-01) | (5.46E-01) | (7.36E-01) | (9.58E-01) | (8.55E-01) | |||
| EAS11 | 242.58536 | 41.85488 | 6.47E-03 | 9.41E-02 | 1.15E+00 | 4.90E+00 | 8.69E+00 | 1.15E+01 | 1.38E+01 | 1.77E+01 | 2.66E+01 | 2.06E+01 |
| (3.34E-03) | (4.68E-03) | (5.81E-02) | (2.45E-01) | (4.35E-01) | (5.74E-01) | (6.91E-01) | (1.07E+00) | (1.62E+00) | (1.36E+00) | |||
| EAS12 | 243.37578 | 51.05988 | 1.39E-01 | 2.46E-01 | 6.27E-01 | 1.72E+00 | 2.19E+00 | 2.54E+00 | 2.79E+00 | 2.46E+00 | 2.30E+00 | 2.02E+00 |
| (7.69E-03) | (6.60E-03) | (3.23E-02) | (8.62E-02) | (1.10E-01) | (1.28E-01) | (1.41E-01) | (2.66E-01) | (3.69E-01) | (4.27E-01) | |||
| EAS13 | 246.76067 | 43.47609 | 1.85E-02 | 5.67E-02 | 5.44E-01 | 2.82E+00 | 5.76E+00 | 8.10E+00 | 1.03E+01 | 1.38E+01 | 1.63E+01 | 1.45E+01 |
| (5.61E-03) | (5.76E-03) | (3.90E-02) | (1.52E-01) | (3.10E-01) | (4.37E-01) | (6.02E-01) | (8.56E-01) | (1.13E+00) | (1.17E+00) | |||
| EAS14 | 316.28613 | -5.39983 | 4.21E-03 | 2.06E-02 | 2.75E-01 | 1.58E+00 | 3.51E+00 | 5.14E+00 | 6.75E+00 | 8.19E+00 | 9.86E+00 | 8.66E+00 |
| (3.59E-03) | (3.51E-03) | (1.54E-02) | (3.19E-02) | (7.07E-02) | (1.04E-01) | (2.05E-01) | (5.27E-01) | (7.62E-01) | (7.51E-01) | |||
| EAS15 | 343.77832 | 0.97776 | 2.76E-02 | 6.67E-02 | 5.01E-01 | 1.97E+00 | 3.91E+00 | 5.55E+00 | 7.10E+00 | 1.52E+01 | 1.57E+01 | 1.35E+01 |
| (6.65E-03) | (5.97E-03) | (2.57E-02) | (3.98E-02) | (7.86E-02) | (1.12E-01) | (2.15E-01) | (1.04E+00) | (1.25E+00) | (1.32E+00) | |||
| F34 | 135.03564 | 20.84439 | 3.75E-03 | 1.33E-02 | 1.26E-01 | 5.36E-01 | 9.64E-01 | 1.31E+00 | 1.56E+00 | 1.69E+00 | 2.49E+00 | 2.70E+00 |
| (4.76E-04) | (6.20E-04) | (9.44E-03) | (2.90E-02) | (5.20E-02) | (7.08E-02) | (9.19E-02) | (2.16E-01) | (2.89E-01) | (3.40E-01) | |||
| F35 | 155.00089 | 8.22606 | 1.63E-03 | 9.79E-03 | 1.08E-01 | 6.69E-01 | 1.50E+00 | 2.35E+00 | 3.29E+00 | 4.45E+00 | 4.94E+00 | 3.91E+00 |
| (2.05E-03) | (2.80E-03) | (6.43E-03) | (1.37E-02) | (3.04E-02) | (4.77E-02) | (1.01E-01) | (3.99E-01) | (5.74E-01) | (6.05E-01) | |||
| F36 | 178.10641 | -1.26746 | 1.30E-03 | 1.11E-02 | 8.27E-02 | 4.20E-01 | 7.80E-01 | 1.28E+00 | 1.38E+00 | 1.89E+00 | 2.35E+00 | 2.33E+00 |
| (4.91E-04) | (7.01E-04) | (4.59E-03) | (8.58E-03) | (1.58E-02) | (2.60E-02) | (4.26E-02) | (1.80E-01) | (2.31E-01) | (1.64E-01) | |||
| F37 | 245.25339 | 21.16836 | 6.61E-04 | 4.76E-02 | 6.43E-01 | 3.02E+00 | 5.62E+00 | 7.51E+00 | 9.01E+00 | 1.34E+01 | 1.94E+01 | 1.28E+01 |
| (2.71E-03) | (3.90E-03) | (3.27E-02) | (6.08E-02) | (1.13E-01) | (1.51E-01) | (2.72E-01) | (9.00E-01) | (1.45E+00) | (1.11E+00) | |||
| A1 | 183.87215 | 13.73560 | 5.12E-03 | 1.80E-02 | 6.83E-02 | 1.90E-01 | 3.44E-01 | 5.05E-01 | 6.03E-01 | 3.84E-01 | 7.01E-01 | 8.88E-01 |
| (9.14E-04) | (1.07E-03) | (5.09E-03) | (4.19E-03) | (7.36E-03) | (1.07E-02) | (2.11E-02) | (6.24E-02) | (1.68E-01) | (1.28E-01) | |||
| A2 | 185.90395 | 8.73016 | 2.09E-02 | 2.81E-02 | 1.07E-01 | 3.02E-01 | 5.09E-01 | 7.39E-01 | 8.85E-01 | 7.28E-01 | 7.51E-01 | 9.84E-01 |
| (2.37E-03) | (2.01E-03) | (8.22E-03) | (6.67E-03) | (1.10E-02) | (1.61E-02) | (3.37E-02) | (9.37E-02) | (1.36E-01) | (1.89E-01) | |||
| A3 | 188.27840 | 62.26692 | 8.29E-03 | 1.76E-02 | 7.37E-02 | 2.82E-01 | 6.79E-01 | 1.03E+00 | 1.37E+00 | 1.73E+00 | 1.74E+00 | 2.21E+00 |
| (1.37E-03) | (1.09E-03) | (5.09E-03) | (5.99E-03) | (1.40E-02) | (2.14E-02) | (4.56E-02) | (2.45E-01) | (3.71E-01) | (3.73E-01) | |||
| A4 | 197.36469 | 30.17020 | 5.79E-02 | 1.22E-01 | 2.26E-01 | 5.65E-01 | 8.82E-01 | 1.11E+00 | 1.25E+00 | 2.02E+00 | 2.32E+00 | 2.54E+00 |
| (8.83E-03) | (7.65E-03) | (1.17E-02) | (1.15E-02) | (1.79E-02) | (2.25E-02) | (3.85E-02) | (2.22E-01) | (3.07E-01) | (3.49E-01) | |||
| A5 | 198.76463 | 24.61884 | 1.39E-02 | 1.61E-01 | 2.00E+00 | 8.59E+00 | 1.62E+01 | 2.25E+01 | 2.76E+01 | 3.78E+01 | 4.86E+01 | 3.86E+01 |
| (3.31E-03) | (6.55E-03) | (1.02E-01) | (1.73E-01) | (3.27E-01) | (4.51E-01) | (8.30E-01) | (1.99E+00) | (2.59E+00) | (2.17E+00) | |||
| A6 | 200.09401 | 32.78479 | 3.02E-03 | 1.16E-02 | 5.25E-02 | 1.86E-01 | 3.29E-01 | 5.06E-01 | 5.85E-01 | 7.00E-01 | 7.07E-01 | 8.45E-01 |
| (2.48E-03) | (2.86E-03) | (3.87E-03) | (4.00E-03) | (6.94E-03) | (1.06E-02) | (2.00E-02) | (9.44E-02) | (8.81E-02) | (1.78E-01) | |||
| A7 | 200.74947 | 27.11643 | 1.81E-01 | 3.34E-01 | 1.44E+00 | 6.68E+00 | 1.22E+01 | 1.66E+01 | 2.02E+01 | 2.45E+01 | 2.89E+01 | 2.41E+01 |
| (1.01E-02) | (9.12E-03) | (7.25E-02) | (1.34E-01) | (2.44E-01) | (3.33E-01) | (6.07E-01) | (1.39E+00) | (1.82E+00) | (1.55E+00) | |||
| A8 | 203.56174 | 34.19415 | 7.41E-03 | 4.05E-02 | 3.75E-01 | 1.61E+00 | 3.23E+00 | 4.68E+00 | 6.07E+00 | 8.40E+00 | 9.55E+00 | 8.32E+00 |
| (3.58E-03) | (4.53E-03) | (2.00E-02) | (3.27E-02) | (6.51E-02) | (9.46E-02) | (1.85E-01) | (5.82E-01) | (7.85E-01) | (7.09E-01) | |||
| A9 | 212.76057 | 25.51935 | 1.79E-02 | 7.28E-02 | 6.89E-01 | 1.96E+00 | 4.36E+00 | 6.32E+00 | 9.69E+00 | 1.41E+01 | 1.89E+01 | 1.57E+01 |
| (7.59E-03) | (8.04E-03) | (3.49E-02) | (3.96E-02) | (8.79E-02) | (1.27E-01) | (2.92E-01) | (8.27E-01) | (1.16E+00) | (1.03E+00) | |||
| A10 | 213.29910 | -0.39937 | 9.76E-03 | 1.58E-02 | 3.65E-02 | 1.44E-01 | 3.02E-01 | 4.63E-01 | 6.19E-01 | 6.07E-01 | 4.44E-01 | 6.67E-01 |
| (8.46E-04) | (1.09E-03) | (3.11E-03) | (3.20E-03) | (6.44E-03) | (9.84E-03) | (2.23E-02) | (1.36E-01) | (1.01E-01) | (2.38E-01) | |||
| A11 | 232.70238 | 55.32884 | 2.25E-03 | 1.20E-02 | 9.41E-02 | 4.26E-01 | 8.03E-01 | 1.12E+00 | 1.38E+00 | 1.99E+00 | 2.14E+00 | 2.13E+00 |
| (2.54E-03) | (3.15E-03) | (5.71E-03) | (8.75E-03) | (1.64E-02) | (2.27E-02) | (4.31E-02) | (2.13E-01) | (2.77E-01) | (3.37E-01) | |||
| A12 | 237.80305 | 14.69640 | 2.43E-02 | 5.43E-02 | 3.92E-01 | 1.73E+00 | 3.05E+00 | 4.12E+00 | 5.09E+00 | 5.78E+00 | 6.98E+00 | 6.20E+00 |
| (4.88E-03) | (4.83E-03) | (2.02E-02) | (3.48E-02) | (6.15E-02) | (8.30E-02) | (1.54E-01) | (4.51E-01) | (6.32E-01) | (6.25E-01) | |||
| ID | WISE (mJy) | Herschel-PACS (mJy) | Herschel-SPIRE (mJy) | |||||||
|---|---|---|---|---|---|---|---|---|---|---|
| W1(3.6m) | W2(4.5m) | W3(12m) | W4(22m) | 70m | 100m | 160m | 250m | 350m | 500m | |
| R1 | 3.71E+00 | 2.93E+00 | 3.00E+01 | 1.62E+02 | 1.15E+03 | 1.24E+03 | 9.70E+02 | 3.90E+02 | 1.68E+02 | 6.09E+01 |
| (2.39E-02) | (2.70E-02) | (1.66E-01) | (1.79E+00) | (2.33E+01) | (3.35E+01) | (3.16E+01) | (1.49E+01) | (1.96E+01) | (1.72E+01) | |
| R2 | 7.79E+00 | 6.23E+00 | 5.35E+01 | 2.30E+02 | 3.58E+03 | 3.76E+03 | 2.58E+03 | 9.10E+02 | 3.21E+02 | 1.05E+02 |
| (4.30E-02) | (4.01E-02) | (2.95E-01) | (1.48E+00) | (5.64E+01) | (8.14E+01) | (6.16E+01) | (1.94E+01) | (1.65E+01) | (1.88E+01) | |
| R3 | 4.57E+00 | 3.56E+00 | 2.62E+01 | 1.60E+02 | 8.42E+02 | 8.13E+02 | 5.62E+02 | 2.02E+02 | 8.71E+01 | … |
| (2.94E-02) | (2.94E-02) | (1.93E-01) | (3.24E+00) | (2.09E+01) | (2.63E+01) | (4.23E+01) | (1.78E+01) | (1.88E+01) | … | |
| R4 | 6.61E+00 | 4.66E+00 | 3.54E+01 | 8.19E+01 | 1.52E+03 | 1.96E+03 | 2.01E+03 | 8.16E+02 | 3.48E+02 | 1.31E+02 |
| (3.65E-02) | (3.00E-02) | (1.95E-01) | (9.79E-01) | (3.41E+01) | (4.79E+01) | (5.62E+01) | (1.59E+01) | (1.86E+01) | (1.93E+01) | |
| R5 | 3.38E+00 | 2.99E+00 | 3.78E+01 | 1.81E+02 | 1.15E+03 | 1.28E+03 | 1.01E+03 | 4.13E+02 | 1.67E+02 | 5.25E+01 |
| (2.18E-02) | (2.48E-02) | (2.43E-01) | (2.16E+00) | (1.85E+01) | (3.15E+01) | (3.98E+01) | (1.40E+01) | (1.31E+01) | (1.20E+01) | |
| R6 | 3.40E+00 | 2.18E+00 | 1.05E+01 | 2.76E+01 | 4.11E+02 | 5.46E+02 | 6.01E+02 | … | … | … |
| (1.88E-02) | (1.60E-02) | (8.72E-02) | (9.41E-01) | (1.22E+01) | (1.79E+01) | (2.90E+01) | … | … | … | |
| R7 | 1.78E+00 | 1.14E+00 | 7.57E+00 | 1.57E+01 | 1.80E+02 | 2.51E+02 | 2.07E+02 | 9.29E+01 | 2.67E+01 | … |
| (3.93E-02) | (2.93E-02) | (2.30E-01) | (1.18E+00) | (5.28E+00) | (1.20E+01) | (2.41E+01) | (8.90E+00) | (8.10E+00) | … | |
| R9 | 1.39E+00 | 8.31E-01 | 3.29E+00 | 5.25E+00 | 1.49E+02 | 2.58E+02 | 3.10E+02 | … | … | … |
| (8.96E-03) | (9.94E-03) | (3.63E-02) | (4.49E-01) | (7.44E+00) | (1.28E+01) | (1.80E+01) | … | … | … | |
| R10 | 2.74E+00 | 1.92E+00 | 1.09E+01 | 2.33E+01 | 7.44E+02 | 1.01E+03 | 9.57E+02 | 4.06E+02 | 1.57E+02 | 6.07E+01 |
| (1.51E-02) | (2.12E-02) | (9.04E-02) | (9.87E-01) | (2.02E+01) | (2.96E+01) | (4.46E+01) | (1.29E+01) | (1.38E+01) | (1.31E+01) | |
| F34 | 1.03E+00 | 6.20E-01 | 1.30E+00 | 4.05E+00 | … | 3.33E+01 | … | … | 5.93E+01 | 4.21E+01 |
| (6.64E-02) | (4.20E-02) | (1.72E-01) | (1.22E+00) | … | (1.11E+01) | … | … | (1.06E+01) | (9.85E+00) | |
| F35 | 1.88E+00 | 1.45E+00 | 1.41E+01 | 1.98E+02 | 6.17E+03 | 5.59E+03 | 3.12E+03 | 1.20E+03 | 4.70E+02 | 1.70E+02 |
| (1.30E-01) | (9.98E-02) | (9.55E-01) | (1.42E+01) | (4.40E+02) | (4.03E+02) | (2.24E+02) | (8.61E+01) | (3.54E+01) | (1.70E+01) | |
| F36 | 1.34E+00 | 8.88E-01 | 3.57E+00 | 1.34E+01 | … | … | 9.37E+01 | 6.09E+01 | 5.03E+01 | … |
| (8.61E-02) | (5.90E-02) | (2.68E-01) | (1.52E+00) | … | … | (6.01E+01) | (1.56E+01) | (1.52E+01) | … | |
| F37 | 4.71E+00 | 2.61E+00 | 1.95E+00 | 4.39E+00 | 5.90E+01 | 7.77E+01 | 6.48E+01 | … | … | … |
| (2.84E-01) | (1.58E-01) | (1.44E-01) | (8.73E-01) | (6.37E+00) | (1.07E+01) | (1.27E+01) | … | … | … | |
| A1 | 4.02E-01 | 3.34E-01 | 1.95E+00 | 7.02E+00 | … | 7.48E+01 | 8.46E+01 | 4.84E+01 | … | … |
| (2.66E-02) | (2.50E-02) | (1.83E-01) | (1.19E+00) | … | (1.33E+01) | (2.77E+01) | (1.52E+01) | … | … | |
| A2 | 4.48E-01 | 3.07E-01 | 1.91E+00 | 3.20E+00 | … | 7.60E+01 | 1.47E+02 | 7.39E+01 | … | … |
| (2.98E-02) | (2.37E-02) | (1.89E-01) | (1.10E+00) | … | (1.52E+01) | (2.88E+01) | (1.27E+01) | … | … | |
| A3 | 9.19E-01 | 7.44E-01 | 2.18E+00 | 6.41E+00 | … | … | … | 1.31E+02 | 5.86E+01 | 3.41E+01 |
| (5.91E-02) | (4.83E-02) | (1.82E-01) | (1.07E+00) | … | … | … | (1.35E+01) | (1.15E+01) | (7.68E+00) | |
| A4 | 1.23E+00 | 9.71E-01 | 6.23E+00 | 1.74E+01 | … | … | … | 1.04E+02 | 8.53E+01 | 6.35E+01 |
| (7.87E-02) | (6.27E-02) | (4.07E-01) | (1.37E+00) | … | … | … | (1.38E+01) | (1.67E+01) | (1.48E+01) | |
| A5 | 1.70E+01 | 1.03E+01 | 4.16E+01 | 5.78E+02 | 1.97E+04 | 1.81E+04 | 1.05E+04 | 4.15E+03 | 1.69E+03 | 5.90E+02 |
| (1.02E+00) | (6.23E-01) | (2.51E+00) | (3.48E+01) | (1.41E+03) | (1.31E+03) | (7.55E+02) | (2.94E+02) | (1.21E+02) | (4.77E+01) | |
| A6 | 5.35E-01 | 4.33E-01 | 4.72E+00 | 1.92E+01 | … | … | … | 8.94E+01 | 7.48E+01 | 4.55E+01 |
| (3.47E-02) | (2.97E-02) | (3.27E-01) | (1.50E+00) | … | … | … | (1.52E+01) | (1.79E+01) | (1.52E+01) | |
| A7 | 1.04E+01 | 5.90E+00 | 1.28E+01 | 1.24E+01 | … | … | … | 2.81E+02 | 1.31E+02 | 5.22E+01 |
| (6.27E-01) | (3.56E-01) | (7.90E-01) | (1.36E+00) | … | … | … | (2.35E+01) | (1.58E+01) | (1.24E+01) | |
| A8 | 2.42E+00 | 1.37E+00 | 2.65E+00 | 5.29E+00 | … | … | … | 1.33E+02 | 7.80E+01 | 3.63E+01 |
| (1.46E-01) | (8.31E-02) | (1.77E-01) | (9.91E-01) | … | … | … | (1.72E+01) | (1.47E+01) | (1.23E+01) | |
| A9 | 6.61E+00 | 4.28E+00 | 1.37E+01 | 4.19E+01 | 2.34E+03 | … | 2.24E+03 | 8.95E+02 | 3.39E+02 | 1.08E+02 |
| (3.98E-01) | (2.59E-01) | (8.28E-01) | (2.71E+00) | (1.67E+02) | … | (1.64E+02) | (6.33E+01) | (2.53E+01) | (1.06E+01) | |
| A10 | 5.48E-01 | 5.28E-01 | 2.43E+00 | 3.32E+00 | … | 8.40E+01 | 9.99E+01 | 7.03E+01 | 3.44E+01 | 3.65E+01 |
| (3.58E-02) | (3.67E-02) | (1.95E-01) | (9.26E-01) | … | (1.29E+01) | (3.55E+01) | (1.11E+01) | (1.12E+01) | (1.18E+01) | |
| A11 | 1.01E+00 | 8.11E-01 | 2.23E+00 | 6.72E+00 | 4.24E+01 | 4.15E+01 | … | … | … | 3.40E+01 |
| (6.49E-02) | (5.21E-02) | (1.58E-01) | (7.53E-01) | (7.20E+00) | (1.27E+01) | … | … | … | (1.02E+01) | |
| A12 | 3.08E+00 | 1.80E+00 | 2.81E+00 | 7.86E+00 | 3.03E+01 | 5.37E+01 | 8.29E+01 | 6.19E+01 | 4.45E+01 | 3.13E+01 |
| (1.86E-01) | (1.14E-01) | (2.29E-01) | (3.10E+00) | (6.83E+00) | (1.01E+01) | (1.74E+01) | (9.81E+00) | (1.04E+01) | (9.17E+00) | |
| ID | r50 | log M⋆ | log Mdust | log Mdust/M⋆ | log Mgas | SFRuncor | SFRcor |
|---|---|---|---|---|---|---|---|
| (arcsec) | () | () | () | ( yr-1) | ( yr-1) | ||
| R1 | 2.08 | 9.82 | 7.490.07 | -2.330.23 | 8.50 | 6.740.05 | 6.550.06 |
| R2 | 3.77 | 10.63 | 7.850.02 | -2.780.15 | 9.710.04 | 9.250.05 | 8.970.06 |
| R3 | 1.41 | 9.63 | 6.890.13 | -2.740.18 | 8.610.14 | 6.420.04 | 5.950.06 |
| R4 | 4.90 | 10.28 | 7.650.11 | -2.630.19 | 9.800.04 | 1.940.02 | 2.170.02 |
| R5 | 1.95 | 9.83 | 7.390.05 | -2.440.10 | 9.790.02 | 3.150.02 | 2.710.03 |
| R6 | 4.15 | 10.44 | 7.680.14 | -2.760.16 | 9.580.05 | 2.470.02 | 1.860.02 |
| R7 | 1.92 | 10.16 | 7.020.11 | -3.140.14 | 9.560.07 | 1.050.01 | 0.920.01 |
| R9 | 2.90 | 10.28 | 7.600.10 | -2.680.13 | 9.660.04 | 0.420.01 | 0.390.01 |
| R10 | 4.72 | 10.21 | 7.580.06 | -2.630.11 | 9.450.05 | 0.980.01 | 1.010.01 |
| EAH01 | 2.09 | 10.45 | 7.580.02 | -2.870.12 | 9.710.06 | 0.060.01 | 0.010.01 |
| EAH02 | 1.71 | 10.39 | 6.640.02 | -3.750.11 | 9.530.09 | 0.030.01 | 0.010.01 |
| EAH03 | 3.17 | 10.34 | 7.510.02 | -2.830.11 | 9.800.05 | 0.020.01 | |
| EAH04 | 2.98 | 10.18 | 6.320.12 | -3.860.16 | 8.560.09 | 0.070.01 | 0.020.01 |
| EAH05 | 1.42 | 10.81 | 7.540.02 | -3.270.14 | 9.560.09 | 0.060.01 | 0.040.01 |
| EAH06 | 1.93 | 10.12 | 6.750.10 | -3.370.15 | 9.00 | 0.370.04 | … |
| EAH07 | 3.69 | 9.88 | 6.750.10 | -3.130.13 | 8.62 | 0.220.02 | … |
| EAH08 | 1.67 | 10.07 | 8.020.12 | -2.050.16 | 9.150.15 | 0.040.01 | … |
| EAH09 | 1.81 | 11.01 | 6.520.11 | -4.490.16 | 8.500.13 | 0.060.01 | 0.010.01 |
| EAH10 | 1.22 | 10.24 | 7.720.08 | -2.520.13 | 9.860.12 | 0.040.03 | 0.010.01 |
| EAH11 | 1.09 | 10.64 | 6.330.15 | -4.310.18 | 9.19 | 0.170.02 | … |
| EAH12 | 0.96 | 9.89 | 6.400.03 | -3.490.11 | 9.42 | 0.180.03 | 0.050.02 |
| EAH13 | 1.50 | 11.00 | 7.640.19 | -3.360.22 | 9.890.08 | 0.620.14 | … |
| EAH14 | 1.18 | 10.04 | 5.960.24 | -4.080.27 | 9.25 | 0.100.01 | 0.010.01 |
| EAH15 | 1.52 | 10.40 | 6.440.22 | -3.960.25 | 9.04 | 0.060.01 | 0.010.01 |
| EAH16 | 1.37 | 10.74 | 6.940.46 | -3.800.47 | 9.79 | 0.510.09 | … |
| EAH17 | 1.49 | 10.05 | 6.800.32 | -3.250.34 | 9.01 | 0.050.01 | 0.020.01 |
| EAH18 | 3.33 | 10.38 | 5.780.18 | -4.600.21 | 8.680.15 | 0.030.01 | |
| EAS01 | 4.39 | 10.24 | 5.320.10 | -4.920.15 | 8.40 | 0.010.01 | |
| EAS02 | 3.72 | 10.37 | 6.270.14 | -4.100.17 | 8.710.13 | 0.030.01 | 0.010.01 |
| EAS03 | 2.34 | 10.34 | 7.200.14 | -3.140.17 | 9.760.06 | 0.170.02 | 0.020.01 |
| EAS04 | 3.12 | 9.99 | 5.430.16 | -4.560.19 | 7.74 | 0.010.01 | … |
| EAS05 | 2.74 | 11.33 | 7.090.10 | -4.240.14 | 9.090.14 | 0.110.02 | 0.040.01 |
| EAS06 | 2.91 | 10.14 | 6.610.08 | -3.530.12 | 9.230.04 | 0.060.01 | 0.030.01 |
| EAS07 | 2.34 | 10.54 | 5.901.04 | -4.641.05 | 8.64 | 0.040.02 | |
| EAS08 | 4.25 | 10.67 | 6.410.88 | -4.260.89 | 8.60 | 0.050.03 | |
| EAS09 | 3.27 | 10.56 | 6.880.03 | -3.680.11 | 9.120.06 | 0.040.01 | 0.010.01 |
| EAS10 | 2.03 | 10.53 | 5.640.03 | -4.890.11 | 8.79 | 0.020.01 | … |
| EAS11 | 3.04 | 10.71 | 6.590.12 | -4.120.18 | 8.84 | 0.080.02 | 0.020.01 |
| EAS12 | 6.39 | 10.80 | 7.330.17 | -3.470.20 | 8.540.14 | 0.030.01 | … |
| EAS13 | 3.80 | 10.95 | 7.500.33 | -3.450.34 | 9.12 | 0.090.02 | |
| EAS14 | 3.72 | 11.31 | 7.490.24 | -3.820.26 | 9.700.09 | 0.410.07 | … |
| EAS15 | 2.82 | 10.83 | 6.880.21 | -3.950.23 | 9.080.14 | 0.170.05 | |
| F34 | 1.77 | 10.20 | 8.400.08 | -1.800.14 | 9.830.15 | 0.030.01 | 0.010.01 |
| F35 | 2.73 | 10.64 | 8.180.06 | -2.460.11 | 9.800.15 | 0.080.01 | 0.040.01 |
| F36 | 1.11 | 10.28 | 7.330.24 | -2.950.27 | 9.320.15 | 0.610.13 | … |
| F37 | 3.33 | 10.38 | 6.260.24 | -4.120.26 | 8.820.15 | 0.030.01 | |
| A1 | 2.18 | 10.64 | 7.860.32 | -2.780.33 | 9.570.15 | 3.890.09 | 0.510.21 |
| A2 | 5.38 | 9.98 | 7.890.26 | -2.090.51 | 9.590.15 | 0.350.01 | 0.360.01 |
| A3 | 2.70 | 11.30 | 8.890.19 | -2.410.21 | 10.060.15 | 14.250.44 | 3.190.54 |
| A4 | 1.11 | 10.79 | 8.470.18 | -2.320.19 | 9.860.15 | 27.710.90 | 12.041.29 |
| A5 | 6.41 | 10.19 | 8.070.04 | -2.120.10 | 9.400.08 | 0.130.01 | 0.020.01 |
| A6 | 1.77 | 10.34 | 7.990.13 | -2.350.16 | 9.630.15 | 7.040.08 | 6.170.12 |
| A7 | 7.41 | 10.80 | 7.820.14 | -2.980.18 | 9.550.15 | 0.190.01 | 0.050.01 |
| A8 | 5.43 | 10.15 | 7.560.21 | -2.590.23 | 9.430.15 | 0.140.01 | 0.050.01 |
| A9 | 4.40 | 10.59 | 7.800.02 | -2.790.10 | 9.540.15 | 1.130.02 | 0.610.03 |
| A10 | 2.62 | 10.65 | 8.190.19 | -2.460.21 | 9.730.15 | 1.040.03 | 0.780.05 |
| A11 | 1.51 | 10.00 | 8.190.19 | -1.810.22 | 9.010.11 | 0.190.01 | 0.040.01 |
| A12 | 2.66 | 10.51 | 7.680.30 | -2.830.32 | 8.860.06 | 0.220.01 | 0.050.01 |
References
- Abolfathi et al. (2018) Abolfathi, B., Aguado, D. S., Aguilar, G., et al. 2018, The Astrophysical Journal Supplement Series, 235, 42
- Agius et al. (2013) Agius, N. K., Sansom, A. E., Popescu, C. C., et al. 2013, MNRAS, 431, 1929
- Aihara et al. (2011) Aihara, H., Allende Prieto, C., An, D., et al. 2011, ApJS, 193, 29
- Alatalo et al. (2016a) Alatalo, K., Cales, S. L., Rich, J. A., et al. 2016a, ApJS, 224, 38
- Alatalo et al. (2016b) Alatalo, K., Lisenfeld, U., Lanz, L., et al. 2016b, ApJ, 827, 106
- Baldwin et al. (1981) Baldwin, J. A., Phillips, M. M., & Terlevich, R. 1981, Publications of the Astronomical Society of the Pacific, 93, 5
- Balog et al. (2014) Balog, Z., Müller, T., Nielbock, M., et al. 2014, Experimental Astronomy, 37, 129
- Baron et al. (2017) Baron, D., Netzer, H., Poznanski, D., Prochaska, J. X., & Förster Schreiber, N. M. 2017, MNRAS, 470, 1687
- Baron et al. (2018) Baron, D., Netzer, H., Prochaska, J. X., et al. 2018, MNRAS, 480, 3993
- Blanton & Roweis (2007) Blanton, M. R., & Roweis, S. 2007, AJ, 133, 734
- Bolatto et al. (2013) Bolatto, A. D., Wolfire, M., & Leroy, A. K. 2013, Annual Review of Astronomy and Astrophysics, 51, 207
- Boquien et al. (2019) Boquien, M., Burgarella, D., Roehlly, Y., et al. 2019, A&A, 622, A103
- Brinchmann et al. (2004) Brinchmann, J., Charlot, S., White, S. D. M., et al. 2004, MNRAS, 351, 1151
- Bruzual & Charlot (2003) Bruzual, G., & Charlot, S. 2003, MNRAS, 344, 1000
- Bundy et al. (2015) Bundy, K., Bershady, M. A., Law, D. R., et al. 2015, ApJ, 798, 7
- Buyle et al. (2006) Buyle, P., Michielsen, D., De Rijcke, S., et al. 2006, ApJ, 649, 163
- Calzetti et al. (2000) Calzetti, D., Armus, L., Bohlin, R. C., et al. 2000, ApJ, 533, 682
- Cappellari et al. (2013) Cappellari, M., Scott, N., Alatalo, K., et al. 2013, MNRAS, 432, 1709
- Chabrier (2003) Chabrier, G. 2003, PASP, 115, 763
- Chang et al. (2001) Chang, T.-C., van Gorkom, J. H., Zabludoff, A. I., Zaritsky, D., & Mihos, J. C. 2001, AJ, 121, 1965
- Cicone et al. (2014) Cicone, C., Maiolino, R., Sturm, E., et al. 2014, A&A, 562, A21
- Ciesla et al. (2012) Ciesla, L., Boselli, A., Smith, M. W. L., et al. 2012, A&A, 543, A161
- Couch & Sharples (1987) Couch, W. J., & Sharples, R. M. 1987, MNRAS, 229, 423
- Cutri et al. (2015) Cutri, R. M., Mainzer, A., Conrow, T., et al. 2015, Explanatory Supplement to the NEOWISE Data Release Products, Tech. rep.
- da Cunha et al. (2008) da Cunha, E., Charlot, S., & Elbaz, D. 2008, MNRAS, 388, 1595
- da Cunha et al. (2010) da Cunha, E., Eminian, C., Charlot, S., & Blaizot, J. 2010, MNRAS, 403, 1894
- Dale et al. (2009) Dale, D. A., Cohen, S. A., Johnson, L. C., et al. 2009, ApJ, 703, 517
- Dale et al. (2012) Dale, D. A., Aniano, G., Engelbracht, C. W., et al. 2012, ApJ, 745, 95
- Davis et al. (2014) Davis, T. A., Young, L. M., Crocker, A. F., et al. 2014, MNRAS, 444, 3427
- Draine & Li (2007) Draine, B. T., & Li, A. 2007, ApJ, 657, 810
- Dressler & Gunn (1983) Dressler, A., & Gunn, J. E. 1983, ApJ, 270, 7
- French et al. (2015) French, K. D., Yang, Y., Zabludoff, A., et al. 2015, ApJ, 801, 1
- French et al. (2018a) French, K. D., Yang, Y., Zabludoff, A. I., & Tremonti, C. A. 2018a, ApJ, 862, 2
- French et al. (2018b) French, K. D., Zabludoff, A. I., Yoon, I., et al. 2018b, ApJ, 861, 123
- Gallazzi et al. (2005) Gallazzi, A., Charlot, S., Brinchmann, J., White, S. D. M., & Tremonti, C. A. 2005, MNRAS, 362, 41
- Gao & Solomon (2004) Gao, Y., & Solomon, P. M. 2004, ApJ, 606, 271
- Hayward et al. (2014) Hayward, C. C., Lanz, L., Ashby, M. L. N., et al. 2014, MNRAS, 445, 1598
- Isobe et al. (1986) Isobe, T., Feigelson, E. D., & Nelson, P. I. 1986, ApJ, 306, 490
- Jarrett et al. (2000) Jarrett, T. H., Chester, T., Cutri, R., et al. 2000, AJ, 119, 2498
- Jarrett et al. (2012) Jarrett, T. H., Masci, F., Tsai, C. W., et al. 2012, AJ, 144, 68
- Kelly (2007) Kelly, B. C. 2007, ApJ, 665, 1489
- Kennicutt (1998) Kennicutt, Jr., R. C. 1998, ApJ, 498, 541
- Kennicutt et al. (1994) Kennicutt, Jr., R. C., Tamblyn, P., & Congdon, C. E. 1994, ApJ, 435, 22
- Lanz et al. (2019) Lanz, L., Hickox, R. C., Baloković, M., et al. 2019, ApJ, 870, 26
- Lavalley et al. (1992) Lavalley, M., Isobe, T., & Feigelson, E. 1992, in Astronomical Society of the Pacific Conference Series, Vol. 25, Astronomical Data Analysis Software and Systems I, ed. D. M. Worrall, C. Biemesderfer, & J. Barnes, 245
- Leroy et al. (2013) Leroy, A. K., Walter, F., Sandstrom, K., et al. 2013, AJ, 146, 19
- Mainzer et al. (2011) Mainzer, A., Bauer, J., Grav, T., et al. 2011, ApJ, 731, 53
- Marton et al. (2017) Marton, G., Calzoletti, L., Perez Garcia, A. M., et al. 2017, ArXiv e-prints, arXiv:1705.05693
- Morrissey et al. (2007) Morrissey, P., Conrow, T., Barlow, T. A., et al. 2007, ApJS, 173, 682
- Noll et al. (2009) Noll, S., Burgarella, D., Giovannoli, E., et al. 2009, A&A, 507, 1793
- Norton et al. (2001) Norton, S. A., Gebhardt, K., Zabludoff, A. I., & Zaritsky, D. 2001, ApJ, 557, 150
- O’Donnell (1994) O’Donnell, J. E. 1994, ApJ, 422, 158
- Pawlik et al. (2016) Pawlik, M. M., Wild, V., Walcher, C. J., et al. 2016, MNRAS, 456, 3032
- Planck Collaboration et al. (2016) Planck Collaboration, Ade, P. A. R., Aghanim, N., et al. 2016, A&A, 594, A13
- Pracy et al. (2013) Pracy, M. B., Croom, S., Sadler, E., et al. 2013, MNRAS, 432, 3131
- Rowlands et al. (2015) Rowlands, K., Wild, V., Nesvadba, N., et al. 2015, MNRAS, 448, 258
- Rowlands et al. (2012) Rowlands, K., Dunne, L., Maddox, S., et al. 2012, MNRAS, 419, 2545
- Rowlands et al. (2014) Rowlands, K., Dunne, L., Dye, S., et al. 2014, MNRAS, 441, 1017
- Schulz et al. (2017) Schulz, B., Marton, G., Valtchanov, I., et al. 2017, ArXiv e-prints, arXiv:1706.00448
- Skrutskie et al. (2006) Skrutskie, M. F., Cutri, R. M., Stiening, R., et al. 2006, AJ, 131, 1163
- Smercina et al. (2018) Smercina, A., Smith, J. D. T., Dale, D. A., et al. 2018, ApJ, 855, 51
- Snyder et al. (2011) Snyder, G. F., Cox, T. J., Hayward, C. C., Hernquist, L., & Jonsson, P. 2011, ApJ, 741, 77
- Tran et al. (2004) Tran, K.-V. H., Franx, M., Illingworth, G. D., et al. 2004, ApJ, 609, 683
- Tremonti et al. (2004) Tremonti, C. A., Heckman, T. M., Kauffmann, G., et al. 2004, ApJ, 613, 898
- Veilleux & Osterbrock (1987) Veilleux, S., & Osterbrock, D. E. 1987, The Astrophysical Journal Supplement Series, 63, 295
- Wild et al. (2016) Wild, V., Almaini, O., Dunlop, J., et al. 2016, MNRAS, 463, 832
- Wild et al. (2010) Wild, V., Heckman, T., & Charlot, S. 2010, MNRAS, 405, 933
- Wong et al. (2012) Wong, O. I., Schawinski, K., Kaviraj, S., et al. 2012, MNRAS, 420, 1684
- Yang et al. (2004) Yang, Y., Zabludoff, A. I., Zaritsky, D., Lauer, T. R., & Mihos, J. C. 2004, ApJ, 607, 258
- Yang et al. (2008) Yang, Y., Zabludoff, A. I., Zaritsky, D., & Mihos, J. C. 2008, ApJ, 688, 945
- Zabludoff et al. (1996) Zabludoff, A. I., Zaritsky, D., Lin, H., et al. 1996, ApJ, 466, 104
- Zwaan et al. (2013) Zwaan, M. A., Kuntschner, H., Pracy, M. B., & Couch, W. J. 2013, MNRAS, 432, 492
Appendix A Minimal Herschel data required for reliable
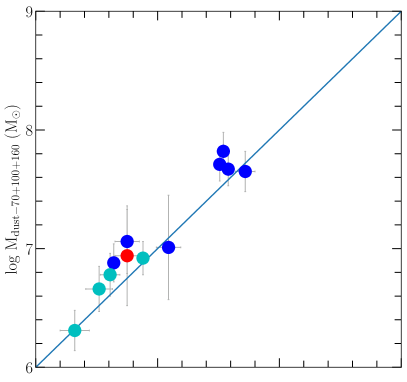
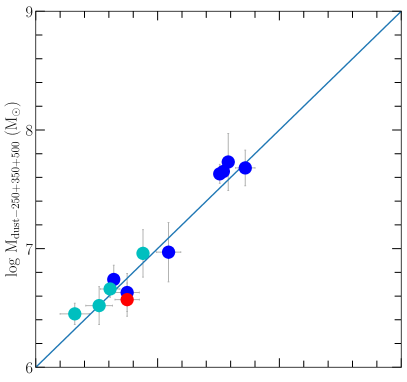
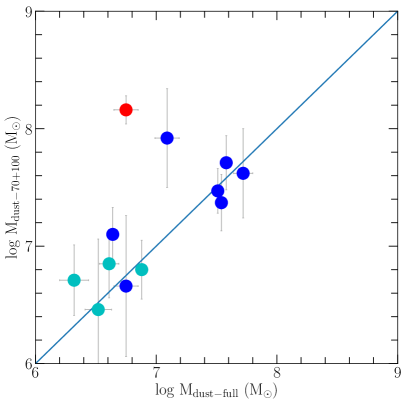
According to Draine & Li (2007), determining the position of the FIR SED peak is crucial for obtaining a reliable . Here we determine the fewest and best bands for fitting the SEDs of our sample. We perform SED fitting tests using 12 EAH/EAS PSBs (i.e., EAH01-07, EAH09-10, EAS05-06, and EAS09) that have archival fluxes in all six Herschel bands and that are best fit by the model at 70 and 100m. Then, we remove different sets of bands, refit the SEDs of these galaxies, and compare the derived with those derived from fitting all six Herschel bands. As shown in Figure 9, 70m+100m+160m or 250m+350m+500m bands are enough to derive reliable , while outliers exist where only 70m+100m or 250m+350m bands are used161616If we loosen our criterion to 2 Herschel bands, 18 additional PSBs could be included, the majority of which have 70m+100m or 250m+350m bands. As our tests show that 70m+100m or 250m+350m bands are not enough to yield a reliable , we decide not to include them in our sample.. To be conservative, we remove all the PSBs with 3 Herschel bands and include only those 58 PSBs with at least three Herschel measurements in our analysis in this paper.
Appendix B Effect of including UV and optical data on
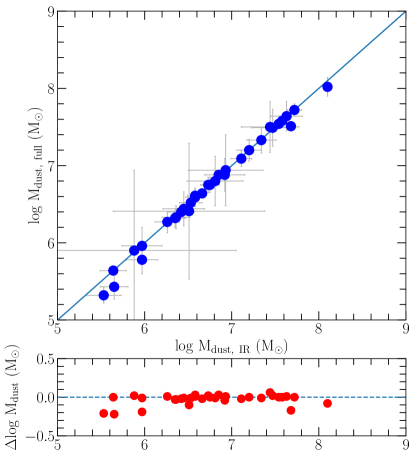
We also test the effects of fitting the SEDs for 33 PSBs (i.e., EAH01-18 and EAS01-15) from the UV to FIR using CIGALE, as we do in this paper, compared to only fitting with MIR-FIR data on . As shown in Figure 10, is very robust whether or not we use UV and optical data in our fitting. This is expected, as is basically determined by the position and height of the IR peak.
Appendix C comparison with Smercina et al. (2018)
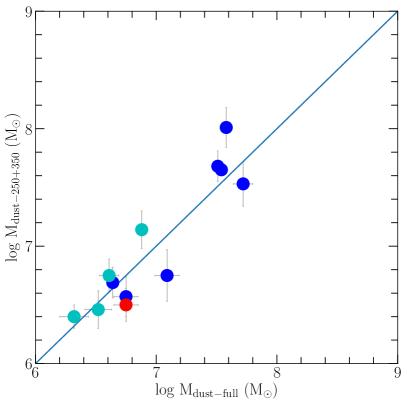
Smercina et al. (2018) derive for 33 PSBs (i.e., EAH01-18 and EAS01-15) by performing SED fitting using the DL07 model and a T = 5000 K blackbody stellar model. To compare our results with theirs, we combine the WISE and Herschel fluxes from Smercina et al. (2018) with our UV-optical fluxes and perform SED fitting using CIGALE. As shown in Figure 11, when the error bars are taken into account, the ’s are consistent171717The log for EAH03 in Smercina et al. (2018) should be 7.55 , instead of 8.70 . We thank A. Smercina and D. A. Dale for their help in identifying this problem. in almost all cases: 32/33 PSBs have -0.5 log 0.25 , with on average log = -0.04 . The small differences in and its error bars arise mostly from differences in our model assumptions and in our definitions of .
Appendix D Effect of burst ages on
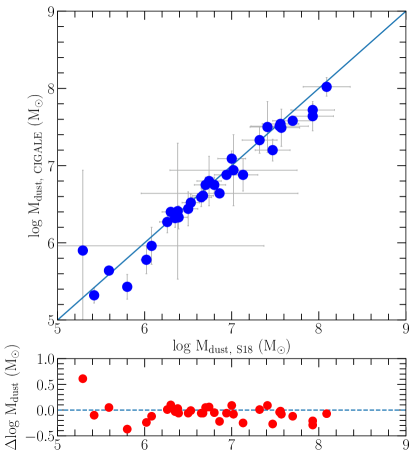
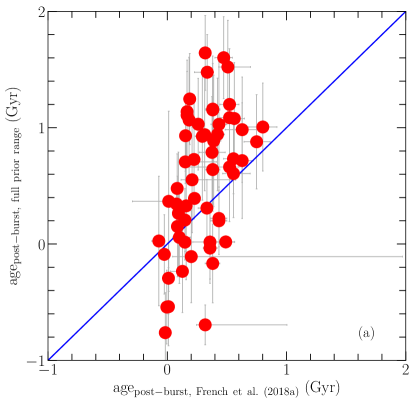
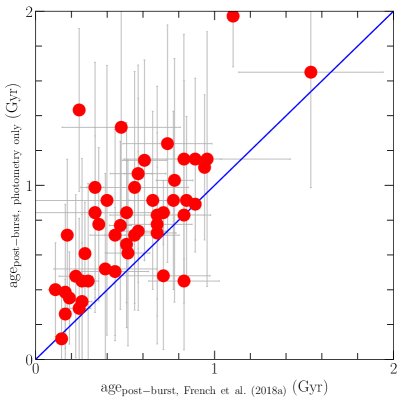
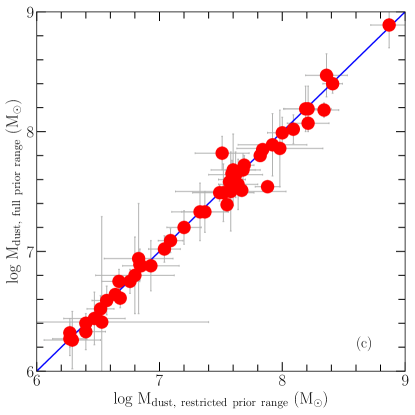
We find a discrepancy between the (post-)burst ages derived from CIGALE and French et al. (2018a), who perform age-dating by combining GALEX photometry, SDSS photometry, and SDSS spectra. We have tested two types of priors for CIGALE: one is the full range described in Table 1, the other is restricted to the 2- value ranges provided in French et al. (2018a) for our total sample of 58 PSBs. As shown in Figure 12a, even provided with a full range of priors, the average of the (post-)burst ages from CIGALE is still higher than that from French et al. (2018a) (0.55 versus 0.30 Gyr), with a larger standard deviation (0.59 versus 0.20 Gyr). Having excluded all other possible factors that may contribute to such discrepancy (models, priors, and photometric data), we conclude that it is the inclusion of optical spectral information that causes the difference. As illustrated in Figure 12b, for a subsample of PSBs in French et al. (2018a), the (post-)burst ages derived by fitting with only photometry (y-axis) are systematically higher and have larger scatter than those derived by fitting photometry and spectral lines together (x-axis) using the age-dating method in French et al. (2018a). This age discrepancy almost has no impact on , however, as shown in Figure 12c. The decreasing trend of versus is also not notably affected. The age-dating from French et al. (2018a) is likely more accurate, so we adopt the French et al. (2018a) PSB ages throughout this paper when considering the evolution of PSB properties.
Appendix E SED fits of all 58 PSBs in our sample
Here we present all 58 SED fits of our sample, eight of which are already presented in Figure 1.
 |
 |
|
 |
 |
|
 |
 |
 |
 |
 |
 |
 |
 |
 |