Balanced Ranking with Diversity Constraints
Abstract
Many set selection and ranking algorithms have recently been enhanced with diversity constraints that aim to explicitly increase representation of historically disadvantaged populations, or to improve the overall representativeness of the selected set. An unintended consequence of these constraints, however, is reduced in-group fairness: the selected candidates from a given group may not be the best ones, and this unfairness may not be well-balanced across groups. In this paper we study this phenomenon using datasets that comprise multiple sensitive attributes. We then introduce additional constraints, aimed at balancing the in-group fairness across groups, and formalize the induced optimization problems as integer linear programs. Using these programs, we conduct an experimental evaluation with real datasets, and quantify the feasible trade-offs between balance and overall performance in the presence of diversity constraints.
1 Introduction
The desire for diversity and fairness in many contexts, ranging from results of a Web search to admissions at a university, has recently introduced the need to revisit algorithm design in these settings. Prominent examples include set selection and ranking algorithms, which have recently been enhanced with diversity constraints Celis et al. (2018); Drosou et al. (2017); Stoyanovich et al. (2018); Zehlike et al. (2017); Zliobaite (2017). Such constraints focus on groups of items in the input that satisfy a given sensitive attribute label, typically denoting membership in a demographic group, and seek to ensure that these groups are appropriately represented in the selected set or ranking. Notably, each item will often be associated with multiple attribute labels (e.g., an individual may be both female and Asian).
Diversity constraints may be imposed for legal reasons, such as for compliance with Title VII of the Civil Rights Act of 1964 (EEOC) (2019). Beyond legal requirements, benefits of diversity, both to small groups and to society as a whole, are increasingly recognized by sociologists and political scientists Page (2008); Surowiecki (2005). Last but not least, diversity constraints can be used to ensure dataset representativeness, for example when selecting a group of patients to study the effectiveness of a medical treatment, or to understand the patterns of use of medical services Cohen et al. (2009), an example we will revisit in this paper.
Our goal in this paper is to evaluate and mitigate an unintended consequence that such diversity constraints may have on the outcomes of set selection and ranking algorithms. Namely, we want to ensure that these algorithms do not systematically select lower-quality items in particular groups. In what follows, we make our set-up more precise.
Given a set of items, each associated with multiple sensitive attribute labels and with a quality score (or utility), a set selection algorithm needs to select of these items aiming to maximize the overall utility, computed as the sum of utility scores of selected items. The score of an item is a single scalar that may be pre-computed and stored as a physical attribute, or it may be computed on the fly. The output of traditional set selection algorithms, however, may lead to an underrepresentation of items with a specific sensitive attribute. As a result, recent work has aimed to modify these algorithms with the goal of introducing diversity.
There are numerous ways to define diversity. For set selection, a unifying formulation for a rich class of proportional representation fairness Zliobaite (2017) and coverage-based diversity Drosou et al. (2017) measures is to specify a lower bound for each sensitive attribute value , and to enforce it as the minimum cardinality of items satisfying in the output Stoyanovich et al. (2018). If the selected candidates need to also be ranked in the output, this formulation can be extended to specify a lower bound for every attribute and every prefix of the returned ranked list, with Celis et al. (2018). Then, at least items satisfying should appear in the top positions of the output. We refer to all of these as diversity constraints in the remainder of this paper. Given a set of diversity constraints, one can then seek to maximize the utility of the selected set, subject to these constraints.
As expected, enforcing diversity constraints often comes at a price in terms of overall utility. Furthermore, the following simple example exhibits that, when faced with a combination of diversity constraints, maximizing utility subject to these constraints can lead to another form of imbalance.
| Male | Female | |||
|---|---|---|---|---|
| White | A (99) | B (98) | C (96) | D (95) |
| Black | E (91) | F (91) | G (90) | H (89) |
| Asian | I (87) | J (87) | K (86) | L (83) |
Example 1
Consider candidates who are applying for committee positions. Table 1 illustrates this example using a letter from A to L as the candidate ID and specifying the ethnicity, gender, and score of each candidate (e.g., candidate E is a Black male with a score of 91). Suppose that the following diversity constraints are imposed: the committee should include two male and two female candidates, and at least one candidate from each race. In this example both race and gender are strongly correlated with the score: White candidates have the highest scores, followed by Black and then by Asian. Further, male candidates of each race have higher scores than female candidates of the same race.
The committee that maximizes utility while satisfying the diversity constraints is , with utility score . Note that this outcome fails to select the highest-scoring female candidates (C and D), as well as the highest-scoring Black (E and F) and Asian (I and J) candidates. This is in contrast to the fact that it selects the best male and the best White candidates (A and B). This type of “unfairness” is unavoidable due to the diversity constraints, but in this outcome it hurts historically disadvantaged groups (e.g., females and Black candidates) more. However, one can still try to distribute this unfairness in a more “balanced” way across different sensitive attribute values. For instance, an alternative committee selection could be , with utility 372. For only a small drop in utility, this ensures that the top female, male, White, and Black candidates are selected.
Example 1 illustrates that diversity constraints may inevitably lead to unfairness within groups of candidates. An important concern is that, unless appropriately managed, this unfairness may disproportionately affect demographic groups with lower scores. This is particularly problematic when lower scores are the result of historical disadvantage, as may, for example, be the case in standardized testing Brunn-Bevel and Byrd (2015). In this paper, we focus on this phenomenon and our goal is to provide measures for quantifying fairness in this context, to which we refer as in-group fairness, and to study the extent to which its impact can be balanced across groups rather than disproportionately affect a few groups.
Contributions
We make the following contributions:
-
•
We observe that diversity constraints can impact in-group fairness, and introduce two novel measures that quantify this impact.
-
•
We observe that the extent to which in-group fairness is violated in datasets with multiple sensitive attributes may be quite different for different attribute values.
-
•
We translate each of our in-group fairness measures into a set of constraints for an integer linear program.
Organization. After providing the required definitions and notation in Section 2, we introduce our notions of in-group fairness in Section 3. We translate in-group fairness into constraints for an integer linear program in Section 4, and use the leximin criterion to select the best feasible parameters. We present experiments on real datsets in Section 5, discuss related work in Section 6, and conclude in Section 7.
2 Preliminaries and Notation
Both the set selection and the ranking problem are defined given a set of items (or candidates), along with a score associated with each item ; this score summarizes the qualifications or the relevance of each item. The goal of the set selection problem is to choose a subset of of these items aiming to maximize the total score . The ranking problem, apart from selecting the items, also requires that the items are ranked — assigned to distinct positions . In this paper we study the impact of diversity constraints that may be enforced on the outcome.
Each item is labeled based on a set of sensitive attributes. For instance, if the items correspond to job candidates, the sensitive attributes could be “race”, “gender”, or “nationality”. Each attribute may take one of a predefined set (or domain) of values, or labels, ; for the attribute “gender”, the set of values would include “male” and “female”. We refer to attributes that have only two values (e.g., the values for “gender”) as binary. We use to denote the set of all the attribute values related to attributes in the set . (To simplify notation, we assume that domains of attribute values do not overlap.)
Given a sensitive attribute value , we let denote the set of items that satisfy this label. For instance, if corresponds to the label “female”, then is the set of all female candidates. We refer to such a set as a group (e.g., the group of female candidates). For each attribute value and item , we let be the set of items with attribute value that have a score greater than or equal to (including ); for simplicity, and without loss of generality, we assume that no two scores are exactly equal. In Example 1 if we let correspond to the attribute value “Black” and let be candidate G, then and . We also use and to denote the maximum and minimum scores over all available items. Let be the ratio of the maximum over the minimum score.
For a given selection, , of items, we use to denote the subset of items in that are in , and for those that are not. Also, is the lowest score among the ones that were accepted and the highest score among the items in that were rejected. We say that a set selection of items is in-group fair with respect to if , i.e., no rejected candidate in is better than an accepted one. In Section 3 we define two measures for quantifying how in-group fair a solution is. Finally, we use to denote the set of selected items in whose score is at least for some .
3 Diversity and In-Group Fairness
To ensure proportional representation of groups in algorithmic outcomes, one way of introducing diversity constraints is to specify lower bounds for each group . Using diversity constraints, one may require, for example, that the proportion of females in a selected set or in the top- positions of a ranking, for some , closely approximates the proportion of females in the overall population. Depending on the notion of appropriate representation, one can then define, for each sensitive attribute value (or label) and each position , a lower bound on the number of items satisfying value that appear in the top- positions of the final ranking (see, e.g., Celis et al. (2018)). Given such bounds, one can then seek to maximize the overall utility of the generated set or ranking. The main drawback of this approach is that it may come at the expense of in-group fairness, described next.
Given some label and the group of items that satisfy this label, in-group fairness requires that if items from appear in the outcome, then it should be the best items of . Note that, were it not for diversity constraints, any utility maximizing outcome would achieve in-group fairness: excluding some candidate in favor of someone with a lower score would clearly lead to a sub-optimal outcome. However, as we verified in Example 1, in the presence of diversity constraints, maintaining in-group fairness for all groups may be impossible. In this paper we propose and study two measures of approximate in-group fairness, which we now define.
Given an outcome , a direct and intuitive way to quantify in-group fairness for some group is to consider the unfairness in the treatment of the most qualified candidate in that was non included in . Specifically, we use the ratio between the minimum score of an item in (the lowest accepted score) over the maximum score in (the highest rejected score). This provides a fairness measure with values in the range and higher values implying more in-group fairness. For instance, if some highly qualified candidate in with score was rejected in favor of another candidate in with score , then the ratio is .
| (1) |
IGF-Aggregated
Our second measure of in-group fairness aims to ensure that for every selected item the score is a good approximation of . The first sum corresponds to aggregate utility of all accepted items with , and the second sum is the aggregate utility of all items (both accepted and rejected) with . If no qualified candidate in is rejected in favor of some less qualified one, then these sums are equal. On the other hand, the larger the fraction of high-scoring candidates rejected in favor of lower-scoring ones, the wider the gap between these sums. For a given group , our second in-group fairness measure is the worst-case ratio (over all ) of the former sum divided by the latter. Just like our first measure, this leads to a number in the range , with greater values indicating more in-group fairness.
| (2) |
4 Balancing In-Group Fairness
As our experiments in Section 5 show, the distribution of in-group fairness across groups can be quite imbalanced in the presence of diversity constraints. In order to mitigate this issue, we now introduce additional constraints that aim to better distribute in-group fairness across groups. We begin by showing that the problem of maximizing the total utility subject to a combination of diversity and in-group fairness constraints can be formulated as an integer linear program.
It is worth noting that even the much simpler problem of checking the feasibility of a given set of diversity constraints (let alone maximizing total utility and introducing additional in-group fairness constraints) is NP-hard (see Theorem 3.5 in Celis et al. (2018)). Therefore, we cannot not expect to solve our optimization problems in polynomial time. In light of this intractability, we instead formulate our optimization problems as integer programs. Although solving these programs can require exponential time in the worst case, standard integer programming libraries allow us to solve reasonably large instances in a very small amount of time. We briefly discuss the computational demands of these programs in Sec. 5.
4.1 Integer Program Formulations
The integer programs receive as input, for each and , a set of values, and for each , a value, which correspond to diversity and in-group fairness lower bounds, respectively. The output of the program is a utility-maximizing ranking of items such that at least items from are in the top positions, and the in-group fairness of each is at least . For each item and each position of the ranking, the integer program uses an indicator variable that is set either to 1, indicating that item is in position of the ranked output, or to 0, indicating that it is not. We also use variable that is set to 1 if is included in any position of the output, and to 0 otherwise. The program below is for the measure.
The first set of inequalities ensures that at most one item is selected for each position. The second set of inequalities corresponds to the diversity constraints: for each attribute value and position , include at least items from among the top positions of the output. Most of the remaining constraints then aim to guarantee that every group has an of at least . Among these constraints, the most interesting one is . This is a linear constraint, since both and are constants. Note that, if is set to be equal to 1, i.e., if item is accepted, then this constraint becomes and hence ensures that can be no more than the score of any accepted item. Yet, if is set to be equal to 0, i.e., if item is rejected, then this becomes , and hence this constraint does not restrict the possible values of . Therefore, is guaranteed to be no more than the smallest accepted score in and is at least as large as the smallest rejected score, since , and hence if . As a result, enforces the constraint .
In order to get the integer linear program that enforces IGF-Aggregated constraints, we modify the program above by replacing all the constraints that involve or with the set of constraints for all and all . Note that for with this constraint becomes trivially satisfied, since the right hand side becomes 0 and the left hand side is always positive. If, on the other hand, , then this inequality ensures that, for all :
4.2 The Leximin Solution
Equipped with the ability to compute the utility-maximizing outcome in the presence of both in-group fairness and diversity constraints, our next step is to use these integer linear programs to optimize the balance of in-group fairness across different groups. In fact, this gives rise to a non-trivial instance of a fair division problem: given one of the in-group fairness measures that we have defined, for each possible outcome, this measure quantifies how “happy” each group should be, implying a form of “group happiness”. Therefore, each outcome yields a vector of in-group fairness values for each group. As we have seen, achieving an in-group fairness vector of may be infeasible due to the diversity constraints. Given the set of feasible vectors implied by the diversity constraints, our goal is to identify an outcome (i.e., an in-group fairness vector ) that fairly distributes in-group fairness values across all groups.
From this perspective, our problem can be thought of as a fair division problem where the goods being allocated are the slots in the set, and the fairness of the outcome towards all possible groups is evaluated based on the in-group fairness vector that it induces. Fair division is receiving significant attention in economics (e.g., Moulin (2004)) and recently also in computer science (e.g., (Brandt et al., 2016, Part II)). A common solution that this literature provides to the question of how happiness should be distributed is maximin. Over all feasible in-group fairness vectors , the maximin solution dictates that a fair solution should maximize the minimum happiness, so it outputs . In this paper we consider a well-studied refinement of this approach, known as the leximin solution (Moulin, 2004, Sec. 3.3). Since there may be multiple vectors with the same minimum happiness guarantee, , the leximin solution chooses among them one that also maximizes the second smallest happiness value. In case of ties, this process is repeated for the third smallest happiness, and so on, until a unique vector is identified. More generally, if the elements of each feasible vector are sorted in non-decreasing order, then the leximin solution is the vector that is greater than all others from a lexicographic order standpoint.
Given the vector of in-group fairness values that correspond to the leximin solution, we can just run one of the integer linear programs defined above to get the balanced set, but how do we compute this leximin vector ? A simple way to achieve this is to use binary search in order to first identify the set of maximin solutions. For each value of we can check the feasibility of the integer linear program if we use that same value for all the groups. Starting from , if the solution is feasible we update the value to , whereas if it is infeasible we update it to , and repeat recursively. Once the largest value of that can be guaranteed for all groups has been identified, we check which group it is for which this constraint is binding, we fix , and continue similarly for the remaining groups, aiming to maximize the second smallest in-group fairness value, and so on.
In the experiments of the following section, we compute the leximin solution on real datasets and evaluate its in-group fairness and utility.
5 Experimental Evaluation
In this section, we describe the results of an experimental evaluation with three empirical goals: (1) to understand the conditions that lead to reduced in-group fairness; (2) to ascertain the feasibility of mitigating the observed imbalance with the help of in-group fairness constraints; (3) to explore the trade-offs between in-group fairness and utility.


| Dataset | |||||||||||||||
|---|---|---|---|---|---|---|---|---|---|---|---|---|---|---|---|
| diversity | ratio | agg | diversity | ratio | agg | diversity | ratio | agg | diversity | ratio | agg | diversity | ratio | agg | |
| MEPS | 28% | 5% | 3% | 34% | 7% | 3% | 34% | 5% | 1% | 33% | 3% | 3% | 28% | 4% | 5% |
| CS | 20% | 2% | 9% | 18% | 1% | 8% | 17% | 3% | 9% | 12% | 1% | 0% | 11% | 3% | 1% |
5.1 Datasets
Our experimental evaluation was conducted on the following two real datasets:
Medical Expenditure Panel Survey (MEPS)
is a comprehensive source of individual and household-level information regarding the amount of health expenditures by individuals from various demographic or socioeconomic groups Cohen et al. (2009); Coston et al. (2019). MEPS is ideal for our purposes as it includes sensitive attributes such as race and age group for each individual. Each candidate’s score corresponds to the utilization feature, defined in the IBM AI Fairness 360 toolkit Bellamy et al. (2018) as the total number of trips requiring medical care, and computed as the sum of the number of office-based visits, the number of outpatient visits, the number of ER visits, the number of inpatient nights, and the number of home health visits.
High-utilization respondents (with utilization ) constitute around 17% of the dataset. MEPS includes survey data of more than 10,000 individuals. We use data from Panel 20 of calendar year 2016, and select the top 5,110 individuals with utilization as our experimental dataset. We focus on two categorical attributes: race (with values “White”, “Black”, “Multiple races”, “Native Hawaiian”, “Asian Indian”, “Filipino”, “Chinese”, and “American Indian”) and age (“Middle” and “Young”).
CS department rankings (CS)
contains information about 51 computer science departments in the US Berger (2018). We use publication count as the scoring attribute and select two categorical attributes: department size (with values “large” and “small”) and area (with values “North East”, “West”, “Middle West”, “South Center”, and “South Atlantic”). Unlike the MEPS dataset, CS is a relatively small dataset, but our experiments show that the diversity constraints and the balancing operations exhibit similar behavior. For this dataset we ask for a ranking of the top CS departments, while ensuring that departments of different size and location are well-represented.
5.2 Experimental Evidence of Imbalance
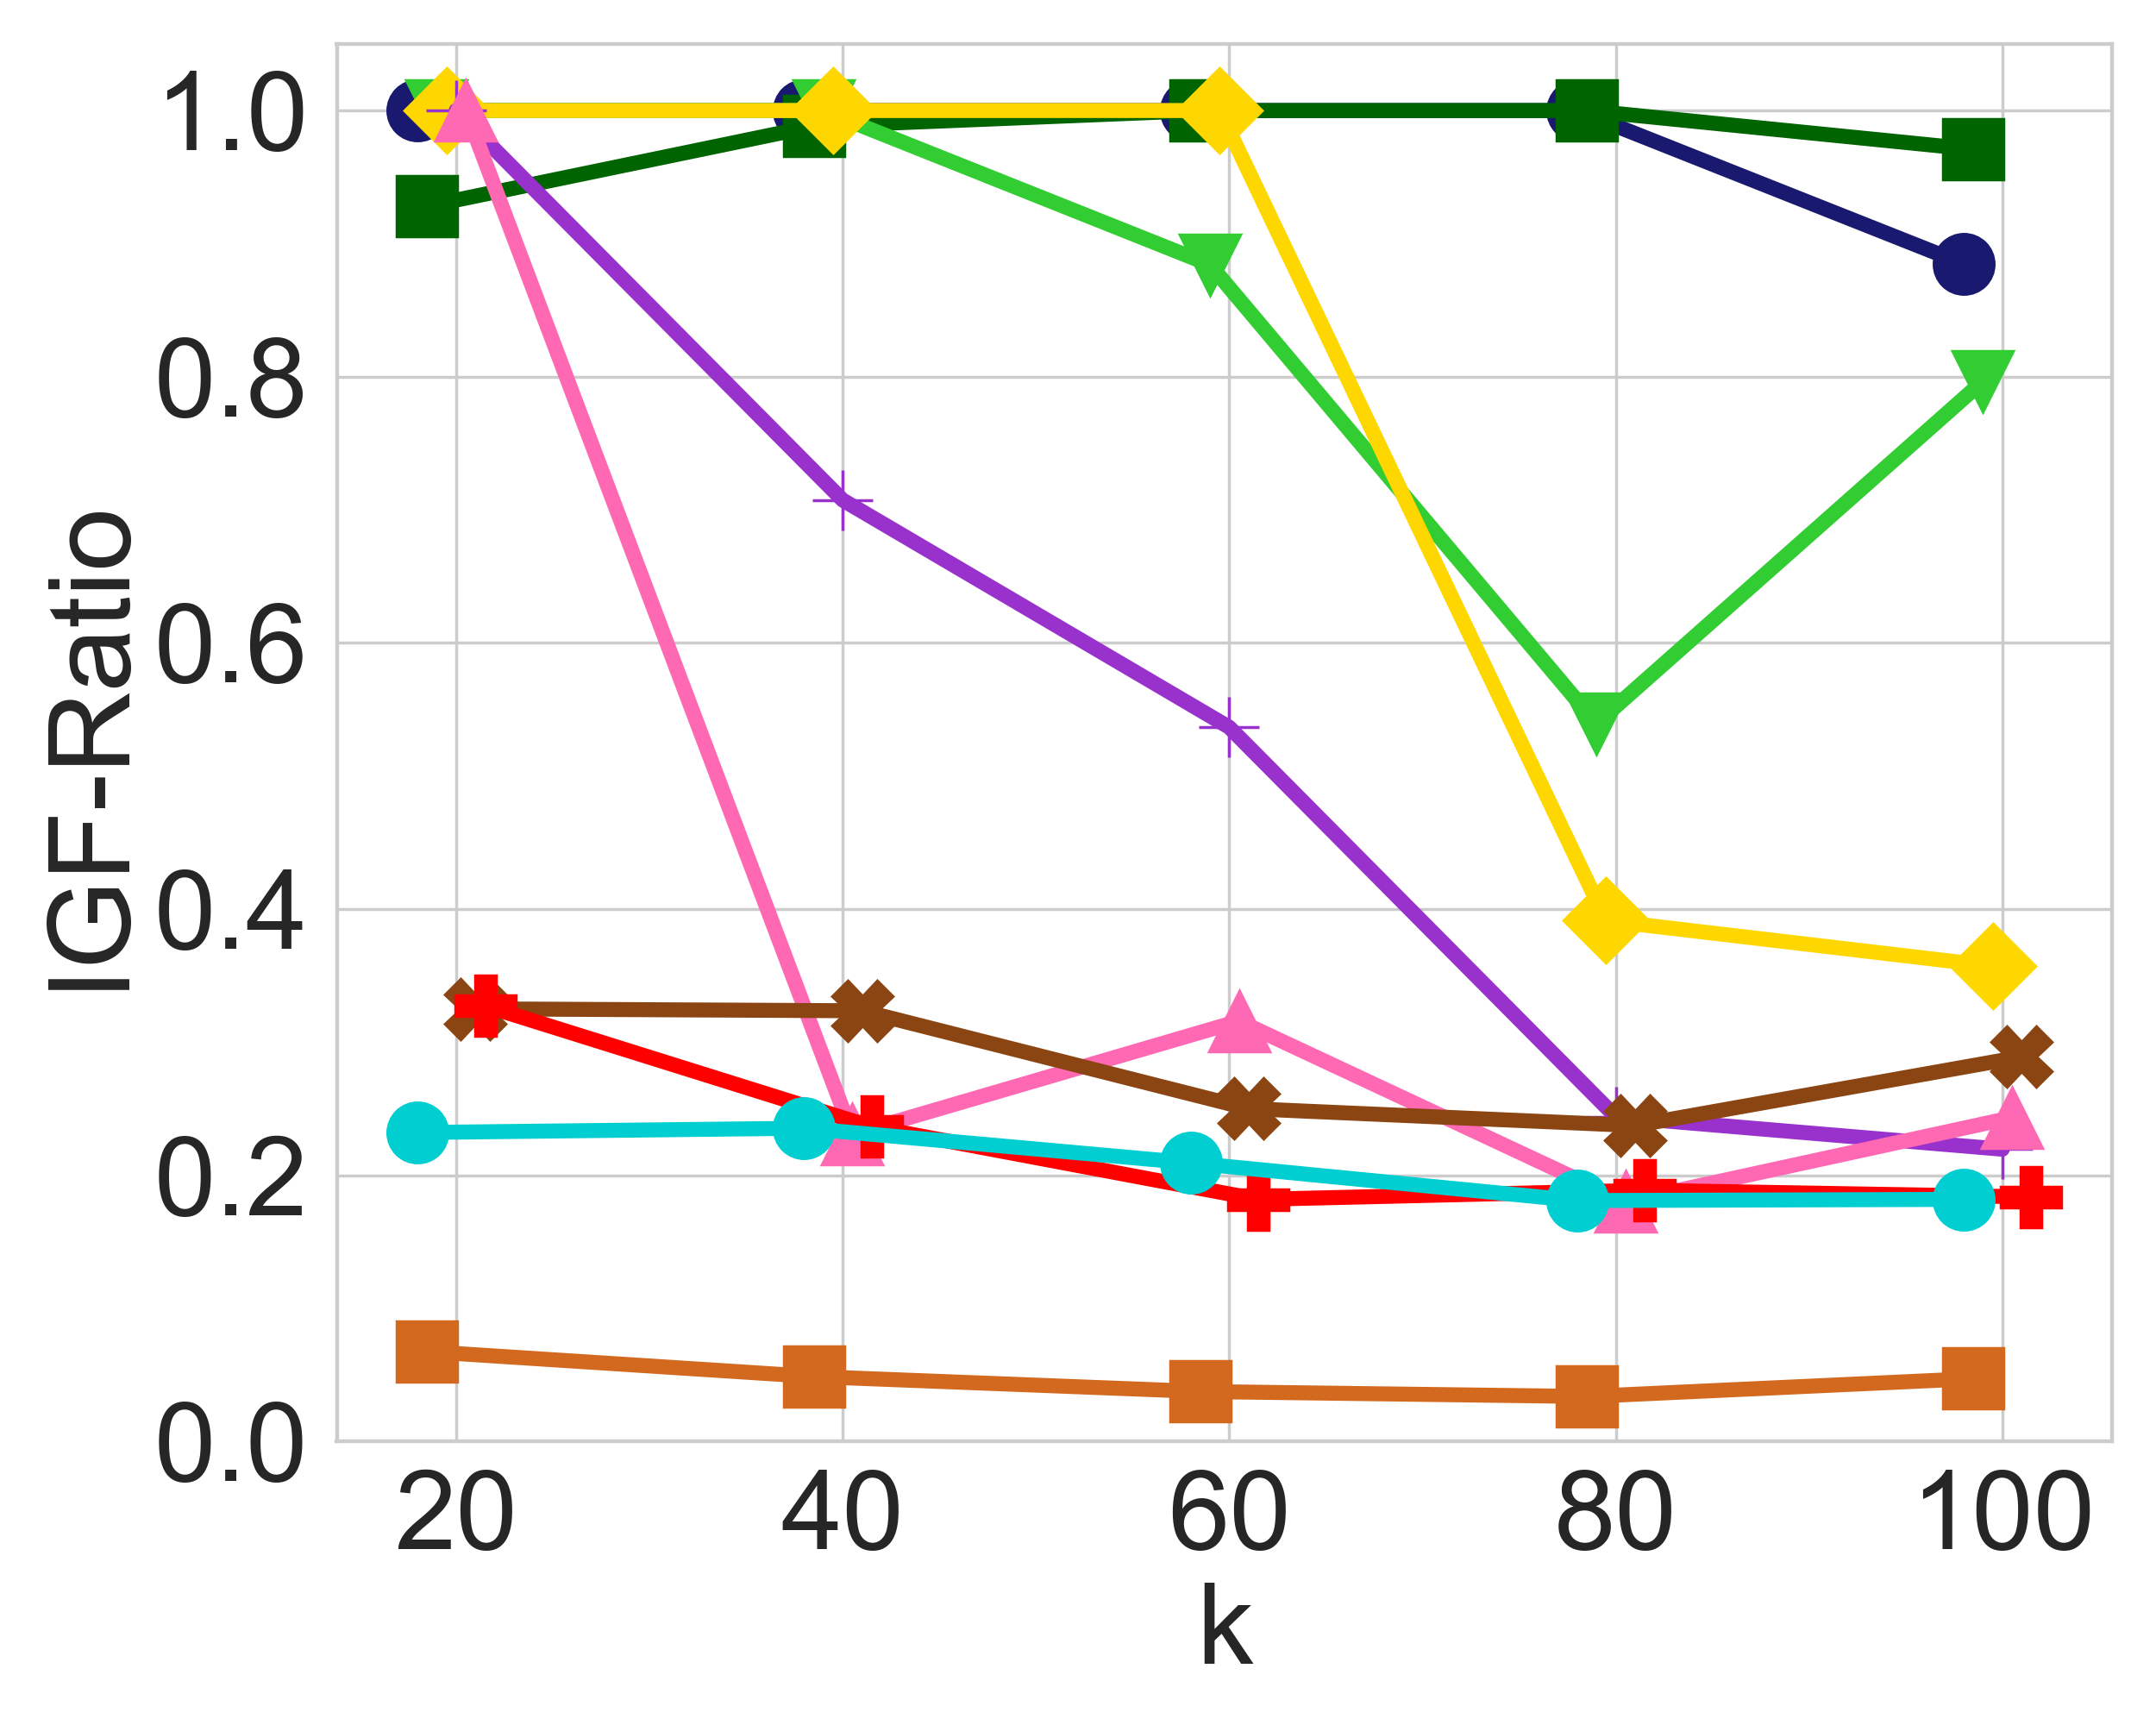
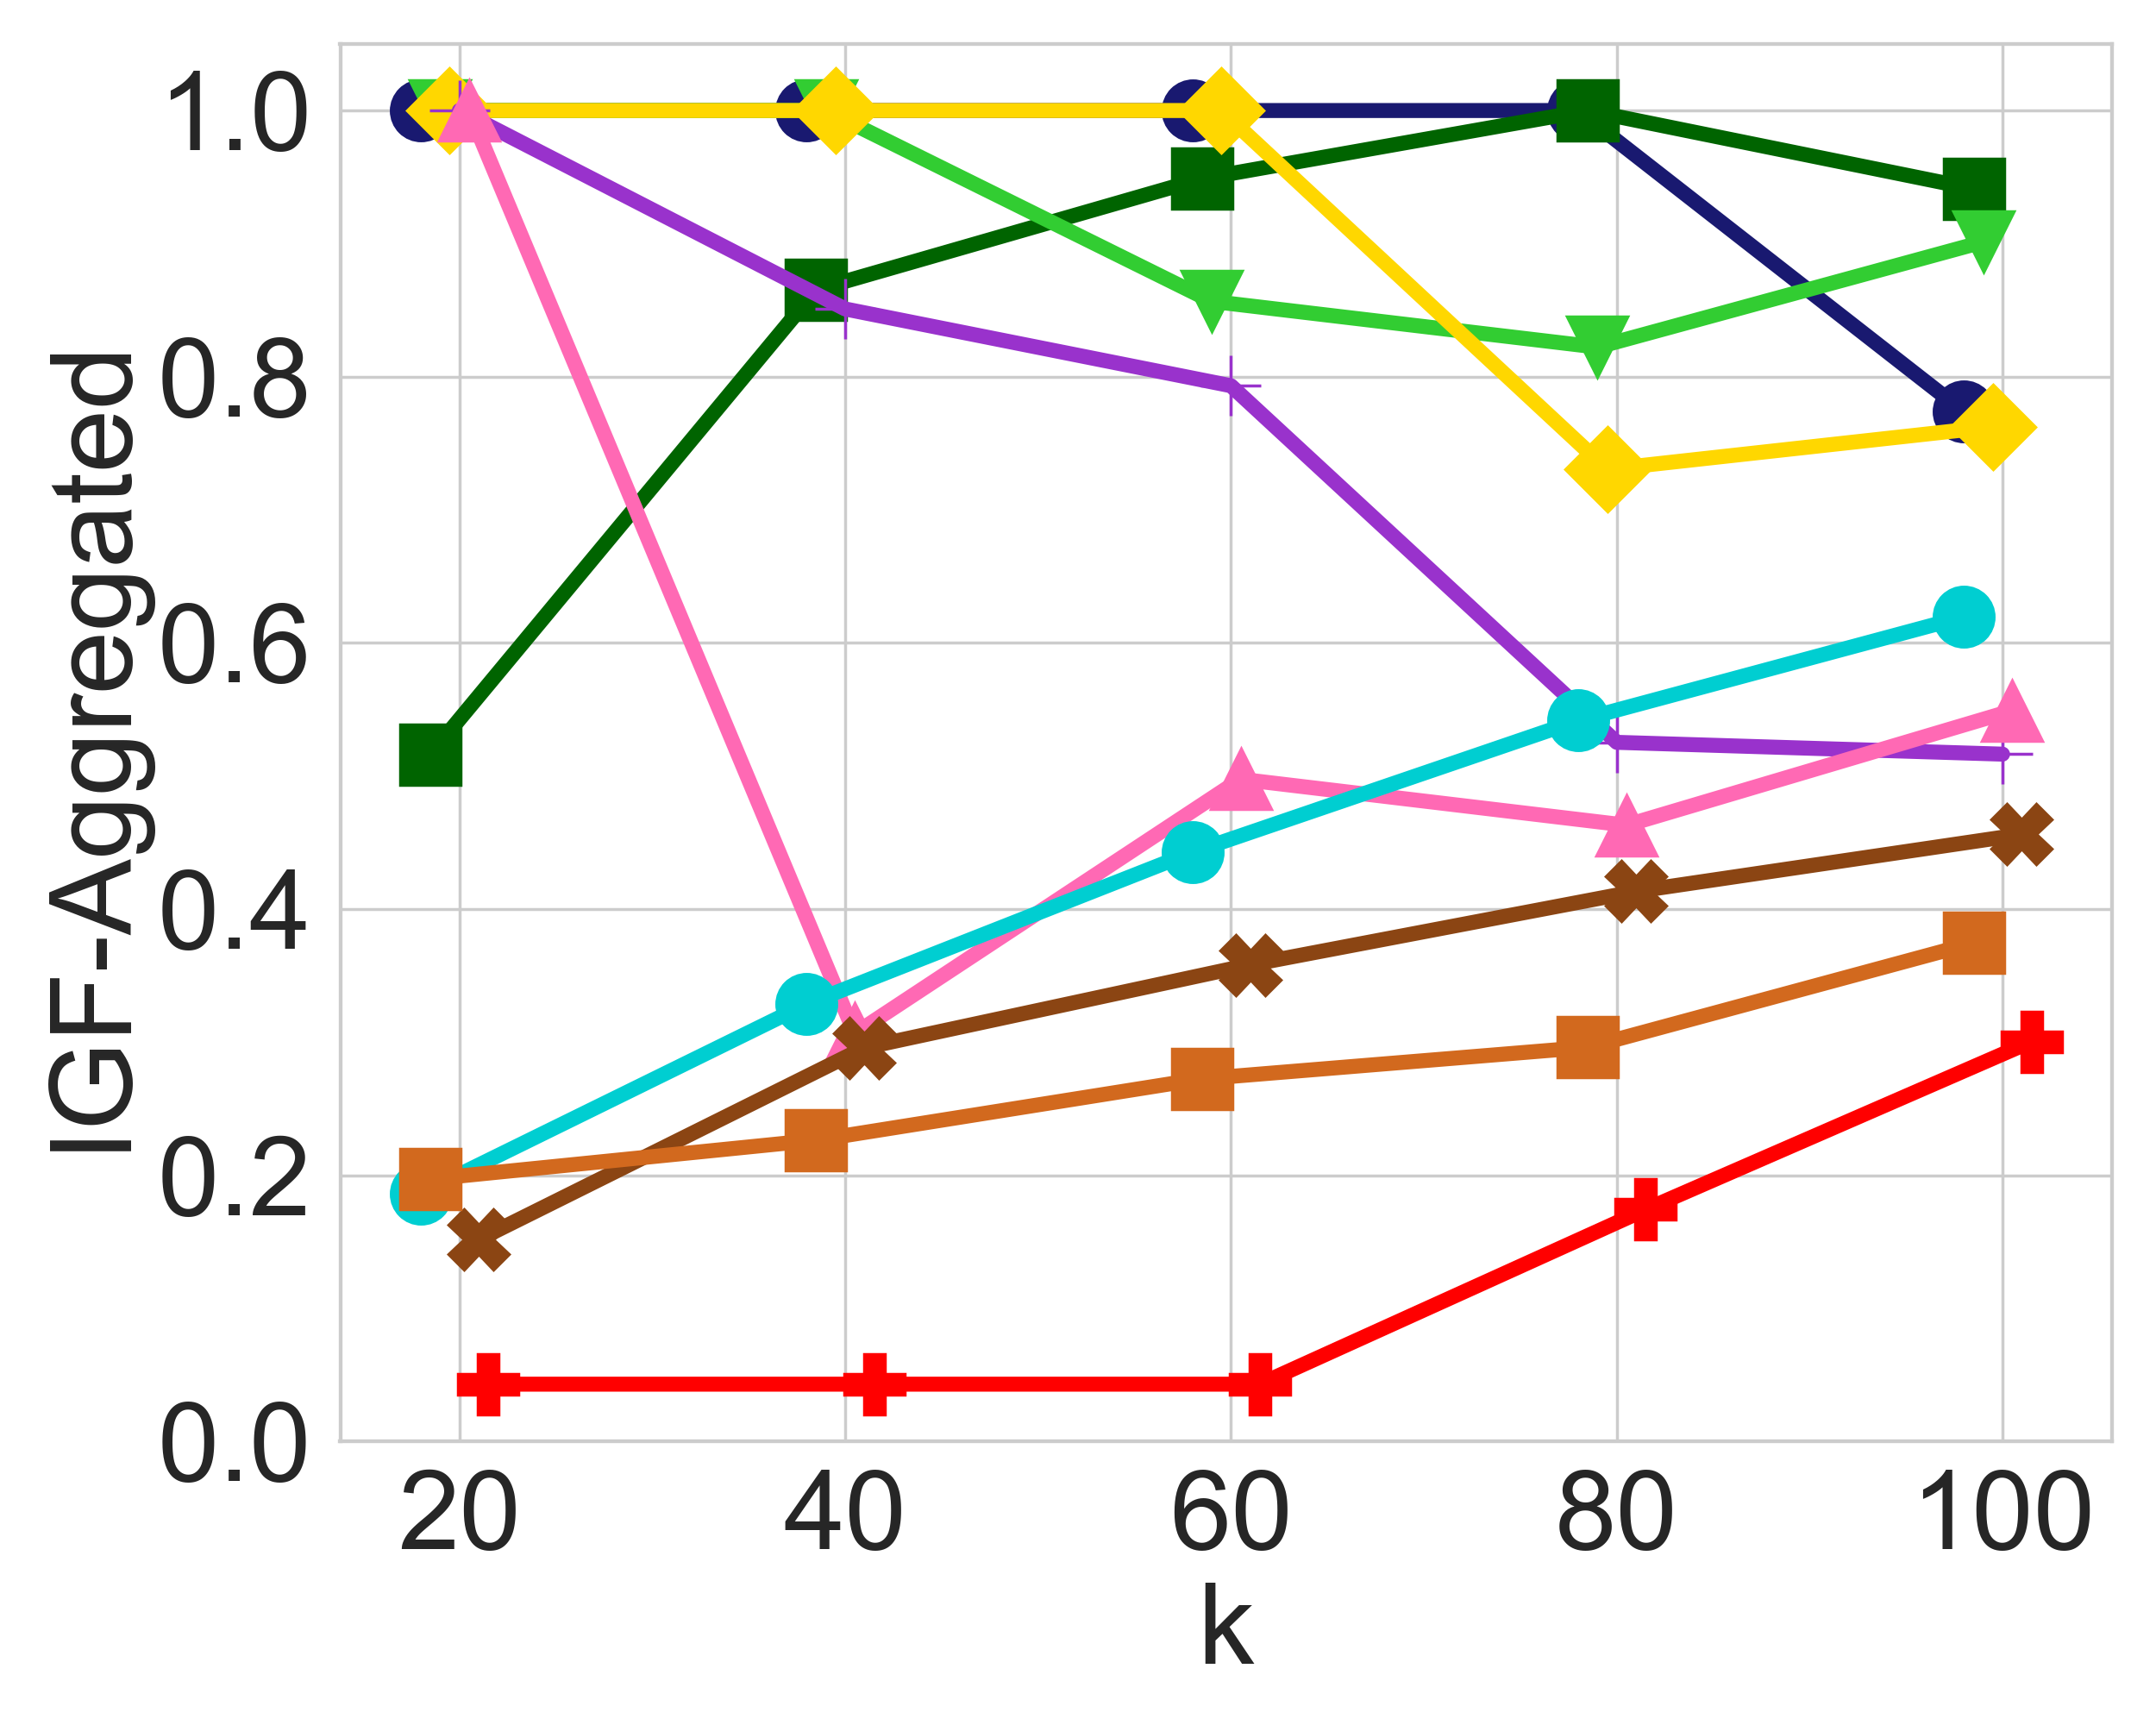
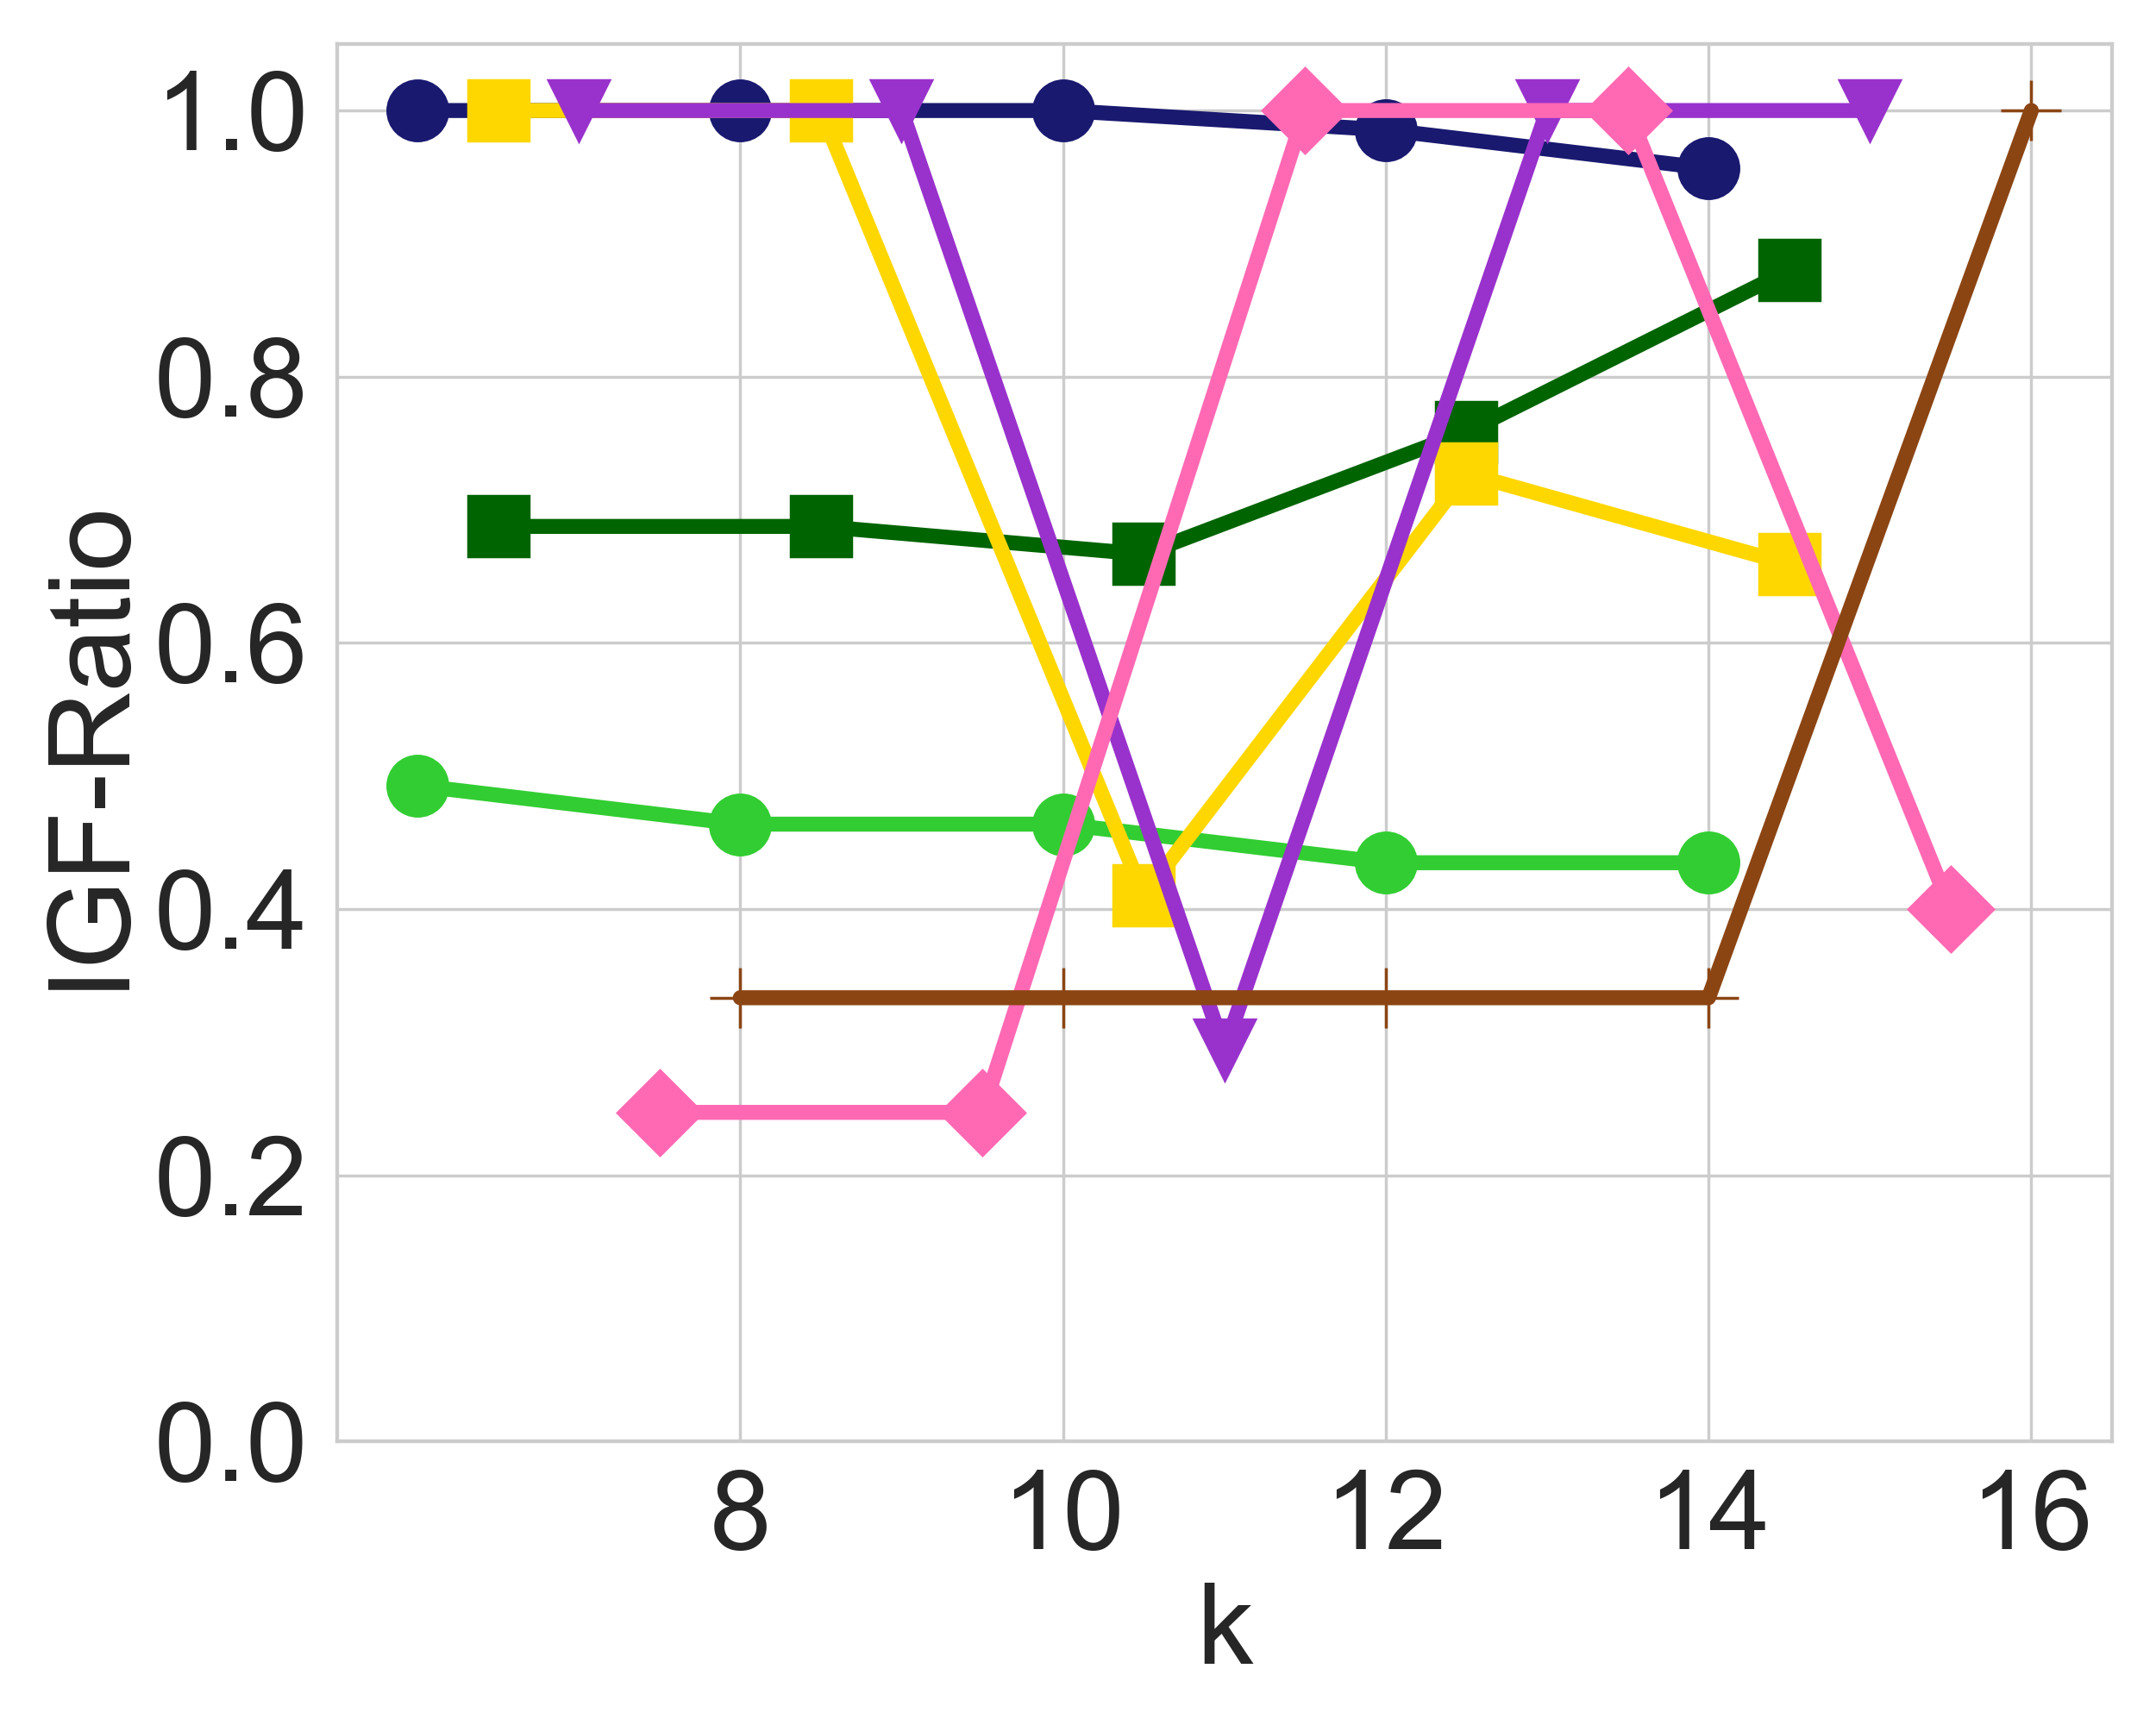
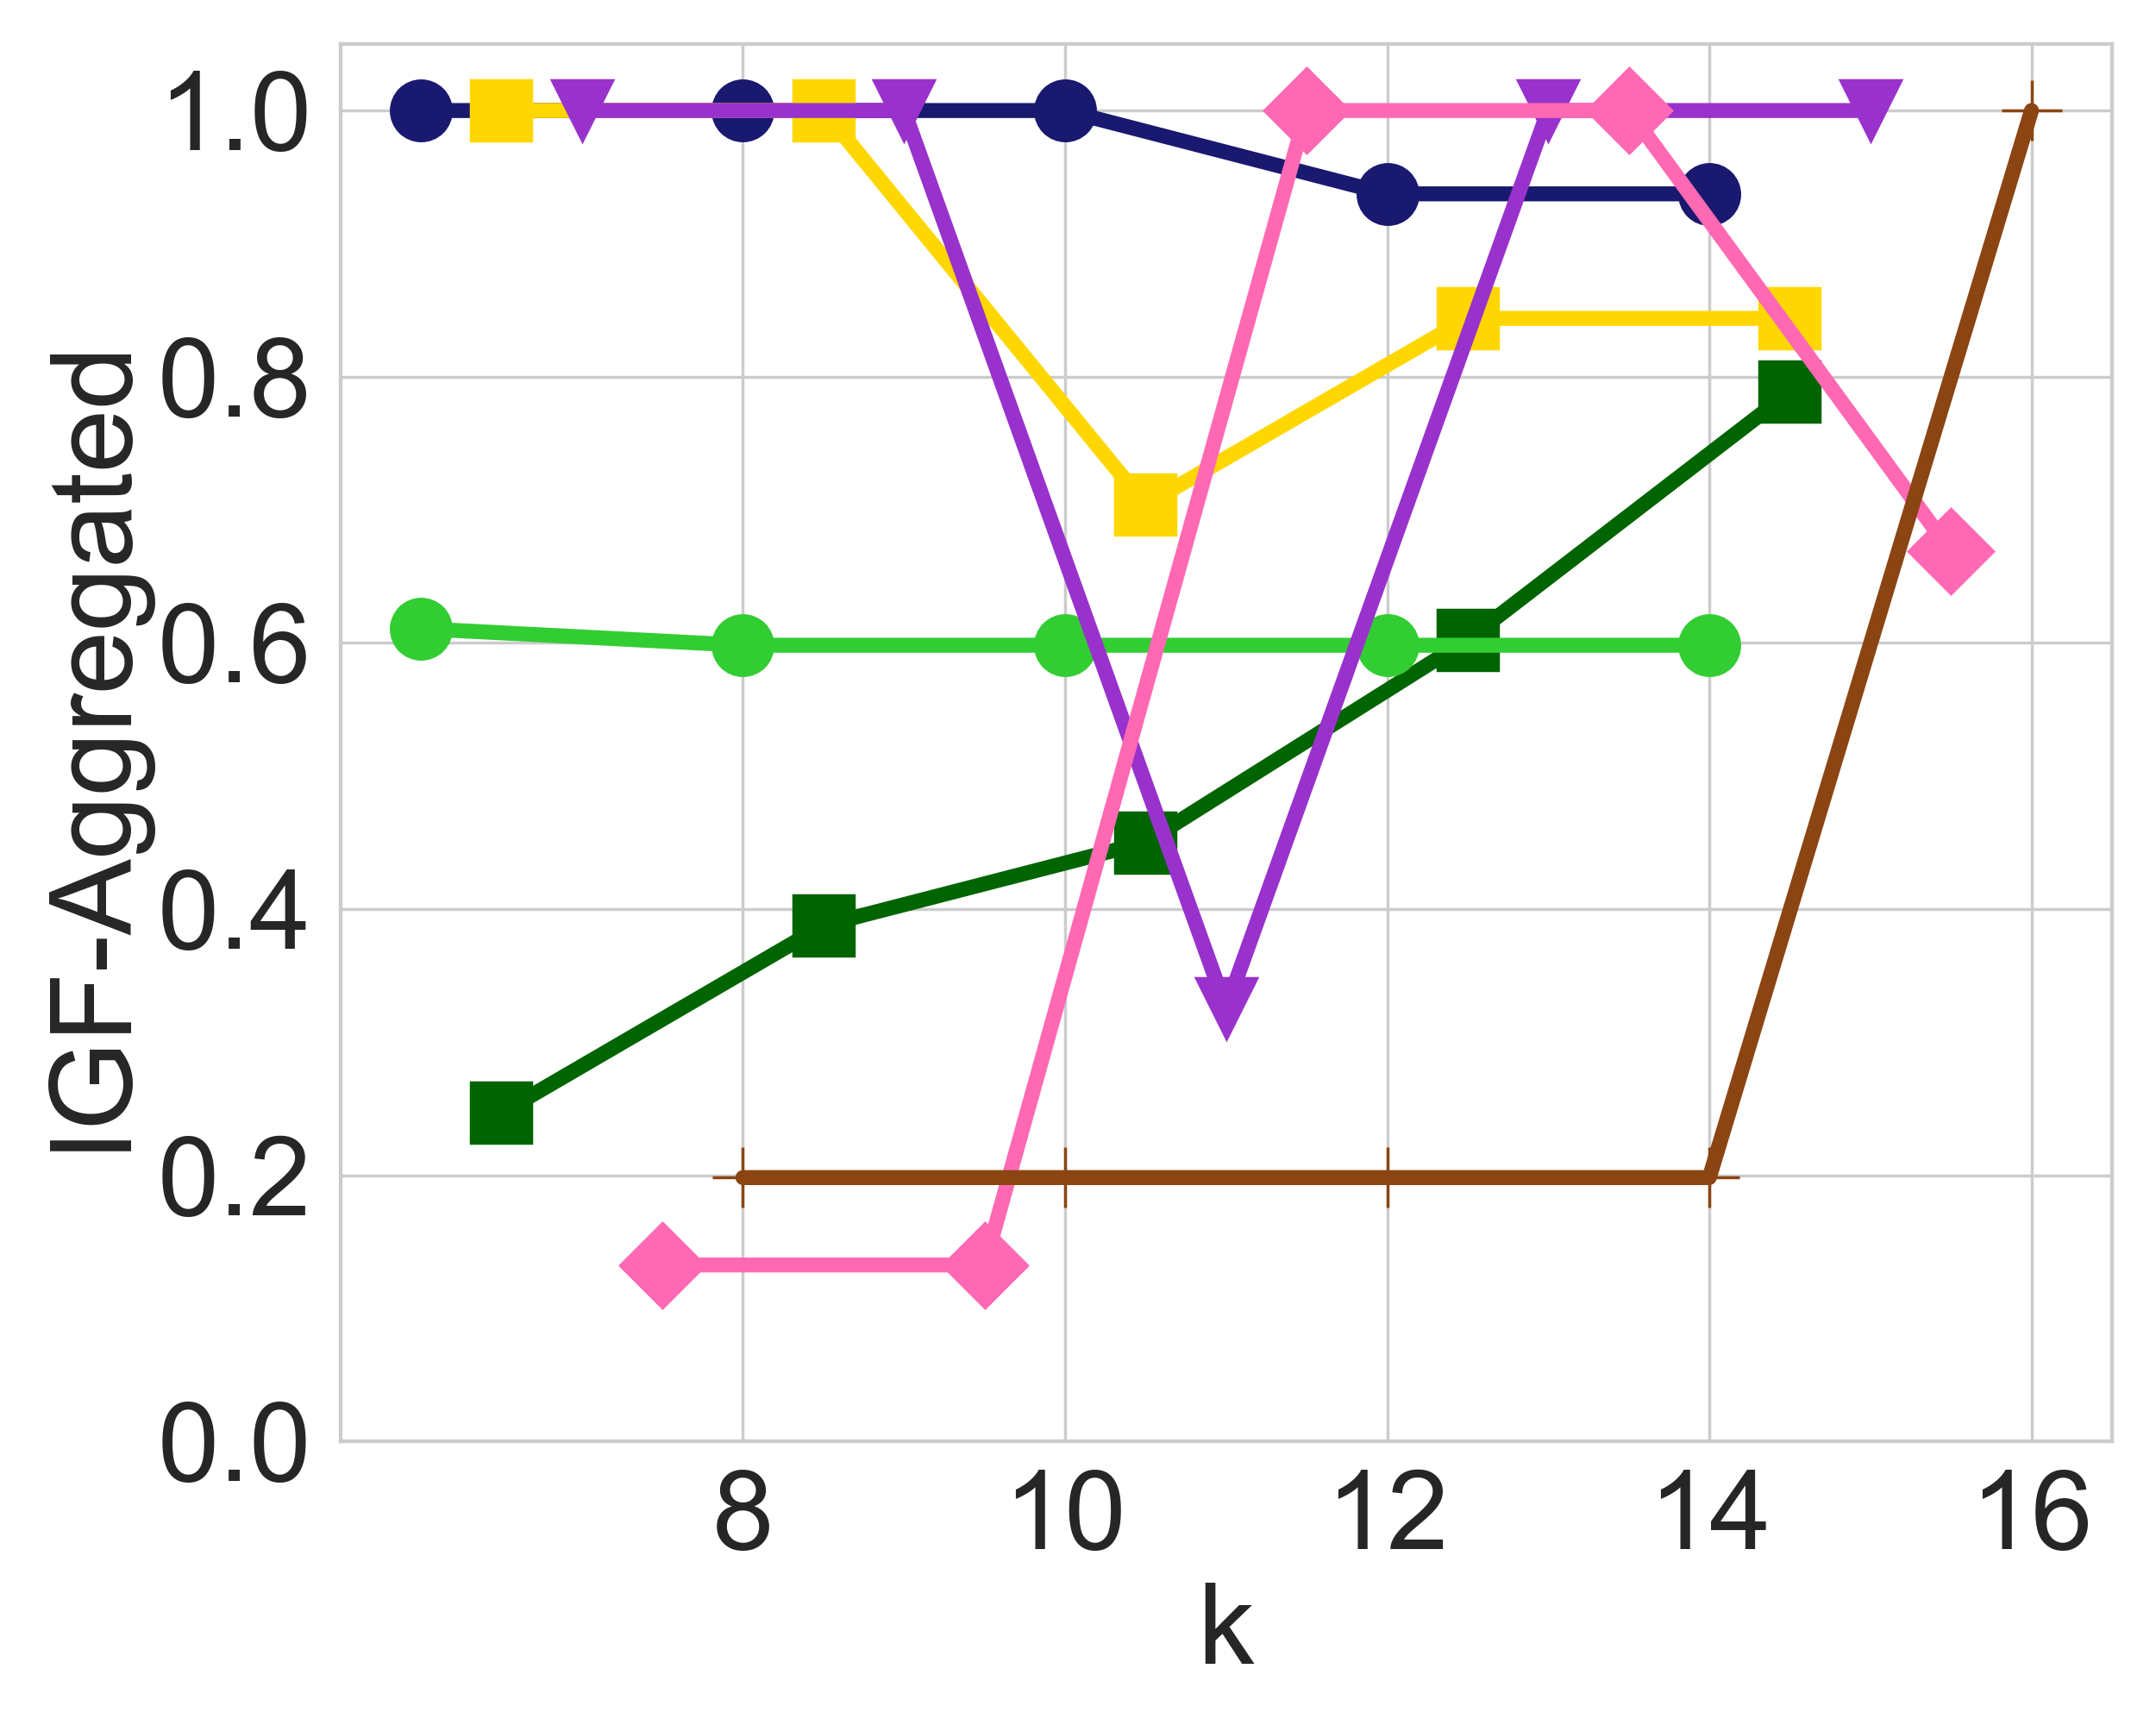
Using the in-group fairness measures defined in Section 3, we now experimentally evaluate the extent to which in-group fairness is violated in real datasets, as well as how well-balanced it is across the different groups of candidates. Figures 1a and 1c exhibit the and IGF-Aggregated values, respectively, for each of the 8 race groups and 2 age groups of the MEPS dataset, when a ranked list of the top- candidates is requested, for . For every prefix of the ranked list, diversity constraints ensure each race and age is represented in that prefix in approximate correspondence with their proportion in the input. For example, at least candidates among the top- are from the “Middle” age group, and at least are from the “Young” age group.
In both Figures 1a and 1c, we observe that diversity constraints cause a significant amount of in-group unfairness with respect to the two metrics, leading to values below 0.1 for some groups for both and IGF-Aggregated. In particular, the young age group and the American Indian race are the two groups with the lowest in-group fairness values in both cases. Apart from low in-group fairness values, we also observe a significant amount of imbalance, since some other groups actually receive very high in-group fairness values for both measures.
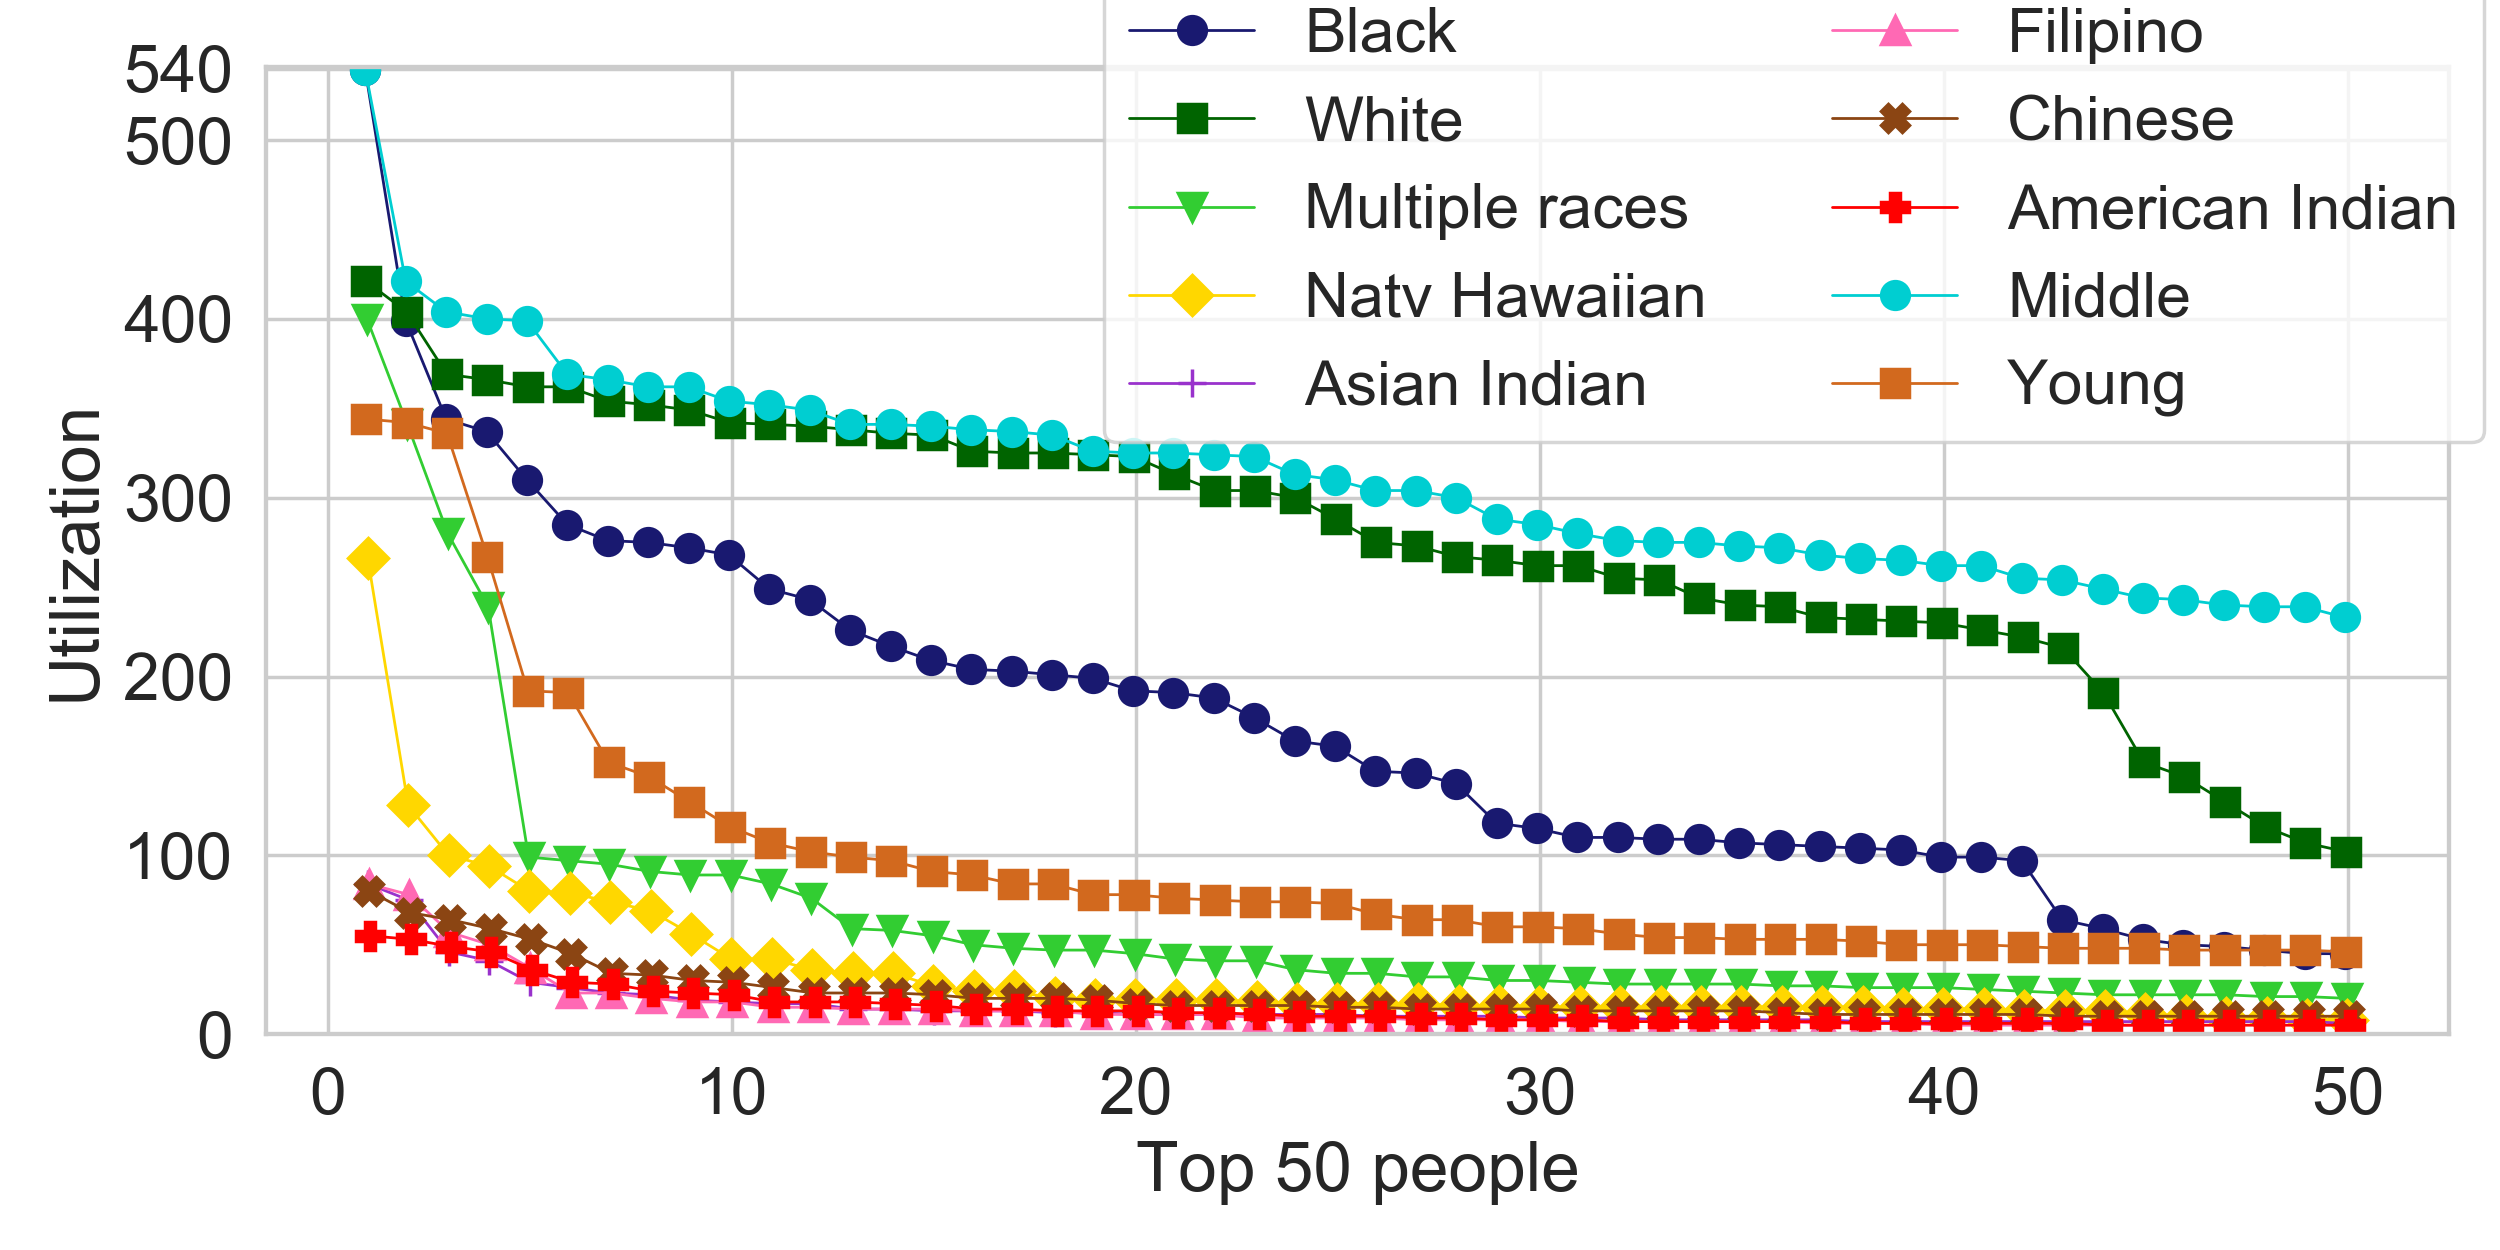
At this point, it is worth providing some intuition regarding why imbalance might arise to begin with. To help us with this intuition we provide Figure 3a, which exhibits the distribution of the scores for each group in MEPS (both race and age). From this plot, we can deduce that the individuals in the American Indian group tend to have lower scores compared to other ethnic groups, and that the young age group also has lower scores than the middle age group. However, diversity constraints require that these groups are represented in the output as well.
An important observation is that selecting a young American Indian in the outcome would satisfy two binding diversity constraints, while using just one slot in the outcome. This essentially “kills two birds with one stone”, compared to an alternative solution that would dedicate a separate slot for each minority. The slot that this solution “saves”, could then be used for a high scoring candidate that is not part of a minority, leading to a higher utility. Therefore without any in-group fairness constraints, the utility-maximizing solution is likely to include a young American Indian who is neither one of the top-scoring candidates in the young group, nor one of the top-scoring American Indians, thus introducing in-group unfairness to both of these groups.
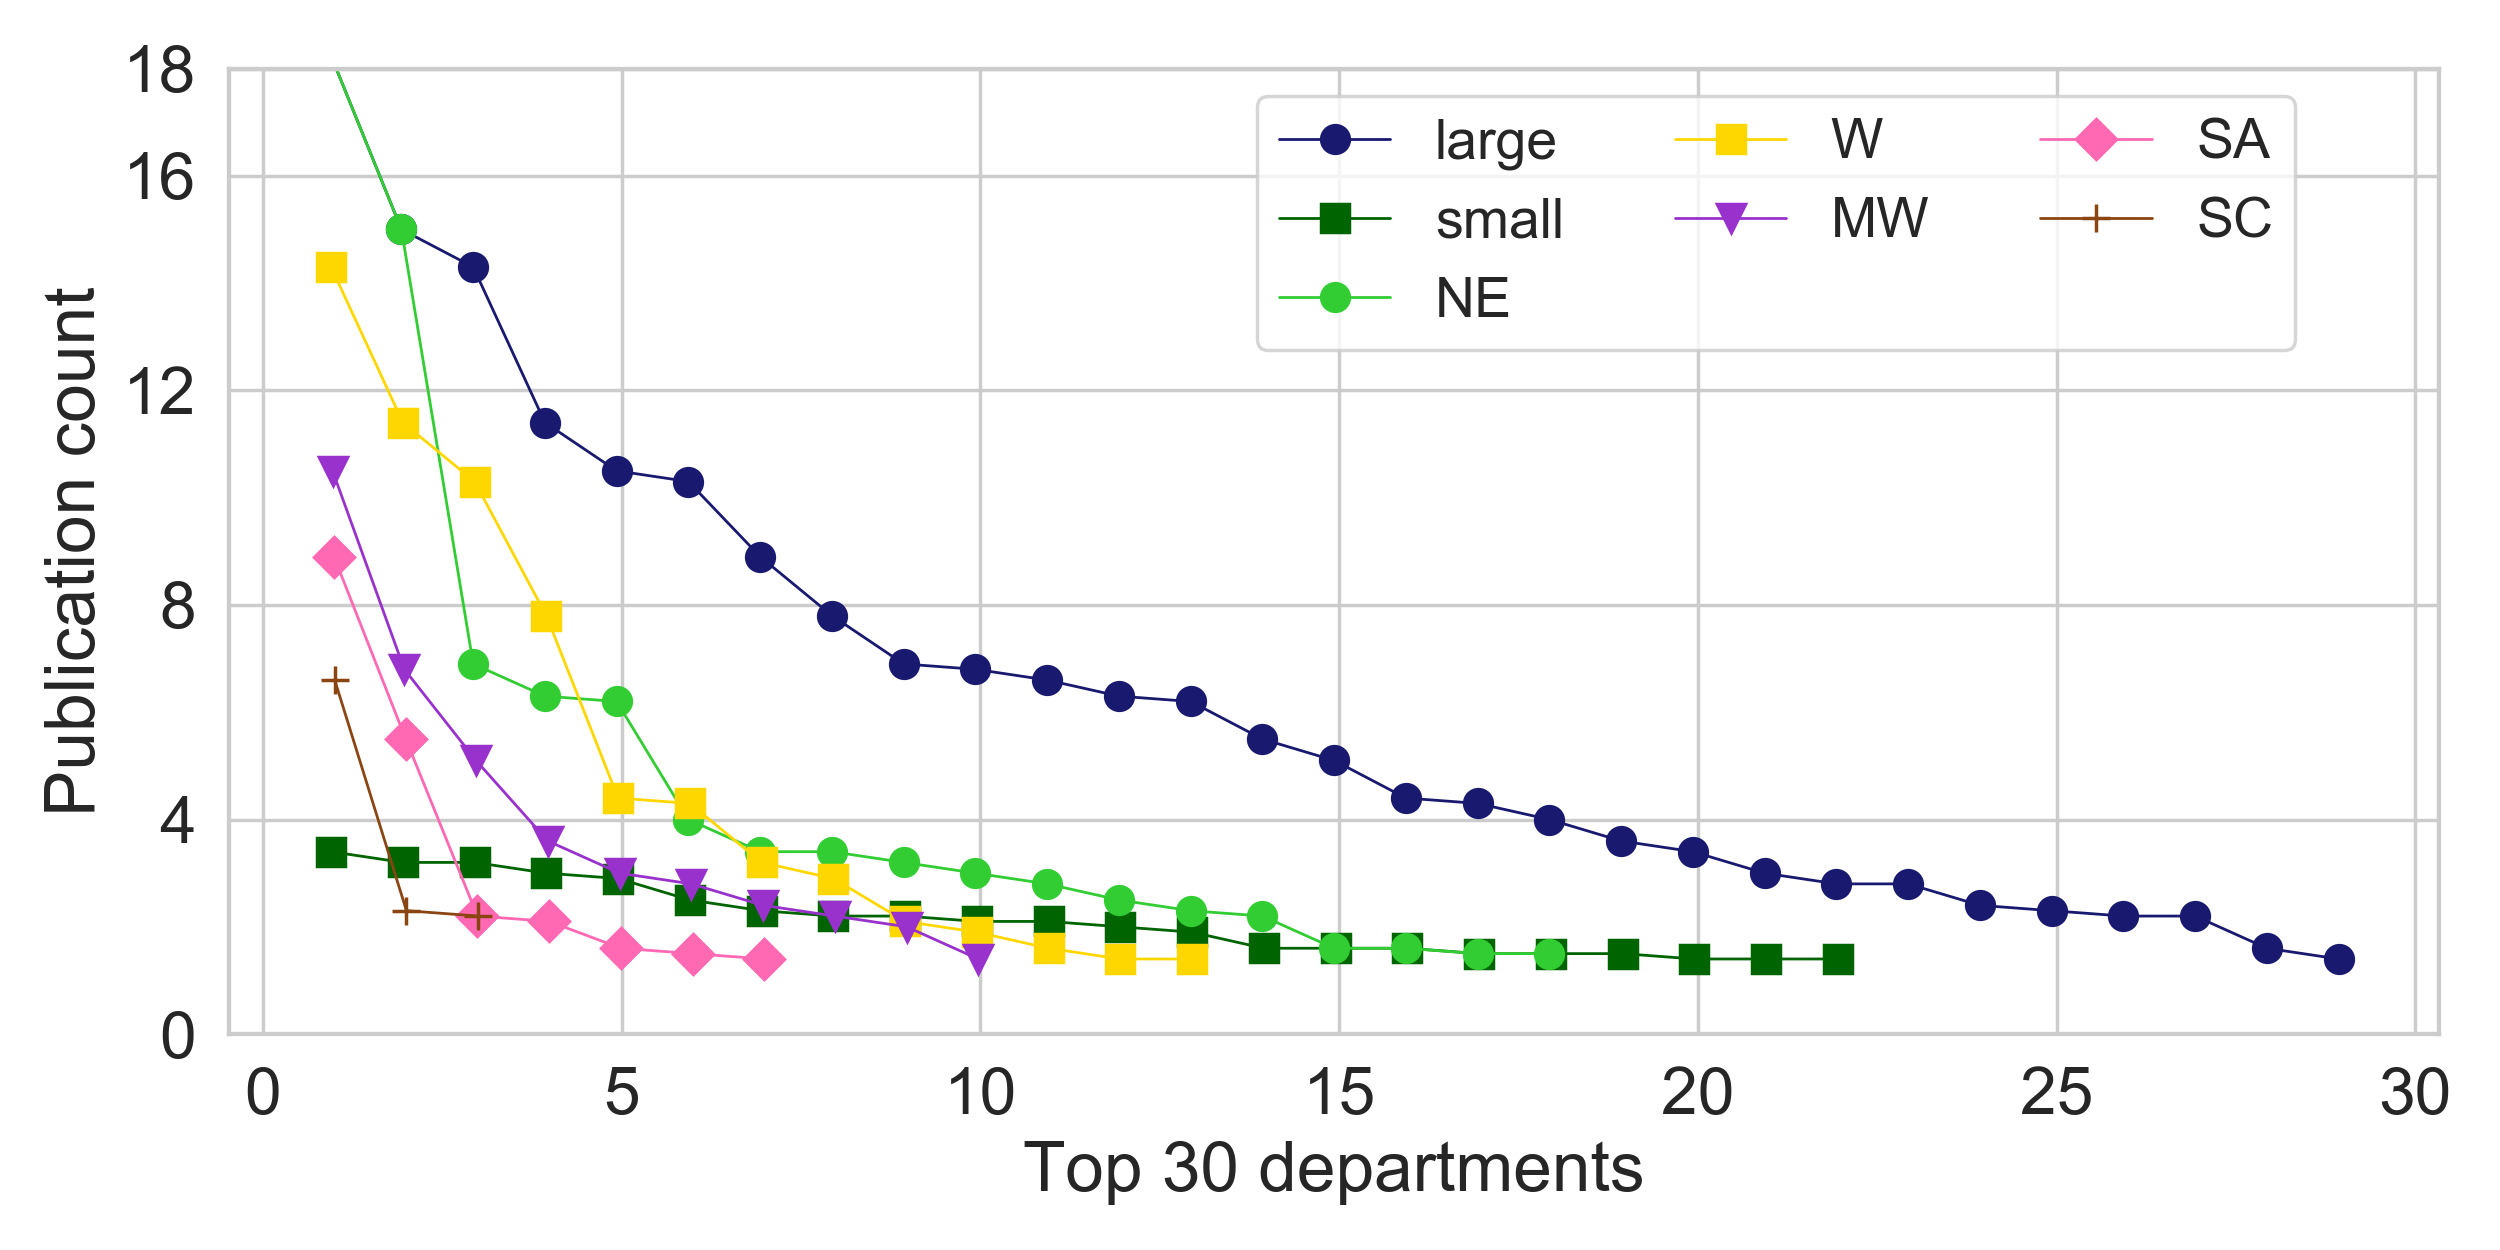
This undesired phenomenon — the selection of low-quality candidates that satisfy multiple diversity constraints — is more likely to impact low-scoring groups and may thus disproportionately affect historically disadvantaged minorities, or historically undervalued entities. We observe this in the CS dataset, where small departments, and departments located in South Center and South Atlantic areas, experience higher in-group unfairness before our mitigation (see Figures 2a, 2c, and 3b).
5.3 The Impact of Leximin Balancing
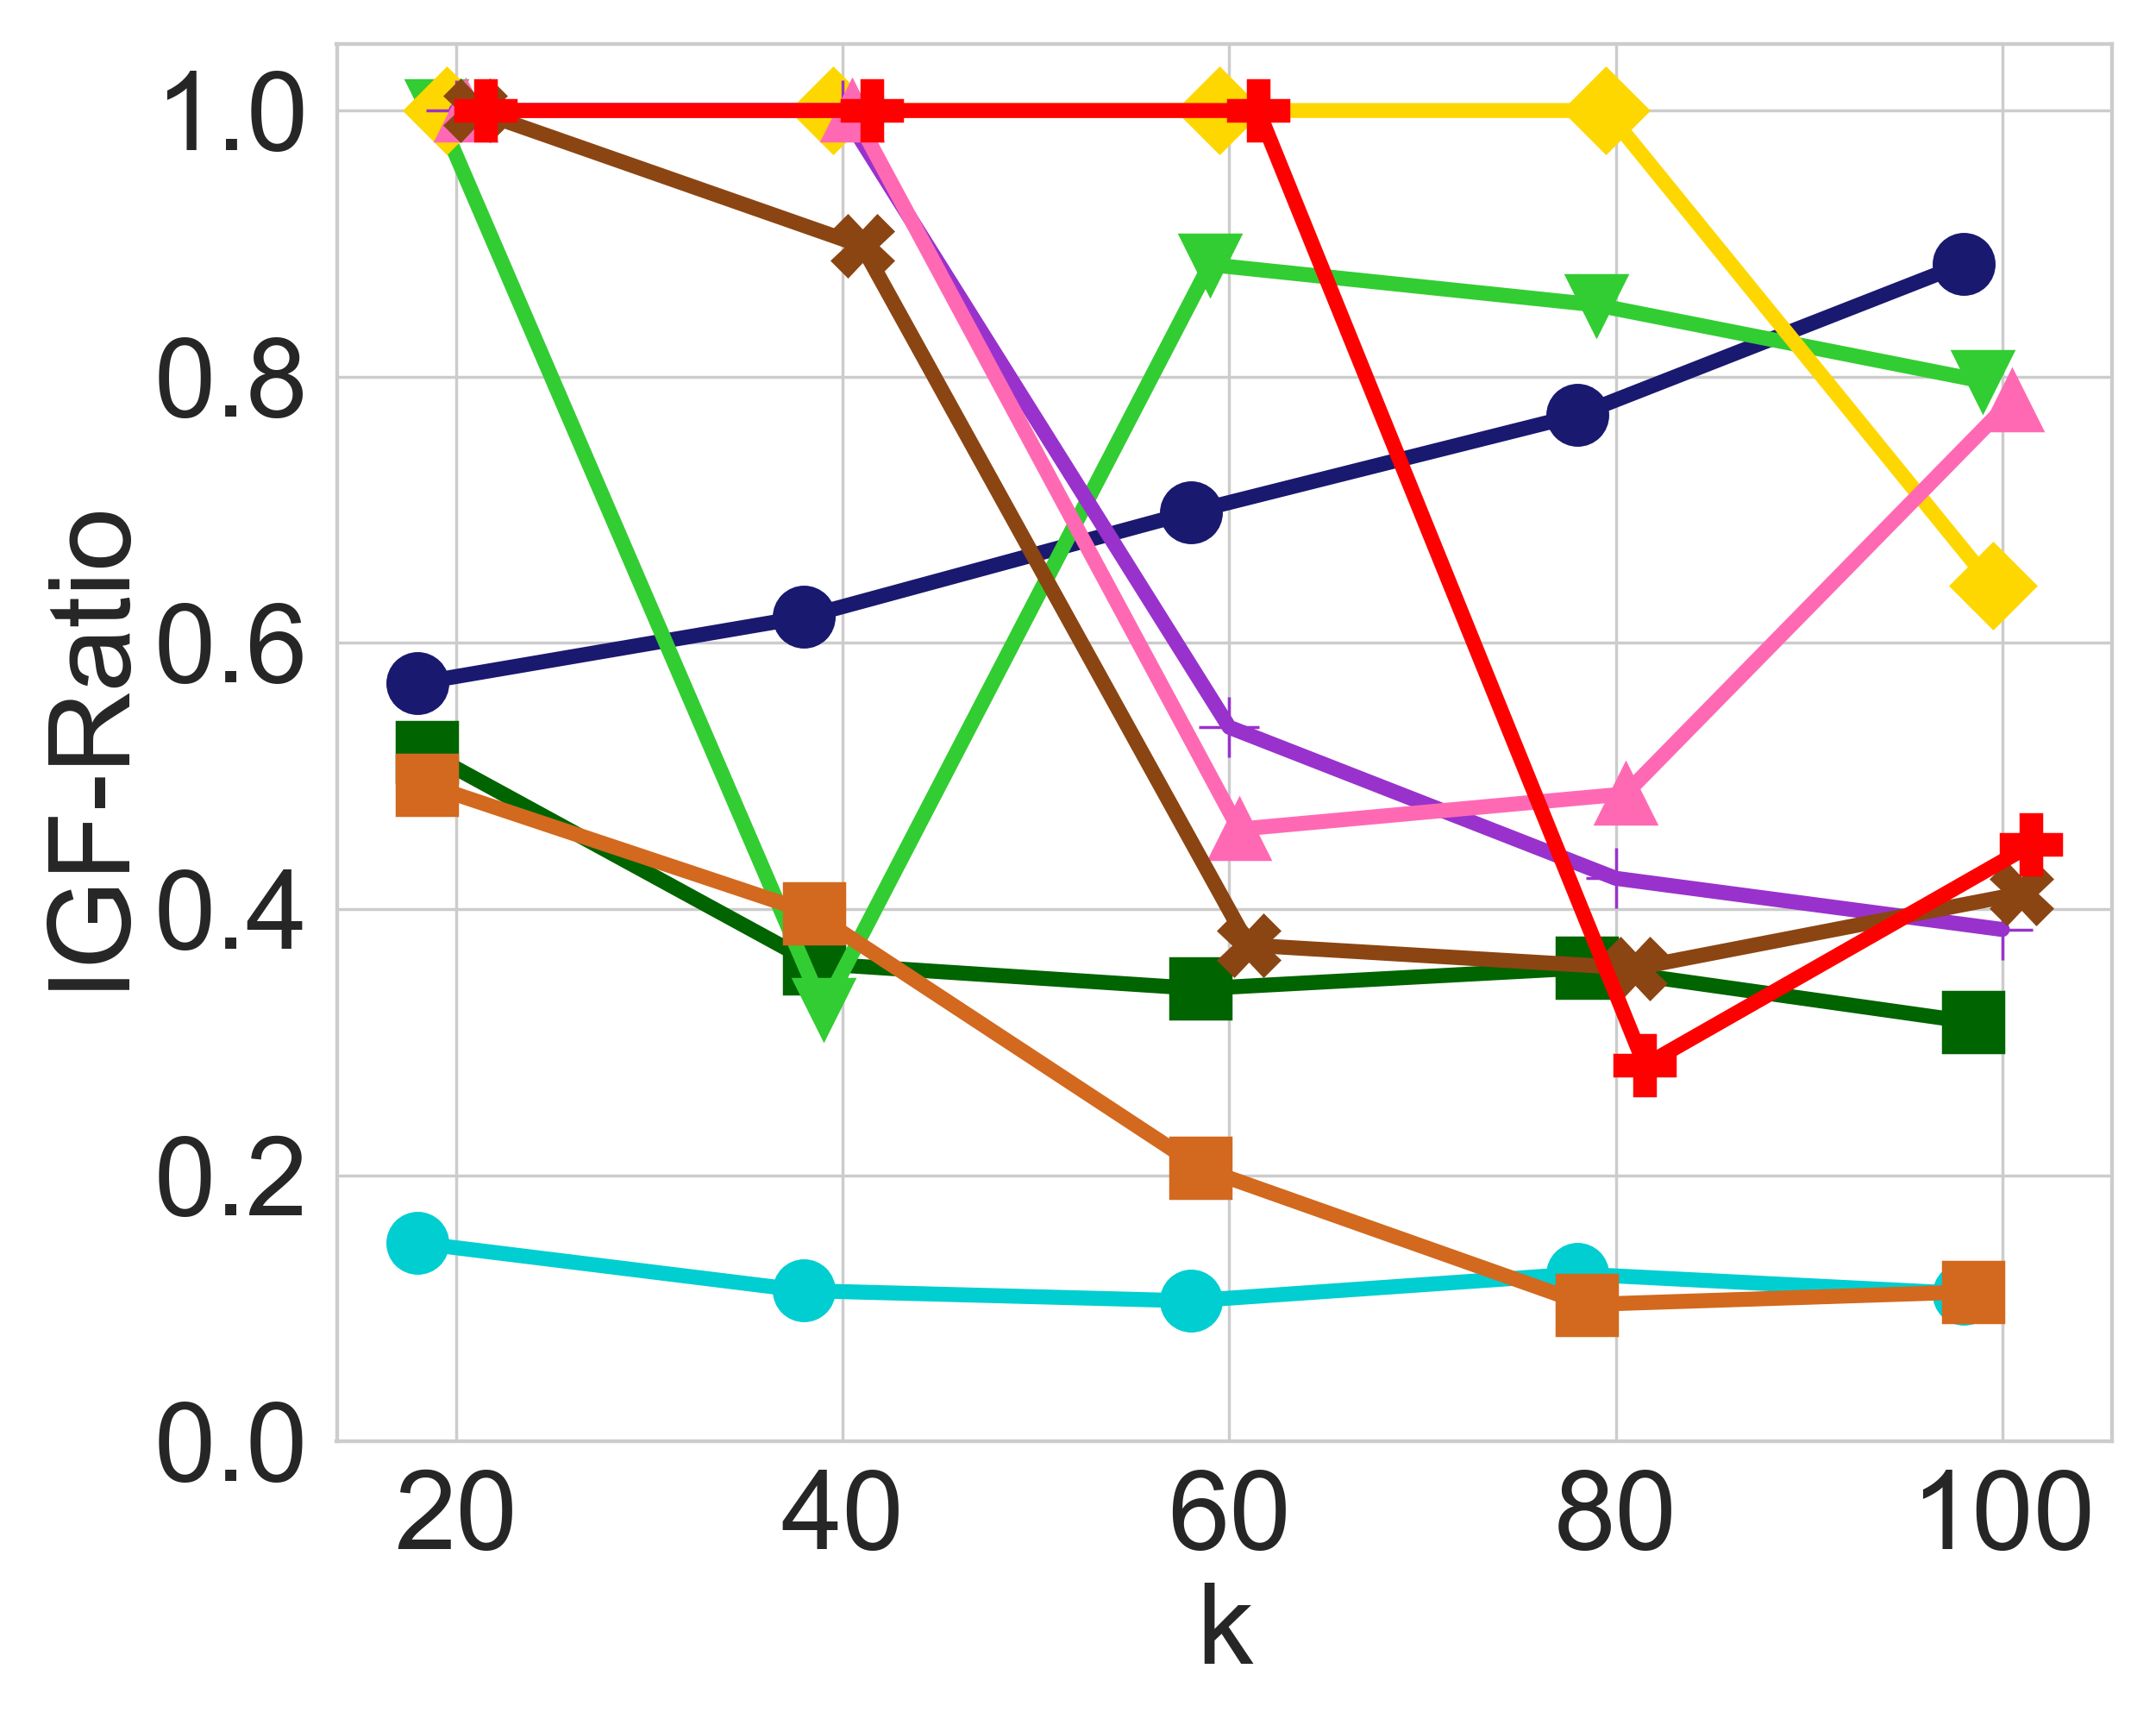
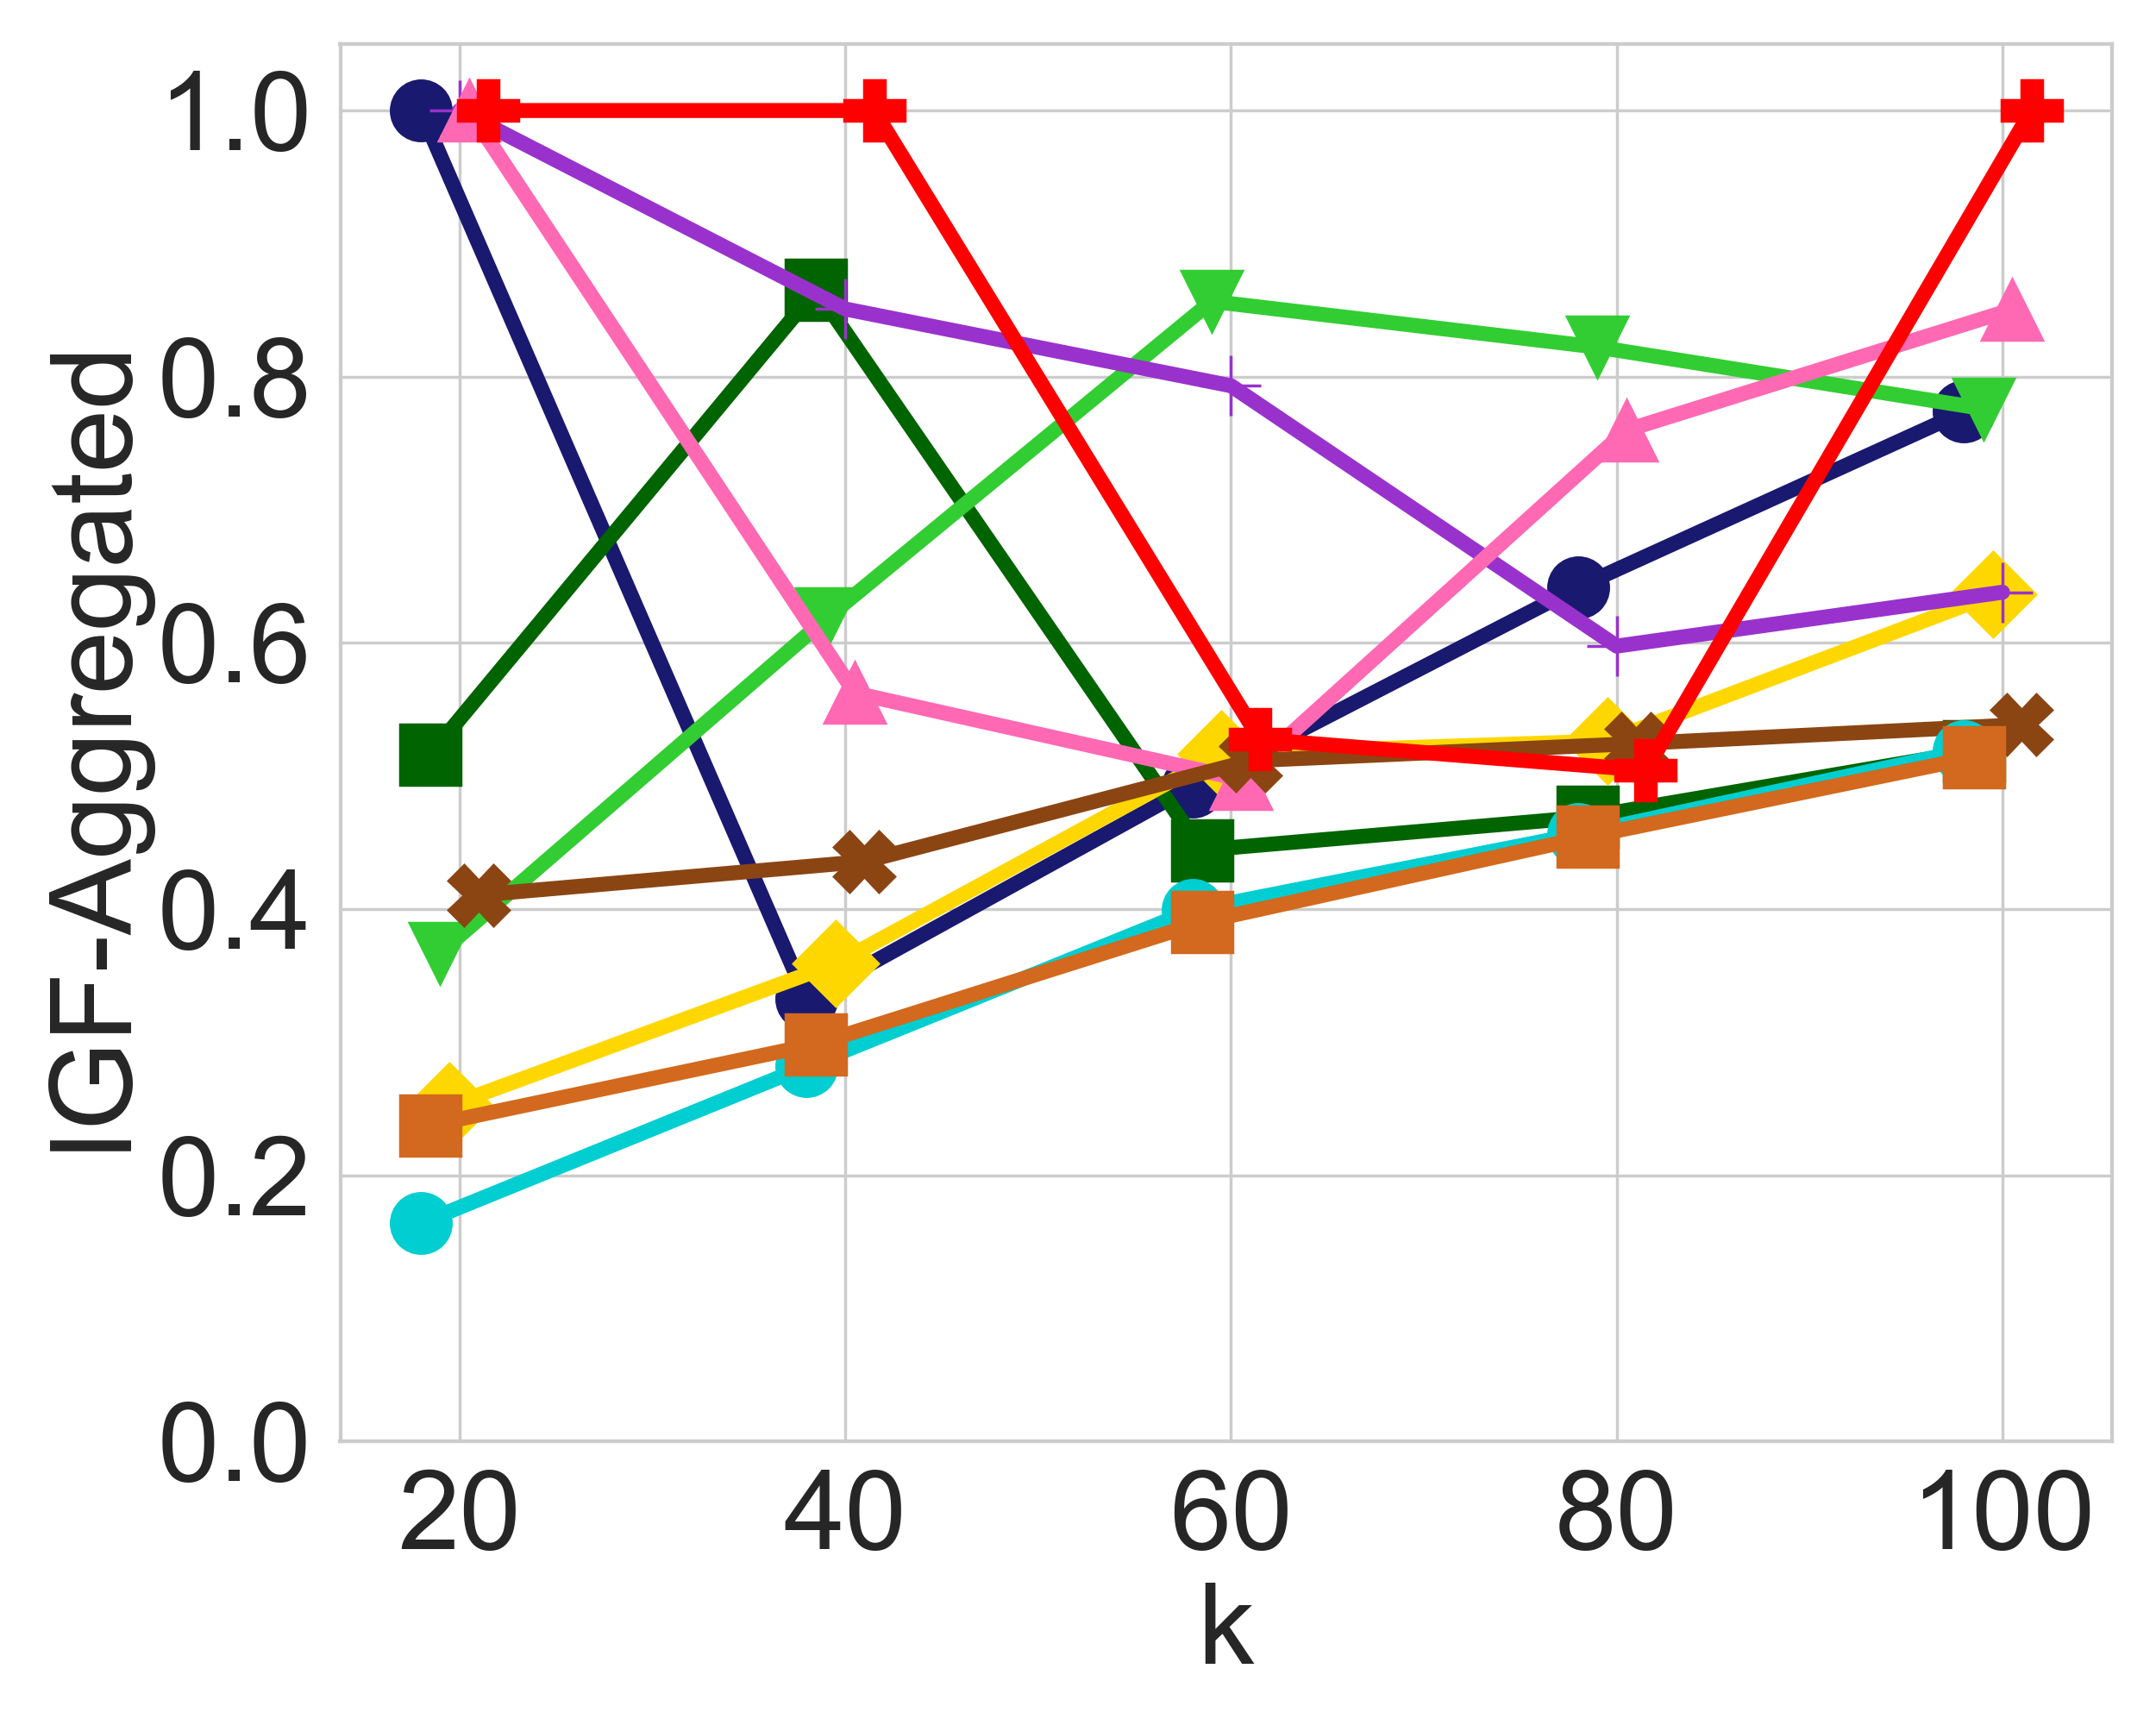
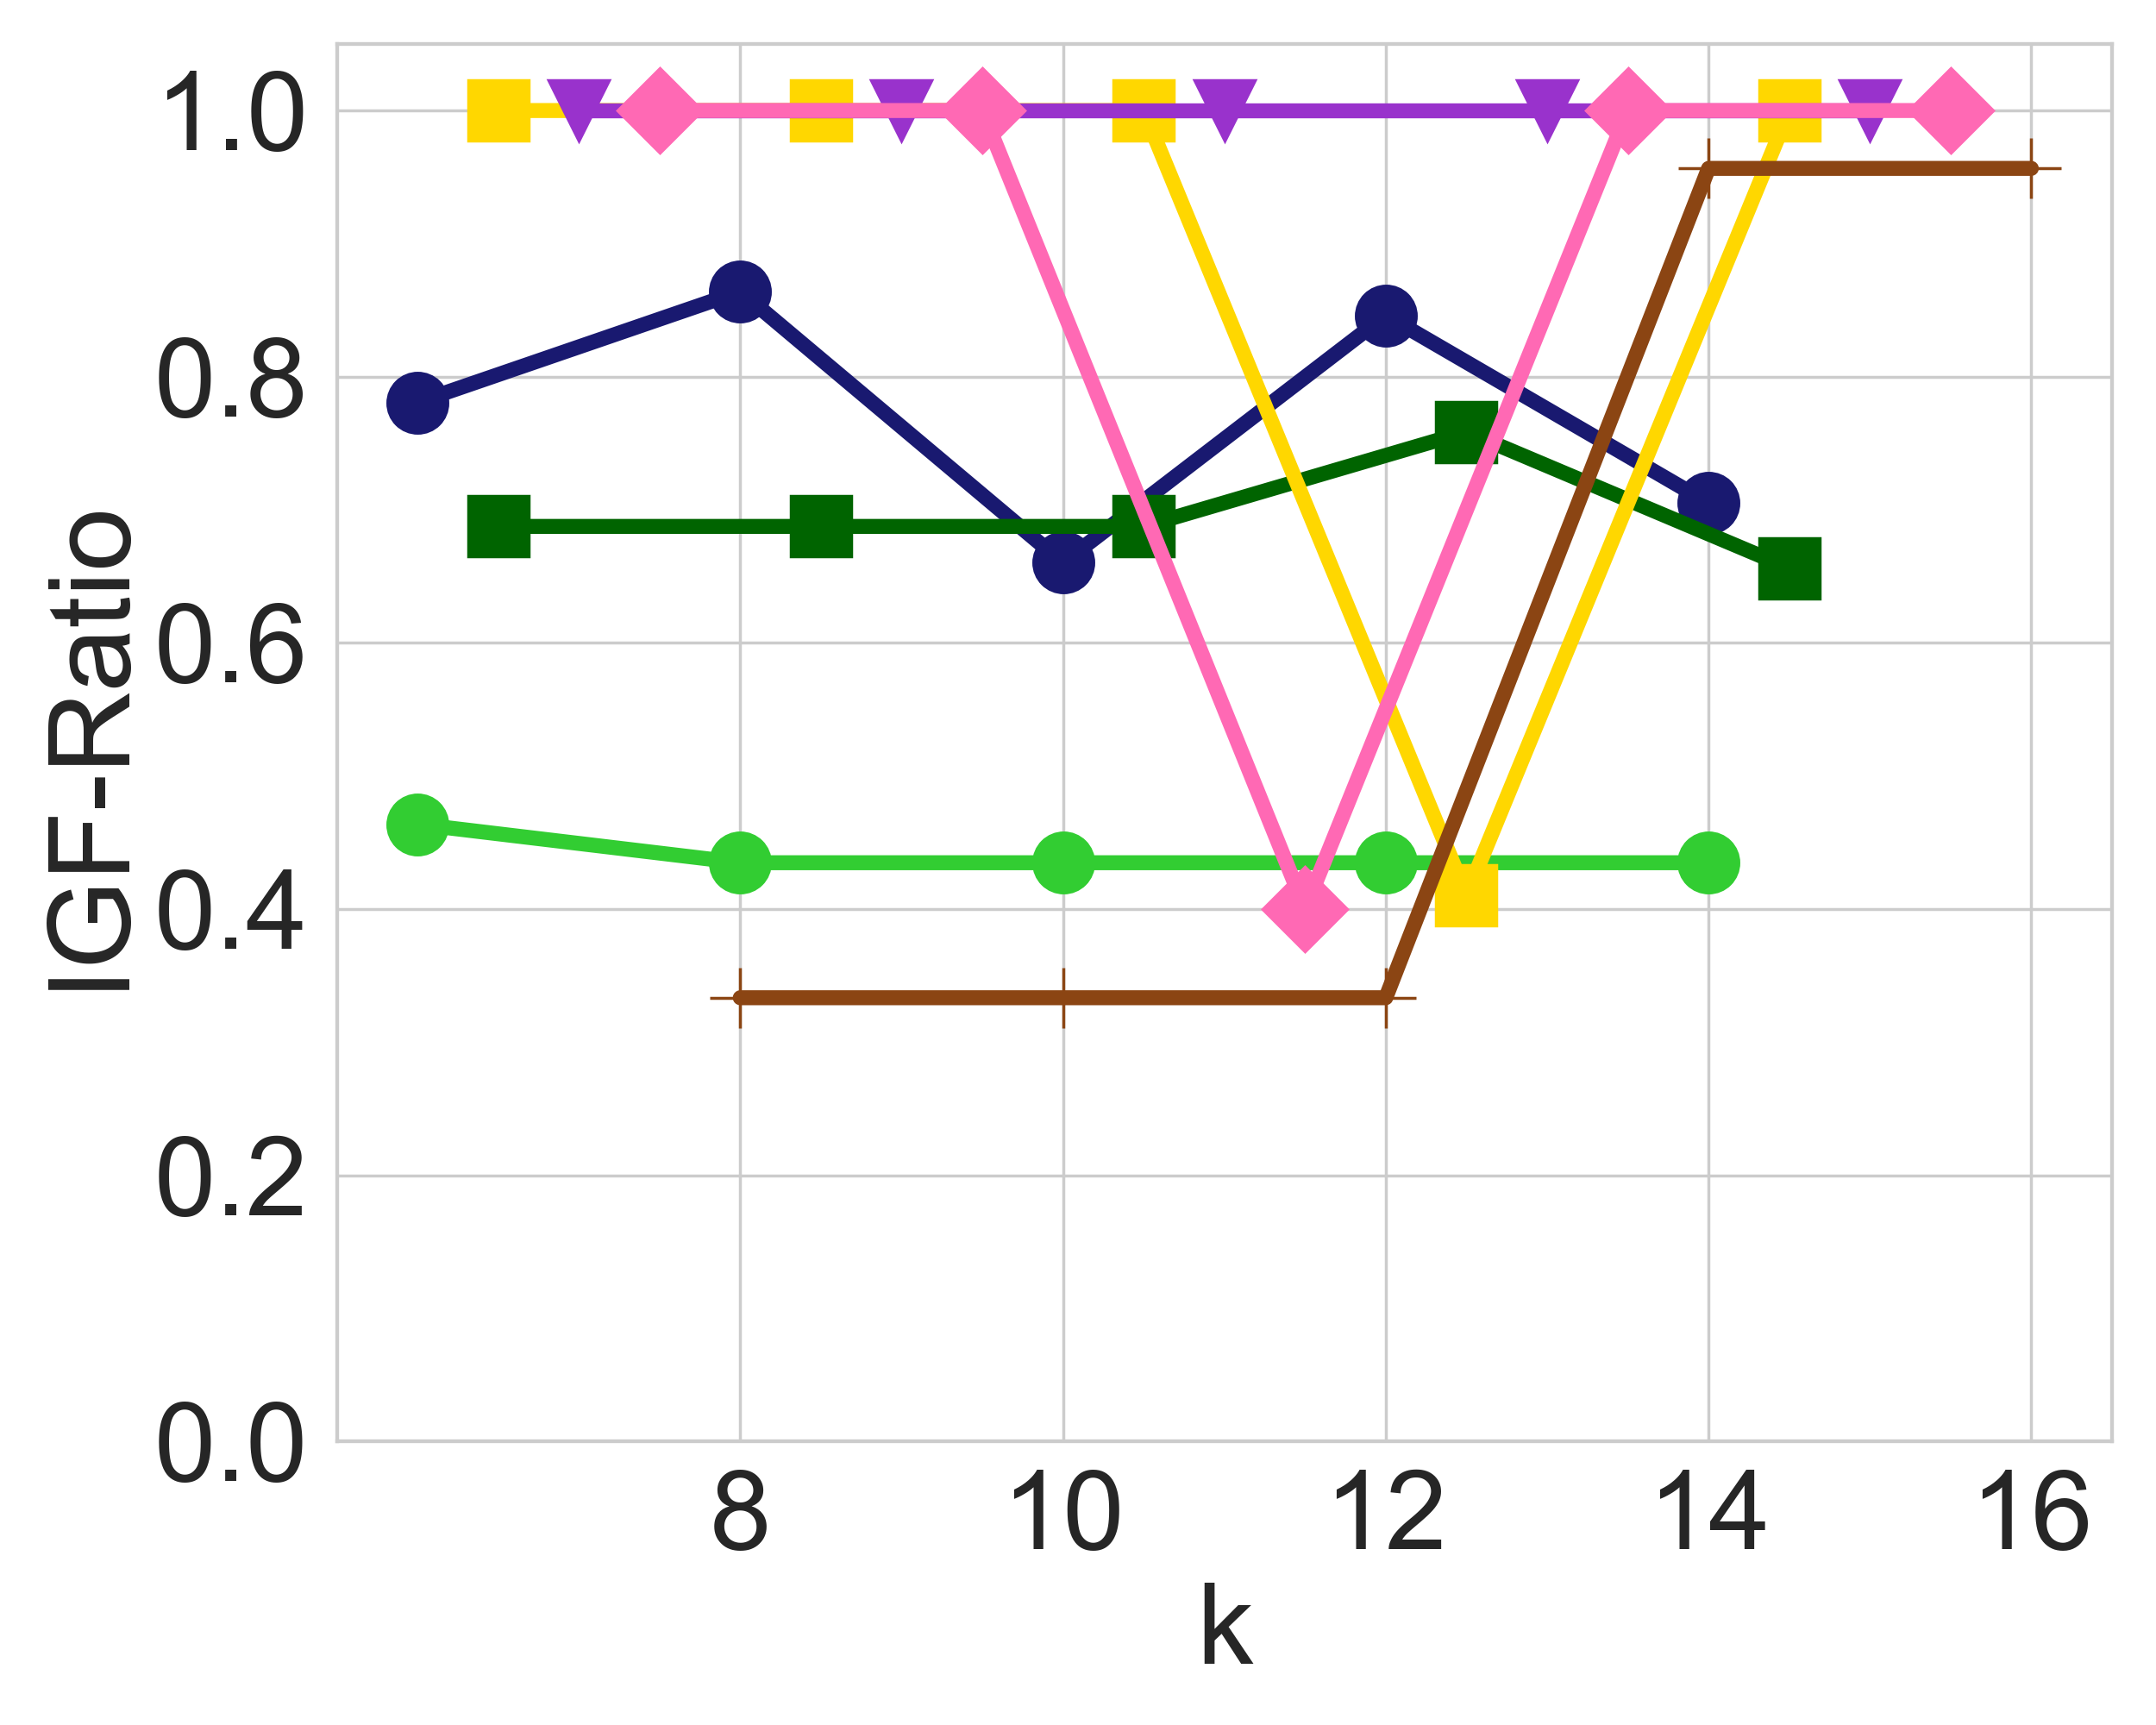
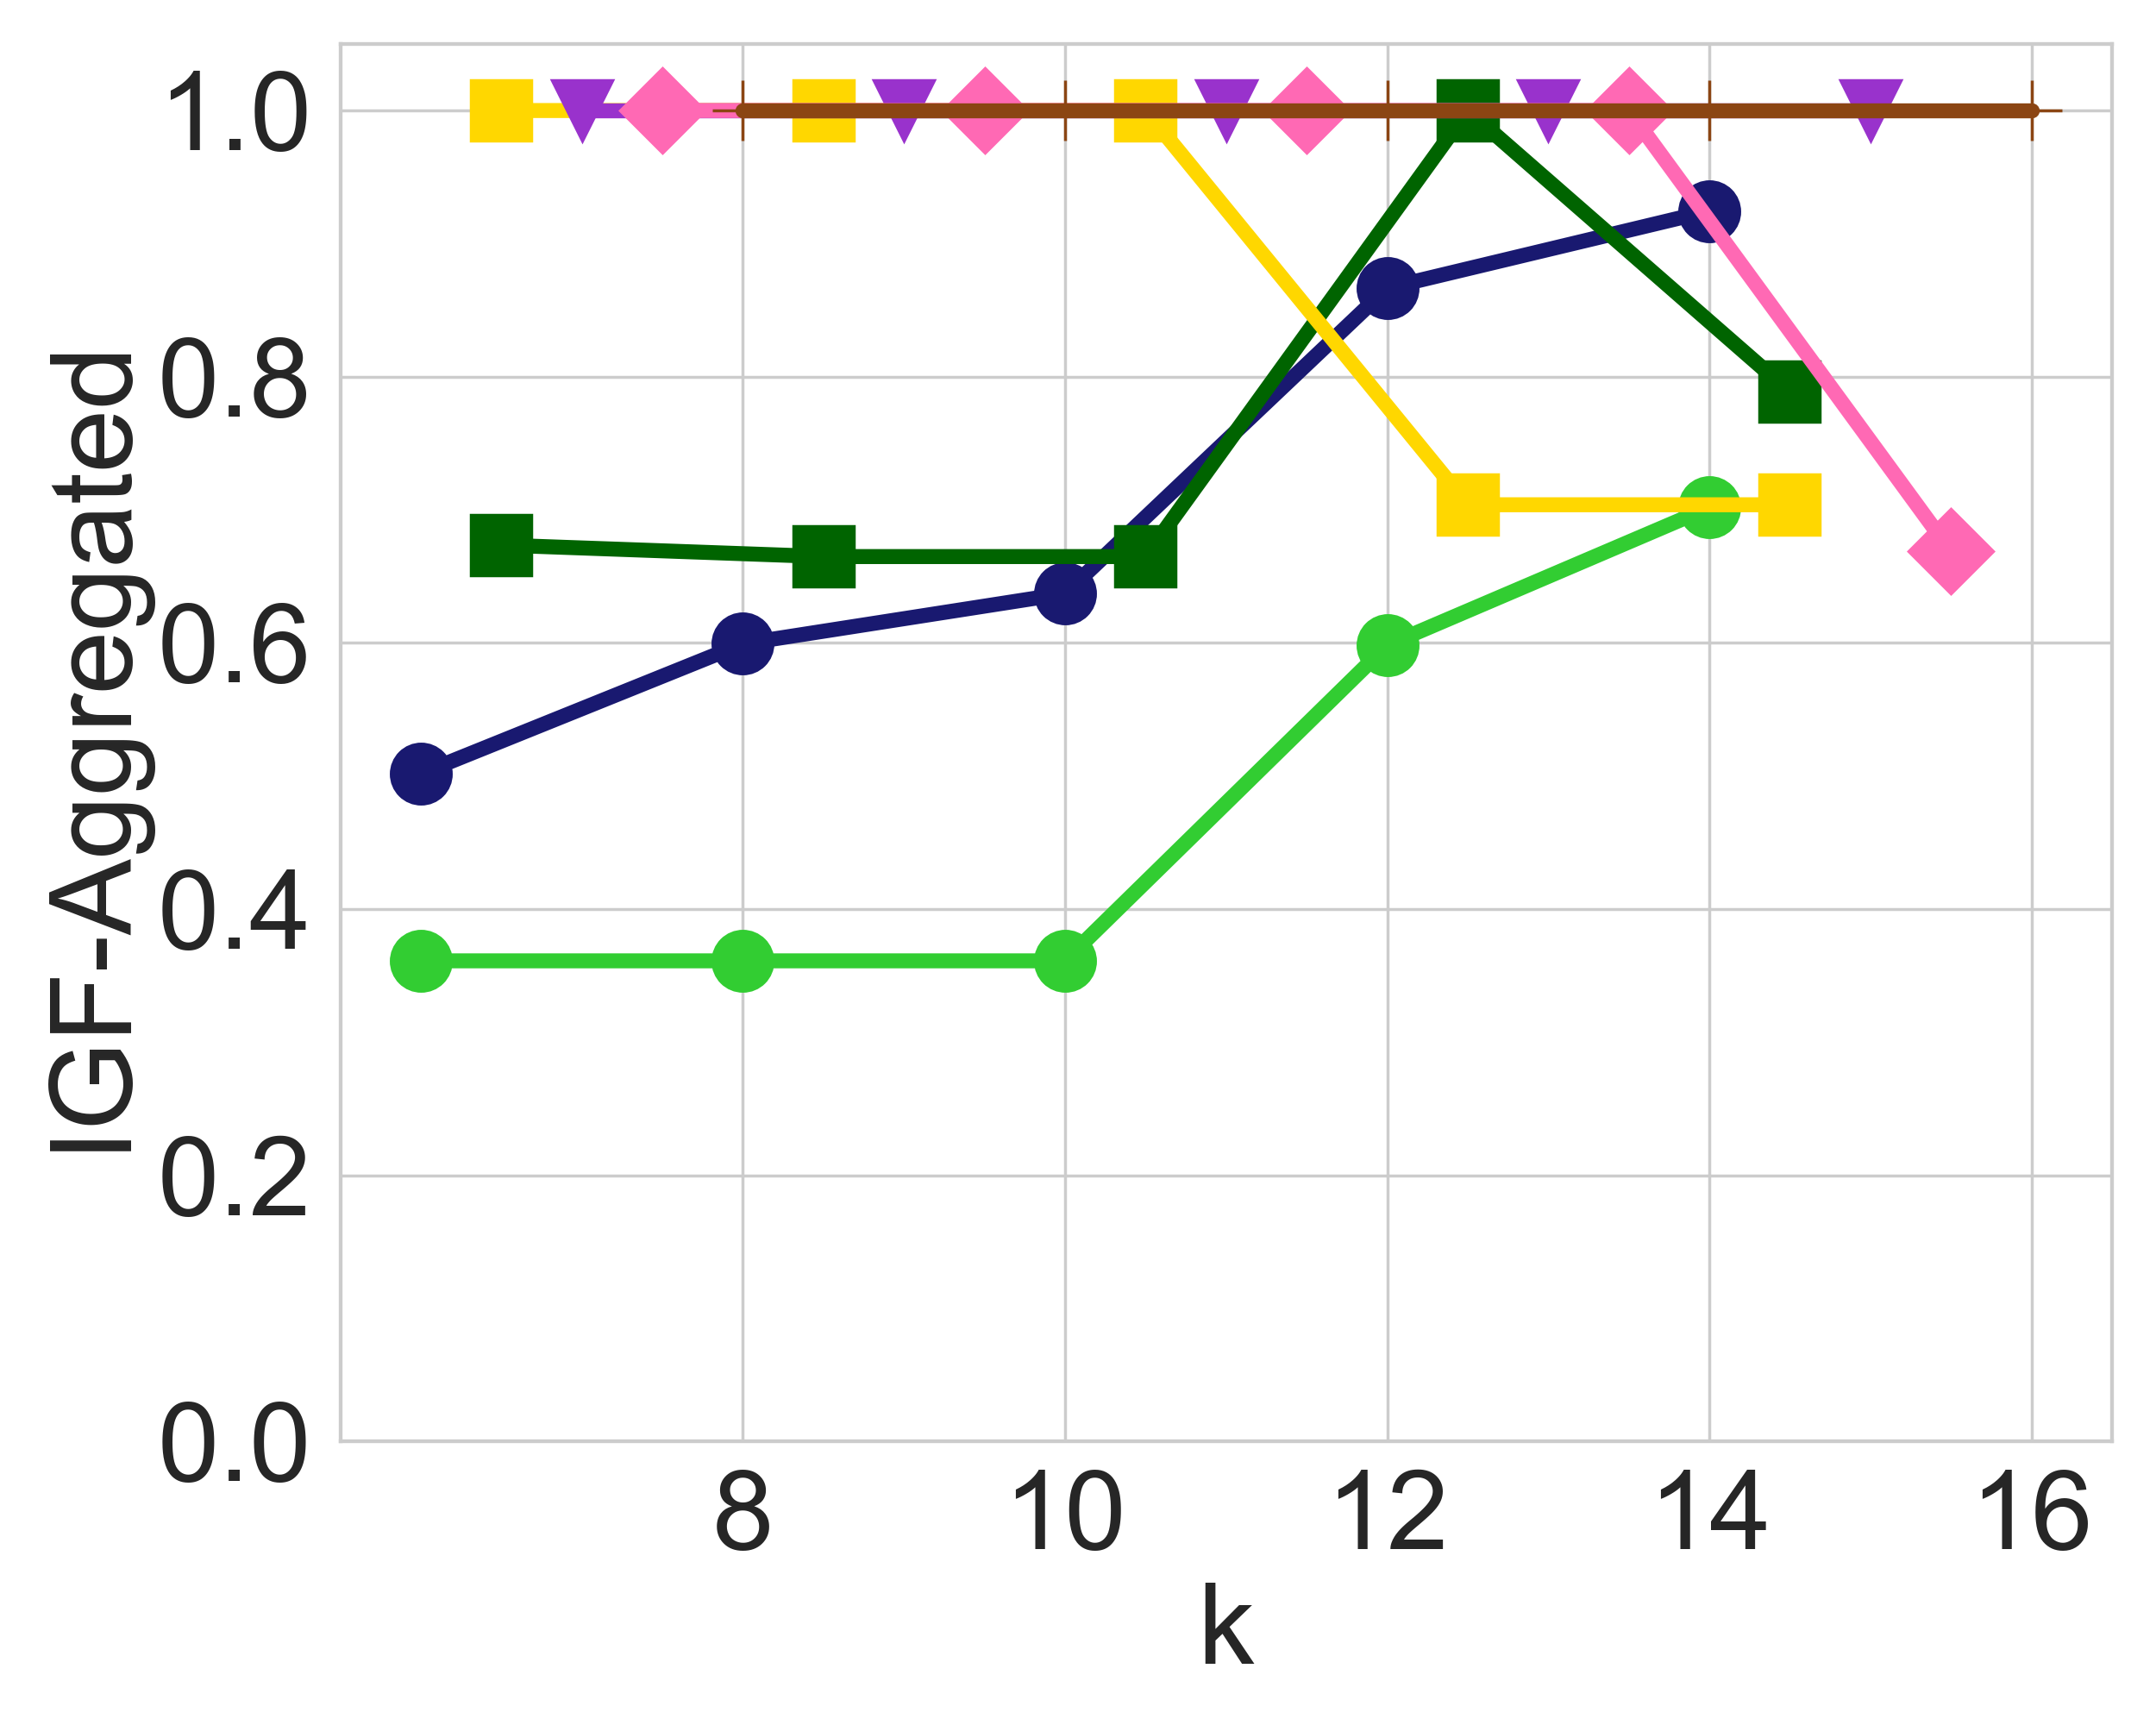
Having observed the imbalance that may arise in the output of an unrestricted utility-maximizing algorithm, and having explained how this may systematically adversely impact historically disadvantaged groups, we now proceed to evaluate the impact of the leximin solution. In all the Figures 1b, 1d, 2b, and 2d that are generated by the leximin solution, we see a clear improvement compared to their counterparts, before any balancing was introduced. Recall that the leximin solution’s highest priority is to maximize the minimum in-group fairness over all groups, so looking, for instance, at Figure 1d and comparing it with Figure 1c, it is easy to see that the minimum IGF-Aggregated value has strictly increased for every value of . Note that this does not mean that every group is better-off. For instance, the White group is significantly worse-off in Figure 1d, especially for larger values of . However, this drop in the in-group fairness of the White group enabled a very significant increase for the American Indian group, and a noticeable increase for the Chinese and young age groups, which suffered the most in-group unfairness prior to the balancing operation. As a result, the in-group fairness values after the leximin balancing operation are all much more concentrated in the middle of the plot, instead of resembling a bi-modal distribution of high and low in-group fairness values as was the case before, in Figure 1c.
We observe very similar patterns in all the other applications of balancing as well, exhibiting a consistently better-balanced in-group fairness across groups. Before we conclude, we also show that this significant improvement came without a very significant loss in utility.
The Price of Balance
Just like the enforcement of diversity constraints leads to a drop in utility, the same is also true when introducing the in-group fairness constraints in order to reach a more balanced distribution. To get a better sense of the magnitude of this loss in utility to achieve fairness, in Table 2 we show the percentage loss caused by in-group fairness and diversity constraints, measured against the optimality utility. Note that the in the columns correspond to for MEPS and to for CS. Therefore, the entry in the first columns and first row of this table should be interpreted as follows: for the MEPS dataset and a ranking request with , enforcing diversity constraints leads to a loss of in utility, compared to the outcome without any such constraints. The entry to its right (), is the additional loss in utility caused if, on top of the diversity constraints, we also enforce the leximin constraints for the measure. Similarly, the next entry to the right () is the additional loss in utility caused if, on top of the diversity constraints, we also enforce the leximin constraints for the IGF-Aggregated measure. We note that, compared to the of utility loss required by diversity constraints alone, the utility loss due to balancing in-group fairness is actually quite small, and we observe this to be the case for both datasets and all values in our experiments.
As a final remark we note that, despite the fact that integer linear programs are not polynomial time solvable in general, the computational cost involved in computing the utility-maximizing outcome for a given vector of values was not too significant, and the standard library solvers were quite efficient. Even for the most time-consuming case, which was the IGF-Aggregated measure and the MEPS dataset, the solver would complete in a matter of a few minutes.
6 Related Work
Yang and Stoyanovich were the first to consider fairness in ranked outputs Yang and Stoyanovich (2017). They focused on a single binary sensitive attribute, such as male or female gender, and minority or majority ethnic group. They then proposed three fairness measures, each quantifying the relative representation of protected group members at discrete points in the ranking (e.g., top-, top-, etc.), and compounding these proportions with a logarithmic discount, in the style of information retrieval. A follow-up work Zehlike et al. (2017) developed a statistical test to ascertain whether group fairness holds in a ranking, also with respect to a single binary sensitive attribute, and proposed an algorithm that mitigates the lack of group fairness. They further proposed the notions of in-group monotonicity and ordering utility that are similar in spirit to our in-group fairness. The imbalance in terms of in-group fairness does not arise in the set-up of Zehlike et al., where only a single sensitive attribute is considered.
Stoyanovich et al. (2018) considered online set selection under label-representation constraints for a single sensitive attribute, and posed the Diverse -choice Secretary Problem: pick candidates, arriving in random order, to maximize utility (sum of scores), subject to diversity constraints. These constraints specify the lowest () and highest () number of candidates from group to be admitted into the final set. The paper developed several set selection strategies and showed that, if a difference in scores is expected between groups, then these groups must be treated separately during processing. Otherwise, a solution may be derived that meets the constraints, but that selects comparatively lower-scoring members of a disadvantaged group — it lacks balance.
Trade-offs between different kinds of accuracy and fairness objectives for determining risk scores are discussed in Kleinberg et al. (2017). The authors use the term balance to refer to performance of a method with respect to members of a particular class (positive or negative), and note that “the balance conditions can be viewed as generalizations of the notions that both groups should have equal false negative and false positive rates.” Our use of the term “balance” is consistent with their terminology, as it applies to in-group fairness.
The work of Celis et al. (2018) conducts a theoretical investigation of ranking with diversity constraints of the kind we consider here, for the general case of multiple sensitive attributes. They prove that even the problem of deciding feasibility of these constraints is NP-hard. They provide hardness results, and develop exact and approximation algorithms for the constrained ranking maximization problem, including a linear program and a dynamic programming solution. These algorithms also allow for the scores of the candidates to be position-specific. The novelty of our work compared to that of Celis et al. is that we focus on the imbalance in terms of in-group fairness, develop methods for mitigating the imbalance, and provide an empirical study of these methods.
Diversity, as a crucial aspect of quality of algorithmic outcomes, has been studied extensively in Information Retrieval Agrawal et al. (2009); Clarke et al. (2008) and content recommendation Kaminskas and Bridge (2017); Vargas and Castells (2011). See also Drosou et al. (2017) for a recent survey of diversity in set selection tasks, including also a conceptual comparison of diversity and fairness, in the sense of statistical parity.
7 Conclusion and Open Problems
In this paper we identified the lack of in-group fairness as an undesired consequence of maximizing total utility subject to diversity constraints, in the context of set selection and ranking. We proposed two measures for evaluating in-group fairness, and developed methods for balancing its loss across groups. We then conducted a series of experiments to better understand this issue and the extent to which our methods can mitigate it. This paper opens up many interesting research directions, both empirical and theoretical.
From an empirical standpoint, it would be important to develop a deeper understanding of the aspects that may cause disproportionate in-group unfairness. In our experimental evaluation we observed that, all else being equal, a larger difference in expected scores between disjoint groups leads to a higher imbalance in terms of in-group fairness. In the future, we would like to identify additional such patterns that may lead to systematic imbalance, especially when this may disproportionately impact disadvantaged groups.
From a theoretical standpoint, it would be interesting to understand the extent to which polynomial time algorithms can approximate the optimal utility or approximately satisfy the combination of diversity and in-group fairness constraints. In this paper we restricted our attention to finding exact solutions to the defined optimization problems and, since even simplified versions of these problems are NP-hard, we had to resort to algorithms without any appealing worst-case guarantees. In Celis et al. (2018), the authors considered the design of approximation algorithms for closely related problems involving diversity constraints, but without any in-group fairness constraints. On the other hand, Celis et al. (2018) also consider ranking problems where the candidates’ scores can be position-dependent. Extending our framework to capture these generalizations is another direction for future work.
Finally, moving beyond the leximin solution, one could consider alternative ways to choose the in-group fairness vector , such as maximizing the Nash social welfare, an approach that has recently received a lot of attention (e.g., Cole and Gkatzelis (2018) and Caragiannis et al. (2016)).
Acknowledgements.
This work was supported in part by NSF Grants No. 1926250, 1916647, and 1755955.
References
- Agrawal et al. [2009] Rakesh Agrawal, Sreenivas Gollapudi, Alan Halverson, and Samuel Ieong. Diversifying search results. In Proceedings of the 2nd International Conference on Web Search and Web Data Mining, WSDM, pages 5–14, 2009.
- Bellamy et al. [2018] Rachel K. E. Bellamy, Kuntal Dey, Michael Hind, Samuel C. Hoffman, Stephanie Houde, Kalapriya Kannan, Pranay Lohia, Jacquelyn Martino, Sameep Mehta, Aleksandra Mojsilovic, Seema Nagar, Karthikeyan Natesan Ramamurthy, John T. Richards, Diptikalyan Saha, Prasanna Sattigeri, Moninder Singh, Kush R. Varshney, and Yunfeng Zhang. AI fairness 360: An extensible toolkit for detecting, understanding, and mitigating unwanted algorithmic bias. CoRR, abs/1810.01943, 2018.
- Berger [2018] Emery Berger. CS rankings. csrankings.org, 2018.
- Brandt et al. [2016] Felix Brandt, Vincent Conitzer, Ulle Endriss, Jérôme Lang, and Ariel D. Procaccia. Handbook of Computational Social Choice. Cambridge University Press, New York, NY, USA, 1st edition, 2016.
- Brunn-Bevel and Byrd [2015] Rachelle J. Brunn-Bevel and W. Carson Byrd. The foundation of racial disparities in the standardized testing era: The impact of school segregation and the assault on public education in virginia. Humanity & Society, 39(4):419–448, 2015.
- Caragiannis et al. [2016] Ioannis Caragiannis, David Kurokawa, Hervé Moulin, Ariel D. Procaccia, Nisarg Shah, and Junxing Wang. The unreasonable fairness of maximum nash welfare. In Proceedings of the 2016 ACM Conference on Economics and Computation, EC, pages 305–322, 2016.
- Celis et al. [2018] L. Elisa Celis, Damian Straszak, and Nisheeth K. Vishnoi. Ranking with fairness constraints. In 45th International Colloquium on Automata, Languages, and Programming, ICALP, pages 28:1–28:15, 2018.
- Clarke et al. [2008] Charles L. A. Clarke, Maheedhar Kolla, Gordon V. Cormack, Olga Vechtomova, Azin Ashkan, Stefan Büttcher, and Ian MacKinnon. Novelty and diversity in information retrieval evaluation. In Proceedings of the 31st Annual International ACM SIGIR Conference on Research and Development in Information Retrieval, SIGIR, pages 659–666, 2008.
- Cohen et al. [2009] Joel W Cohen, Steven B Cohen, and Jessica S Banthin. The medical expenditure panel survey: a national information resource to support healthcare cost research and inform policy and practice. Medical care, pages S44–S50, 2009.
- Cole and Gkatzelis [2018] Richard Cole and Vasilis Gkatzelis. Approximating the Nash social welfare with indivisible items. SIAM J. Comput., 47(3):1211–1236, 2018.
- Coston et al. [2019] Amanda Coston, Karthikeyan Natesan Ramamurthy, Dennis Wei, Kush R Varshney, Skyler Speakman, Zairah Mustahsan, and Supriyo Chakraborty. Fair transfer learning with missing protected attributes. In Proceedings of the 2019 AAAI/ACM Conference on AI, Ethics, and Society, AIES. ACM, 2019.
- Drosou et al. [2017] Marina Drosou, HV Jagadish, Evaggelia Pitoura, and Julia Stoyanovich. Diversity in Big Data: A review. Big Data, 5(2):73–84, 2017.
- (EEOC) [2019] U.S. Equal Employment Opportunity Commission (EEOC). Title VII of the Civil Rights Act of 1964. https://www.eeoc.gov/policy/vii.html, 2019. [Online; accessed 24-Feb-2019].
- Kaminskas and Bridge [2017] Marius Kaminskas and Derek Bridge. Diversity, serendipity, novelty, and coverage: A survey and empirical analysis of beyond-accuracy objectives in recommender systems. ACM Transactions on Interactive Intelligent Systems (TiiS), 7(1):2:1–2:42, 2017.
- Kleinberg et al. [2017] Jon M. Kleinberg, Sendhil Mullainathan, and Manish Raghavan. Inherent trade-offs in the fair determination of risk scores. In 8th Innovations in Theoretical Computer Science Conference, ITCS, pages 43:1–43:23, 2017.
- Moulin [2004] Hervé Moulin. Fair division and collective welfare. MIT press, 2004.
- Page [2008] Scott E Page. The Difference: How the Power of Diversity Creates Better Groups, Firms, Schools, and Societies-New Edition. Princeton University Press, 2008.
- Stoyanovich et al. [2018] Julia Stoyanovich, Ke Yang, and H. V. Jagadish. Online set selection with fairness and diversity constraints. In Proceedings of the 21th International Conference on Extending Database Technology, EDBT, pages 241–252, 2018.
- Surowiecki [2005] James Surowiecki. The wisdom of crowds. Anchor, 2005.
- Vargas and Castells [2011] Saul Vargas and Pablo Castells. Rank and relevance in novelty and diversity metrics for recommender systems. In Proceedings of the 2011 ACM Conference on Recommender Systems, RecSys, pages 109–116, 2011.
- Yang and Stoyanovich [2017] Ke Yang and Julia Stoyanovich. Measuring fairness in ranked outputs. In Proceedings of the 29th International Conference on Scientific and Statistical Database Management, SSDBM, pages 22:1–22:6, 2017.
- Zehlike et al. [2017] Meike Zehlike, Francesco Bonchi, Carlos Castillo, Sara Hajian, Mohamed Megahed, and Ricardo A. Baeza-Yates. FA*IR: A fair top-k ranking algorithm. In Proceedings of the 2017 ACM on Conference on Information and Knowledge Management, CIKM, pages 1569–1578, 2017.
- Zliobaite [2017] Indre Zliobaite. Measuring discrimination in algorithmic decision making. Data Mining and Knowledge Discovery, 31(4):1060–1089, 2017.