Johan Richard1, Roland Bacon1, Jérémy Blaizot1, Samuel Boissier2, Alessandro Boselli2, Nicolas Bouché1, Jarle Brinchmann3,4, Norberto Castro5, Laure Ciesla2, Paul Crowther6, Emanuele Daddi7, Stefan Dreizler8, Pierre-Alain Duc9, David Elbaz7, Benoit Épinat2, Chris Evans10, Matteo Fossati11, Michele Fumagalli11, Miriam Garcia12, Thibault Garel1,13, Matthew Hayes14, Angela Adamo14, Artemio Herrero15,16, Emmanuel Hugot2, Andrew Humphrey3, Pascale Jablonka17, Sebastian Kamann18, Lex Kaper19, Andreas Kelz5, Jean-Paul Kneib17, Alex de Koter19,20, Davor Krajnović5, Rolf-Peter Kudritzki21, Norbert Langer22, Carmela Lardo17, Floriane Leclercq13, Danny Lennon15, Guillaume Mahler23, Fabrice Martins24, Richard Massey11, Peter Mitchell4, Ana Monreal-Ibero15,16, Paco Najarro12, Cyrielle Opitom25, Polychronis Papaderos3,26, Céline Péroux28,2, Yves Revaz17, Martin M. Roth5, Philippe Rousselot29, Andreas Sander30, Charlotte Simmonds Wagemann13, Ian Smail11, Anthony Mark Swinbank11, Frank Tramper31, Tanya Urrutia5, Anne Verhamme13, Jorick Vink30, Jeremy Walsh28, Peter Weilbacher5, Martin Wendt32, Lutz Wisotzki5, Bin Yang25.
Abstract
We present the concept of BlueMUSE, a blue-optimised, medium spectral resolution, panoramic integral field spectrograph based on the MUSE concept and proposed for the Very Large Telescope. With an optimised transmission down to 350 nm, a larger FoV (1.4 1.4 arcmin2) and a higher spectral resolution compared to MUSE, BlueMUSE will open up a new range of galactic and extragalactic science cases allowed by its specific capabilities, beyond those possible with MUSE. For example a survey of massive stars in our galaxy and the Local Group will increase the known population of massive stars by a factor , to answer key questions about their evolution. Deep field observations with BlueMUSE will also significantly increase samples of Lyman- emitters, spanning the era of Cosmic Noon. This will revolutionise the study of the distant Universe: allowing the intergalactic medium to be detected unambiguously in emission, enabling the study of the exchange of baryons between galaxies and their surroundings.
By 2030, at a time when the focus of most of the new large facilities (ELT, JWST) will be on the infra-red, BlueMUSE will be a unique facility, outperforming any ELT instrument in the Blue/UV. It will have a strong synergy with ELT, JWST as well as ALMA, SKA, Euclid and Athena.
1Univ Lyon, Univ Lyon1, Ens de Lyon, CNRS, Centre de Recherche Astrophysique de Lyon UMR5574, F-69230, Saint-Genis-Laval, France,
2Aix Marseille Univ, CNRS, CNES, LAM, Marseille, France,
3Instituto de Astrofísica e Ciências do Espaço, Universidade do Porto, CAUP, Rua das Estrelas, PT4150-762 Porto, Portugal,
4Leiden Observatory, Leiden University, P.O. Box 9513, 2300
RA, Leiden, The Netherlands,
5Leibniz-Institut für Astrophysik Potsdam (AIP), An der Sternwarte 16, D-14482 Potsdam, Germany,
6Department of Physics and Astronomy, University of Sheffield, Sheffield, S3 7RH, United Kingdom,
7CEA, IRFU, DAp, AIM, Université Paris-Saclay, Université de Paris, CNRS, F-91191 Gif-sur-Yvette, France,
8Institut für Astrophysik, Georg-August-Universität Göttingen, Friedrich-Hund-Platz 1, 37077 Göttingen, Germany,
9Université de Strasbourg, CNRS, Observatoire astronomique de Strasbourg, UMR 7550, F-67000 Strasbourg, France,
10UK Astronomy Technology Centre, Royal Observatory Edinburgh, Blackford Hill, Edinburgh, EH9 3HJ, United Kingdom,
11Centre for Extragalactic Astronomy, Department of Physics, Durham University, South Road, Durham DH1 3LE, United Kingdom,
12Centro de Astrobiología, CSIC-INTA. Crtra. de Torrejón a Ajalvir km 4. 28850 Torrejón de Ardoz (Madrid), Spain,
13Observatoire de Genève, Université de Genève, 51 Ch. des Maillettes, 1290, Versoix, Switzerland,
14Stockholm University, Department of Astronomy and Oskar Klein Centre for Cosmoparticle Physics, AlbaNova University Centre, SE-10691, Stockholm, Sweden.,
15Instituto de Astrofisica de Canarias, C/ Via Lactea s/n, E-38205 La Laguna, Spain,
16Universidad de La Laguna, Avda. Astrofisico Francisco Sanchez, 2, E-38206 La Laguna, Spain,
17Laboratoire d’Astrophysique, Ecole Polytechnique Fédérale de Lausanne (EPFL), Observatoire de Sauverny, CH-1290 Versoix, Switzerland,
18Astrophysics Research Institute, Liverpool John Moores University, 146 Brownlow Hill, Liverpool L3 5RF, United Kingdom,
19Anton Pannekoek Institute for Astronomy, University of Amsterdam, Science Park 904, 1098 XH Amsterdam, The Netherlands,
20Leuven, Institute of Astrophysics, Universiteit Leuven, Celestijnenlaan 200 D, 3001 Leuven, Belgium,
21University Observatory Munich
Scheinerstrasse 1, 81679 Munich, Germany,
22Bonn, Argelander-Institut für Astronomie, Universität Bonn, Auf dem Hügel 71, D-53121 Bonn, Germany,
23Department of Astronomy, University of Michigan, 1085 S. University Ave., Ann Arbor, MI 48109, USA,
24LUPM, Université de Montpellier, CNRS, Place Eugène Bataillon, F-34095 Montpellier, France,
25European Southern Observatory, Alonso de Cordova 3107, Vitacura, Santiago Chile,
26Instituto de Astrofísica e Ciências do Espaço, Universidade de Lisboa, OAL, Tapada da Ajuda, PT1349-018 Lisbon, Portugal,
27Departamento de Física, Faculdade de Ciências, Universidade de Lisboa, Edifício C8, Campo Grande, PT1749-016 Lisbon, Portugal,
28European Southern Observatory, Karl-Schwarzschild-Str. 2, 85748 Garching near Munich, Germany,
29Institut UTINAM UMR 6213, CNRS, Univ. Bourgogne Franche-Comté, OSU THETA, BP 1615, 25010 Besano̧n Cedex,
France,
30Armagh Observatory, College Hill, BT61 9DG, Armagh, Northern Ireland,
31Institute for Astronomy, Astrophysics, Space Applications & Remote Sensing, National Observatory of Athens, Vas. Pavlou and I.Metaxa, Penteli 15236, Greece,
32Institut für Physik und Astronomie, Universität Potsdam, Karl-Liebknecht-Str. 24/25, 14476 Golm, Germany
1 Overview
BlueMUSE is a proposed optical seeing-limited, blue-optimised, medium spectral resolution, panoramic integral field spectrograph for the ESO Very Large Telescope (VLT). The project is an evolution of the technology used on the very successful MUSE instrument, with a similar architecture and many similar systems (and so is low risk), but with a new and distinct science case enabled by its unique blue spectral coverage.
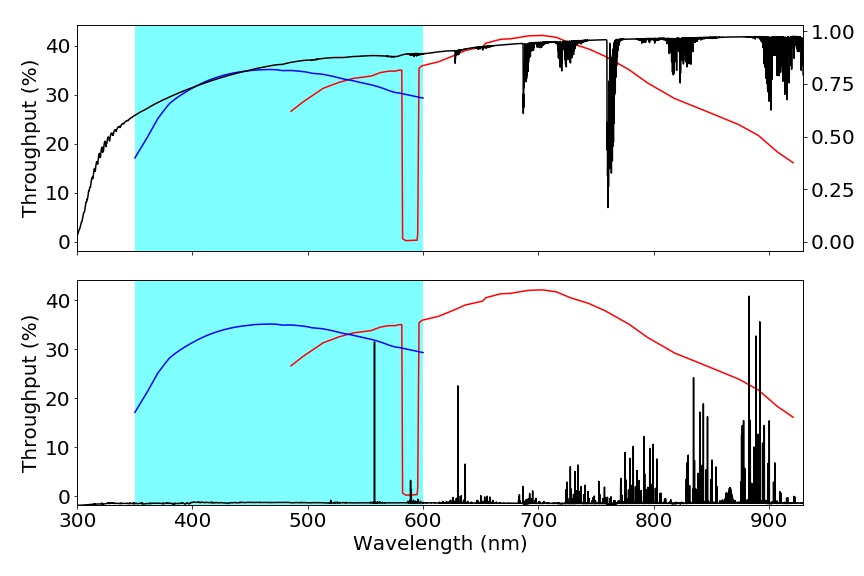
BlueMUSE will cover in one setting the 350-600 nm spectral range at R4000, expanding the MUSE spectral range (480-930 nm) towards the blue and near-UV at twice the spectral resolution. With a field of view of 2 arcmin2, BlueMUSE will also double the sky area presently offered by MUSE. As with MUSE, BlueMUSE will achieve exquisite end-to-end throughput including telescope and atmosphere (e.g., 35% at 450 nm, 17% at 350 nm), 100% sky coverage, high stability and high efficiency.
BlueMUSE will offer new and unique science opportunities in many fields of astrophysics, beyond those possible with MUSE. For example, a survey of massive stars in the Milky Way and the Local Group will increase by the known population of massive stars and provide a complete census for stars in young, star forming clusters, to answer key questions about their evolution, test the hypothesis of massive Population III stars, search for spectroscopic binaries as progenitors for gravitational waves-emitting black-hole binaries, and map the chemical abundance in galaxies in relation to their environment. Other examples of Galactic and planetary science include the study of ionised nebulae and their light element abundances, the investigation of multi-populations in globular clusters, the study of the morphology of comets, including the origin of chemical elements and the properties of their nuclei.
In the field of nearby galaxies, BlueMUSE will probe the physical conditions in extreme starburst galaxies, quantifying the interplay between the populations of massive stars (supernovae, stellar winds and ionizing radiation) and their surroundings. It will also measure the opacity to Lyman continuum and Lyman- radiation. Other key science goals concern the study of low surface brightness galaxies, the role of environment in local clusters on galaxy evolution.
The study of the distant Universe will also be revolutionised with BlueMUSE: allowing the intergalactic medium to be detected unambiguously in emission, enabling the study of the exchange of baryons between galaxies and their surroundings. The evolution of the circum-galactic medium properties at the critical peak in cosmic star formation will be probed. Deep field observations with BlueMUSE will significantly increase samples of Lyman- emitters (and spanning the era of Cosmic Noon), allowing statistical samples of Lyman continuum emitters to be constructed, to yield critical constraints on the Lyman continuum leakage processes. These studies will be further boosted by exploiting gravitational lens clusters, probing the faint end of the luminosity function and measuring the Lyman- haloes at the sub-kpc scale. At the same time, the high surface densities of sources achieved by BlueMUSE will also enable these observations to optimally constrain the dark matter distribution in the lensing clusters. BlueMUSE will also study the emergence of the first galaxy clusters by giving crucial insights into both cold accretion onto the most massive early structures, and galaxy evolution models.
The science cases highlighted here are unique to BlueMUSE and make the best use of its exceptional performance in the blue. They, however, only scratch the surface of the diversity of science programs which can benefit from it. Like MUSE, BlueMUSE will have a broad impact, touching many different fields of astrophysics by opening a new area in parameter space. In addition BlueMUSE has a great potential for serendipitous discoveries and will greatly enhance the legacy of European observational astronomy.
BlueMUSE builds upon the heritage of MUSE, but includes both obvious and novel improvements (e.g., better temperature control and alignment processes). To achieve the larger field of view (2 arcmin2), BlueMUSE will sample the seeing disk at 0.3′′ which matches the Paranal natural seeing at 350-600 nm. The spectrograph optical design exploits recent successful developments in curved detectors to provide an excellent image quality and throughput while keeping the same number (24) and format (4K 4K, 15m pixel) CCDs and overall volume and weight as MUSE. Such a development will have a major significance for future wide-field instrumentation, especially for ELT.
The curved detector is the only significant risk in the project. The fall-back solution would be to step back to the original 0.2′′ sampling and 1 arcmin2 field of view - like available in MUSE. The resulting science impact will be limited as all the other specific BlueMUSE characteristics (e.g., spectral coverage and resolution, throughput) are untouched.
BlueMUSE will be unique. The nearest instrument in terms of performance is the Keck IFU KCWI instrument, but BlueMUSE with 40 larger field of view, better throughput and stability and an overall increased efficiency, will be two orders of magnitude more efficient.
In seven years from now, at a time when the focus of most of the new large facilities (ELT, JWST) will be on the infra-red, BlueMUSE will be a unique facility. It will clearly outperform any ELT instrument in the blue/UV. Its synergy with ELT and JWST is strong, but also with ALMA, SKA, Euclid and Athena.
2 Performance
BlueMUSE is largely based on the design and system architecture of MUSE [4], with the same modular structure and two stages of FoV slicing / splitting. It has a single mode of operation and a fixed spectral and spatial format, which simplifies the overall fore-optics. The instrument envelope will fit within the allocated space on the Nasmyth platform as is the case for MUSE (Fig. 1).
We summarise in Table 1 the main characteristics of BlueMUSE and detail below some of the main assumptions.
| Wavelength range | 350 - 600 nm | ||||
|---|---|---|---|---|---|
| Spectral resolution |
|
||||
| Spectral sampling | 0.58 Å per spectral bin | ||||
| Field-of-view | 1.4 arcmin 1.4 arcmin | ||||
| Spatial sampling | 0.3′′0.3′′ per spaxel | ||||
|
|
||||
| Image quality |
|
Throughput: As the type and number of optical systems in BlueMUSE is very similar to MUSE, we have used the end-to-end MUSE transmission curve as a starting point. On the basis of QE curves for commercially available CCDs, we expect excellent detector performance in the blue, and the overall shape of the VPH grating to be similar to MUSE around its peak wavelength. The main difference at the blue end of the wavelength range is due to the atmospheric transmission, which drops significantly, down to 65% at 350 nm, as well as the detector quantum efficiency which slightly decreases below 400 nm. We use the Paranal extinction curve to account for the additional atmospheric absorption at these wavelengths. In addition, we expect the glass transmission to be slightly lower at 400 nm. As a guideline we use the transmission curve measured for the Potsdam MRS spectrograph [146] which is based on the MUSE spectrograph design but covers similar wavelengths as BlueMUSE. The overall end-to-end BlueMUSE sensitivity we expect under these assumptions is presented in Fig. 2, in comparison to the MUSE sensitivity and the atmosphere transmission and emissions at these wavelengths.
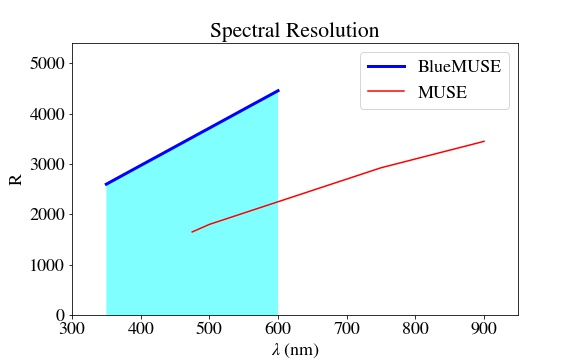
Spectral Resolution : As for MUSE, the BlueMUSE image quality in the wavelength direction will be dominated by the slice width on sky and the image quality of the spectrograph system. The predicted evolution of the spectral resolution as a function of wavelength is presented Fig. 3. The average resolution is R=3600 and the BlueMUSE spectral resolution is always two times larger than the MUSE spectral resolution in their overlapping wavelength range.
3 The Milky Way and the Local Group
3.1 Key science case: massive stars
Astrophysical context and relevance:
Hot, massive stars are the most energetic ones and therefore dominate the spectral energy distribution of galaxies at all redshifts. They are also contributing significantly to feedback processes [31]: they possess strong stellar winds, and they are progenitors to core-collapse supernovae. They are the ionizing sources for H ii regions and thus relevant for estimating star formation rates, the diffuse ionized gas (DIG), and Lyman- radiation. They probe the abundances of contemporary stellar populations as an alternative to strong line nebular abundance determinations [25]. Hot stars are the constituents of super star clusters, and they are relevant for the understanding of Population III stars, thus the study of the re-ionization of the early Universe. More recently, the detection of gravitational waves from stellar mass black hole (BH) mergers has stimulated interest in understanding the origin of BH binaries, and therefore massive star binaries as their progenitors (e.g., [127]).
The theory of massive stars poses challenges concerning stellar evolution, the role of rotation, metallicity, stellar winds, overshooting, and binarity [140, 114, 30, 194, 82]. However, hot massive stars are rare. There are selection effects within the Galaxy such as extinction and uncertain distances [35]. Massive stars need to be analyzed in different environments to study the effects of metallicity in comparison with numerical models [25, 62]. Photometry is unable to constrain stellar parameters, which is why in the past a tedious two-step procedure of finding hot stars with photometry and follow-up spectroscopy was required [135]. This procedure is expensive and incomplete. Also, spectroscopy of massive stars in star-forming regions is notoriously difficult because of nebular contamination and crowding. BlueMUSE will allow to overcome these limitations and offer an unprecedented multiplex advantage as demonstrated already (e.g., [102, 29, 166]), however with wavelength coverage for important diagnostic lines in the blue.
Why is BlueMUSE needed?
The canonical stellar transitions used for stellar atmosphere analysis, chemical composition and spectral classification occur between 3500-5000 Å [195, 131]. The BlueMUSE wavelength range gives access to the following spectral features constraining stellar parameters, chemical composition and evolutionary stage of the stars (see also Fig. 5):
-
•
Balmer lines as the principal surface gravity criteria in massive stars.
-
•
Balmer jump at 3646 Å as effective temperature (Teff) criterion.
-
•
Wind and classification diagnostics from He ii 4686 and nearby CNO lines.
-
•
Si iv Å, Si iii triplet Å, Si ii Å, as well as He i (e.g., 4471 or 4387 Å) and He ii (4200 and 4541 Å) lines for Teff and/or helium abundance.
-
•
Crucial wavelength range for WR emission (“blue” and “red” bumps), and O vi Å [34].
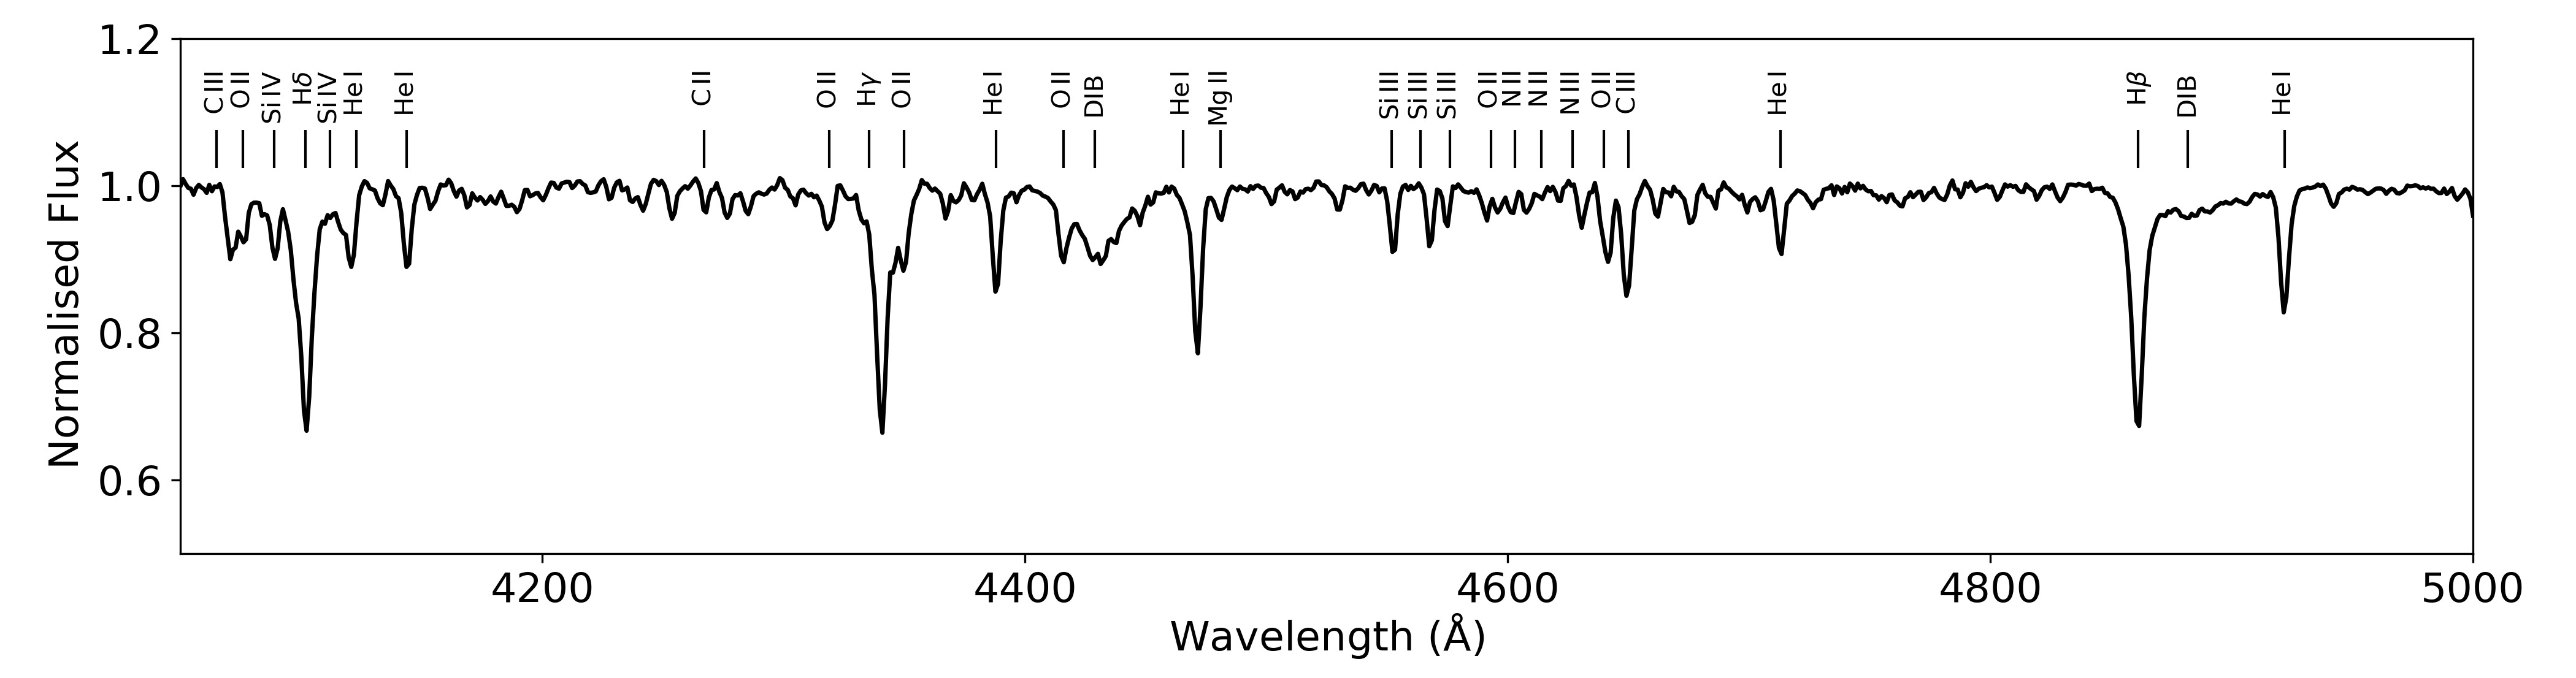
In the hottest stars, range K, where He i lines are weak or absent, optical lines of N iii, N iv and N v are used as temperature criteria in this blue optical range [165]. The 4000-5000 Å wavelength range encloses many transitions to measure Teff and log(): C ii, C iii, N ii, N iii, N iv, N v, O ii, O iii, Si ii, Si iii, Si iv and Mg ii. These transitions also provide the chemical composition of the stars and surrounding interstellar medium (ISM) [132]. At lower temperatures (T10000 K), Fe ii lines are available and can be added to the chemical composition and stellar parameter analysis. The expected spectral resolution of BlueMUSE will be suitable to estimate Teff, log(g) as well as abundances, as demonstrated by earlier studies using FORS and LRIS-B (e.g., [110, 109])
Breakthrough Science:
BlueMUSE will enable unique science for two major reasons: (1) Multiplex+Sensitivity: The current state-of-the-art has been set by the VLT-FLAMES Massive Star Survey [46, 48] that yielded a total of 803 spectra from an effort of more than 100 hrs VLT time. BlueMUSE will be up to two orders of magnitude faster, depending on the size of a cluster (albeit lower, however still acceptable, spectral resolution), which has already been demonstrated with MUSE in globular clusters, providing up to 1000 stellar spectra per pointing [87]. (2) Crowding: Analogous to PSF-fitting CCD photometry [175], the IFU concept is vital to deblend heavily crowded fields and yield cross-talk free spectra of stars with overlapping images [101, see]. Again, the state-of-the-art can be appreciated from existing results obtained with the VLT-FLAMES Tarantula Survey [47, 49] that has provided multi-epoch fibre spectra of different spectral resolution for more than 800 stars, however severely hampered by nebular contamination, and completely unable to address crowded regions. In contrast, from four MUSE pointings on the R136 region with a total exposure time of 2680 sec., [29] were able to extract 2255 spectra, out of which 588 show a S/N50. In the foreseeable future, no other instrument will have such capability.
Examples and exposure time estimates:
Galactic clusters (e.g., NGC 3578, NGC 3603, or Westerlund 2) will require mosaic observations with 12… 44 pointings, each of which will yield typically 500 spatially deblended spectra of individual stars (Fig. 4). With an exposure time of 0.5 hr per pointing, the total exposure time will range between 1 hr and 8 hrs. Clusters in the LMC, e.g. R136, will require an exposure time of 1 hr per pointing, resulting in a total of 4 hrs per 22 mosaic. To cover an intermediate distance Local Group dwarf galaxy (e.g., Sextans-A or NGC 3109) with much deeper exposures (4 hrs), the total effort will be as high as 50-100 hrs. The expected number of high quality spectra for objects more distant than the Galactic clusters is also expected of order 500 per pointing [166].
Synergy with other facilities:
“Classical” MUSE: full coverage 350-930 nm, resolved stellar population studies
ALMA: comparison between locations and properties of molecular gas and massive stars
Target selection for ELT-MOS: follow-up spectroscopy at higher spectral resolution
Target selection for JWST: imaging and spectroscopy of crowded and obscured regions
ERIS, MICADO, HARMONI: follow-up on red supergiants / nuclei of clusters.
3.2 Globular clusters
MUSE allowed, for the first time, a detailed spectroscopic investigation for tens of thousands of individual stars in Galactic globular cluster and even in massive star clusters in the Magellanic Clouds. For most clusters, this corresponded to an increase of the spectroscopic samples by two orders of magnitude. Thanks to the integral-field nature of MUSE, it also became possible to advance to the heavily crowded cluster centres. This enabled detailed studies of the kinematics of the clusters [102, 103, e.g.], binary searches [64], and the measurement of stellar parameters [87].
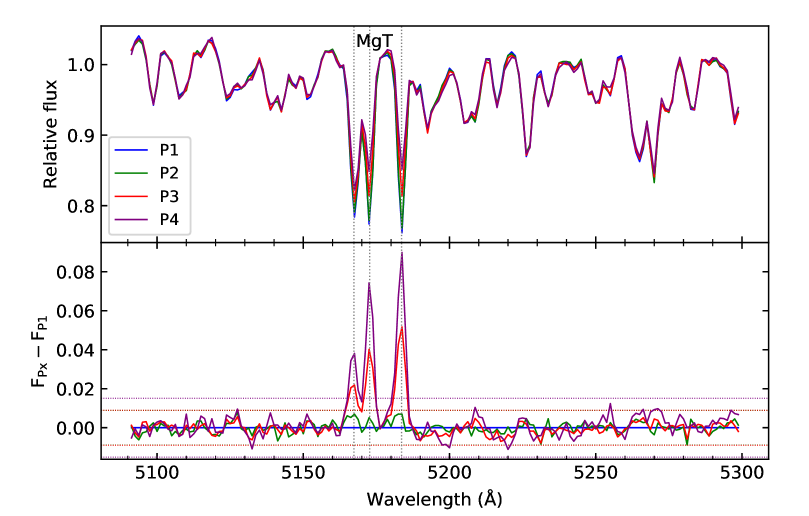
It is now well established that globular clusters have at least two distinct populations with differences in light elements like sodium or oxygen, and possibly helium [5, see]. Some clusters show even more complex population patterns, including metallicity differences. The origin of these differences is still unknown and further studies will be required to understand how the clusters formed. So far high-resolution spectroscopy has been used to infer the abundance differences, hence the studies were restricted to rather small stellar samples in the outskirts of the clusters. With MUSE, abundance differences between the populations can be measured by co-adding the spectra of stars for which the population has been determined previously from precise photometry. The extremely high signal-to-noise ratios of the combined spectra compensate for the relatively low spectral resolution (Latour et al., in preparation, see Fig. 6).
BlueMUSE will be a significant improvement and therefore the next major step towards a more complete understanding of the formation and evolution of massive star clusters. Low-mass stellar spectra have significantly more spectral lines in the visual-near-UV spectral range covered by BlueMUSE compared to the red-near-IR range covered by MUSE, including strategic lines for spectral analysis like the higher Balmer lines, Ca ii H & K, CN molecular lines, and many more. A spectral coverage down to 350 nm will enable the separation of populations with low resolution spectroscopy [84, e.g.]. Hence BlueMUSE will allow to extend investigations of multiple populations from red giants to turn-off and main sequence stars, thereby strongly increasing the number of accessible stars. The higher spectral resolution will not only improve the spectral analysis, but also the radial velocity (RV) precision, in particular considering the higher information content of the blue spectral range. The higher RV precision in combination with the improved sensitivity for spectral differences would allow for a chemo-dynamical separation and investigation of multiple populations in globular clusters. Furthermore, detailed studies of stellar rotation would become feasible. Stellar rotation has recently been confirmed to play a crucial role in shaping the colour magnitude diagrams of young and intermediate age clusters [103, e.g.].
Furthermore, BlueMUSE will allow detailed studies of the blue stars in GCs – such as horizontal branch and potentially blue hook stars, extremely low mass white dwarfs, or interacting binaries. As these objects probe the binary evolution in dense stellar populations their study is important for understanding the overall dynamical evolution of the cluster.
The integral field of MUSE allows to detect numerous diffuse interstellar bands (DIBs) and neutral species such as Na i 5890,5896 Å (NaD) and K i in the tens of thousands of stellar spectra per cluster. For the first time these ISM features were mapped in absorption toward a GC and revealed associated structures on unprecedented small scales of a few arcseconds [198]. With BlueMUSE we would be capable of directly mapping the more prominent Ca ii H & K lines in the Milky Way, as well as other atomic and molecular species, in particular the broad and strong DIB at 4430 Å [33].
3.3 Ultra-Faint Dwarf Galaxies
There are several lines of arguments that point to the existence of dark matter on a range of scales from the Cosmic Microwave Background to tiny dwarf galaxies, but the nature of this dark matter is still not established as searches in Earth-based detectors have not yet found clear evidence of dark matter particles.
Thus we need to use astronomical systems to constrain the nature of dark matter, and the most natural place to do this is to study the most dark-matter dominated systems we know: the Ultra-Faint Dwarf galaxies (UFDs). In these very faint, M, systems, baryons might only make up 1/500th of the total mass – the rest is dark matter of some sort or the other (e.g., [137]).
Not only are these UFDs a great laboratory for studying dark matter, they are also stellar systems in which the impact of supernovae and massive stars feedback are expected to be largest, thus making them crucial laboratories for the study of baryonic physics in galaxy formation. Since UFDs have such weak gravitational potentials they only experience short periods of star formation. This means that their stellar chemical abundances contain the imprint of very few, in some cases possibly only one, supernova(e). Their small mass also make them susceptible to gravitational tidal forces and may cause their dynamics to be more complex than typically assumed [121, 147].
UFD candidates are now identified with great efficiency in wide-field imaging surveys such as SDSS, DES or Pan-STARRS [6, 43]. The Large Synoptic Survey Telescope (LSST) is expected to greatly increase the number of photometrically identified UFD candidates. However to confirm their nature and to study their dark matter content and the abundance patterns of their constituent stars, spectroscopic follow-up is mandatory. Traditionally this has been done with multi-object spectrographs (MOS, [119]), but such follow-up requires a) pre-selection of member stars, and b) significant distances between the targeted stars to avoid slit/fibre collisions.
Because of their distances but also because their red giant branch (RGB) is hardly populated, substantial stellar samples in UFDs are only accessible by reaching faint magnitudes ( and typically or even fainter) at which point pre-selection is very inefficient due to confusion with compact galaxies. Furthermore, the most important regions to study for dark matter constraints are the very central regions where differences between dark matter models are the largest but where fibre collisions are most severe. Likewise, to study the dynamical properties of these dwarfs it is essential to densely sample stars over several effective radii down to fairly faint magnitudes for which fibre or slit spectrographs are inefficient.
A wide-field integral field spectrograph offers the perfect alternative to a MOS since one can get away from pre-selection and the density of spectra is orders of magnitudes higher than for a MOS. Moreover, the PSF-fitting crowed field technique described above (§3.1, 3.2) allows to deblend overlapping stellar images which would not be possible with any other spectroscopic technique.
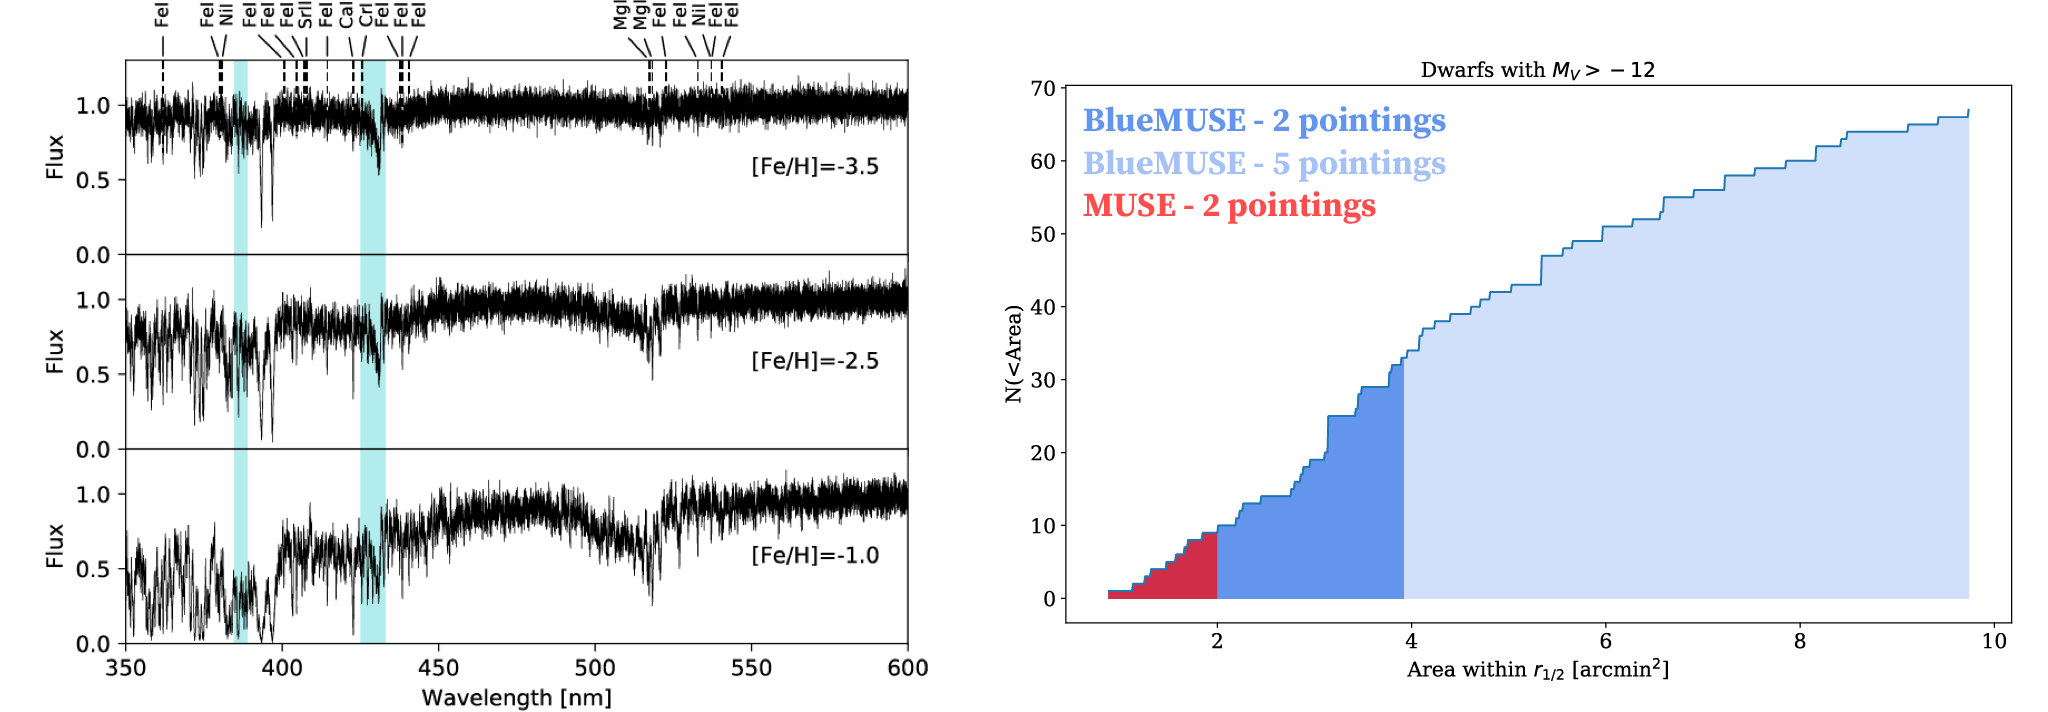
Requirements: The typical velocity dispersion of Ultra-Faint Dwarfs is of the order of a few km s-1. To resolve this dispersion with the small samples of stars expected in UFDs, we need a spectral resolution ideally with a well sampled LSF. Since many spectral features also lie at wavelengths Å, a good sampling of this range is also essential.
This is especially true for stellar abundance determinations. At low metallicities, [Fe/H], the red part of the stellar spectrum has relatively little information, while the blue part is still rich in spectral features including some molecular bands such as CN and CH (see Fig.7).
In order to unveil the operation mode(s) of star formation in UFDs and the extent of their chemical evolution, it is mandatory to accurately determine the atmospheric parameters (effective temperature, gravity, [Fe/H]) of a large sample of stars, as well as their chemical patterns (e.g., abundances in , iron-peak, neutron capture elements etc…), their mean values and their dispersion. In that respect, BlueMUSE will open-up an entire new region of parameter space, allowing much better constraints, although analysis methods must also be improved as the spectral resolution is lower than is usually used for these studies. In addition BlueMUSE will provide large samples of secure member stars which allows for efficient follow-up with higher resolution spectrographs, for example to measure the abundances of neutron capture elements, which are both constraining the galaxy chemical evolution path and the nucleosynthesis origin of the r-process (e.g., [98]).
While MUSE itself can be used to determine velocities, the velocity uncertainties with BlueMUSE will be at least a factor of two smaller. This is essential when the velocity dispersions of the systems are just a few km s-1. In the most metal poor systems the rich set of absorption lines in the blue wavelength range will improve this further. Furthermore, most dwarf galaxies are larger than 1’ on the side and BlueMUSE is twice as efficient in mapping as MUSE. This leads to a significant gain in the number of UFDs that can be efficiently mapped by an IFU. In order to reach the main sequence in most nearby UFDs, we need to go to r=24.5 which would require an integration time of 5 hrs per field. If we consider 10 hrs per galaxy, ie. two FOVs, to be a reasonable commitment, we find that BlueMUSE will be able to map 3 times as many dwarfs as MUSE (Fig. 7) given the distribution of dwarf galaxy sizes. Since the study of dwarf galaxies is limited by the number of these galaxies known, a jump from to 30 galaxies is very significant. The capability of BlueMUSE to efficiently survey the external regions of the UFDs will serve the investigation of possible tidal features. When necessary it will allow to revisit the modeling of the galaxy dynamical mass, hence of their dark matter content.
Synergy with other facilities:
“Classical” MUSE: allows the coverage of the Ca ii-triplet as a complementary velocity and metallicity tracer.
Target selection for ELT-MOS: follow-up spectroscopy at higher spectral resolution
ERIS, MICADO, HARMONI: follow-up on red supergiants and nuclear clusters
3.4 Ionized Nebulae and the collisionally excited lines / optical recombination lines abundance discrepancy problem
The study of ionized nebulae forms one of the pillars in understanding circumstellar, interstellar and intergalactic media. The line and continuum from energy loss of ionized and neutral gas is a fundamental aspect of the formation and evolution of stars and galaxies. Spectroscopy in the UV-optical- near-infrared region is uniquely suited to the exploration of physical conditions, light element abundances, dust properties and the gas dynamics. An extension of the MUSE concept to bluer wavelengths, and an increase in spectral resolution, both have strong advantages for the study of nearby gaseous nebulae of all types, e.g., protostellar outflows, H ii regions, planetary nebulae (PNe), Wolf-Rayet nebulae, nova shells, supernova remnants (SNR). This gain relies on the presence of many diagnostic nebular lines in the blue wavelength range, which are astrophysically important and have been well studied spectroscopically.
A long standing controversy concerns the light element abundances of nebulae (PNe and H ii regions in particular, but not restricted to these) determined from the traditional, and strong, collisionally excited lines (CELs) compared to the fainter recombination lines of the same elements (mostly C, N and O). Many studies (e.g., [120, 180]) have shown differences between abundances from CEL and optical recombination line (ORL) determinations, called the abundance discrepancy factor (ADF), from values of a few for H ii regions up to for some PNe [156]. Many suggestions have been made to explain this discrepancy but no one explanation seems to be convincing, from temperature and density fluctuations, to mixed media consisting of inclusions of cooler high abundance, or equivalently H-poor, gas. The key to the discrepancy seems to be that ORLs emit more strongly in cooler (and possibly denser) media on account of the flatter emissivity variation with temperature compared to CELs that are also affected by collisional de-excitation at high densities. Despite intensive searches, no spatial variation of CEL v. ORL emission sites has been found other than a sub-class of PNe, the born again PN, which have experienced a late He shell flash ejecting He rich material into the pre-existing shell. The implications of the ADF problem cannot be over-emphasized: if CEL abundances are wrong by large factors then the use of these lines for studies of the ISM in general, and of distant galaxies in particular, becomes problematic; if, on the other hand, ORL abundances are not representative, then the physics of circumstellar media, and by association the ISM, is poorly understood, or the atomic physics required for recombination line abundance determination needs revising.
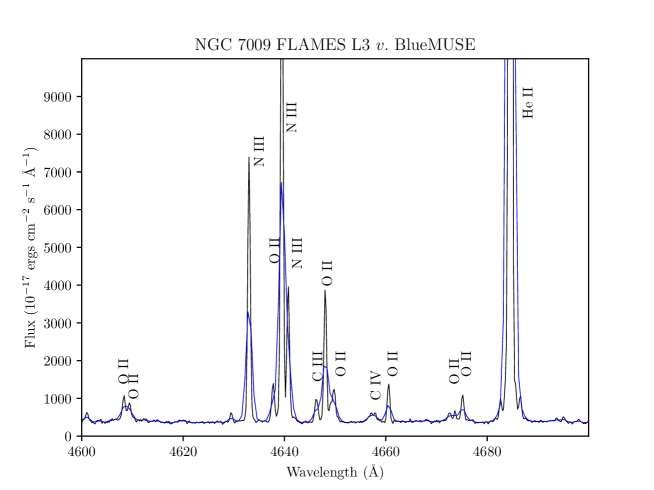
The current MUSE range, while including some N ii and C ii ORLs (c.f., [196]), does not include the strongest ORLs of O ii and O iii (4300–4700 Å) which are crucial for exploring the ADF problem, since ORL and CEL O+ and O++ abundances (the latter from the very strong [O ii] Å, and [O iii] Å, lines) can be spatially compared. Other important ORLs, of C ii and C iii, together with Ne ii ORL’s (c.f. the spectral compilations of [172] and [50]) also require a bluer spectral range (see Fig. 8). The other diagnostics, which BlueMUSE would open, are:
-
•
the well-observed and strong [O iii] Å line for electron temperature (Te) determination of higher ionization gas;
-
•
the [O ii] 3726,3729 Å doublet for electron density (Ne) of lower ionization gas and as important tracer of O+, together with O++ providing the important oxygen abundance;
-
•
the [Ar iv] Å ratio for Ne in higher ionization gas will be better determined than with the MUSE extended mode, since the [Ar iv] Å will be resolved from He i Å;
-
•
the [Ne iii] Å line, entirely missing from MUSE, will be available for Ne++ abundance determination;
-
•
the Balmer jump at 3646 Å a powerful estimator for ORL Te;
-
•
the higher order lines of the hydrogen Balmer series can be used as ORL Ne estimator.
Higher spectral resolution is a strong advantage since the emission line spectrum is crowded, with many H and He recombination lines in addition to the CELs, thus line blending can be a problem particularly for the extraction of faint ORLs (see Fig. 8). The use of an IFU is essential to sample the entire face of ionized nebulae that can be subject to different mechanisms of excitation (photoionization, shocks) and hydrodynamical effects, as well as spatially varying distributions of chemically enriched material.
3.5 Comets and asteroids
Comets:
Comets are pristine relics of the protoplanetary disk, where the planets formed and evolved, and preserve in their nucleus important clues about the early solar nebula. One of the main questions to answer about comets is the physical origin of the radicals (CN, C2, C3) in particular their locus of production within comets. Ground-based observations of comets can only detect the coma, not the nucleus. However, the nucleus strongly influence the morphology of the coma via processes such as nucleus rotation, obliquity, and active regions on its surface. Mapping the coma morphology using an integral-field spectrograph allows us to study the underlying processes that shape the coma and set constraints on the properties of the nucleus, the fundamental truth we are seeking.
To uncover the origin of radicals (CN, C2, C3) observed at optical wavelengths in the coma of comets, one needs to study species parentage. It is a complex problem, as some radicals can have several possible parents or be released by different mechanisms, which are not easy to identify. However, a better understanding of those mechanisms is crucial to link optical observations of comets to nucleus ice abundances. Mapping the coma morphology, using an IFU spectrograph, and comparing the spatial distribution of the gas and the dust, allows us to study the underlying processes that shape the coma and produce radicals such as CN, C2 or C3 and also to set constraints on the properties of the nucleus.
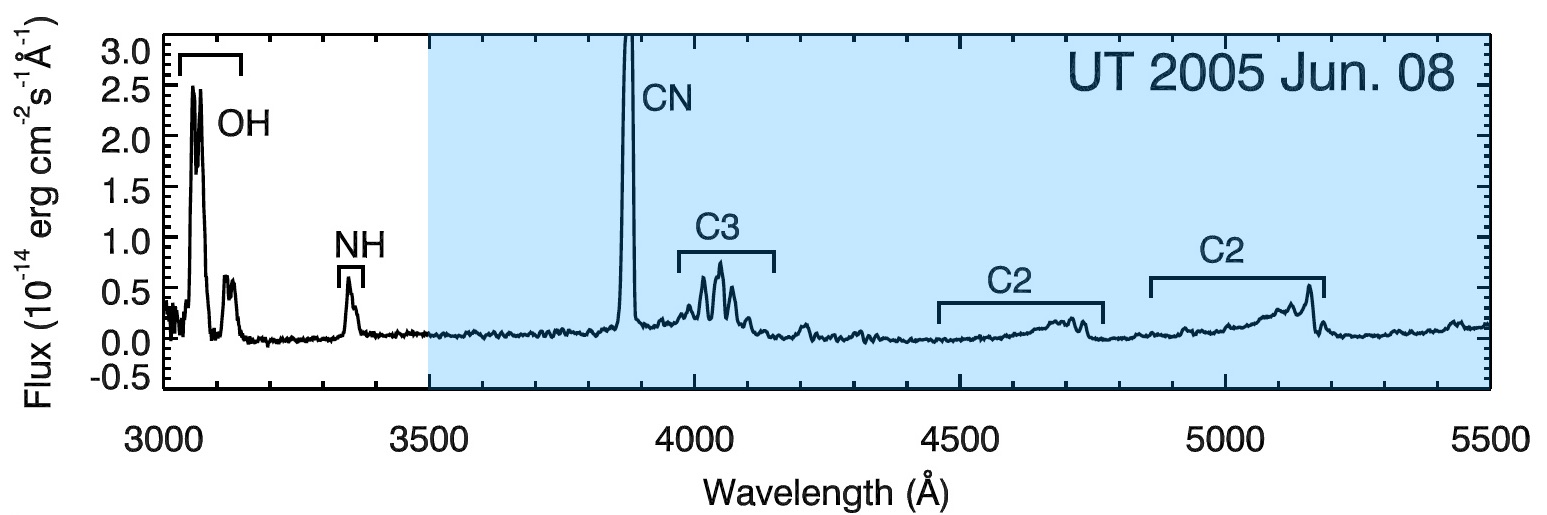
The wavelength range of BlueMUSE allows for a simultaneous coverage of multiple radicals at nm (Fig. 9, left). In particular in the CN, C2, C3 group, many transitions that can be studied individually in a single IFU observation over a large spatial scale, which is impossible to do efficiently with narrow-band filters or long-slit spectroscopy (e.g., [41]). In addition, observations with an IFU (e.g., [189]) allow to simultaneously study several gas species and the dust without any concern about the effects of rotation (typically a few hours). Cometary lines are very narrow, but moderate spectral resolution of 4000 like BlueMUSE is sufficient to study the spatial distribution of gaseous species.
BlueMUSE is the only instrument that enables us to study the morphology of several gaseous species simultaneously while benefiting from such a large field of view and being attached to an 8-m class telescope, and allows for a direct comparison with the dust morphology (measured from the spectral continuum). The MUSE instrument, for example, does not cover the very strong CN band at 388 nm. Large spatial structures are expected over the BlueMUSE field-of-view based on current narrow-band observations, such as spiral-like structures (Fig. 9, right). One of the hypotheses that can be directly tested with BlueMUSE is whether dust grains could be a source of production for the CN.
At 1 AU, the scale length of a gas coma is on the order of 105 km, which is about 2 arcmin, and a good fit to the 1.41.4 arcmin2 FoV of BlueMUSE, as the surface brightness flux of emission lines drops away further into the outer coma. For a moderately active comet, the surface brightness flux for a gas emission band is on the order of: 10-14 erg s-1 cm-2 arcsec-2. A signal-to-noise of 10 per BlueMUSE pixel (0.3′′) can be achieved in the continuum and all spectral lines in typically 10 mins, allowing for a fine monitoring of the coma over the full rotation of the comet (a few hours).
Asteroids:
Most of the asteroids are inactive objects but a few of them (slightly over 30 objects known so far) present cometary activity. They are called active asteroids or Main Belt Comets. Even if they represent a small fraction of asteroids or comets their study is important for a better understanding of physical properties of both comets and asteroids, the frontier between these two categories of planetary bodies being not so obvious for scientists [85]. Different physical mechanisms can drive such cometary activity [97]: rotational mass loss, impacts, thermal disintegration, sublimation of ice, radiation pressure sweeping, electrostatics and gardening… It is difficult to get observational clues that can permit to differentiate these possible mechanisms. In this context BlueMUSE can uniquely help in mapping gaseous emission bands of abundant species in comets like CN (388 nm) or C2 (516 nm) as well as colours scattered by the dust, allowing detailed studies of the spatially resolved physical properties of these objects.
4 Nearby galaxies
4.1 Key science case: ISM and HII regions, extreme starbursts
Low-metallicity starburst galaxies (blue compact dwarf galaxies - BCDs) provide a unique window in our understanding of galaxy formation, and fulfill several specific and irreplaceable roles in extragalactic astronomy and cosmology. They offer a unique opportunity to study galaxy formation under conditions approaching those of the first galaxies, prior to and during the epoch of reionization (EoR). They are: (1) ideal laboratories in which to study at low intrinsic extinction the most rare, massive and extreme stars [35, 104]; (2) enable detailed studies of collective star formation and the associated feedback processes in the least chemically evolved local environments known [111, 94]; (3) are likely the sites of super-luminous supernova/hypernova explosions [118] and long-duration GRBs [76]; (4) their shallow gravitational potential wells provide less resistance to galactic outflows, enabling material that is heated by the star formation process to escape into the galaxic halo and beyond and enrich the intergalactic medium with metals; additionally, chemical abundance patterns in BCDs [167] can place valuable constraints on the timescales for dispersal and mixing of heavy elements in protogalaxies; (5) they may have more porous/disrupted ISM, which enhances the escape of Lyman- radiation and ionizing continua. They thereby allow us to understand how similar galaxies at high-redshift leak ionizing photons, reionise the Universe, and maintain the meta-galactic ionizing background; (6) they may be the closest analogues of some of the faint galaxies identified in high- surveys, that dominate the star-formation budget at early times; and finally (7) several lines of evidence suggest that some of the most metal-poor (12+log(O/H)7.6) local BCDs have experienced the dominant phase of their build-up at a late cosmic epoch. For this reason, they are convenient laboratories to explore the main processes driving dwarf galaxy formation, as long as their morphological and dynamical relics have not had time to be erased in the course of secular galactic evolution [154]. For instance, the majority of these systems shows a cometary morphology that might result from unidirectional star formation propagation. Spatially resolved spectral synthesis studies of BlueMUSE data will offer a tremendous potential for reconstructing the assembly history of these galaxies and shedding light into the regulatory role of feedback on the synchronization of the star formation process on scales of kpc. In contrast to objects at and beyond, such local starbursts can be studied in enormous detail and the physical properties determined exhaustively.
Top of this list is how feedback – both radiative and mechanical – from star-formation heats and disrupts the interstellar and circumgalactic gas, and how large-scale, enriched galaxy winds develop and evolve. In order to measure the thermal and kinetic energy in the gas phase we need accurate mapping of temperature and density to derive pressures and accurate masses, and well-resolved lines to identify individual kinematic components of gas and measure the turbulent broadening. Determination of the excitation/ionization state is vital in order to understand how ionizing photons may penetrate the H ii regions to the diffuse ISM, and escape from galaxies through ionized channels. This needs high-resolution optical spectroscopy, mainly focused at the blue end of the spectrum, and large fields of view in order to capture the whole extended gaseous haloes, i.e., BlueMUSE.
Current status with MUSE and other instruments:
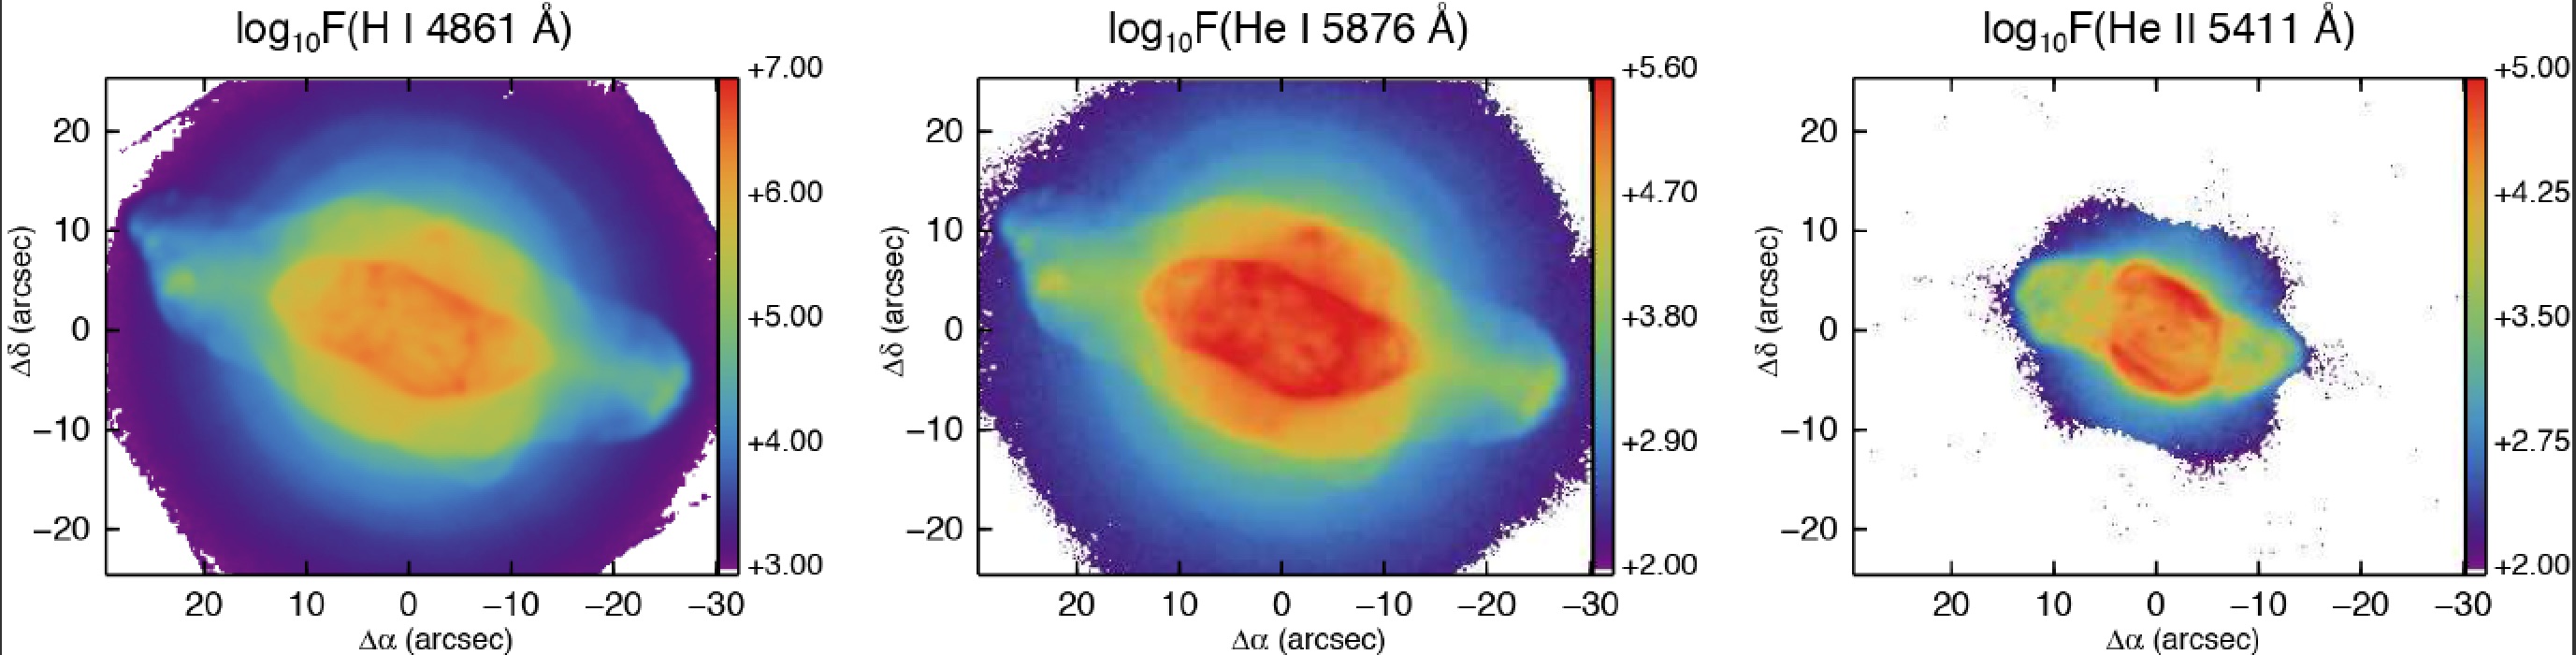
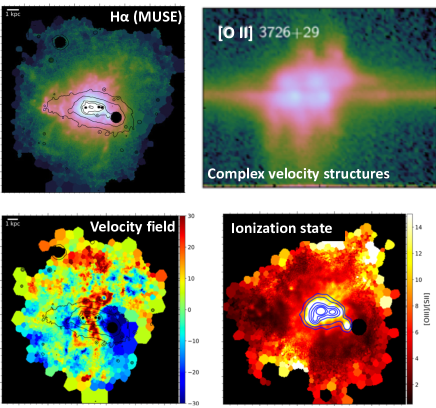
Our current understanding of the ionized gas haloes and details of the ISM has mainly been guided by MUSE (which easily maps diffuse gas on large scales), with higher resolution spectrographs (e.g., X-Shooter, FLAMES) determining kinematics and measuring vital emission lines bluewards of the MUSE bandpass – see Fig. 10 [10]. This shows ESO 338-IG04, a local luminous blue compact galaxy and one of the nearest analogues of Lyman break galaxies at . The contours show the stellar continuum, but the ionized gas (traced by H) is clearly found out to 10 the effective radius and fills the MUSE field-of-view; its kinematics, shown in Fig. 10 lower left, reveal a turbulent and complex extended halo that is heated and blown out in winds from massive stars and supernovae exploding in the central starburst. This shows roughly biconical outflows that are highly ionized, as illustrated in the lower right panel which shows the [O iii]/[S ii] ratio. This highly ionized outflow also correlates with Lyman- emission [77], which is enhanced co-spatially with these channels, which likely also reveals the mechanism by which ionizing radiation escapes galaxies (see ‘Lyman Continuum’ science case §5.3). The upper right panel shows the spectrum of the central region of this galaxy, demonstrating how the complex kinematics shown to the lower left decompose into various velocity components, as the turbulent gas is ripped up and driven out by feedback. Only in these high resolution, blue spectra can we see emission lines that allow us to derive the density and temperature using the same ions, and therefore allow us to derive detailed abundances in both the ISM and galaxy winds. This in turn provides the pressure, internal energy and mass of gas in the wind. Only with this information can we begin to distinguish inflows and outflows, and determine the detailed energy balance and ultimate future of galactic winds. We will therefore infer the influence of winds on the IGM enrichment (see ‘Gas Flows’ science case §5.2), and the fate of the available gas in the ISM.
There is no doubt that high-resolution blue spectrographs and large format IFU have lead to significant enhancements in our understanding of the diffuse ISM and circumgalactic medium (CGM). However these existing instruments have two main shortcomings: (1) high-resolution blue instruments (e.g., X-Shooter) are slit-only spectrographs, and do not allow us to map CGM gas; and (2) the only existing large format IFU (MUSE) has neither the blue coverage nor the spectral resolution to capture the blue lines and decompose the velocity components. This represents a major limitation because the strongest temperature diagnostic is the [O iii] 4363 Å line, while the strongest density probe is the [O ii] 3726,3729 Å doublet. Alternative proxies, [N ii] 5755 Å and the [S ii] 6716,6731 Å doublet are far too weak to be recovered on any pointings apart from the highest surface brightness star-forming regions. This point becomes even more true at low metallicity [81] as we target the analogues of the earliest dwarf galaxies to form – the systems that likely reionised the Universe. Without temperatures and densities in the halo gas, we are missing key quantities needed to understand the detailed physics of the starburst ISM as global energetic numbers are not available.
Even blue compact galaxies, with continuum half-light radii of a few arcsec, completely fill the MUSE field-of-view as we are detecting diffuse circumgalactic gas. The enhanced FOV of BlueMUSE is therefore vital. Moreover the spectral resolution, that decreases to R1800 at the blue end of MUSE is insufficient to resolve multiple velocity components in nebular gas; the resolving power of BlueMUSE is ideally set to match the velocity dispersion of extragalactic nebulae. Very importantly the [O iii] Å and [O ii] Å doublet are not captured by any current large format IFU at redshifts where the galaxy can be spatially well-resolved . Like MUSE, the BlueMUSE instrument will systematically capture the blue Wolf-Rayet bump and He ii 4686 Å line in every observation, both of which are vital for constraining the ionizing photon budget and contribution of these stars to feedback. Current samples of such galaxies, selected for observation with HST [151, 95, 205, 204, 170, e.g.], indicate that there will be hundreds of southern-hemisphere compact dwarf starbursts from which to assemble key science programs. A recent example of IFU observations of outflows in the nearest green pea galaxy analogue Mrk71 obtained with PMAS, including the [O ii] doublet in the UV, illustrates the potential that will become available with BlueMUSE at the VLT [141].
Synergies with other facilities
LSST will find huge numbers of undiscovered compact starbursts, in the same way that SDSS discovered green peas [28]. Given the huge increase in depth these galaxies will extend to even lower stellar mass and lower metallicities. These will be ideal, and very timely systems to follow up with BlueMUSE.
Currently H i observations of compact starburst galaxies are only possible with the VLA, and are of special relevance for understanding the Lyman continuum throughput. However beyond 50 Mpc these observations become very challenging, and at are completely hopeless at these galaxy masses. SKA will provide observations of the atomic material.
4.2 Low surface brightness galaxies
Low Surface Brightness galaxies (LSBs) could represent a large fraction of local galaxies, up to 50% according to [149]. Despite this large fraction, their nature and origin have remained unknown: are they large spin disks (e.g., [12, 14]) for instance, or the results of head-on collisions [126]. Their exceedingly low surface brightness has been hindering in-depth studies of this important population, from which we could obtain a census, on crucial scientific questions:
• A good constraint on the shape of the luminosity function of local galaxies can only be reached by taking into account the LSBs [11].
• LSBs bring crucial elements to understand the DM nature since they may be DM-dominated [159].
• LSBs allow the study of star formation in the low density regime, for which many issues are still debated such as lower efficiency, threshold, IMF variations, etc. This is directly comparable to the issues found in the recently discovered phenomenon of XUV galaxies [65, 177], with extended diffuse disks found around otherwise “normal” galaxies (see also [72]).
The study of LSBs is thus of paramount importance for our understanding of galaxy evolution.
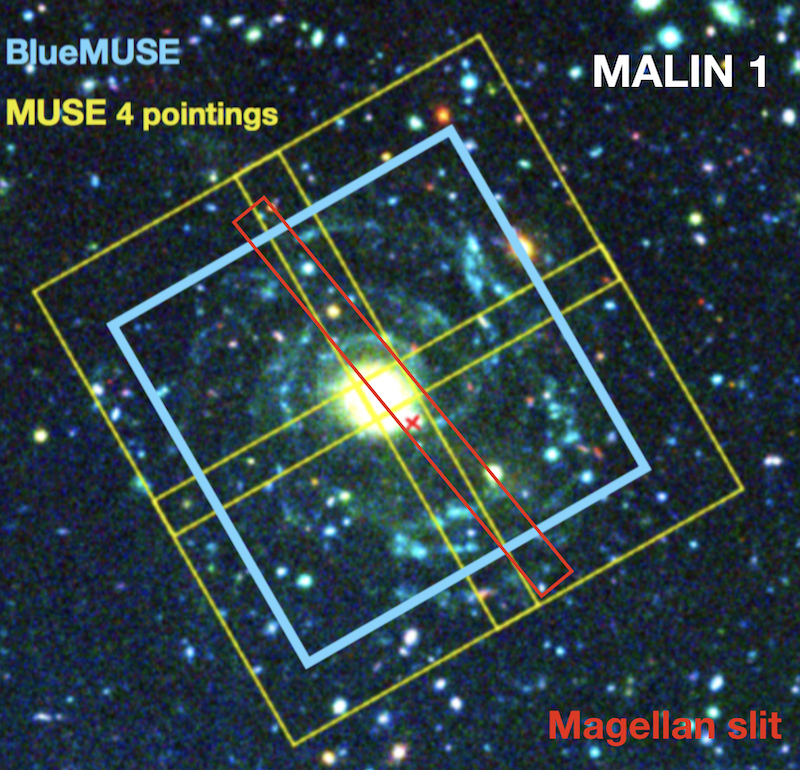
Current instruments have considerably gained in sensitivity, allowing new studies of very diffuse objects, e.g., [107, 142]. The Virgo cluster was observed in the optical [54], reaching 29 mag arcsec-2 in g’ band, and in the UV [22]. We still miss, however, comprehensive spectroscopic surveys. In an on-going work, Madathodika et al. (in preparation) uses Magellan-IMACS long-slit spectra in a few different places of one of the largest LSBs (Malin 1) to put new constraints on the inner rise of the rotation curve, crucial for the dark matter content determination of this galaxy, and to estimate the star formation surface density in a few knots. However, a full census of star formation regions, and a better determination of the dynamics clearly call for large-IFU observations. With BlueMUSE, it would be possible to include most parts of the galaxy in a single pointing when four pointings are needed with MUSE. Moreover, BlueMUSE will allow key observations of many emission lines that are of utmost importance to understand the nature and origin of these galaxies. Oxygen lines will be used to determine the metallicity of the extended disk which will allow us to distinguish between the different formation scenarios of LSBs (e.g., a gradient of low metallicity gas is predicted in the models presented in [14], but head-on collisions should have large metallicity), combined with stellar dynamics. Only few constraints on extinction in LSBs have been obtained so far from far-infrared data, or from H/H in few H ii regions (e.g., [161]), but they indicate a low amount of attenuation. The H flux will thus provide a direct indicator of the SFR on a shorter time-scale than all the other bands used so far over the full galaxy (10, 100, 500 Myr for H, FUV, u, respectively), with a spatial resolution (1′′=1.7 kpc), i.e. 5 times better than GALEX. The UV to Balmer line ratio is a direct constraint for the time delay between star forming events (modeled in [20]), and may also be used to constrain the massive-end slope of the IMF [108].
Among LSBs, the galaxy Malin 1, discovered in 1986 [23], is one of the prime examples of giant LSB galaxies, characterized by its extended low surface brightness disk and high gas content. Malin 1 has the largest radial extent of any known spiral galaxy, with a low surface brightness disk extending out to 120 kpc [145] and an extrapolated central surface brightness of 0,V 25.5 mag arcsec-2 [88]. Its study will provide a reference point for the family of LSBs with similar H i masses and UV colours. Deep UV and optical imaging showed that the giant disk behaves on long time-scales like a normal galaxy but with an angular momentum as large as 20 the Milky Way one [61, 14]. This new photometry suggests a variety of ages for the UV emitting regions; a stochastic star formation history for LSBs was also proposed (e.g., [13]), but this analysis is limited to the GALEX resolution of 5′′ and to the timescales probed by UV filters ( Myr).
Recently, the possible existence of a new class of galaxies, characterized by a faint central surface brightness (below 24 mag arcsec-2) and a large effective radius (Re kpc), has been the subject of an active debate in the community. While such extended LSB galaxies, known as “Ultra-diffuse galaxies (UDGs)”, had been identified in many optical surveys of the sky, their distance and thus intrinsic properties have only been recently determined. This measure could be achieved with expensive long-slit spectroscopy (33 hrs with Keck) of their stellar populations [186], done as part of a follow-up of the Dragonfly imaging project. UDGs have been found in clusters of galaxies, like Coma, in groups and in the field (for instance in the neighborhood of M101, [139]).
A sub-class of UDGs show an excess of globular clusters (GCs), an indication that they might be rather massive objects. Their DM content is at the centre of a hot debate within the community with highly DM-rich galaxies (Dragonfly 44, [186]) and, on the other hand, galaxies lacking DM [185].
In such conditions, the true nature of UDGs is highly uncertain: they could be inflated regular dwarfs, tidally stripped satellites, tidal dwarf galaxies, or failed massive galaxies. The lack of information on the age and metallicity of their stellar populations prevents us from having a definitive answer. While on-going surveys with CFHT (NGVS, MATLAS, CFIS), Subaru (HSC SPP) or Dragonfly (DNGS) have provided catalogues of hundreds of UDGs candidates, less than 20 have yet spectroscopic follow-up.
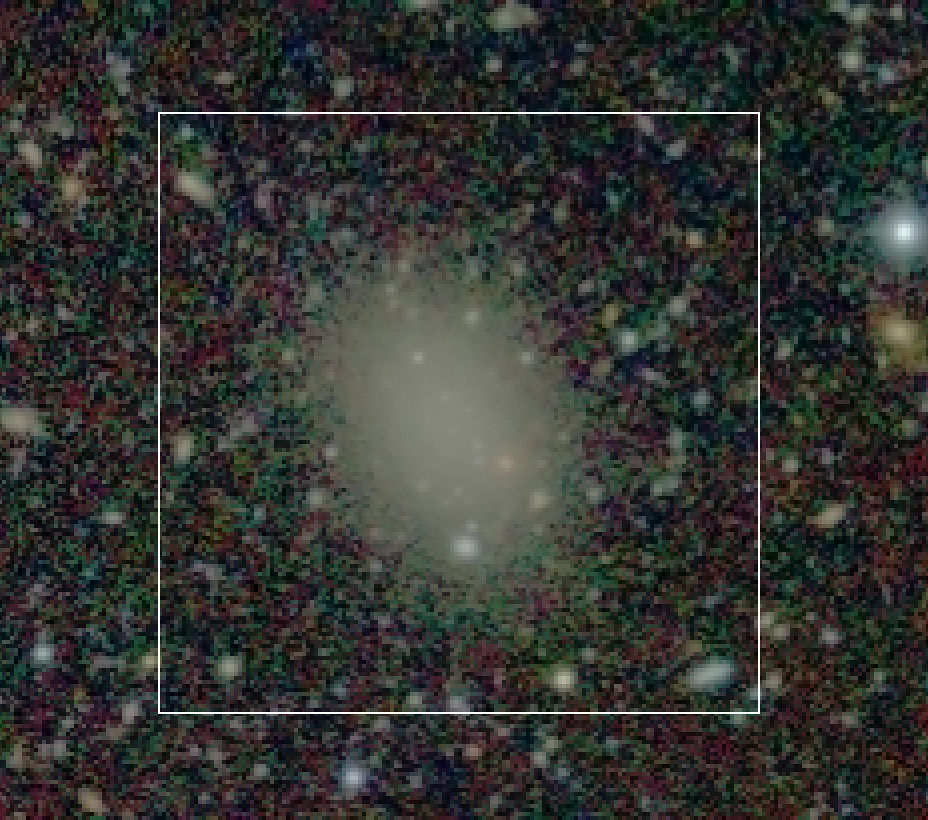
BlueMUSE would be ideal to investigate the origin and structural properties of UDGs, giving simultaneously information on the stellar populations of the GC and diffuse component. BlueMUSE will revolutionize the study of LSB and UDGs:
-
•
Its large field of view which is perfectly suited to the size of the LSB/UDGs and the distribution of GCs, as seen on Fig. 11.
-
•
Its wavelength coverage will provide the detections of age and metallicity indicator lines such as oxygen lines, only reachable in the blue, as well as Balmer absorption lines and H emission allowing to probe the star formation history and activity of these galaxies.
-
•
Its relatively high spectral resolution (with respect to MUSE) will allow us to determine the rotation curve of the star-forming gas-rich LSB galaxies (and more generally the full dynamics, including effects of eventual bars or other asymmetries), and for the gas-poor UDGs, the dynamics of the GC populations, together with the velocity dispersion of the diffuse stellar populations, thus testing previous hints on the DM content.
Synergies:
The synergy between BlueMUSE and other instruments is clear and key to the understanding of such populations of galaxies. MUSE will bring additional emission line diagnostics, such as H, [N ii] and [S ii]. LSST will enable us to detect more low surface brightness galaxies allowing us to increase the study sample. An ALMA follow-up of the star-forming regions detected with BlueMUSE will enable a study of dust and molecular gas in these systems and, finally, SKA will provide a census on their H i reservoir.
4.3 Environmental effects in local clusters
BlueMUSE will be an ideal instrument to study the role of the environment on galaxy evolution.
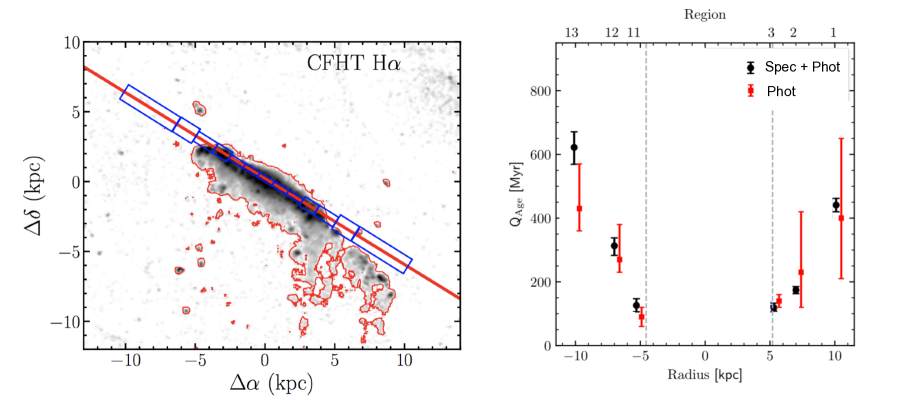
Thanks to its large field of view, high sensitivity, spectral coverage and resolution, it is the ideal instrument to study the quenching mechanism in dense environments and the origin of the faint end of the red sequence dominating the galaxy population in local clusters. Indeed, the blue part of the spectrum of local galaxies sampled by this instrument (3500-6000 Å) includes several age-sensitive absorption lines, such as the Balmer sequence produced by young stellar populations, generally used to identify objects where the star formation activity has been stopped abruptly (post starburst galaxies; e.g., [160]). BlueMUSE will allow us to reconstruct the 2D spectrum of dwarf elliptical galaxies in local clusters, where the low surface brightness of the extended stellar disc makes medium resolution spectroscopic observations infeasible with other IFU facilities. The observed spectrum will be fitted with state-of-the-art SED fitting codes which allow to reconstruct the star formation history of perturbed systems (e.g., [21, 57]). This will enable an accurate reconstruction of the quenching timescale as a function of position in a galaxy, enabling, for example, detailed modeling of outside-in stripping as the galaxy moves into the cluster (see Fig. 12). The presence of several age-sensitive Balmer absorption features (as well as the Balmer break) in the BlueMUSE wavelength range makes this instrument far superior than MUSE in the timescale determination for recent quenching events.
The spectral resolution will also allow to study the kinematical properties of the stellar component and understand whether dE galaxies in clusters are mainly fast rotators, as expected whenever their star formation activity has been quenched after a mild interaction with the hot and dense intra-cluster medium emitting in X-rays, or rather by more violent gravitational interactions with other cluster members (e.g., [178]). Combined with MUSE data at longer wavelengths, BlueMUSE data will be crucial for detecting and analysing the properties of the gas stripped during the interaction with the surrounding environment (as done, for example, in ESO 137-001, [59], [58]) now often observed during deep narrow-band wide-field imaging surveys of nearby clusters (e.g., [203, 19]). Critically, the blue wavelengths will open up the detection of [O ii] Å and [O iii]Å, the most accurate indicators for density, temperature, and metallicity of the ionized gas.
Synergies: Once removed from the galaxy, the gas stripped from the disc gets in contact with the hot gas trapped within the potential well of the cluster. The stripped material, which is mainly in the cold atomic phase, can thus be heated by different mechanisms (ionisation by the hot gas of the intra-cluster medium, heat conduction, MHD waves, turbulent mixing, etc) and change phase, becoming ionised or hot gas, while in other cases it can collapse into molecular clouds to form new stars. The study of the stripped material thus requires multifrequency observations: the cold HI gas is observable at 21 cm (SKA), while the molecular phase through different CO lines (with ALMA). The hot gas phase is visible in X-rays (Athena), while the ionised gas component is observable with MUSE and BlueMUSE.
5 The Distant Universe
5.1 Deep fields
Observations of deep extragalactic fields performed with MUSE (HDFS, [2]; UDF, [3]; CDFS, [182]; MUDF [123]) have demonstrated how a wide-field optical IFU is a game-changer for the study of distant galaxies. Two features of this instrument stand out to explain its impact in this domain. First, MUSE provides a comprehensive spectroscopic view of the sky, i.e. high quality spectra for all sources in the field of view with no prior selection. This approach has produced an order of magnitude increase in the number of spectroscopic redshifts measured in these deep fields [80, 89, 26], thereby revealing systematically groups and associations of galaxies that would never have been targeted for spectroscopic follow-up [190, e.g.]. It has been instrumental building extremely well controled and complete samples of galaxies which have allowed to set constraints e.g., on the properties of C iii] emitters [134]), Fe ii emitters [56], and Mg ii emitters [53], on stellar kinematics of galaxies [69], star formation at [15], or on the properties of extreme [O iii]/[O ii] emitters at [153]. The second feature, which really makes MUSE a transformative instrument, is its unprecedented and unique sensitivity to emission lines. This has led to an impressive revision of the census of distant star-forming galaxies, including the discovery of very high equivalent width LAEs without HST counterparts and extremely faint UV magnitudes (average AB 32) [3, 133], the robust detection of numerous LAEs, the assessment of the evolution of their luminosity function [42] and the characterisation of their equivalent widths [75]. Perhaps uniquely, this ability to detect line emission has led MUSE to discover and characterize extended Lyman- haloes around most small galaxies [200, 116], or O ii gaseous structures in galaxy groups [45], and tentative evidence of ouflows seen in Fe ii fluorescent lines [56]. The uniqueness of MUSE in this domain and the leap forward that it allowed is illustrated also by [17] who detected and measured bright Lyman- nebulae around of their targeted quasars when the consensus from deep narrow-band searches expected . MUSE has opened a new window on the physics of the CGM, and there exists no rival technique.
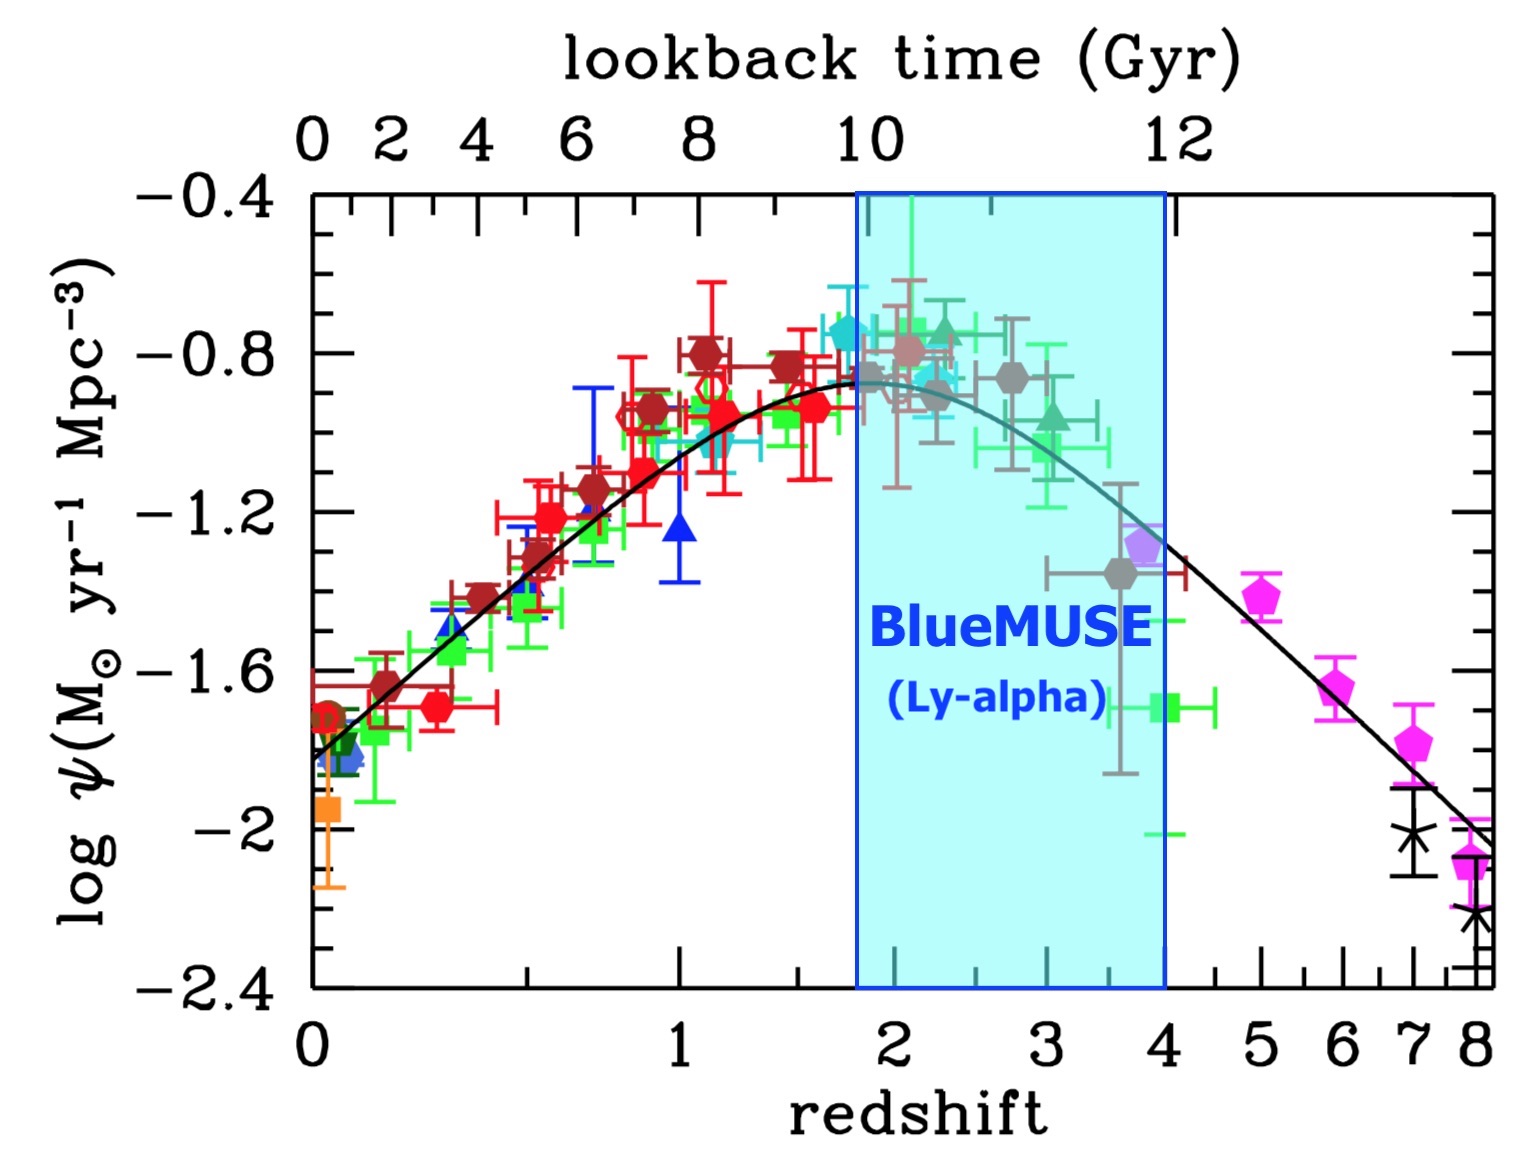
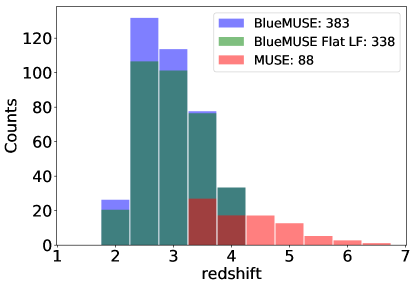
With its blue spectral coverage and increased field of view, BlueMUSE will be a complementary and even more powerful facility. The current MUSE redshift desert (, corresponding to the redshift of [O ii] emitters at the red end and of LAEs at the blue end) will be largely filled down to , and the large population of [O ii] emitters will be probed down to . BlueMUSE will observe LAEs and their CGM in the [1.9-4] redshift range. Their expected counts for a 10-hours depth single pointing is 380, that is 4.3 times larger than MUSE observations at the same depth in the UDF (88 LAEs, [3], see right panel of Fig. 13). This large gain results from the combination of the increased field of view, the increased free spectral range of BlueMUSE with respect to OH lines, the smaller luminosity distance which allows to probe much fainter galaxies and a small increase of the volume of Universe probed at these redshifts. The semi-analytical model used for this prediction [63] gives an accurate description of the LAE luminosity function over a large range of luminosity. However the faint end evolution is currently not constrained by the observations. We nevertheless show that, even when assuming a luminosity function flat below erg s-1, the number of predicted LAE counts stays high (e.g., 338 galaxies with respect to 88 for the current 10 hrs depth MUSE observation).
Thanks to a surface brightness dimming reduced by a factor at in comparison to with MUSE, we expect a similar gain in the ability of BlueMUSE to detect Lyman- emission from diffuse gas around galaxies, which may allow us to detect emission from gas all the way out into the intergalactic medium (IGM, §5.2.1). More than this significantly improved efficiency, the redshift range where BlueMUSE will see Lyman- covers a key period of cosmic history, when the cosmic star formation rate turns around and starts to decrease with time (left panel of Fig. 13). By allowing us to build a complete and homogeneous census of star-forming galaxies throughout this epoch, and to survey the evolution of their circum-galactic medium, BlueMUSE will show us this major transition as it happens and help us understand the emergence of strong cosmological accretion shocks, the conditions for survival of cold streams, and the effect of galactic winds (§5.2, 5.5).
5.2 Key science case: Gas flows around and between galaxies
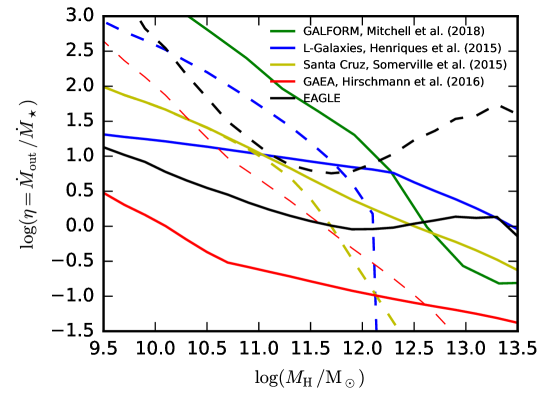
Even in the era of precision cosmology, and despite the impressive success of recent large-scale cosmological simulations at reproducing the bulk of galaxy properties (stellar mass function, clustering, …) across cosmic time, galaxy formation is still far from understood. In particular, the fundamental questions about how galaxies acquire gas from the intergalactic medium, and how they regulate their growth through galactic winds or other preemptive processes, are mostly unconstrained from observations or theory. Figure 14 (from Mitchell et al., in prep.) illustrates this by showing predictions of outflow rates from different state-of-the-art simulations, all extremely well calibrated to reproduce the stellar properties of galaxies. These predictions differ by orders of magnitudes! Clearly, constraints on the stellar properties of galaxies alone are degenerate and cannot help us decide which physical scenario among these simulations, if any, corresponds to reality. From Fig. 14, it is also clear that observing the Circum-Galactic Medium (CGM) and constraining the flows of gas that traverse it would be a radically new constraint on galaxy formation.
MUSE has spectacularly demonstrated its ability to observe the CGM through its emission in the Lyman- line of hydrogen (e.g.,[201]). Observations with BlueMUSE in the redshift range will be no less spectacular, but more importantly, they will be key in constraining galaxy formation because they cover the peak of cosmic star formation (Fig. 13, left). Among the factors that drive this turn-over in the cosmic SFR, we may expect a change in the form of accretion flows and their interactions with galactic winds, which marks the beginning of the transition from the early Universe – where gas flows cold and collimated onto galaxies–, and the late Universe – where star formation is sustained by cooling-regulated accretion from hot coronae. Observing the evolution of the CGM through this epoch will be a key in discriminating between all existing theories.
In the subsections below, we show how BlueMUSE, may be used to set unprecedented constraints on (1) the state of the diffuse intergalactic medium, (2) the evolution of the neutral gas content of the CGM from to , (3) the metal content of the CGM as a tracer of galactic winds.
5.2.1 Imaging the Intergalactic Medium at
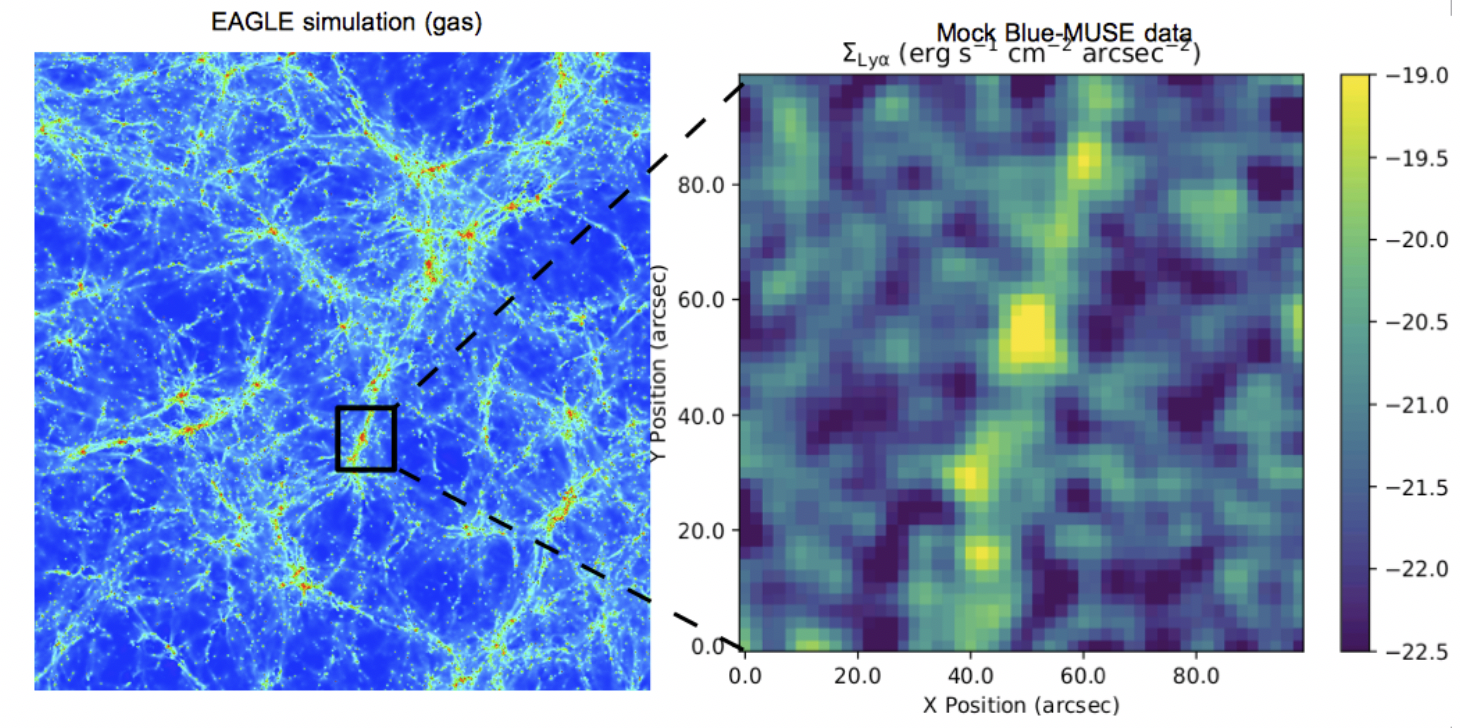
Aim: A fundamental prediction of CDM is that galaxies form in overdensities that are connected by a network of filaments, which compose the cosmic web (Fig. 15). Obtaining direct images of this cosmic web at , the epoch when galaxy formation was at its peak, would represent a major breakthrough for modern cosmology, and a goal that will be within reach of BlueMUSE with deep (tens of hours) integrations. BlueMUSE will be able to mosaic the IGM over several continuous areas, a step much beyond the current attempts in single deep pointings (30 to 100hr) with MUSE (ESO PID 1100.A-0528 PI: Fumagalli; ESO PID 1101.A-0127 PI: Bacon).
With BlueMUSE, the redshift range becomes accessible where the cosmological surface brightness dimming is a factor of four lower in average compared to for MUSE. For a fixed signal-to-noise, this will make BlueMUSE faster at mapping the IGM compared to the current MUSE (with a further gain in area covered by BlueMUSE compared to MUSE). This will mean that BlueMUSE will be able to construct large mosaics of IGM emission in reasonable exposure times, rather than a single 100 hrs integration at with MUSE.
Furthermore, by exploiting the wavelength coverage and field of view of BlueMUSE, several independent experiments can be performed in order to image the cosmic web and measure the amplitude of the meta-galactic UV background at :
(1) Ionised by the UV-background, the cosmic web is predicted to radiate in Lyman-, with a maximal surface brightness of erg s-1 cm-2 arcsec-2) in optically-thick gas (e.g., [68]) when assuming a conservative lower limit for the photoionization rate (; [52]). By targeting known regions which contain over-densities (e.g., galaxy pairs or quasars), BlueMUSE will have both the area coverage and sensitivity to measure the emission line luminosity in the large scale structure, directly imaging the cosmic web at . Increased emission from hosting quasars is expected to boost the Lyman- emission of the cosmic web at Mpc distance by factors (compared to the “field”, [27]).
(2) Combining observations at the position of continuum-detected galaxies between will enhance the cosmic web where the high density peaks form. In turn, a detection of the cosmic web will yield a measurement of the intensity of the UV-background, a fundamental quantity that encodes the production and escape of ionising photons from galaxies and AGN, but that is currently constrained only by the absorption properties of the Lyman- forest and by model-dependent radiative transfer calculations (e.g., [71, 105, 51]).
(3) Finally, BlueMUSE will map H i absorption against the continuum of individual galaxies at with , which will be detected in 30 hrs with in spectral bins of Å. This data quality is sufficient to reconstruct a tomographic map of the cosmic web at this redshift on scales of 200 kpc, complementing measurements in emission.
5.2.2 The Circumgalactic Medium of star-forming galaxies with Lyman-alpha emission
Narrowband Lyman- images have suggested for many years that Lyman- emitters are “fuzzy”, and image stacks have revealed significantly extended emission [136, 144, 202]. Thanks to MUSE we know now that Lyman- haloes are ubiquitous around even low-mass galaxies at redshifts [200, 116], with halo scale lengths typically 10 larger than the UV sizes of the hosting galaxies. Stacking some of the deepest MUSE data reveals that these haloes extend out to the virial radius, matching the incidence rates of high column density H i absorbers [201]. This extended Lyman- emission thus holds unique clues about the spatial distribution and potentially also kinematics of circumgalactic hydrogen, but due to the resonant nature of the Lyman- transition it is a huge challenge to decode this information. Clearly, spatially resolved spectroscopy coupled with numerical simulations and theoretical models will be crucial in this endeavour. Yet, here MUSE is reaching its fundamental limits. Even for the brightest known Lyman- haloes at there is barely enough signal to break up the Lyman- emission into several independent spatial elements, and the outer halo regions will remain inaccessible to spectroscopic studies. A factor of gain in cosmological surface brightness, coming with the move from to as well as the improved spectral resolution using BlueMUSE, will however change everything in this game. BlueMUSE will allow us to investigate the motions of gas in the CGM of galaxies and thus obtain crucial constraints on the balance of inflows and outflows.
Due to the large field of view of BlueMUSE, there will be several galaxies in each observed field bright enough to be used as background sources for absorption line spectroscopy. Thus it will be possible to infer H i or metal line column densities for a significant number of foreground Lyman- emitters and connect this information to the detected extended emission [60, e.g.]. While this experiment is in principle also conceivable with MUSE, the almost total dearth of sufficiently bright background galaxies at makes it practically impossible. Again, the move to afforded by BlueMUSE will imply an almost complete change.
5.2.3 Tomography of the Circumgalactic Medium with metal absorption lines
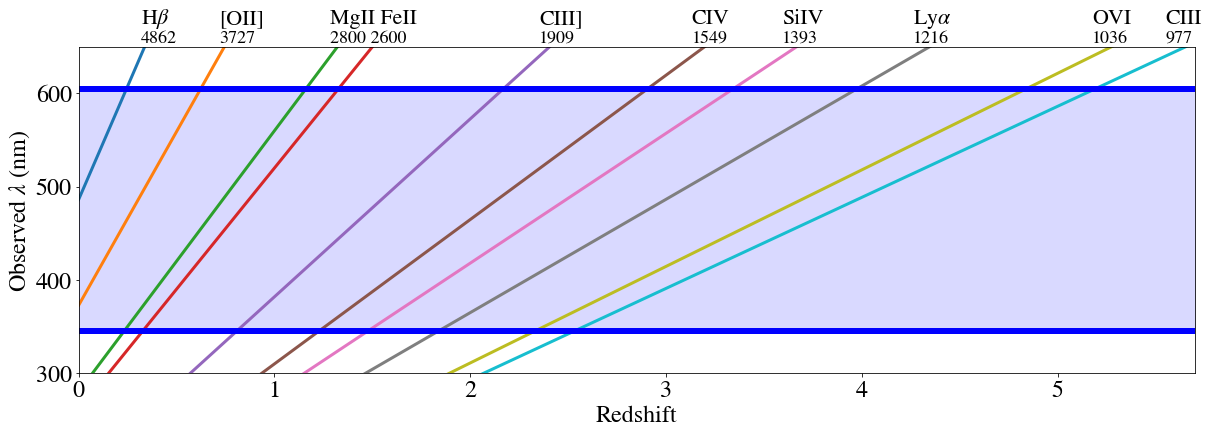
Aim: Using metal absorptions lines (Mg ii 2796,2803 Å ; Fe ii 2600 Å) in multiple background sources to measure the full spatial extent and kinematics of the circum-galactic medium (CGM) around individual star-forming galaxies ([O ii] emitters) at intermediate redshifts ().
Up to now, the state-of-the-art CGM studies are limited to either single galaxy-quasar pairs [24, 162, 157] on small samples or to stacking techniques with large samples of pairs (e.g., [113, 16]). Examples in individual pairs [168] show the promise of extending this technique to the use of background galaxies as probes of foreground ones. However, in order to understand the exact nature of gas flows around galaxies, the CGM kinematics can only be mapped using multiple (5 to 10) background sources (quasars or galaxies). This is fortunately within reach with background galaxies, but this is not feasible with MUSE for the following reasons: (a) the spectral range (480-930 nm) does not allow to study UV absorption lines below , whereas is a sweet spot for group selections as background galaxies and (b) the spectral resolution of MUSE at 5000 Å is too low (R=1800 or 160 km s-1; see Fig. 3). With BlueMUSE, we will reach many more extended background galaxies to spatially resolve absorption and address metal mixing on small scales (e.g., [158]).
With BlueMUSE, it will become possible to study the spatial and kinematics properties extent of the CGM around individual galaxies at intermediate redshifts . This redshift range is particularly well suited as this corresponds to the regime where the source density of background galaxies is now becoming arcmin-2 to I mag.
Feasibility:
Background source density: Down to 24(25) AB mag, there are typically about 6(14) ELGs per arcmin2 at as in blank fields such as the UDF-mosaic field ([3]; at 10 hrs depth). The number of background galaxies can be suitably increased by targeting groups or clusters.
Continuum sensitivity: Down to 24(25) AB mag (V), the SNR in the continuum (for the background galaxies) should reach SNR 5-10 in order to be sensitive to absorption lines (e.g., Fe ii, Mg ii) down to equivalent widths of 0.5(1) Å. Using the preliminary ETC, the SNR in the continuum at 4500 Å is (5) for extended sources with -band magnitudes of 24 (25), respectively. The SNR is calculated over a region of 0.8 arcsec2, with a seeing of 0.8 arcsec and assuming a constant spectrum in .
Uniqueness of BlueMUSE:
This CGM tomography science case is currently not feasible with MUSE for several reasons. Indeed, this science case requires
-
(1)
the wavelength range ( Å) in order to observe Fe ii and Mg ii at redshifts given that groups are predominantly found at [110];
-
(2)
a spectral resolution of 60-80 km s-1 in order to measure the absorption relative kinematic shifts at a precision better than 25 km s-1. MUSE only provides a low resolution (R1800, 160 km s-1) at 5000 Å ;
-
(3)
a field of view arcmin2, as the CGM is known to extend to at least 200 kpc in radius.
Synergies: While the primary science goal requires BlueMUSE, short ( hr) MUSE snapshots for [O ii] is envisioned to measure systemic redshifts at . Large surveys like eBOSS, DESI, 4MOST, LSST will be key for field selection, providing ever increasingly large samples of background sources. SKA might be able to map the cold neutral H i component that we will probe in absorption.
5.2.4 Probing the Circumgalactic Medium in emission with metal lines
With BlueMUSE, we will have access a plethora of rest-frame UV lines in the redshift range (Fig. 16), opening up a completely new way to map the CGM directly, also complementing spectroscopy in absorption. Metal emission lines are significantly fainter than Lyman-, with characteristic surface brightness predicted around erg s-1 cm-2 arcsec-2 at ([8], Augustin et al. submitted). Due to the cosmological surface brightness dimming, detection at with MUSE is almost prohibitive and thus limited to only extreme environments, making the case for low-redshift/shorter-wavelength observations obvious.
The detection of such low surface brightness signal will require deep exposures, but is expected to yield a tremendous return. Indeed, while Lyman- traces the bulk of the gas mass, metal transitions become key traces to map the spatial extent of the multiphase CGM. Indeed, the brightest surface brightness of each ion arises from well-defined regions of the density-temperature phase diagram, where the gas temperature approaches the peak of the ion emissivity. Thus, low and moderate ions will yield maps of the relatively cool ( K) CGM, with ions at higher ionisation states tracing the warm-hot medium at . Combined together, these traces will enable a complete reconstruction of the multiple phases of the CGM.
Indeed, the handful of examples of metal emission lines detected so far in the rest-frame UV (Mg ii, Fe ii, O vi) [169, 78, 55, 56] already show the promise of this type of studies to infer the spatial extent and morphology of galactic outflows from distant galaxies. Moreover, the combination of ions traced in absorption and emission enables (with some assumption, e.g., on the excitation mechanism of the gas) the derivation of physical parameters (e.g., size along the line of sight, volume density and ion mass) that are weakly or unconstrained by spectroscopy in absorption alone.
While MUSE has greatly advanced our knowledge of extended Lyman- emitting gas around AGN at (e.g., [17]), an important limitation has been the general rarity of detections of extended emission from other UV lines. BlueMUSE will provide a quantum leap in our ability to study Lyman- halos and the CGM around AGN, by proving the wavelength coverage and sensitivity to detect the faint UV emission lines that are crucial to characterise the kinematic, ionization and chemical enrichment properties of AGN-photoionized Lyman- halos and CGM, in the redshift range . Non-resonant lines such as He ii 1640 and C iii] will allow more reliable gas kinematics to be derived, free from the potential complications of Lyman- line transfer effects, and the inclusion of metal lines such as N v 1239,1243 and C iv 1548,1551 will allow the ionization properties and chemical enrichment history of the gas to be derived (e.g., [193, 86]). Mapped in two spatial dimensions thanks to the IFU technique, this information will afford detailed study of AGN feedback, the dispersion of metals via outflows, and accretion of gas in/around massive galaxies near the peak in the star formation and AGN activity histories.
5.3 Lyman Continuum Emitters
Cosmic reionisation corresponds to the period in the history of the Universe during which the predominantly neutral intergalactic medium was ionized by the emergence of the first luminous sources. Although star-forming galaxies in the early Universe are thought to be the main sources of reionisation, the nature of these objects remains so far totally unknown due to the increasing opacity of the intergalactic medium with redshift which renders direct LyC detections impossible at 5. However, LyC Emitters can be observed at lower redshifts, even though these observations have proven difficult: so far, only 14 detections have been reported in the low- Universe (, [7, 117, 18, 91, 90, 92, 93]), and a few at high redshift ([37, 188, 171, 9, 187, 174]).
BlueMUSE will be able to directly probe the Lyman continuum from sources at 3 to 5 and, unlike previous targeted observations, it will allow us to collect a statistical sample of LyC emitters as part of blind surveys. Nevertheless, due to the IGM opacity increasing rapidly towards higher redshifts, we expect most detections to fall in the redshift range where Lyman- can be used to assess the spectroscopic redshift, and where the IGM transmission () remains reasonably high: at , of the lines of sights have a transmission higher than , as shown on Fig. 17. As demonstrated by MUSE studies, BlueMUSE will be particularly efficient at detecting the faintest population of galaxies [42, 75]. These low mass objects are plausibly strong leakers according to previous observations [92] and simulations [199, 179, 106], and may correspond to the analogues of the sources of reionisation.
Indirect methods are the only probes of LyC leakage in the distant Universe. Lyman- escape from galaxies is expected to correlate with LyC escape [192, 40], and most recent observations of the Lyman- properties of LyC leaking galaxies at low [191, 92] and high redshift [129, 128, 174] have confirmed the theoretical predictions. In particular, the peak separation of the double-peaked Lyman- profiles nicely anti-correlates with the LyC escape fraction (see Fig. 17). As discovered by MUSE, star-forming galaxies at high redshift show a broad diversity of Lyman- halos (in terms of sizes and geometry), which trace the gas in the circumgalactic medium [200, 116]. By investigating the links between LyC emission and the Lyman- spectral/spatial shapes, BlueMUSE will provide unique and robust tests to probe ionizing sources during the epoch of reionization.
Valuable information on the nature of LyC emitters could also be extracted from BlueMUSE spectra. In the red, the rest-frame far-UV emission ( Å) can be detected up to , while at the blue end, BlueMUSE will probe ionising emission from the Lyman limit (912 Å) down to 780 Å to add new constraints on the typical shape of the Lyman continuum. In addition, we can expect to detect Lyman-series absorption lines to get insight into the H i content of galaxies (column density, covering fraction) and its link with LyC escape. Detecting these lines at 3 with BlueMUSE would be outstanding since such observations are usually limited to galaxies at much lower redshift. BlueMUSE would also benefit greatly from ancillary data based on multiple-band imaging (e.g HDF) and MUSE existing observations (e.g. C iii] emission; [134]) combined with SED fitting and photoionization models to assess the properties of the stellar population and the interstellar medium (mass, age, metallicity, ionization parameter) of the LyC emitters.
Breakthrough with BlueMUSE:
Thanks to a large field of view, a blue spectral range, and a high sensitivity, BlueMUSE will simultaneously probe LyC and Lyman- for a statistical sample of low mass galaxies with high Lyman- spectral resolution at , where the IGM attenuation is still modest. These objects being presumably analogues of the main ionizing galaxies at higher redshift, deep surveys with BlueMUSE will put unique constraints on the physical properties of the sources responsible for cosmic reionization as well as their observability with future instruments (e.g., JWST) based on indirect diagnostics.
Feasibility:
The typical LyC flux levels of the individual detections at reported by [187, 174] are around erg s-1 cm-2 Å-1. This can be reached at 3 level in 30 hrs exposure with BlueMUSE. It is worth pointing out that the majority of sources to be found in a single BlueMUSE field will certainly be fainter than the UV-bright galaxies reported by [187, 174] but their LyC escape fraction are probably high [92, 199] which may lead to similar observed flux levels. In addition, detailed stacking analysis will anyway be possible thanks to the large predicted number of sources to be observed per field (see Fig. 13).
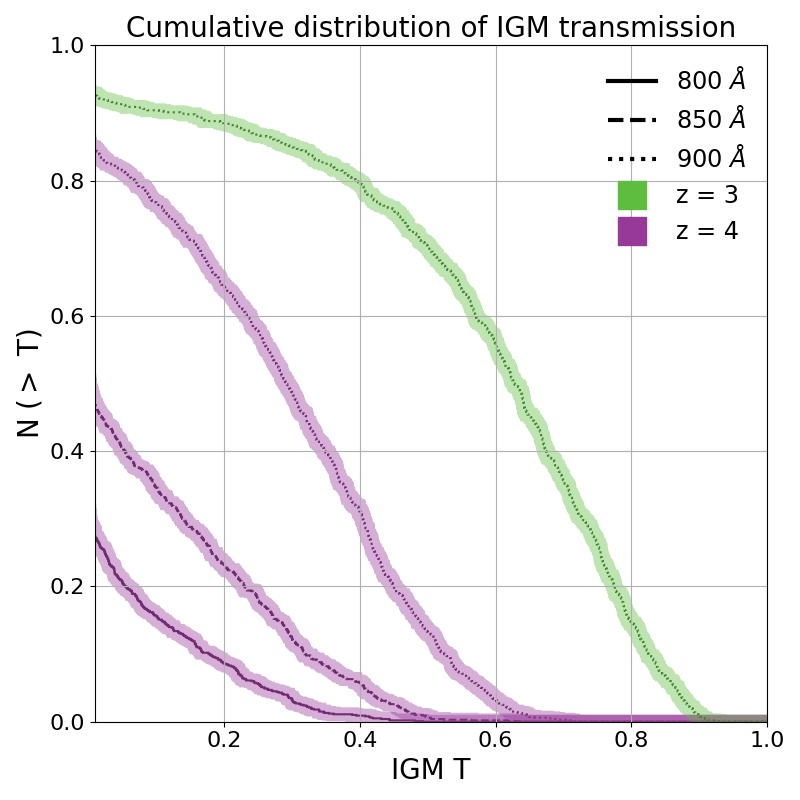
5.4 Gravitational lensing in clusters
Massive galaxy clusters locally curve Space-Time and thus stretch and magnify the light of background galaxies. Within the central square arcminute, distant sources are generally multiply imaged by the lensing effect and the magnification of these images is generally larger than a factor of a few but can reach factors of hundreds for gravitational arcs straddling the critical lines. Thanks to the lensing magnification we can study lower luminosity/mass galaxies that would otherwise be undetectable. The identification of the multiple images and the precise determination of their redshifts offer a unique opportunity to map the total mass distribution of the cluster cores including the unknown dark matter.
In the best cases, such as for the Hubble Frontier Field Clusters, the precision of the mass determination is better than the percent level (e.g., [96]). However, this is only possible if a large number of multiple images have measured precise redshifts [164]. Measuring a large number of redshifts of multiple images in a cluster has only been possible routinely with the current MUSE instrument, thus revolutionising the cluster lensing modeling power (e.g., [112]), with potential further application to put constraints on the properties of dark matter cross-section (e.g., [73]) or cosmological parameters (e.g., [100]). Using these precise models, we can then correct for the lensing magnification of distant sources, thus extracting their full properties.
-
•
Multiple images and faint LAEs: For a typical massive cluster at the Einstein radius (characterising the scale of strong lensing) is 50′′ and the area of high magnification fits perfectly the FoV of BlueMUSE (Fig. 18) and does not require mosaicing / multiple pointings, contrary to MUSE. In addition, due to the volume reduction in the source plane, the redshift distribution of lensed background galaxies is dominated by the population of LAEs, as currently seen in MUSE surveys (Fig. 18). MUSE has uncovered and unambiguously confirmed the redshift of a large number of multiple systems even beyond the detection limits of deep HST images in the Frontier Fields survey [125]. By probing the redshift range in Lyman-, we expect a much larger number of background sources (a factor based on the LAE LF, see “deep fields” science case §5.1). BlueMUSE will therefore confirm spectroscopic redshifts for multiple images in a very efficient way. As demonstrated by [74], such a high density of constraints per cluster makes it possible to test models of self-interacting dark matter. BlueMUSE will also contribute significantly in confirming the population of dwarf galaxies found at with HST down to AB -14 [1].
-
•
Giant arcs: because they require an almost-perfect alignment between a large background galaxy and the center of a lens, highly magnified giant arcs are quite unique. Only a very small number () of galaxies are known to be extremely extended (extended by 10 arcsec or more in a single image) in Lyman-. By moving to the number of such high redshift giant arcs increases significantly, allowing us to probe very small scales in the source plane ( kpc, [155], [99], Claeyssens et al. submitted). These giant arcs are perfect laboratories to study the mechanisms of Lyman- and UV emission, and their high continuum level make them unique background sources for resolved CGM absorption studies (e.g., [122], see also the gas flows science case §5.2.3)
-
•
Critical line mapping: Mapping a significant fraction of the surroundings of the critical lines with BlueMUSE has additional interests. The identification of new multiple images with spectroscopic redshifts along the critical lines will help further improve the mass distribution models of the clusters. The spectroscopic identification of several multiple images at different redshifts allows us to constrain the cosmological parameters (e.g., [100]). Compared to blank fields, isolated emission lines in strong-magnification regions can be easily classified as either high- or low- interlopers through multiple-imaging considerations.
Uniqueness of BlueMUSE:
(1) the discovery space in redshift allowed by the blue wavelengths, probing a larger number of faint background galaxies and multiple images compared to any other instrument. The cluster members also contaminate less in continuum at blue wavelengths (the lens is more transparent). This is crucial when searching for multiple images in the very core of the clusters, which are usually demagnified and obscured by bright foreground emission but give unique constraints on the central mass distribution.
(2) The FoV of BlueMUSE perfectly fits the typical Einstein radii of massive clusters (such as the Frontier Fields, e.g., [163]) and the region of multiple images.
5.5 The emergence of the first galaxy clusters
BlueMUSE clearly appears as the best means to achieve these goals by discovering and characterizing diffuse Lyman- nebulae that now we know are widespread in the early generation of galaxy clusters. Following the initial discovered in the dense core of a prototypical galaxy cluster progenitor, CL J1449+0856 at (Fig. 19-left, [183, 66, 67, 176]), we have recently used KCWI at Keck (in collaboration with Michael Rich at the University of California) to search for giant Lyman- nebulae inside several more structures: we see giant Lyman- nebulae in all of them. This includes the most distant X-ray detected cluster known (CL J1001+0220 at ; [197]) and the most spectacular detection is in a radio-selected forming cluster core at (Daddi, Rich, et al., in preparation). The presence of these nebulae unambiguously demonstrates that cold gas is co-existing with hot gas inside the deep potential well of these structures [183, 197]. The nature, origin, and fate of the cold gas is still unclear and a matter of debate: it might be related to cold gas accretion and/or arise from feedback between galaxy activity and the intra-cluster medium.
The identification and characterization of the most distant, galaxy clusters is currently a very active topic of research (see [152] for a recent review). It is also a recent one, as these dense structures, already consistent with a single massive dark matter halo (see discussion in [39]) as opposed to Mpc-scale loose over-densities like proto-clusters, have only started to be discovered in the past decade. They represent the earliest generation of massive collapsed structures, progenitors to Coma-like 0 clusters. As such, their abundance can be used to constrain cosmological parameters. They are also unambiguous formation sites of massive early type galaxies, and hence can shed light on the elusive processes that lead to galaxy transformations, leading to the build-up of this galaxy population that dominates local clusters. These high-redshift forming clusters also offer a unique opportunity to statistically map the feedback from SF/AGN activity through outflows and radiation effects (see e.g., [183]) affecting the key, early thermodynamic evolution of the hot intra-cluster medium (ICM) expected by leading models to mainly happen at (e.g., [115]). At these same redshifts of , crucially the redshift range newly enabled by BlueMUSE, simulations predict that massive 1013-14 M dark matter haloes should become efficiently shielded by this hot atmosphere, thus preventing further large-scale infall of cold gas into their cores ([38]; Fig. 19-right). This process is however still not well constrained and observations from BlueMUSE will crucially enable us to trace the epoch and duration of this transition. Evidence of persistent SF activity in massive structures at suggests that this might occur later and/or at higher halo masses than currently expected [184, 183, 197, 152], but statistics from a larger number of clusters and samples at the highest possible redshifts are required for definitive conclusions.
BlueMUSE will uniquely allow us to discover Lyman- emitting nebulae in the first generation of forming clusters down to , thus allowing exploration of the critical redshift range 1.8-3 where we expect cold accretion to massive haloes to peak due to the competing effects of hierarchical mass assembly of clusters (favouring the presence of more massive structures towards lower redshifts) and cosmic evolution of accretion rates (rapidly increasing with redshift at fixed structure mass). BlueMUSE will be able to statistically investigate these competing processes for the first time.
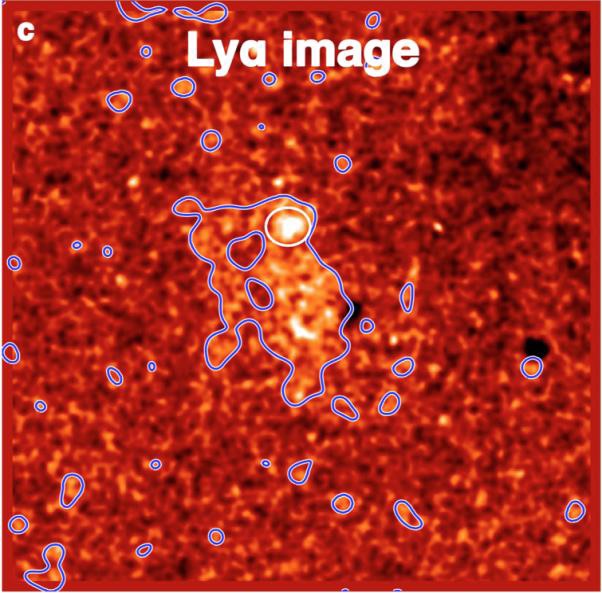
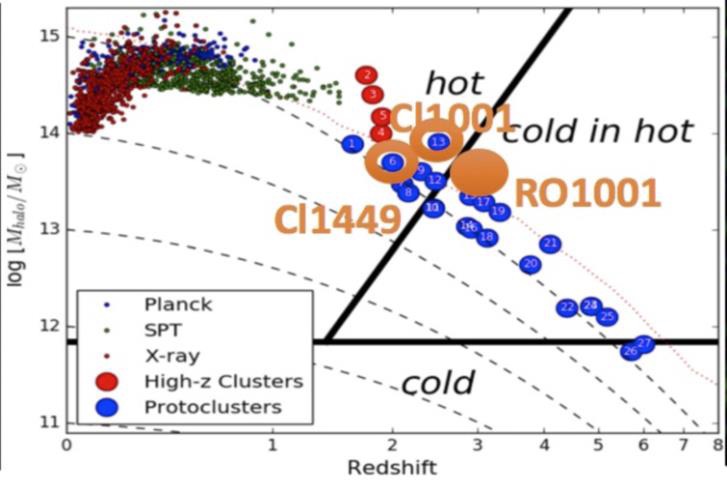
Uniqueness of BlueMUSE:
In the extended mode, MUSE currently allows observations down to 4650 Å, thus allowing detection of Lyman- emission only at . KCWI at Keck is starting to scratch the surface of this science but is strongly limited by its small field of view: when matching the spectral resolution and wavelength range of BlueMUSE, it covers a smaller field of view, making it nearly impossible to obtain a panoramic view of the diffuse Lyman- nebulae extending to the outskirts where critically we expect to detect connection to feeding filaments from the intergalactic medium.
While currently the sample of high redshift clusters known is still very limited, there are great prospects for the future: Euclid (launch 2022) would be able to identify all the already known clusters even from its shallower, nearly full sky coverage, promising the identification of order of thousands of candidates over , based on extrapolations of current numbers. A very promising means to select the most active first generation of clusters will be based on radio-overdensities [36], and SKA (operative from 2023) will also be able to provide many hundreds candidates over this redshift range. Finally, Athena (2029+, [148]) will have fantastic X-ray sensitivity and thus provide large number of candidates as well as characterizing their X-ray emission in detail, allowing to study the interplay between the hot (X-rays) and cold (Lyman-) media, and unveiling cluster total masses simultaneously with SZ from ALMA. ALMA will have the power to chart star formation and cold gas distributions in these kind of clusters, and complementary spectroscopy from JWST and ELT/HARMONI will unveil stellar population and gas physical properties.
Feasibility:
Based on current KCWI observations and luminosities recovered so far, panoramic detection and basic kinematic characterization of the giant Lyman- nebulae inside high redshift clusters will require only of order 1 hr integration with BlueMUSE. Longer integrations on selected targets will be able to unveil their physical properties (from weaker lines like C iv and He ii) and overall morphology down to lower surface brightness levels, with connection to the larger scale structure.
6 Uniqueness
By providing a large field IFU on an 8m-class telescope at blue wavelengths, BlueMUSE is a unique instrument to tackle all the science cases presented in this document. Among the three main characteristics which are specific to BlueMUSE (its wavelength range, its spectral resolution and its FoV), we have highlighted in Table LABEL:uniquetable the ones which make the science case much more competitive. The only two other similar instruments on the same telescope class are MUSE and KCWI.
MUSE: by construction, BlueMUSE has a very similar architecture to MUSE and the two instruments overlap in wavelength in the range 480-600 nm (465-600 nm in MUSE extended mode). However, even in this overlap region BlueMUSE provides a much higher sensitivity (see ‘Performance’ §2) and twice the spectral resolution of MUSE, in addition to the wider area (2 arcmin2) making it twice as efficient. For each of the science cases presented, Table LABEL:uniquetable (right column) shows that they would be either unfeasible, or done much less efficiently, with MUSE.
KCWI: the Keck Cosmic Web Imager (KCWI, [130]) is the only other instrument which provides an IFU with similar characteristics (wavelength range, spectral resolution) as BlueMUSE. However there is a strong difference in FOV (Fig. 20). Indeed, at the same spectral range and spatial / spectral resolution as BlueMUSE, the FOV from KCWI is 8.24 20.4′′, which is a factor of 40 smaller. This makes KCWI unsuitable to cover large areas to a high depth and reduces its discovery potential, unlike BlueMUSE. In addition, BlueMUSE is optimised to a single mode of operations and we expect its transmission to be 1.5-2 higher than KCWI.
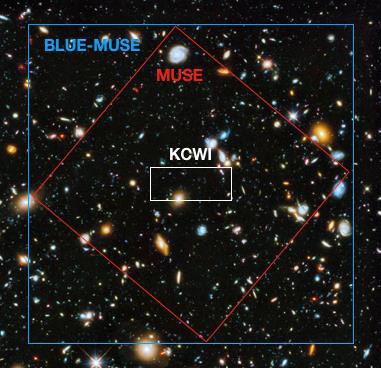
| Science Case |
|
|
FoV | Why not doable with MUSE? | |||||
| Massive stars | ✓ | ✓ | ✓ |
|
|||||
| Globular clusters | ✓ | ✓ |
|
||||||
|
✓ | ✓ | ✓ |
|
|||||
| Ionized nebulae | ✓ | ✓ |
|
||||||
| Comets | ✓ | ✓ |
|
||||||
| Extreme starburst galaxies | ✓ | ✓ | ✓ |
|
|||||
|
✓ | ✓ |
|
||||||
| Environmental effects | ✓ | ✓ | ✓ |
|
|||||
| Deep fields | ✓ | ✓ |
|
||||||
| Gas flows | ✓ | ✓ | ✓ | SB dimming makes it 4 less efficient | |||||
| Lyman-continuum emitters | ✓ | ✓ |
|
||||||
| Lensing clusters | ✓ | ✓ |
|
||||||
| High redshift clusters | ✓ | ✓ |
|
Serendipitous science:
Astronomy is to a significant degree still driven by unexpected discovery (e.g., dark matter and dark energy). These discoveries are often made by pushing the limit of observations with the most powerful telescopes and/or opening a new area of the instrumental parameter space.
Like MUSE, a single BlueMUSE observation provides 90000 spectra over 4000 wavelengths in one go. Thanks to its 360 million voxels (volume pixels), each BlueMUSE data cube produced by a single pointing observation is information rich. A good example of the potential richness of the BlueMUSE information content is given in the recent paper by [32], which report the discovery of a new low-redshift galaxy-scale gravitational lens, identified from a systematic search of publicly available MUSE observations. The probability of serendipitous discovery being proportional to the probed volume, BlueMUSE with its 2 arcmin2 field of view, will have roughly twice the discovery potential of MUSE. Compared to other MOS instruments or small field IFUs, like KCWI which can only perform pointed observations, BlueMUSE has thus a unique potential for serendipity discoveries.
High sensitivity:
One of the main characteristics of the optical design of MUSE, and of the BlueMUSE design as well, is a very high sensitivity, reaching up to 40% end-to-end at the peak (including atmosphere and telescope). A precursor developed by the manufacturer Winlight System (F) has already demonstrated the the expected level of efficiency in the blue is feasible [146]. This makes MUSE and BlueMUSE unique instruments, having the highest sensitivity of all optical spectrographs on VLT at their respective wavelength (Fig. 21). Note also that BlueMUSE will be more efficient in the blue-UV area than any instrument at the ELT.
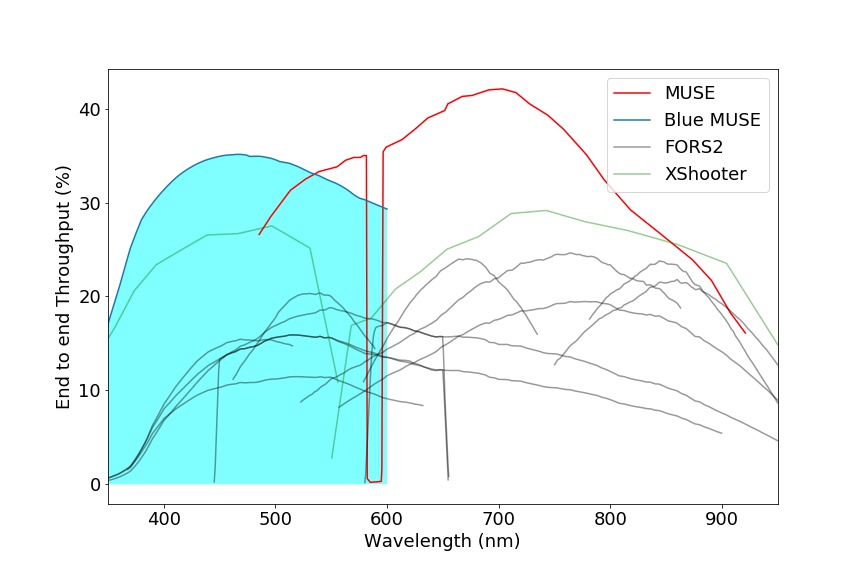
7 Synergies
With an expected first light around 2026, BlueMUSE will be at the telescope at a time when all other major facilities (ELT, JWST in particular) will focus on red and near-infrared wavelengths (see the schematic view Fig. 22). By providing a complement at shorter wavelengths, BlueMUSE will have strong synergies with these facilities, and will be the perfect follow-up spectroscopic instrument at short wavelengths at a time when HST will, presumably, no longer exist. All the science cases presented have synergies with future major facilities, in particular SKA at longer wavelengths, and will benefit from all the targets identified by Euclid and LSST in large field imaging.
With a field of view and a sensitivity comparable to NIRSpec, BlueMUSE deep fields will be very complementary to JWST deep fields: for example the NIRSpec population of faint emitters in H and [O ii] will also be easily detected with BlueMUSE as LAEs providing key information such as Lyman- escape fraction. The ALMA Deep Fields are also important as they provide a large number of targets with an overlapping redshift with BlueMUSE.
The unique survey capability and discovery potential of BlueMUSE will be able to provide numerous targets to ELT. For example HARMONI follow-up studies of extended Lyman- haloes detected by BlueMUSE will enable spatially resolved study of the Lyman- escape fraction in the CGM.
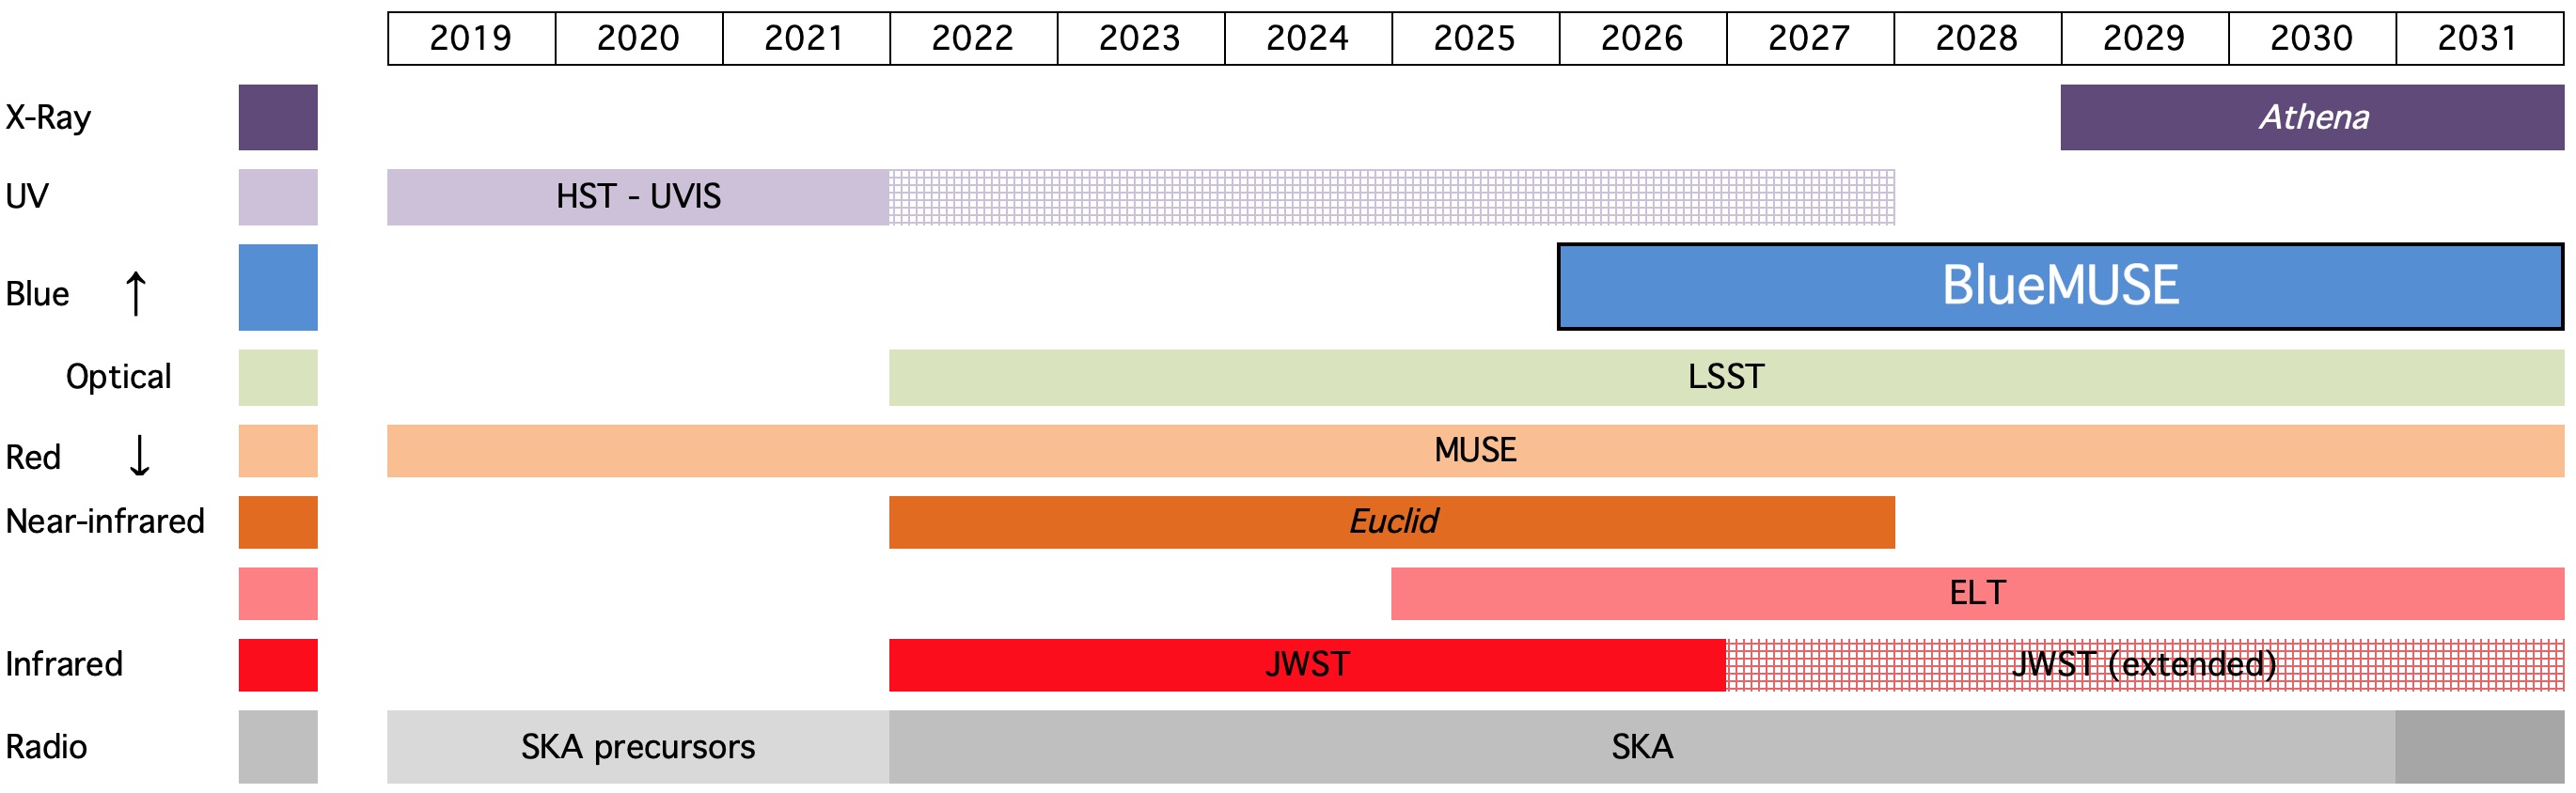
8 Conclusion
In this document, we have presented a selection of science cases where we believe BlueMUSE will have a very strong impact due to its unique capabilities. They however only represent a preview over the full range of science allowed by a blue-optimised wide-field monolithic IFU. Indeed, we expect BlueMUSE to be a transformative instrument for many science cases, including some that we can not predict today, like it has been the case for MUSE. By focusing on the blue/UV wavelength range, at a time where most new facilities will be operating at red/IR wavelengths, BlueMUSE will open up new discovery space, while allowing more MUSE-like science for the benefit of the community.
Acknowledgements
We acknowledge helpful discussions with Guy Monnet during the preparation of this document. This work was supported by the Programme National Cosmologie et Galaxies (PNCG) of CNRS/INSU with INP and IN2P3, co-funded by CEA and CNES. The authors acknowledge the support of the European Research council through the H2020 - ERC-STG-2015 / 678777 ICARUS program.
References
- [1] A. Alavi et al. “The Evolution of the Faint End of the UV Luminosity Function during the Peak Epoch of Star Formation (1 z 3)” In ApJ 832, 2016, pp. 56 DOI: 10.3847/0004-637X/832/1/56
- [2] R. Bacon et al. “The MUSE 3D view of the Hubble Deep Field South” In A&A 575, 2015, pp. A75 DOI: 10.1051/0004-6361/201425419
- [3] R. Bacon et al. “The MUSE Hubble Ultra Deep Field Survey. I. Survey description, data reduction, and source detection” In A&A 608, 2017, pp. A1 DOI: 10.1051/0004-6361/201730833
- [4] R. Bacon et al. “The MUSE second-generation VLT instrument” In Ground-based and Airborne Instrumentation for Astronomy III 7735, Proc. SPIE, 2010, pp. 773508 DOI: 10.1117/12.856027
- [5] N. Bastian and C. Lardo “Multiple Stellar Populations in Globular Clusters” In ARA&A 56, 2018, pp. 83–136 DOI: 10.1146/annurev-astro-081817-051839
- [6] V. Belokurov “Galactic Archaeology: The dwarfs that survived and perished” In New A Rev. 57, 2013, pp. 100–121 DOI: 10.1016/j.newar.2013.07.001
- [7] N. Bergvall et al. “First detection of Lyman continuum escape from a local starburst galaxy. I. Observations of the luminous blue compact galaxy Haro 11 with the Far Ultraviolet Spectroscopic Explorer (FUSE)” In A&A 448, 2006, pp. 513–524 DOI: 10.1051/0004-6361:20053788
- [8] Serena Bertone and Joop Schaye “Rest-frame ultraviolet line emission from the intergalactic medium at 2 z 5” In MNRAS 419.1, 2012, pp. 780–798 DOI: 10.1111/j.1365-2966.2011.19742.x
- [9] F. Bian et al. “High Lyman Continuum Escape Fraction in a Lensed Young Compact Dwarf Galaxy at z = 2.5” In ApJ 837, 2017, pp. L12 DOI: 10.3847/2041-8213/aa5ff7
- [10] A. Bik et al. “Super star cluster feedback driving ionization, shocks and outflows in the halo of the nearby starburst ESO 338-IG04” In A&A 619, 2018, pp. A131 DOI: 10.1051/0004-6361/201833916
- [11] M. R. Blanton et al. “The Properties and Luminosity Function of Extremely Low Luminosity Galaxies” In ApJ 631, 2005, pp. 208–230 DOI: 10.1086/431416
- [12] S. Boissier et al. “Chemical and spectrophotometric evolution of low surface brightness galaxies” In MNRAS 343, 2003, pp. 653–664 DOI: 10.1046/j.1365-8711.2003.06703.x
- [13] S. Boissier et al. “GALEX Observations of Low Surface Brightness Galaxies: UV Color and Star Formation Efficiency” In ApJ 681, 2008, pp. 244–257 DOI: 10.1086/588580
- [14] S. Boissier et al. “The properties of the Malin 1 galaxy giant disk. A panchromatic view from the NGVS and GUViCS surveys” In A&A 593, 2016, pp. A126 DOI: 10.1051/0004-6361/201629226
- [15] L. A. Boogaard et al. “The MUSE Hubble Ultra Deep Field Survey. XI. Constraining the low-mass end of the stellar mass - star formation rate relation at z 1” In A&A 619, 2018, pp. A27 DOI: 10.1051/0004-6361/201833136
- [16] R. Bordoloi et al. “The Dependence of Galactic Outflows on the Properties and Orientation of zCOSMOS Galaxies at z ~ 1” In ApJ 794, 2014, pp. 130 DOI: 10.1088/0004-637X/794/2/130
- [17] E. Borisova et al. “Ubiquitous Giant Ly Nebulae around the Brightest Quasars at Revealed with MUSE” In ApJ 831, 2016, pp. 39 DOI: 10.3847/0004-637X/831/1/39
- [18] S. Borthakur, T. M. Heckman, C. Leitherer and R. A. Overzier “A local clue to the reionization of the universe” In Science 346, 2014, pp. 216–219 DOI: 10.1126/science.1254214
- [19] A. Boselli et al. “A Virgo Environmental Survey Tracing Ionised Gas Emission (VESTIGE). III. Star formation in the stripped gas of NGC 4254” In A&A 615, 2018, pp. A114 DOI: 10.1051/0004-6361/201732410
- [20] A. Boselli et al. “High-mass Star Formation in Normal Late-type Galaxies: Observational Constraints to the Initial Mass Function” In ApJ 706, 2009, pp. 1527–1544 DOI: 10.1088/0004-637X/706/2/1527
- [21] A. Boselli et al. “Quenching of the star formation activity in cluster galaxies” In A&A 596, 2016, pp. A11 DOI: 10.1051/0004-6361/201629221
- [22] A. Boselli et al. “The GALEX Ultraviolet Virgo Cluster Survey (GUViCS). I. The UV luminosity function of the central 12 sq. deg” In A&A 528, 2011, pp. A107 DOI: 10.1051/0004-6361/201016389
- [23] G. D. Bothun and J. R. Mould “Sources of error in the Tully-Fisher relation - Reducing the scatter with CCD I-band surface photometry of spiral galaxies” In ApJ 313, 1987, pp. 629–643 DOI: 10.1086/165002
- [24] N. Bouché et al. “Signatures of Cool Gas Fueling a Star-Forming Galaxy at Redshift 2.3” In Science 341, 2013, pp. 50–53 DOI: 10.1126/science.1234209
- [25] F. Bresolin et al. “Extragalactic Chemical Abundances: Do H II Regions and Young Stars Tell the Same Story? The Case of the Spiral Galaxy NGC 300” In ApJ 700, 2009, pp. 309–330 DOI: 10.1088/0004-637X/700/1/309
- [26] J. Brinchmann et al. “The MUSE Hubble Ultra Deep Field Survey. III. Testing photometric redshifts to 30th magnitude” In A&A 608, 2017, pp. A3 DOI: 10.1051/0004-6361/201731351
- [27] S. Cantalupo, C. Porciani, S. J. Lilly and F. Miniati “Fluorescent Ly Emission from the High-Redshift Intergalactic Medium” In ApJ 628, 2005, pp. 61–75 DOI: 10.1086/430758
- [28] C. Cardamone et al. “Galaxy Zoo Green Peas: discovery of a class of compact extremely star-forming galaxies” In MNRAS 399, 2009, pp. 1191–1205 DOI: 10.1111/j.1365-2966.2009.15383.x
- [29] N. Castro et al. “Mapping the core of the Tarantula Nebula with VLT-MUSE. I. Spectral and nebular content around R136” In A&A 614, 2018, pp. A147 DOI: 10.1051/0004-6361/201732084
- [30] N. Castro et al. “The spectroscopic Hertzsprung-Russell diagram of Galactic massive stars” In A&A 570, 2014, pp. L13 DOI: 10.1051/0004-6361/201425028
- [31] D. Ceverino and A. Klypin “The Role of Stellar Feedback in the Formation of Galaxies” In ApJ 695, 2009, pp. 292–309 DOI: 10.1088/0004-637X/695/1/292
- [32] W. P. Collier, R. J. Smith and J. R. Lucey “A new strong-lensing galaxy at z= 0.066: another elliptical galaxy with a lightweight IMF” In MNRAS 478, 2018, pp. 1595–1600 DOI: 10.1093/mnras/sty1188
- [33] Nick L. J. Cox et al. “The ESO Diffuse Interstellar Bands Large Exploration Survey (EDIBLES) . I. Project description, survey sample, and quality assessment” In A&A 606, 2017, pp. A76 DOI: 10.1051/0004-6361/201730912
- [34] P. A. Crowther “Physical Properties of Wolf-Rayet Stars” In ARA&A 45, 2007, pp. 177–219 DOI: 10.1146/annurev.astro.45.051806.110615
- [35] P. A. Crowther and J. L. Bibby “On the massive star content of the nearby dwarf irregular Wolf-Rayet galaxy IC 4662” In A&A 499, 2009, pp. 455–464 DOI: 10.1051/0004-6361/200911758
- [36] E. Daddi et al. “Radio Selection of the Most Distant Galaxy Clusters” In ApJ 846, 2017, pp. L31 DOI: 10.3847/2041-8213/aa8808
- [37] S. de Barros et al. “An extreme [O III] emitter at z = 3.2: a low metallicity Lyman continuum source” In A&A 585, 2016, pp. A51 DOI: 10.1051/0004-6361/201527046
- [38] A. Dekel et al. “Cold streams in early massive hot haloes as the main mode of galaxy formation” In Nature 457, 2009, pp. 451–454 DOI: 10.1038/nature07648
- [39] C. Diener et al. “A Protocluster at z = 2.45” In ApJ 802, 2015, pp. 31 DOI: 10.1088/0004-637X/802/1/31
- [40] M. Dijkstra, M. Gronke and A. Venkatesan “The Ly-LyC Connection: Evidence for an Enhanced Contribution of UV-faint Galaxies to Cosmic Reionization” In ApJ 828, 2016, pp. 71 DOI: 10.3847/0004-637X/828/2/71
- [41] G. Dorman, D. M. Pierce and A. L. Cochran “The Spatial Distribution of C2, C3, and NH in Comet 2P/Encke” In ApJ 778, 2013, pp. 140 DOI: 10.1088/0004-637X/778/2/140
- [42] A. B. Drake et al. “The MUSE Hubble Ultra Deep Field Survey. VI. The faint-end of the Ly luminosity function at 2.91 z 6.64 and implications for reionisation” In A&A 608, 2017, pp. A6 DOI: 10.1051/0004-6361/201731431
- [43] A. Drlica-Wagner et al. “Eight Ultra-faint Galaxy Candidates Discovered in Year Two of the Dark Energy Survey” In ApJ 813, 2015, pp. 109 DOI: 10.1088/0004-637X/813/2/109
- [44] P.-A. Duc et al. “The ATLAS3D project - XXIX. The new look of early-type galaxies and surrounding fields disclosed by extremely deep optical images” In MNRAS 446, 2015, pp. 120–143 DOI: 10.1093/mnras/stu2019
- [45] B. Epinat et al. “Ionised gas structure of 100 kpc in an over-dense region of the galaxy group COSMOS-Gr30 at z 0.7” In A&A 609, 2018, pp. A40 DOI: 10.1051/0004-6361/201731877
- [46] C. Evans et al. “The VLT-FLAMES Survey of Massive Stars” In The Messenger 122, 2005, pp. 36–38
- [47] C. Evans et al. “The VLT FLAMES Tarantula Survey” In The Messenger 145, 2011, pp. 33–38
- [48] C. J. Evans et al. “The VLT-FLAMES survey of massive stars: Observations in the Galactic clusters NGC 3293, NGC 4755 and NGC 6611” In A&A 437, 2005, pp. 467–482 DOI: 10.1051/0004-6361:20042446
- [49] C. J. Evans et al. “The VLT-FLAMES Tarantula Survey. I. Introduction and observational overview” In A&A 530, 2011, pp. A108 DOI: 10.1051/0004-6361/201116782
- [50] X. Fang and X.-W. Liu “Very deep spectroscopy of the bright Saturn nebula NGC 7009 - I. Observations and plasma diagnostics” In MNRAS 415, 2011, pp. 181–198 DOI: 10.1111/j.1365-2966.2011.18681.x
- [51] C. Faucher-Giguere “A 2019 Cosmic UV/X-ray Background Model Update” In arXiv e-prints, 2019 arXiv:1903.08657
- [52] C.-A. Faucher-Giguère, A. Lidz, M. Zaldarriaga and L. Hernquist “A New Calculation of the Ionizing Background Spectrum and the Effects of He II Reionization” In ApJ 703, 2009, pp. 1416–1443 DOI: 10.1088/0004-637X/703/2/1416
- [53] A. Feltre et al. “The MUSE Hubble Ultra Deep Field Survey. XII. Mg II emission and absorption in star-forming galaxies” In A&A 617, 2018, pp. A62 DOI: 10.1051/0004-6361/201833281
- [54] L. Ferrarese et al. “The Next Generation Virgo Cluster Survey (NGVS). I. Introduction to the Survey” In ApJS 200, 2012, pp. 4 DOI: 10.1088/0067-0049/200/1/4
- [55] H. Finley et al. “Galactic winds with MUSE: A direct detection of Fe II* emission from a z = 1.29 galaxy” In A&A 605, 2017, pp. A118 DOI: 10.1051/0004-6361/201730428
- [56] H. Finley et al. “The MUSE Hubble Ultra Deep Field Survey. VII. Fe II* emission in star-forming galaxies” In A&A 608, 2017, pp. A7 DOI: 10.1051/0004-6361/201731499
- [57] M. Fossati et al. “A Virgo Environmental Survey Tracing Ionised Gas Emission (VESTIGE). II. Constraining the quenching time in the stripped galaxy NGC 4330” In A&A 614, 2018, pp. A57 DOI: 10.1051/0004-6361/201732373
- [58] M. Fossati et al. “MUSE sneaks a peek at extreme ram-pressure stripping events - II. The physical properties of the gas tail of ESO137-001” In MNRAS 455, 2016, pp. 2028–2041 DOI: 10.1093/mnras/stv2400
- [59] M. Fumagalli et al. “MUSE sneaks a peek at extreme ram-pressure stripping events - I. A kinematic study of the archetypal galaxy ESO137-001” In MNRAS 445, 2014, pp. 4335–4344 DOI: 10.1093/mnras/stu2092
- [60] Michele Fumagalli et al. “Witnessing galaxy assembly in an extended z3 structure” In MNRAS 471, 2017, pp. 3686–3698 DOI: 10.1093/mnras/stx1896
- [61] G. Galaz et al. “Deep Optical Images of Malin 1 Reveal New Features” In ApJ 815, 2015, pp. L29 DOI: 10.1088/2041-8205/815/2/L29
- [62] M. Garcia “Massive stars in the Sagittarius Dwarf Irregular Galaxy” In MNRAS 474, 2018, pp. L66–L70 DOI: 10.1093/mnrasl/slx194
- [63] T. Garel, B. Guiderdoni and J. Blaizot “Lyman- emitters in the context of hierarchical galaxy formation: predictions for VLT/MUSE surveys” In MNRAS 455, 2016, pp. 3436–3452 DOI: 10.1093/mnras/stv2467
- [64] B. Giesers et al. “A detached stellar-mass black hole candidate in the globular cluster NGC 3201” In MNRAS 475, 2018, pp. L15–L19 DOI: 10.1093/mnrasl/slx203
- [65] A. Gil de Paz et al. “Discovery of an Extended Ultraviolet Disk in the Nearby Galaxy NGC 4625” In ApJ 627, 2005, pp. L29–L32 DOI: 10.1086/432054
- [66] R. Gobat et al. “A mature cluster with X-ray emission at z = 2.07” In A&A 526, 2011, pp. A133 DOI: 10.1051/0004-6361/201016084
- [67] R. Gobat et al. “WFC3 GRISM Confirmation of the Distant Cluster Cl J1449+0856 at z = 2.00: Quiescent and Star-forming Galaxy Populations” In ApJ 776, 2013, pp. 9 DOI: 10.1088/0004-637X/776/1/9
- [68] A. Gould and D. H. Weinberg “Imaging the Forest of Lyman Limit Systems” In ApJ 468, 1996, pp. 462 DOI: 10.1086/177707
- [69] A. Guérou et al. “The MUSE Hubble Ultra Deep Field Survey. V. Spatially resolved stellar kinematics of galaxies at redshift 0.2 [-0.07cm] z [-0.07cm] 0.8” In A&A 608, 2017, pp. A5 DOI: 10.1051/0004-6361/201730905
- [70] Vasilii V. Gvaramadze, Alexei Yu. Kniazev, Norberto Castro and Eva K. Grebel “Two Circumstellar Nebulae Discovered with the Wide-field Infrared Survey Explore and Their Massive Central Stars” In AJ 157.2, 2019, pp. 53 DOI: 10.3847/1538-3881/aaf56c
- [71] F. Haardt and P. Madau “Radiative Transfer in a Clumpy Universe. IV. New Synthesis Models of the Cosmic UV/X-Ray Background” In ApJ 746, 2012, pp. 125 DOI: 10.1088/0004-637X/746/2/125
- [72] L. M. Z. Hagen et al. “On the Classification of UGC 1382 as a Giant Low Surface Brightness Galaxy” In ApJ 826, 2016, pp. 210 DOI: 10.3847/0004-637X/826/2/210
- [73] D. Harvey, F. Courbin, J. P. Kneib and I. G. McCarthy “A detection of wobbling brightest cluster galaxies within massive galaxy clusters” In MNRAS 472, 2017, pp. 1972–1980 DOI: 10.1093/mnras/stx2084
- [74] David Harvey, Andrew Robertson, Richard Massey and Ian G. McCarthy “Observable tests of self-interacting dark matter in galaxy clusters: BCG wobbles in a constant density core” In arXiv e-prints, 2018, pp. arXiv:1812.06981 arXiv:1812.06981 [astro-ph.CO]
- [75] T. Hashimoto et al. “The MUSE Hubble Ultra Deep Field Survey. X. Ly equivalent widths at 2.9 z 6.6” In A&A 608, 2017, pp. A10 DOI: 10.1051/0004-6361/201731579
- [76] T. Hashimoto et al. “The Star Formation Rate and Metallicity of the Host Galaxy of the Dark GRB 080325 at z=1.78” In ApJ 806, 2015, pp. 250 DOI: 10.1088/0004-637X/806/2/250
- [77] M. Hayes et al. “HST/ACS Lyman imaging of the nearby starburst ESO 338-IG04” In A&A 438, 2005, pp. 71–85 DOI: 10.1051/0004-6361:20052702
- [78] Matthew Hayes et al. “O VI Emission Imaging of a Galaxy with the Hubble Space Telescope: a Warm Gas Halo Surrounding the Intense Starburst SDSS J115630.63+500822.1” In ApJ 828.1, 2016, pp. 49 DOI: 10.3847/0004-637X/828/1/49
- [79] B. M. B. Henriques et al. “Galaxy formation in the Planck cosmology - I. Matching the observed evolution of star formation rates, colours and stellar masses” In MNRAS 451, 2015, pp. 2663–2680 DOI: 10.1093/mnras/stv705
- [80] E. C. Herenz et al. “The MUSE-Wide survey: A first catalogue of 831 emission line galaxies” In A&A 606, 2017, pp. A12 DOI: 10.1051/0004-6361/201731055
- [81] E. C. Herenz et al. “VLT/MUSE illuminates possible channels for Lyman continuum escape in the halo of SBS 0335-52E” In A&A 606, 2017, pp. L11 DOI: 10.1051/0004-6361/201731809
- [82] E. R. Higgins and J. S. Vink “Massive star evolution: rotation, winds, and overshooting vectors in the mass-luminosity plane. I. A calibrated grid of rotating single star models” In A&A 622, 2019, pp. A50 DOI: 10.1051/0004-6361/201834123
- [83] M. Hirschmann, G. De Lucia and F. Fontanot “Galaxy assembly, stellar feedback and metal enrichment: the view from the GAEA model” In MNRAS 461, 2016, pp. 1760–1785 DOI: 10.1093/mnras/stw1318
- [84] K. Hollyhead et al. “Evidence for multiple populations in the intermediate-age cluster Lindsay 1 in the SMC” In MNRAS 465, 2017, pp. L39–L43 DOI: 10.1093/mnrasl/slw179
- [85] H. H. Hsieh “Asteroid-comet continuum objects in the solar system” In Philosophical Transactions of the Royal Society of London Series A 375, 2017, pp. 20160259 DOI: 10.1098/rsta.2016.0259
- [86] A. Humphrey, M. Villar-Martín, L. Binette and R. Raj “Photoionization models for extreme Ly 1216 and Hell 1640 line ratios in quasar halos, and PopIII vs. AGN diagnostics” In A&A 621, 2019, pp. A10 DOI: 10.1051/0004-6361/201732007
- [87] T.-O. Husser et al. “MUSE crowded field 3D spectroscopy of over 12 000 stars in the globular cluster NGC 6397. I. The first comprehensive HRD of a globular cluster” In A&A 588, 2016, pp. A148 DOI: 10.1051/0004-6361/201526949
- [88] C. Impey and G. Bothun “Low Surface Brightness Galaxies” In ARA&A 35, 1997, pp. 267–307 DOI: 10.1146/annurev.astro.35.1.267
- [89] H. Inami et al. “The MUSE Hubble Ultra Deep Field Survey. II. Spectroscopic redshifts and comparisons to color selections of high-redshift galaxies” In A&A 608, 2017, pp. A2 DOI: 10.1051/0004-6361/201731195
- [90] Y. I. Izotov et al. “Detection of high Lyman continuum leakage from four low-redshift compact star-forming galaxies” In MNRAS 461, 2016, pp. 3683–3701 DOI: 10.1093/mnras/stw1205
- [91] Y. I. Izotov et al. “Eight per cent leakage of Lyman continuum photons from a compact, star-forming dwarf galaxy” In Nature 529, 2016, pp. 178–180 DOI: 10.1038/nature16456
- [92] Y. I. Izotov et al. “J1154+2443: a low-redshift compact star-forming galaxy with a 46 per cent leakage of Lyman continuum photons” In MNRAS 474, 2018, pp. 4514–4527 DOI: 10.1093/mnras/stx3115
- [93] Y. I. Izotov et al. “Low-redshift Lyman continuum leaking galaxies with high [O III]/[O II] ratios” In MNRAS 478, 2018, pp. 4851–4865 DOI: 10.1093/mnras/sty1378
- [94] B. L. James et al. “Uncovering blue diffuse dwarf galaxies” In MNRAS 448, 2015, pp. 2687–2703 DOI: 10.1093/mnras/stv175
- [95] A. E. Jaskot, M. S. Oey, C. Scarlata and T. Dowd “Kinematics and Optical Depth in the Green Peas: Suppressed Superwinds in Candidate LyC Emitters” In ApJ 851, 2017, pp. L9 DOI: 10.3847/2041-8213/aa9d83
- [96] M. Jauzac et al. “Hubble Frontier Fields: a high-precision strong-lensing analysis of galaxy cluster MACSJ0416.1-2403 using 200 multiple images” In MNRAS 443, 2014, pp. 1549–1554 DOI: 10.1093/mnras/stu1355
- [97] D. Jewitt, H. Hsieh and J. Agarwal “The Active Asteroids” In Asteroids IV, 2015, pp. 221–241 DOI: 10.2458/azu˙uapress˙9780816532131-ch012
- [98] A. P. Ji, A. Frebel, A. Chiti and J. D. Simon “R-process enrichment from a single event in an ancient dwarf galaxy” In Nature 531, 2016, pp. 610–613 DOI: 10.1038/nature17425
- [99] T. L. Johnson et al. “Star Formation at z = 2.481 in the Lensed Galaxy SDSS J1110+6459: Star Formation Down to 30 pc Scales” In ApJ 843, 2017, pp. L21 DOI: 10.3847/2041-8213/aa7516
- [100] E. Jullo et al. “Cosmological Constraints from Strong Gravitational Lensing in Clusters of Galaxies” In Science 329, 2010, pp. 924–927 DOI: 10.1126/science.1185759
- [101] S. Kamann, L. Wisotzki and M. M. Roth “Resolving stellar populations with crowded field 3D spectroscopy” In A&A 549, 2013, pp. A71 DOI: 10.1051/0004-6361/201220476
- [102] S. Kamann et al. “A stellar census in globular clusters with MUSE: The contribution of rotation to cluster dynamics studied with 200 000 stars” In MNRAS 473, 2018, pp. 5591–5616 DOI: 10.1093/mnras/stx2719
- [103] S. Kamann et al. “Cluster kinematics and stellar rotation in NGC 419 with MUSE and adaptive optics” In MNRAS 480, 2018, pp. 1689–1695 DOI: 10.1093/mnras/sty1958
- [104] C. Kehrig et al. “The Extended He II 4686-emitting Region in IZw 18 Unveiled: Clues for Peculiar Ionizing Sources” In ApJ 801, 2015, pp. L28 DOI: 10.1088/2041-8205/801/2/L28
- [105] V. Khaire and R. Srianand “New synthesis models of consistent extragalactic background light over cosmic time” In MNRAS 484, 2019, pp. 4174–4199 DOI: 10.1093/mnras/stz174
- [106] T. Kimm et al. “Understanding the escape of LyC and Ly photons from turbulent clouds” In MNRAS 486, 2019, pp. 2215–2237 DOI: 10.1093/mnras/stz989
- [107] J. Koda, M. Yagi, H. Yamanoi and Y. Komiyama “Approximately a Thousand Ultra-diffuse Galaxies in the Coma Cluster” In ApJ 807, 2015, pp. L2 DOI: 10.1088/2041-8205/807/1/L2
- [108] J. Koda et al. “The Universal Initial Mass Function in the Extended Ultraviolet Disk of M83” In ApJ 749, 2012, pp. 20 DOI: 10.1088/0004-637X/749/1/20
- [109] R. P. Kudritzki et al. “A Spectroscopic Study of Blue Supergiant Stars in the Sculptor Galaxy NGC 55: Chemical Evolution and Distance” In ApJ 829, 2016, pp. 70 DOI: 10.3847/0004-637X/829/2/70
- [110] R.-P. Kudritzki et al. “Quantitative Spectroscopy of Blue Supergiant Stars in the Disk of M81: Metallicity, Metallicity Gradient, and Distance” In ApJ 747, 2012, pp. 15 DOI: 10.1088/0004-637X/747/1/15
- [111] D. Kunth and G. Östlin “The most metal-poor galaxies” In A&A Rev. 10, 2000, pp. 1–79 DOI: 10.1007/s001590000005
- [112] D. J. Lagattuta et al. “Lens modelling Abell 370: crowning the final frontier field with MUSE” In MNRAS 469, 2017, pp. 3946–3964 DOI: 10.1093/mnras/stx1079
- [113] T.-W. Lan and H. Mo “The Circumgalactic Medium of eBOSS Emission Line Galaxies: Signatures of Galactic Outflows in Gas Distribution and Kinematics” In ApJ 866, 2018, pp. 36 DOI: 10.3847/1538-4357/aadc08
- [114] N. Langer “Presupernova Evolution of Massive Single and Binary Stars” In ARA&A 50, 2012, pp. 107–164 DOI: 10.1146/annurev-astro-081811-125534
- [115] A. M. C. Le Brun, I. G. McCarthy, J. Schaye and T. J. Ponman “Towards a realistic population of simulated galaxy groups and clusters” In MNRAS 441, 2014, pp. 1270–1290 DOI: 10.1093/mnras/stu608
- [116] F. Leclercq et al. “The MUSE Hubble Ultra Deep Field Survey. VIII. Extended Lyman- haloes around high-z star-forming galaxies” In A&A 608, 2017, pp. A8 DOI: 10.1051/0004-6361/201731480
- [117] E. Leitet et al. “Escape of Lyman continuum radiation from local galaxies. Detection of leakage from the young starburst Tol 1247-232” In A&A 553, 2013, pp. A106 DOI: 10.1051/0004-6361/201118370
- [118] G. Leloudas et al. “Spectroscopy of superluminous supernova host galaxies. A preference of hydrogen-poor events for extreme emission line galaxies” In MNRAS 449, 2015, pp. 917–932 DOI: 10.1093/mnras/stv320
- [119] T. S. Li et al. “Farthest Neighbor: The Distant Milky Way Satellite Eridanus II” In ApJ 838, 2017, pp. 8 DOI: 10.3847/1538-4357/aa6113
- [120] X.-W. Liu “Optical recombination lines as probes of conditions in planetary nebulae” In Planetary Nebulae in our Galaxy and Beyond 234, IAU Symposium, 2006, pp. 219–226 DOI: 10.1017/S1743921306003000
- [121] Nicolas Longeard et al. “Pristine dwarf galaxy survey - I. A detailed photometric and spectroscopic study of the very metal-poor Draco II satellite” In MNRAS 480.2, 2018, pp. 2609–2627 DOI: 10.1093/mnras/sty1986
- [122] S. Lopez et al. “A clumpy and anisotropic galaxy halo at redshift 1 from gravitational-arc tomography” In Nature 554, 2018, pp. 493–496 DOI: 10.1038/nature25436
- [123] E. Lusso et al. “The MUSE Ultra Deep Field (MUDF) - I. Discovery of a group of Ly nebulae associated with a bright z 3.23 quasar pair” In MNRAS 485.1, 2019, pp. L62–L67 DOI: 10.1093/mnrasl/slz032
- [124] Piero Madau and Mark Dickinson “Cosmic Star-Formation History” In ARA&A 52, 2014, pp. 415–486 DOI: 10.1146/annurev-astro-081811-125615
- [125] G. Mahler et al. “Strong-lensing analysis of A2744 with MUSE and Hubble Frontier Fields images” In MNRAS 473, 2018, pp. 663–692 DOI: 10.1093/mnras/stx1971
- [126] M. Mapelli et al. “Are ring galaxies the ancestors of giant low surface brightness galaxies?” In MNRAS 383, 2008, pp. 1223–1231 DOI: 10.1111/j.1365-2966.2007.12650.x
- [127] P. Marchant et al. “A new route towards merging massive black holes” In A&A 588, 2016, pp. A50 DOI: 10.1051/0004-6361/201628133
- [128] F. Marchi et al. “Ly-Lyman continuum connection in star-forming galaxies from the VUDS survey” In A&A 614, 2018, pp. A11 DOI: 10.1051/0004-6361/201732133
- [129] F. Marchi et al. “New constraints on the average escape fraction of Lyman continuum radiation in z 4 galaxies from the VIMOS Ultra Deep Survey (VUDS)” In A&A 601, 2017, pp. A73 DOI: 10.1051/0004-6361/201630054
- [130] C. Martin et al. “The Keck Cosmic Web Imager” In Ground-based and Airborne Instrumentation for Astronomy III 7735, Proc. SPIE, 2010, pp. 77350M DOI: 10.1117/12.858227
- [131] F. Martins “Quantitative spectral classification of Galactic O stars” In A&A 616, 2018, pp. A135 DOI: 10.1051/0004-6361/201833050
- [132] F. Martins et al. “The MiMeS survey of magnetism in massive stars: CNO surface abundances of Galactic O stars” In A&A 575, 2015, pp. A34 DOI: 10.1051/0004-6361/201425173
- [133] M. V. Maseda et al. “MUSE Spectroscopic Identifications of Ultra-faint Emission Line Galaxies with M” In ApJ 865, 2018, pp. L1 DOI: 10.3847/2041-8213/aade4b
- [134] M. V. Maseda et al. “The MUSE Hubble Ultra Deep Field Survey. IV. Global properties of C III] emitters” In A&A 608, 2017, pp. A4 DOI: 10.1051/0004-6361/201730985
- [135] P. Massey, K. F. Neugent and B. M. Smart “A Spectroscopic Survey of Massive Stars in M31 and M33” In AJ 152, 2016, pp. 62 DOI: 10.3847/0004-6256/152/3/62
- [136] Y. Matsuda et al. “Diffuse Ly haloes around Ly emitters at z=3: do dark matter distributions determine the Ly spatial extents?” In MNRAS 425, 2012, pp. 878–883 DOI: 10.1111/j.1365-2966.2012.21143.x
- [137] A. W. McConnachie “The Observed Properties of Dwarf Galaxies in and around the Local Group” In AJ 144, 2012, pp. 4 DOI: 10.1088/0004-6256/144/1/4
- [138] K. J. Meech et al. “Deep Impact, Stardust-NExT and the behavior of Comet 9P/Tempel 1 from 1997 to 2010” In Icarus 213, 2011, pp. 323–344 DOI: 10.1016/j.icarus.2011.02.016
- [139] A. Merritt, P. van Dokkum, R. Abraham and J. Zhang “The Dragonfly nearby Galaxies Survey. I. Substantial Variation in the Diffuse Stellar Halos around Spiral Galaxies” In ApJ 830, 2016, pp. 62 DOI: 10.3847/0004-637X/830/2/62
- [140] G. Meynet and A. Maeder “Stellar evolution with rotation. V. Changes in all the outputs of massive star models” In A&A 361, 2000, pp. 101–120 eprint: astro-ph/0006404
- [141] Genoveva Micheva et al. “IFU investigation of possible Lyman continuum escape from Mrk 71/NGC 2366” In A&A 623, 2019, pp. A145 DOI: 10.1051/0004-6361/201834838
- [142] J. C. Mihos et al. “Galaxies at the Extremes: Ultra-diffuse Galaxies in the Virgo Cluster” In ApJ 809, 2015, pp. L21 DOI: 10.1088/2041-8205/809/2/L21
- [143] P. D. Mitchell et al. “Gas flows in the circumgalactic medium around simulated high-redshift galaxies” In MNRAS 474, 2018, pp. 4279–4301 DOI: 10.1093/mnras/stx3017
- [144] R. Momose et al. “Diffuse Ly haloes around galaxies at z = 2.2-6.6: implications for galaxy formation and cosmic reionization” In MNRAS 442, 2014, pp. 110–120 DOI: 10.1093/mnras/stu825
- [145] L. Moore and Q. A. Parker “Malin 1: A Deeper Look” In PASA 23, 2006, pp. 165–169 DOI: 10.1071/AS06022
- [146] B. Moralejo et al. “The Potsdam MRS spectrograph: heritage of MUSE and the impact of cross-innovation in the process of technology transfer” In Advances in Optical and Mechanical Technologies for Telescopes and Instrumentation II 9912, Proc. SPIE, 2016, pp. 991222 DOI: 10.1117/12.2232539
- [147] Burçin Mutlu-Pakdil et al. “A Deeper Look at the New Milky Way Satellites: Sagittarius II, Reticulum II, Phoenix II, and Tucana III” In ApJ 863.1, 2018, pp. 25 DOI: 10.3847/1538-4357/aacd0e
- [148] K. Nandra et al. “The Hot and Energetic Universe: A White Paper presenting the science theme motivating the Athena+ mission” In arXiv e-prints, 2013 arXiv:1306.2307 [astro-ph.HE]
- [149] K. O’Neil and G. Bothun “The Space Density of Galaxies through B(0)=25.0 Magnitudes per Inverse Arcsecond Squared” In ApJ 529, 2000, pp. 811–815 DOI: 10.1086/308322
- [150] C. Opitom et al. “TRAPPIST monitoring of comet C/2012 F6 (Lemmon)” In A&A 574, 2015, pp. A38 DOI: 10.1051/0004-6361/201424582
- [151] G. Östlin et al. “The Ly Reference Sample. I. Survey Outline and First Results for Markarian 259” In ApJ 797, 2014, pp. 11 DOI: 10.1088/0004-637X/797/1/11
- [152] R. A. Overzier “The realm of the galaxy protoclusters. A review” In A&A Rev. 24, 2016, pp. 14 DOI: 10.1007/s00159-016-0100-3
- [153] M. Paalvast et al. “Properties and redshift evolution of star-forming galaxies with high [O III]/[O II] ratios with MUSE at 0.28 z 0.85” In A&A 618, 2018, pp. A40 DOI: 10.1051/0004-6361/201832866
- [154] P. Papaderos, N. G. Guseva, Y. I. Izotov and K. J. Fricke “Extremely metal-poor star-forming galaxies. New detections and general morphological and photometric properties” In A&A 491.1, 2008, pp. 113–129 DOI: 10.1051/0004-6361:200810028
- [155] V. Patrício et al. “A young star-forming galaxy at z = 3.5 with an extended Lyman halo seen with MUSE” In MNRAS 456, 2016, pp. 4191–4208 DOI: 10.1093/mnras/stv2859
- [156] A. Peimbert et al. “Physical conditions derived from O II recombination lines in planetary nebulae and their implications” In Rev. Mexicana Astron. Astrofis. 50, 2014, pp. 329–340 arXiv:1408.4835
- [157] C. Péroux et al. “Multiphase circumgalactic medium probed with MUSE and ALMA” In MNRAS 485, 2019, pp. 1595–1613 DOI: 10.1093/mnras/stz202
- [158] C. Péroux, H. Rahmani, F. Arrigoni Battaia and R. Augustin “Spatially resolved metal gas clouds” In MNRAS 479, 2018, pp. L50–L54 DOI: 10.1093/mnrasl/sly090
- [159] T. E. Pickering, C. D. Impey, J. H. van Gorkom and G. D. Bothun “Neutral Hydrogen Distributions and Kinematics of Giant Low Surface=20 Brightness Disk Galaxies” In AJ 114, 1997, pp. 1858 DOI: 10.1086/118611
- [160] B. M. Poggianti and G. Barbaro “Indicators of star formation: 4000 Å break and Balmer lines.” In A&A 325, 1997, pp. 1025–1030 eprint: astro-ph/9703067
- [161] N. Rahman et al. “Exploring Infrared Properties of Giant Low Surface Brightness Galaxies” In ApJ 663, 2007, pp. 908–923 DOI: 10.1086/518554
- [162] H. Rahmani et al. “Observational signatures of a warped disk associated with cold-flow accretion” In MNRAS 474, 2018, pp. 254–270 DOI: 10.1093/mnras/stx2726
- [163] J. Richard et al. “Mass and magnification maps for the Hubble Space Telescope Frontier Fields clusters: implications for high-redshift studies” In MNRAS 444, 2014, pp. 268–289 DOI: 10.1093/mnras/stu1395
- [164] J. Richard et al. “MUSE observations of the lensing cluster SMACSJ2031.8-4036: new constraints on the mass distribution in the cluster core” In MNRAS 446, 2015, pp. L16–L20 DOI: 10.1093/mnrasl/slu150
- [165] J. G. Rivero González, J. Puls, P. Massey and F. Najarro “Nitrogen line spectroscopy in O-stars. III. The earliest O-stars” In A&A 543, 2012, pp. A95 DOI: 10.1051/0004-6361/201218955
- [166] M. M. Roth et al. “MUSE crowded field 3D spectroscopy in NGC 300. I. First results from central fields” In A&A 618, 2018, pp. A3 DOI: 10.1051/0004-6361/201833007
- [167] J.-R. Roy and D. Kunth “Dispersal and mixing of oxygen in the interstellar medium of gas-rich galaxies” In A&A 294, 1995, pp. 432–442 eprint: astro-ph/9410023
- [168] Kate H. R. Rubin et al. “Galaxies Probing Galaxies in PRIMUS. II. The Coherence Scale of the Cool Circumgalactic Medium” In ApJ 868.2, 2018, pp. 142 DOI: 10.3847/1538-4357/aad566
- [169] Kate H. R. Rubin et al. “Low-ionization Line Emission from a Starburst Galaxy: A New Probe of a Galactic-scale Outflow” In ApJ 728.1, 2011, pp. 55 DOI: 10.1088/0004-637X/728/1/55
- [170] P. Senchyna et al. “Ultraviolet spectra of extreme nearby star-forming regions - approaching a local reference sample for JWST” In MNRAS 472, 2017, pp. 2608–2632 DOI: 10.1093/mnras/stx2059
- [171] A. E. Shapley et al. “Q1549-C25: A Clean Source of Lyman-Continuum Emission at z = 3.15” In ApJ 826, 2016, pp. L24 DOI: 10.3847/2041-8205/826/2/L24
- [172] B. Sharpee, J. A. Baldwin and R. Williams “Identification and Characterization of Faint Emission Lines in the Spectrum of the Planetary Nebula IC 418” In ApJ 615, 2004, pp. 323–343 DOI: 10.1086/424035
- [173] R. S. Somerville and R. Davé “Physical Models of Galaxy Formation in a Cosmological Framework” In ARA&A 53, 2015, pp. 51–113 DOI: 10.1146/annurev-astro-082812-140951
- [174] C. C. Steidel et al. “The Keck Lyman Continuum Spectroscopic Survey (KLCS): The Emergent Ionizing Spectrum of Galaxies at ” In ApJ 869, 2018, pp. 123 DOI: 10.3847/1538-4357/aaed28
- [175] Peter B. Stetson “DAOPHOT: A Computer Program for Crowded-Field Stellar Photometry” In PASP 99, 1987, pp. 191 DOI: 10.1086/131977
- [176] V. Strazzullo et al. “Galaxy Evolution in Overdense Environments at High Redshift: Passive Early-type Galaxies in a Cluster at z ~ 2” In ApJ 772, 2013, pp. 118 DOI: 10.1088/0004-637X/772/2/118
- [177] D. A. Thilker et al. “A Search for Extended Ultraviolet Disk (XUV-Disk) Galaxies in the Local Universe” In ApJS 173, 2007, pp. 538–571 DOI: 10.1086/523853
- [178] E. Toloba et al. “Formation and evolution of dwarf early-type galaxies in the Virgo cluster. I. Internal kinematics” In A&A 526, 2011, pp. A114 DOI: 10.1051/0004-6361/201015344
- [179] M. Trebitsch et al. “Fluctuating feedback-regulated escape fraction of ionizing radiation in low-mass, high-redshift galaxies” In MNRAS 470, 2017, pp. 224–239 DOI: 10.1093/mnras/stx1060
- [180] Y. G. Tsamis et al. “Heavy elements in Galactic and Magellanic Cloud HII regions: recombination-line versus forbidden-line abundances” In MNRAS 338, 2003, pp. 687–710 DOI: 10.1046/j.1365-8711.2003.06081.x
- [181] Y. G. Tsamis et al. “Integral field spectroscopy of planetary nebulae: mapping the line diagnostics and hydrogen-poor zones with VLT FLAMES” In MNRAS 386, 2008, pp. 22–46 DOI: 10.1111/j.1365-2966.2008.13051.x
- [182] T. Urrutia et al. “The MUSE-Wide Survey: survey description and first data release” In A&A 624, 2019, pp. A141 DOI: 10.1051/0004-6361/201834656
- [183] F. Valentino et al. “A Giant Ly Nebula in the Core of an X-Ray Cluster at Z = 1.99: Implications for Early Energy Injection” In ApJ 829, 2016, pp. 53 DOI: 10.3847/0004-637X/829/1/53
- [184] F. Valentino et al. “Metal Deficiency in Cluster Star-Forming Galaxies At Z = 2” In ApJ 801, 2015, pp. 132 DOI: 10.1088/0004-637X/801/2/132
- [185] P. van Dokkum et al. “A galaxy lacking dark matter” In Nature 555, 2018, pp. 629–632 DOI: 10.1038/nature25767
- [186] P. van Dokkum et al. “A High Stellar Velocity Dispersion and 100 Globular Clusters for the Ultra-diffuse Galaxy Dragonfly 44” In ApJ 828, 2016, pp. L6 DOI: 10.3847/2041-8205/828/1/L6
- [187] E. Vanzella et al. “Direct Lyman continuum and Ly escape observed at redshift 4” In MNRAS 476, 2018, pp. L15–L19 DOI: 10.1093/mnrasl/sly023
- [188] E. Vanzella et al. “Hubble Imaging of the Ionizing Radiation from a Star-forming Galaxy at Z=3.2 with fesc50%” In ApJ 825, 2016, pp. 41 DOI: 10.3847/0004-637X/825/1/41
- [189] C. M. Vaughan, D. M. Pierce and A. L. Cochran “Jet Morphology and Coma Analysis of Comet 103P/Hartley 2” In AJ 154, 2017, pp. 219 DOI: 10.3847/1538-3881/aa9382
- [190] E. Ventou et al. “The MUSE Hubble Ultra Deep Field Survey. IX. Evolution of galaxy merger fraction since ” In A&A 608, 2017, pp. A9 DOI: 10.1051/0004-6361/201731586
- [191] A. Verhamme et al. “Lyman- spectral properties of five newly discovered Lyman continuum emitters” In A&A 597, 2017, pp. A13 DOI: 10.1051/0004-6361/201629264
- [192] A. Verhamme, I. Orlitová, D. Schaerer and M. Hayes “Using Lyman- to detect galaxies that leak Lyman continuum” In A&A 578, 2015, pp. A7 DOI: 10.1051/0004-6361/201423978
- [193] M. Villar-Martín et al. “Kinematically quiet haloes around z~ 2.5 radio galaxies. Keck spectroscopy” In MNRAS 346, 2003, pp. 273–294 DOI: 10.1046/j.1365-2966.2003.07090.x
- [194] J. S. Vink “Very massive stars: a metallicity-dependent upper-mass limit, slow winds, and the self-enrichment of globular clusters” In A&A 615, 2018, pp. A119 DOI: 10.1051/0004-6361/201832773
- [195] N. R. Walborn and E. L. Fitzpatrick “Contemporary optical spectral classification of the OB stars - A digital atlas” In PASP 102, 1990, pp. 379–411 DOI: 10.1086/132646
- [196] J. R. Walsh et al. “An imaging spectroscopic survey of the planetary nebula NGC 7009 with MUSE” In A&A 620, 2018, pp. A169 DOI: 10.1051/0004-6361/201833445
- [197] T. Wang et al. “Discovery of a Galaxy Cluster with a Violently Starbursting Core at z = 2.506” In ApJ 828, 2016, pp. 56 DOI: 10.3847/0004-637X/828/1/56
- [198] M. Wendt et al. “Mapping diffuse interstellar bands in the local ISM on small scales via MUSE 3D spectroscopy. A pilot study based on globular cluster NGC 6397” In A&A 607, 2017, pp. A133 DOI: 10.1051/0004-6361/201629816
- [199] J. H. Wise et al. “The birth of a galaxy - III. Propelling reionization with the faintest galaxies” In MNRAS 442, 2014, pp. 2560–2579 DOI: 10.1093/mnras/stu979
- [200] L. Wisotzki et al. “Extended Lyman haloes around individual high-redshift galaxies revealed by MUSE” In A&A 587, 2016, pp. A98 DOI: 10.1051/0004-6361/201527384
- [201] L. Wisotzki et al. “Nearly all the sky is covered by Lyman- emission around high-redshift galaxies” In Nature 562, 2018, pp. 229–232 DOI: 10.1038/s41586-018-0564-6
- [202] R. Xue et al. “The Diversity of Diffuse Ly Nebulae around Star-forming Galaxies at High Redshift” In ApJ 837, 2017, pp. 172 DOI: 10.3847/1538-4357/837/2/172
- [203] M. Yagi et al. “A Dozen New Galaxies Caught in the Act: Gas Stripping and Extended Emission Line Regions in the Coma Cluster” In AJ 140, 2010, pp. 1814–1829 DOI: 10.1088/0004-6256/140/6/1814
- [204] H. Yang, S. Malhotra, J. E. Rhoads and J. Wang “Blueberry Galaxies: The Lowest Mass Young Starbursts” In ApJ 847, 2017, pp. 38 DOI: 10.3847/1538-4357/aa8809
- [205] J. Zastrow, M. S. Oey, S. Veilleux and M. McDonald “New Constraints on the Escape of Ionizing Photons from Starburst Galaxies Using Ionization-parameter Mapping” In ApJ 779, 2013, pp. 76 DOI: 10.1088/0004-637X/779/1/76