Vibrational fingerprintings for chemical recognition of biominerals
Abstract
Pathologies associated with calcified tissue, such as osteoporosis, demand in vivo and/or in situ spectroscopic analysis to assess the role of chemical substitutions in the inorganic component. High energy X-ray or NMR spectroscopies are often impractical or damaging in biomedical conditions. Low energy spectroscopies, such as IR and Raman techniques, are often the best alternative. In apatite biominerals, the vibrational signatures of the phosphate group are generally used as fingerprint of the materials although they provide only limited information. Here, we have used first principles calculations to unravel the complexity of the complete vibrational spectra of apatites. We determined the spectroscopic features of all the phonon modes of fluor-apatite, hydroxy-apatite, and carbonated fluoroapatite beyond the analysis of the phosphate groups, focusing on the effect of local corrections induced by the crystalline environment and the specific mineral composition. This provides a clear and unique reference to discriminate structural and chemical variations in biominerals, opening the way to a widespread application of non-invasive spectroscopies for in vivo diagnostics, and biomedical analysis.
INTRODUCTION
Calcium orthophosphates form the main inorganic component of normal and pathological calcified tissues in vertebrates Dorozhkin (2009). Apatites (general formula Ca5(PO4)3X with X = F, Cl, OH), with various degrees of substitutions and defects, contribute 60-70 to human bones and are of great importance in widespread diseases such as cancer Iafisco et al. (2013), osteoporosis Faibish et al. (2006); Landi et al. (2007) and craniosynostosis Al-Rekabi et al. (2017). Most of calcium orthophosphates are biocompatible and plays critical roles in biomineralzation processes. For instance, apatite bioceramics are used in regenerative medicine as bone repair and augmentation, as bone cements, as coatings for bio-inert prostheses, and for bone scaffolding. Landi et al. (2000); Rosin-Grget and Lincir (2001); Arinzeh et al. (2004); LeGeros (2008) Calcium orthophosphates are also commonly found in the Earth crust and are considered one of the most abundant sources of phosphorous in the marine environment Tribble et al. (1995) and are relevant in the geophysics of pegmatite melts Sirbescu et al. (2009), especially for their ability to readily accept substitution(s) from a large variety of ions. For the same reason, they are attractive for nuclear waste management and water remediation Zheng et al. (2007); Wellman et al. (2008). Very recently, calcium orthophosphates have been recognized also in plant leaves, opening brand new scenarios on the role of carbonate biominerals in replacing the common plant biomineral silica Ensikat et al. (2016); Weigend et al. (2018).
The functional bio-properties of apatites rely heavily on the shape of the nanocrystals Stifler et al. (2018) which, in turn, depends on the specific composition. For instance, the fluorine rich apatite platelets in teeth are neddle-like Marcus et al. (2017) whereas the spheroidal nano-crystals in bones are mainly carbonated hydroxy-apatites Lotsari et al. (2018). Therapeutic treatments for osteoporosis, such as fluorine therapy, aim to influence the chemical composition of the mineral component of bones in order to improve the mechanical properties that result from the morphology and the size of the apatite crystals dispersed in the collagen matrix Faibish et al. (2006); Nudelman et al. (2010). More generally, clinical applications require standardized protocols for biomaterials recognition, that, to date, have not been analytically defined, since the characterization of the physicochemical properties of biogenic minerals is far from being completed.
Many experimental techniques have been used to inspect the subtle structural changes associated with the specific chemical composition in apatites. X-ray spectroscopies (such as XPS photoemission Suchaneka et al. (2004); Elkabouss et al. (2004); Ohtsu et al. (2013); Stifler et al. (2018) and NEXAFS absorption Kruse et al. (2009); Nakata et al. (2009); Kashiwabara et al. (2014) spectra) or NMR Pan and Fleet (2002); Panda et al. (2003); Hu et al. (2010); Pavan et al. (2012) result to be very efficient in this regards, being able to relate single spectral features to both atomic structure and chemical composition. As illustrative example, we included in the Supplementary Information (SI) simulated the X-ray core level photoemission spectra of the O1s level relative to three prototypical apatite structures, which differ in the chemical composition (see also Figure 1). The resulting shifts of the core level binding energies clearly pinpoint to the different local chemical environment induced by the specific atomic substitution (e.g. fluorine with hydroxyl or a phosphate with a carbonate unit). Nonetheless, such analysis requires high-cost instrumentations usually available in dedicated facilities (e.g. synchrotron radiation lines) and works in conditions (e.g. ultra high vacuum, high-energy radiations, controlled temperature) that make their use unsuitable for clinical and biomedical applications. Low-energy vibrational techniques (e.g. IR, and Raman) are often desired due to their non-invasive non-destructive character which is suitable for in vivo and/or in situ analysis. In those case, an overall map of the vibrational spectra is essential to fingerprint the structural and chemical effects of biominerals. Unfortunately, such structural and chemical features are much more difficult to identify in vibrational spectroscopies (compared to X-ray ones) as they cause complex modifications of the spectra (e.g. degeneracy breaking, structured multipeaks, and intensity changes of the active modes) that are not easy to disentangle. First principles calculations, having a direct access to structural, electronic, and vibrational properties of materials, clarify the subtle interplay between chemical composition and optical spectra; in turn they helps to understand chemistry-morphology relationships in biominerals.
So far, the standard approach to inspect apatites with vibrational spectroscopies was the recognition, within the entire spectra, of the four characteristic vibrational modes of the phosphate subunits. In apatites, the phosphate groups are stabilized as orthophophate anions PO (i.e. fully deprotonated form), electrostatically compensated by the surrounding Ca2+ cations. However, due to its high reactivity, there are no vibrational spectra available in the literature for the isolated monophophate in the gas phase, and such measurements are usually performed in water solution. Despite the profuse efforts Schulze et al. (1973); Mason et al. (2003); Chapman and Thirlwell (1964); Preston and Adams (1979); Cherif et al. (2000); Rudolph (2010); Syed et al. (2012, 2013), the characterization of the vibrational modes of orthophosphate anion in aqueous solution is per se a huge challenge, since PO is strongly hydrated and the ionic equilibrium with the intermediate hydrogenated phases (HPO and H2PO) is complicated. This caused an unsolved variability concerning the frequency position of the fundamental modes, the depolarization degree, and the appearance/disappearance of extra modes not due to the symmetry breaking in the PO ion. Furthermore, since orthophophate anions are common to every apatite structure, it is evident that the simple detection of the PO modes can not be sufficient to distinguish the composition variety in the apatite class.
In this paper, using ab initio theoretical methods, we first investigate the effects of the solvent on the vibrational properties of PO, then we illustrate the dependence of the vibrational modes of the phosphate group in fluor-apatite, hydroxy-apatite, and carbonated fluor-apatite crystals. We also discuss features of the vibrational spectrum associated with crystalline effects and chemical composition. Our results point clearly to the effect of the local environment on the overall vibrational properties of the system, providing a set of representative vibrational markers univocally associated to microscopic nature of each crystal. This provides a quantitative reference for experiments to improve the current understanding in investigative and therapeutic studies of calcified tissues. More generally, the systematic identification of such chemical fingerprints is a mandatory step towards the standardization of clinical protocols.
RESULTS AND DISCUSSION
Phosphate’s vibrational modes
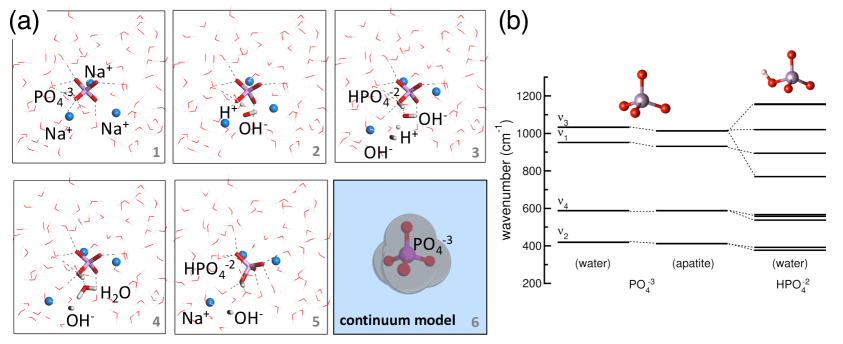
The PO ion has a tetrahedral symmetry and nine vibrational modes corresponding to the representation ; the four different frequencies are labelled , , , and . The non-degenerate frequency corresponds to the symmetric P-O stretching (A1 symmetry), corresponds to the doubly degenerate O-P-O bending mode (E symmetry); frequency arises from the triply degenerate T2 mode involving the asymmetric P-O stretching and also P motion. The mode (T2 symmetry) is associated to the triple degenerate asymmetric O-P-O bending. All the modes are Raman active, while only and are infrared active. When the orthophosphates are in aqueous solution to form HPO and H2PO ions the symmetry is reduced to and , respectively. This implies the progressive split of the degenerate vibrations, the shift of the non-degenerate ones and activation of the previously infrared-forbidden modes and . The coordination with the water molecules of the solution and the formation of H-bonds changes the charge distribution within the phosphate ions, further affecting the vibrational spectrum of the PO ion Klähn et al. (2004); Ebner et al. (2005).
The first step for the simulation of the (harmonic) vibrational properties is the identification of an equilibrium structure. Due to the high charge unbalance, the ideal orthophosphate structure in vacuum is electronically not stable. Thus, following experimental indications, we simulated the stability and the vibrational properties of PO ion in water solution. Panel 1 of Figure LABEL:(a) shows the initial atomic configuration of the solvated PO ion within the ESM. The simulation cell includes the orthophophate ion and a box of water molecules that entirely hosts the first hydration shell (16 H2O molecules) Ebner et al. (2005). The anion charge is neutralized by three Na+ counterions Preston and Adams (1979); Klähn et al. (2004). During the total-energy-and-force optimization ( i.e. no thermal effects) the system undergoes a sequence of protonation/deprotonation reactions that changes the final charge state of phosphate. Initially (panel 2), one water molecule close to the phosphate group spontaneously dissociates (H2O H++OH-). Then (panel 3), the released proton is captured by PO that transforms into HPO. At the same time a second water molecule dissociates. Panels 4 and 5 show a progressive proton transfer that moves the remaining hydroxide molecule far away from the phosphate group and closer to a Na+ counterion. This relaxation process demonstrates that the fully deprotonated state is not stable at neutral pH, in agreement with the experiments that adopted basic conditions (pH13) Schulze et al. (1973); Mason et al. (2003) to stabilize the orthophosphate anion.
In order to overcome this problem, we optimized the orthophosphate ion within an implicit CSM which reproduces the dielectric response of the solvent (panel 6). The vibrational frequencies of the corresponding ground state structure are summarized in Figure2(b) and Table 1. Our results reproduce the four bands () of PO, with the correct degeneracies derived by the symmetry analysis. The computed frequencies are in quantitative agreement with the experimental IR and Raman measurements Schulze et al. (1973); Preston and Adams (1979). In order to estimate the effect of the environment (i.e. water solvent vs apatite crystal) and of the hydration state we calculated the vibrational properties of PO in a medium reproducing the dielectric properties of apatite (=2.4) as well as the vibrational modes of HPO in aqueous solvent. The modification of the embedding polarization medium does not substantially affect the vibrational modes of orthophosphate, allowing us a direct comparison with apatite structures (see below), while the change of charge state ( i.e. hydration) imparts the splitting and shifting of the original vibrational bands expected by the symmetry analysis discussed above. Notably, in the case of HPO one negative frequency, associated to OH displacement, results from dynamical matrix diagonalization. We accurately checked that the negative frequency is not an artefact or a limit of the simulation process, but rather it is the expression of a structural instability, associated to a saddle point of the total-energy surface. In other terms, this reproduces the tendency of the OH termination of moving in space, being dynamically polarized by the environment ( e.g. the surrounding water molecules). A similar behavior has been reported in the case of the theoretical analysis of hydroxyapatite Corno et al. (2006).
Structural features of apatites
Apatite is a family of molecular crystals [M5(PO4)3X]2 that occur in nature in several crystalline phases ( e.g. hexagonal, monoclinic) and several compositions (M=Ca2+, Sr2+; X=OH-, F-, Cl-, Br-). Isolated orthophosphate groups (PO) symmetrically arranged with respect to a mirror glide plane, corresponding to an ideal P63/m space group (n. 176, see Figure S1 in SI), are a typical feature of apatite crystals. Most of the experimental and theoretical spectroscopic investigations on apatite focused mostly on the phosphate group. The other elements that compose the mineral or the presence of substituents and impurities received limited attention although their are essential to distinguish different apatites.
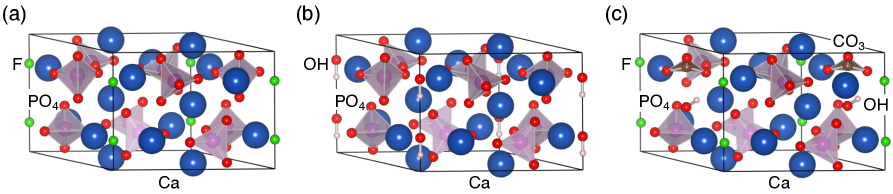
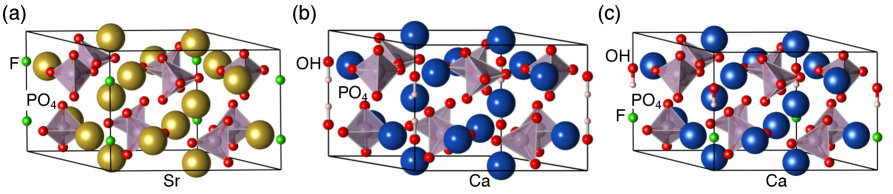
In order to highlight subtleties beyond the phosphate group, we focus on three calcium structures, namely fluor-apatite (FAp), hydroxy-apatite (HAP), and carbonated fluor-apatite (CFAp) in their hexagonal crystalline phase. The three crystal structures are shown in Figure 1. Each system includes two [Ca5(PO4)3X] (X=F,OH) units symmetrically distributed on two parallel planes (labeled a-plane in Figure S1 of SI). Two inequivalent sets of Ca atoms forms either a columnar Ca-wires parallel to c-axis, or or two triangles lying on two planes perpendicular to the c-axis, which form Ca-channels that host the non-metal X species (Figure S1). Florine atoms (FAp, CFAp) also lie on the a-plane, while OH- ions in HAp are aligned head-to-tail with the c-axis. In the case of CFAp, one phosphate unit is substituted by a carbonate (CO) group plus one OH- (Figure 1c) to maintain the charge neutrality of the crystal. Ground-state atomic relaxation has been reached without imposing any symmetry constrain. A summary of the resulting ground-state electronic properties is reported in SI. Lattice parameters and internal coordinates have been fully optimized, the resulting lattice constants are a0=9.51 Å, c= 6.98 Å; a0=9.42 Å, c= 6.88 Å and a0=9.52 Å, c= 6.92 Å for FAp, HAp and CFAp, respectively, in excellent agreement with experimental (Neutron scattering and X-ray) results Saenger and Kuhs (1992); Fleet and Pan (1995) and previous DFT calculations Rulis et al. (2004); Corno et al. (2006). The optimized FAp geometry is very close to the experimental one Sudarsan et al. (1972) and converges to a highly symmetric structure associated to the point group. The inclusion of hydroxyl and carbonate units increases the atomic disorder within the unit cell and distorts the ideal tetrahedrical ( symmetry) of the phosphate group, giving as a results an overall reduction of the symmetry of the HAp and CFAp crystals. In particular, the aligned hydroxyl groups in HAp breaks the mirror operation with respect to the glide plane, reducing the symmetry to . The inclusion of the CO3 and OH fragments in CFAp cancels all symmetry operations except identity ( point group).
Orthophosphate’s vibrations in apatites
The phosphate group occurs in all apatites as fully protonated tetrahedral anion, the presence of the other chemical species in the mineral such as Ca, F, OH, or CO3, determines the symmetry of the whole crystal and influences the functional properties. FAp has 42 atoms per cell corresponding to 126 phonon modes that can be classified according to the symmetry as: Ag, Au, 1Eg, 1Eu, 2Eg, and 2Eu; acoustic modes are given by the representation =Au+1Eu+2Eu, the remaining ungerade modes are IR active and the gerade modes are Raman active. HAp has 132 independent phonon modes classified by symmetry as: A, B, 1E1, 1E2, 2E1, 2E2. Representation =Au+1E1+2E1 describes the acoustic modes. Modes A, 1E1, 2E1 are IR active, all modes except B are Raman active. Finally, CFAp has 43 atoms per cell and 129 A phonon modes ( symmetry), three of which are acoustic, all the others are IR and Raman active.
While most previous experimental and theoretical reports restrict their study to the Brillouin zone center () phonons, we provided a full characterization of the dielectric ( e.g. dielectric tensor, Born charges, Raman tensor) Calzolari and Buongiorno Nardelli (2013) and vibrational ( e.g. phonon dispersion and phonon density of states) properties of the selected FAp, HAp, and CFAp apatites. Results are summarized in SI. As observed for HPO case, one negative frequency constantly appears when OH fragments are included in the crystal (namely, HAp and CFAp), which is an indication of the instability of OH bond orientation due to the polar environment Corno et al. (2006). The phonon branches of all systems (Figure S4, SI) are characterized by five main manifolds: one low energy branch ( cm-1) involves contributions from all chemical species, and four bands in the range cm-1 associated to the stretching and bending vibrations of phosphate group. Carbonate group has characteristics optical modes at 818 and 1533 and 1553 cm-1. Hydroxy substituents in HAp and CFAp have also characteristics optical modes in the frequency range cm-1. In the case of HAp, and CFAp, high frequency modes ( 3800 cm-1) associated to asymmetric OH stretching are also detected. The latter OH frequencies are blue-shifted with respect to the experimental values ( 3570 cm-1) Tsuda and Arends (1994); Rehman and Bonfield (1997); Cuscó et al. (1998), since anharmonic corrections are not included in the simulations.
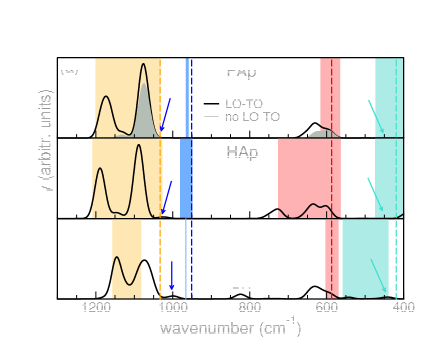
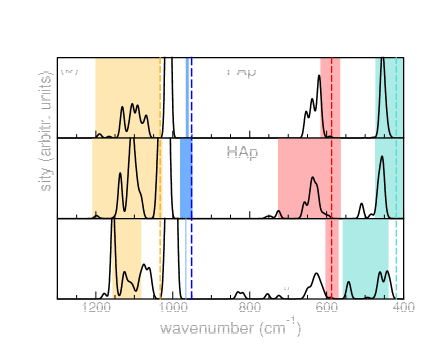
Starting from the vibrational and dielectric properties we simulated the IR and Raman spectra of the selected apatites (Figures 3). Polarized Raman spectra along with the table with polarization selection rules for backscatteing geometries are reported in Figure S5 of SI.
Here, we focus on the frequency range cm-1, which corresponds to the phosphate bands; lower energy modes cm-1 will be discussed in the next Section. The crystalline field induces distortions in the PO tetrahedra that change the internal bond lengths and angles, and misaligns their orientation with respect to the ideal symmetry planes, giving rise to shifts and splittings of the ideal PO normal modes. Consequently, the resulting internal PO vibrational bands depend on the actual crystallographic structure of each compound. The latter is responsible for the huge variability in the definition of the phosphate vibrations and in the assignment of the single PO modes from the experiments. The presence of unintentional HPO impurities Cuscó et al. (1998), which implicitly involves a redistribution of the vibrational frequencies (see above), further complicates this analysis.
Table 2 summarizes the present theoretical results and a few experimental data from IR and Raman measurements. The comparison with the experiments makes evident a remarkable variation, not only for different apatites, but also within the same composition. The total range of variability for each PO mode and for each apatite is displayed for comparison as colored vertical bar in Figure 3.
Despite such variations, the theoretical IR and Raman spectra are in general good agreement with the experimental measurements on fluoro- Leroy et al. (2000); Klee (1970); Klee and Engel (1970) hydroxy- Penel et al. (1997); Baddiel and Berry (1966); Wei et al. (2003) and carbonated-fluoro-apatites Antonakos et al. (2007), well reproducing the energy position of the peaks and the their relative intensity relations ( i.e. the shape of the spectra reproduces the experiments). In particular, it is easy to distinguish for each apatite the same set of four bands associated to the phosphate vibrations. The theoretical results are slightly blue-shifted with respect to the experimental ones, especially for higher frequency bands and . This is a recurring behavior in ab initio phonon calculations, reported also in previous -point simulation for HAp crystal Corno et al. (2006). In agreement with experiments Leroy et al. (2000); Wei et al. (2003); Antonakos et al. (2007), the modes and are hardly detectable in IR spectra (see arrows in panel a). This is reminiscent of the IR-inactive nature of the corresponding modes in the ideal PO anion. However, the structural disorder weakens this selection rule although the IR intensity remains very low. With respect to the single molecule calculation (vertical dashed line in Figure 3), both IR and Raman spectra show the expected broadening and shifting of the PO modes, in agreement with the above discussion. The analysis of the polarized Raman spectra (Figure S5, SI) allows also to assign the symmetry of the mode to Raman peaks. For example, it results that for FAp, the peak has a Ag character, while the band is a combination of two Ag and three Eg modes, in agreement with microRaman polarized experiments Leroy et al. (2000).
Beyond the phosphate’s modes
The identification of the phosphate modes, albeit important in the apatite recognition, is not sufficient to explain the complexity of vibrational spectra of these minerals. For instance, the long-range Coulomb interaction associated to the internal polar character of apatites leads to a net LO-TO splitting to several phonon bands (Figure S4, SI). These contributions have an important effect also on the vibrational spectra, as explicitly demonstrated in Figure 3a for the FAp case (gray area), and are responsible, e.g., for the double-peaked shape of the band, which is a distinctive characteristics of the IR spectra Leroy et al. (2000). This feature cannot be justified on the basis of the PO vibrations, without taking into account the solid-state effects that result from the the overall components of the crystal. Furthermore, since the PO anion are common to all apatite systems, their characterization is not useful to discriminate apatite with different composition. As such, the phosphate vibrational modes cannot be exploited to identify the different spectral features of HAp and CFAp in the range cm-1, which are associated to the hydroxy and carbonate units (Figure 3).
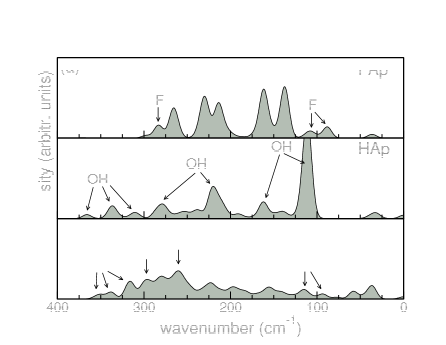
One alternative route to inspect the composition of apatite mineral is the analysis of the low frequency modes ( cm-1), often known as lattice modes since they stem from the rotational modes of the PO groups along with the translational modes of the Ca2+, and PO sublattices and non-metal elements (F-, OH-, CO, OH-). A part from the obvious three acoustic modes, all other modes in this range are generally complex and involve the displacement of all chemical species, clearly seen in the atom-projected phonon density of states shown in Figure S4 of SI. However, some characteristic phonons associated to single (not phosphate) elements can be easily pinpointed. On the experimental side, lattice modes were traditionally difficult to detect, and most papers published between ’60s and ’80s did not consider this frequency range. Nowadays, the improvements in IR and Raman techniques allow for a direct investigation of these spectral features Leroy et al. (2000); Cuscó et al. (1998).
From top to bottom panel, Figure 4(a) shows the Raman spectra relative to the lattice modes of FAp, HAp, and CFAp, respectively. First of all, we observe that, at odds with Figure 3 where all spectra had in common the same four-folded band structure, the lattice modes have unique spectral features depending on the composition. The lower is the symmetry of the crystal the broader is the spectrum. Calcium, because of its larger mass, contributes to the majority of peaks in the range. However, since calcium is common to the three structures, Ca-derived phonons are not useful to discriminate the three type of apatite. On the contrary, F and OH have specific features that can be isolated and used to fingerprint the chemical composition. In fluoroapatite, F has characteristic peaks at 86, 107 and 282 cm-1 (top panel). The same features are present at the same frequency also in CFAp, while are absent in hydroxapatite. In a similar way, HAp and CFAp spectra have the same three-peaked structure in the range 309-364 cm-1 associated to OH librational modes in agreement with experimental results (335 cm-1) Cuscó et al. (1998). However, since in HAp and CFAp the number and the symmetry of OH ions are different, we also identify specific OH-derived peaks in the two spectra which account for the different local environment. Atomic contribution are proved by the graphical inspection of the single phonon modes and the simulation of Raman spectra with isotopic 16O/18O and 19F/18F substitutions (Figure S6, SI). This proves that the Raman spectroscopy in the low-frequency region is a very powerful tool for the fine detection of the apatite structure and composition.
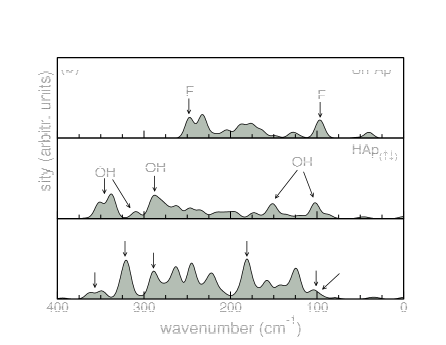
In order to further prove this statement, we considered three alternative apatite crystals that have been experimentally studied, namely Sr-fluoroapatite (SrFAp), antiparallel hydroxyapatite (HAp↑↓) and hydroxy-fluoroapatite (HFAp), whose atomic structures are shown in Figure 5. SrFAp is obtained from FAp upon strontium substitution of Ca atoms. The larger radius of Sr with respect to Ca causes an enlargement of the lattice parameters (a0=10.05Å, c=7.13Å) while the symmetry of the relaxed crystal () is maintained. HAp(↑↓) differs from HAp for the spatial distribution of the OH ions that are parallel aligned (i.e. head-to-tail) in HAp and antiparallel aligned (i.e. tail-to-tail) in HAp. The inversion of one OH ion increases the symmetry of the crystal (now ), due to the inversion operation with respect to the glide plane. On the contrary, the substitution of one F with an OH ion in HFAp breaks the internal symmetry of the crystal that reduces to C1 point group. By comparison with the three reference cases described above, these three examples helps in understanding: (i) the effect of Ca ion, (ii) the effect of order and alignment in hydroxyapatites, and (iii) the effect of having mixed F and OH element in the central Ca ion channels. The polarized micro-Raman spectra are summarized in Figure S7 of SI.
The high frequency Raman spectra of SrFAp, HAp(↑↓), and HFAp are in agreement with the phosphate analysis discussed above, the low energy spectra are shown in Figure 4(b). The larger mass of Sr with respect to Ca induces an overall shrinking and a red-shift of the spectrum (top panel). Two characteristic F peaks similar to FAp, can be easily identified. The spatial inversion of one OH unit in hydroxyapatites (from HAp to HAp) mostly affects the high-intensity peak of HAp at 109 cm-1, associated to vertical OH-OH vibrational mode, which becomes strongly quenched in HAp↑↓. The identification of this spectra features would allow to get information not only on the composition of the mineral (i.e. the presence of OH ions), but also on their local spatial distribution. Finally the coexistence of both F and OH in the central Ca-channel shows the main fingerprints of the separate systems: F-derived peak at 96 and 287 cm-1 and OH-derived peaks at 102 and 302 cm-1. Furthermore, new distinctive F-OH features now appear at 180 and 319 cm-1, not observed in the other structures.
In summary, selected features in the IR and Raman spectra of calcium orthophosphates have been used extensively to characterize the chemical composition of biomininerals and analyze the interplay between chemistry, crystals nanoscale morphologies, and biological functions. The value of such spectroscopic techniques for in vivo and/or in situ analysis is unquestionable, especially in the research regarding calcified tissue deterioration. Other techniques, such as X-ray photoemission, may easily provide interpretation but are not generally applicable to monitor chemical changes, for instance, during fluorination. We have shown that theoretical spectroscopies provide a solid tool to quantitatively fingerprint spectra and extract information until now mostly ignored. Our results point to the crucial contribution of the solvent in analyzing spectra of phosphate ions, show how phosphate modes are affected by surrounding ions, and present strategies to quantitatively detect the chemical composition of apatites by analyzing the full vibrational spectrum. The synergy between first principles vibrational spectroscopies and experiments could facilitate the study of normal or pathological calcified tissues.
METHODS
Total-energy-and-forces optimization where carried out within the density functional theory (DFT) framework, as implemented in the Quantum Espresso Giannozzi et al. (2017) (QE) suite of codes. The exchange-correlation functional is described by using the vdW-DF2-B86R Thonhauser et al. (2015); Langreth et al. (2009) formulation of generalized gradient approximation. The use of vdW-DF corrections to describe non-bonding interactions was essential to stabilize the structure and lead to quantitatively agreement with available experimental data in apatites. Ultrasoft pseudopotentials Vanderbilt (1990) are used to treat the ionic potentials. Semicore 3s3p electrons of Ca are explicitly accounted in the valence shell. Single particle Khon-Sham orbitals (charge densities) are expanded in plane waves up to a kinetic energy cutoff of 40.0 Ry (800.0 Ry), respectively. A uniform (4 4 6) k-point grid is used for summations over the Brillouin zone. The convergence thresholds for the geometrical optimizations are set to Ry for the total energy and Ry/au for the forces.
Underestimation of the band gap with the standard DFT functionals is corrected by including a Hubbard-like potential on each chemical species, within the DFT+U frameworks along the lines described, e.g., in Refs. 60; 61. The optimized values for the studied compounds are obtained by means of the pseudohybrid Hubbard Density Functional approach (namely ACBN0) Agapito et al. (2015) and summarized in the SI (Tab. S1). The effects of the ACBN0 approach on the structural, electronic and vibrational properties of inorganic semiconductors have been largely tested in previous reports (see e.g. Refs. 45; 63; 64).
The phonon eigenvalues and eigenvectors are computed starting from the ab initio calculation of the interatomic force matrices obtained with a finite-differences/finite-fields approach Calzolari and Buongiorno Nardelli (2013), also implemented in the QE suite, that has been demonstrated to be computationally very efficient in the simulation of the vibrational spectra of both inorganic Calzolari and Buongiorno Nardelli (2013) and molecular crystals Cigarini et al. (2018). ACBN0, DFT and phonon calculations have been run by using the automatic workflows implemented in the AFLOW infrastructure Supka et al. (2017); Buongiorno Nardelli et al. (2018).
Molecular anions PO and HPO are simulated in cubic cells of dimension (14.0 14.0 14.0)Å3, where a jellium background is inserted to remove divergences in the charged cells. The dielectric effect of the environment (both water and apatite) on molecular phosphates is included through the continuum solvation model (CSM),Tomasi et al. (2005) implemented in the ENVIRONAndreussi et al. (2012) add-on to QE. The stability of the orthophosphate ion in water is simulated in an explicit solvent model (ESM), in which solvent molecules are treated on the same atomistic ground as the solute. In this case, 3 Na+ counter ions are included in the supercell to compensate the charges of phosphate, so that the overall system (1 PO + 67 H2O + 3 Na+) is globally neutral.
References
References
- Dorozhkin (2009) S. V. Dorozhkin, Materials 2, 399 (2009).
- Iafisco et al. (2013) M. Iafisco, J. M. Delgado-Lopez, E. M. Varoni, A. Tampieri, L. Rimondini, J. Gomez-Morales, and M. Prat, Small 9, 3834 (2013).
- Faibish et al. (2006) D. Faibish, S. M. Ott, and A. L. Boskey, Clin. Orthop. Relat. Res. 443, 28 (2006).
- Landi et al. (2007) E. Landi, A. Tampieri, G. Celotti, S. Sprio, M. Sandri, and G. Logroscino, Acta Biomaterialia 3, 961 (2007).
- Al-Rekabi et al. (2017) Z. Al-Rekabi, M. L. Cunningham, and N. J. Sniadecki, ACS Biomat. Sci. Engin. 3, 2733 (2017).
- Landi et al. (2000) E. Landi, A. Tampieri, G. Celotti, and S. Sprio, J. Eur. Ceramic Soc. 20, 2377 (2000).
- Rosin-Grget and Lincir (2001) K. Rosin-Grget and I. Lincir, Coll Antropol. 25, 703 (2001).
- Arinzeh et al. (2004) T. L. Arinzeh, T. Tran, J. Mcalary, and G. Daculsi, Biomaterials 26, 3631 (2004).
- LeGeros (2008) R. Z. LeGeros, Chem. Rev. 108, 4742 (2008).
- Tribble et al. (1995) J. S. Tribble, R. S. Arvidson, M. Lane, and F. T. Mackenzie, Sediment. Geol. 95, 11 (1995).
- Sirbescu et al. (2009) M.-L. C. Sirbescu, M. A. Leatherman, J. J. Student, and A. R. Beehr, The Canadian Mineralogist 47, 725 (2009).
- Zheng et al. (2007) W. Zheng, X. M. Li, Q. Yang, G. M. Zeng, X. X. Shen, Y. Zhang, and J. J. Liu, J. Hazard Mater. 147, 534 (2007).
- Wellman et al. (2008) D. M. Wellman, J. N. Glovack, K. Parker, E. L. Richards, and E. M. Pierce, Environ. Chem. 5, 40 (2008).
- Ensikat et al. (2016) H.-J. Ensikat, T. Geisler, and M. Weigend, Sci. Rep. 6, 26073 (2016).
- Weigend et al. (2018) M. Weigend, A. Mustafa, and H. J. Ensikat, Planta 247, 277 (2018).
- Stifler et al. (2018) C. A. Stifler, N. K. Wittig, M. Sassi, C.-Y. Sun, M. A. Marcus, H. Birkedal, E. Beniash, K. M. Rosso, and P. U. P. A. Gilbert, J. Am. Chem. Soc. 140, 11698 (2018).
- Marcus et al. (2017) M. A. Marcus, S. Amini, C. A. Stifler, C.-Y. Sun, N. Tamura, H. A. Bechtel, D. Y. Parkinson, H. S. Barnard, X. X. X. Zhang, J. Q. I. Chua, A. Miserez, and P. U. P. A. Gilbert, ACS Nano 11, 11856 (2017).
- Lotsari et al. (2018) A. Lotsari, A. K. Rajasekharan, M. Halvarsson, and M. Andersson, Nature Commun. 9, 4170 (2018).
- Nudelman et al. (2010) F. Nudelman, K. Pieterse, A. George, P. H. H. Bomans, H. Friedrich, L. J. Brylka, P. A. J. Hilbers, G. de With, and N. A. J. M. Sommerdijk, Nature Mater. 9, 1004 (2010).
- Suchaneka et al. (2004) W. L. Suchaneka, K. Byrappa, P. Shuk, R. E. Riman, V. F. Janas, and K. S. TenHuisen, Biomaterials 25, 4647 (2004).
- Elkabouss et al. (2004) K. Elkabouss, M. Kacimi, M. Ziyad, S. Ammar, and F. Bozon-Verduraz, J. Catalysis 226, 16 (2004).
- Ohtsu et al. (2013) N. Ohtsu, S. Hiromoto, M. Yamane, K. Satoh, and M. Tomozawa, Surf. Coat. Technol. 218, 114 (2013).
- Kruse et al. (2009) J. Kruse, P. Leinweber, K.-U. Eckhardt, F. Godlinski, Y. Huc, and L. Zuin, J. Synchrotron Rad. 16, 247 (2009).
- Nakata et al. (2009) K. Nakata, T. Kubo, C. Numako, T. Onoki, and A. Nakahir, Mater. Trans. 50, 1046 (2009).
- Kashiwabara et al. (2014) T. Kashiwabara, R. Toda, K. Fujinaga, T. Honma, Y. Takahashi, and Y. Kato, Chem. Lett. 43, 199 (2014).
- Pan and Fleet (2002) Y. M. Pan and M. E. Fleet, Phosphates: Geochemical, Geobiological, And Materials Importance Book Series: Reviews In Mineralogy And Geochemistry 48, 13 (2002).
- Panda et al. (2003) R. N. Panda, M. F. Hsieh, R. J. Chung, and T. Chin, J. Phys. Chem. Sol. 64, 193 (2003).
- Hu et al. (2010) Y.-Y. Hu, A. Rawal, and K. Schmidt-Rohr, Proc. Natl. Acc. Sci. 107, 22425 (2010).
- Pavan et al. (2012) B. Pavan, D. Ceresoli, M. M. J. Tecklenburg, and M. Fornari, Sol. St. Nuclear Mag. Res. 45–46, 59 (2012).
- Schulze et al. (1973) H. Schulze, N. Weinstock, A. Müller, and G. Vandrish, Spectrochim. Acta 29A, 1705 (1973).
- Mason et al. (2003) P. E. Mason, J. M. Cruickshank, G. W. Neilson, and P. Buchanan, Phys. Chem. Chem. Phys. 5, 4686 (2003).
- Chapman and Thirlwell (1964) A. C. Chapman and L. E. Thirlwell, Spectrochim. Acta 20, 937 (1964).
- Preston and Adams (1979) C. M. Preston and W. A. Adams, J. Chem. Phys. 83, 1814 (1979).
- Cherif et al. (2000) M. Cherif, A. Mgaidi, N. Ammar, G. Vallee, and W. Fürst, J. Sol. Chem. 29, 255 (2000).
- Rudolph (2010) W. W. Rudolph, Dalton Trans. 39, 9642 (2010).
- Syed et al. (2012) K. A. Syed, S.-F. Pang, Y. Zhang, and Y.-H. Zhang, J. Phys. Chem. A 116, 1558 (2012).
- Syed et al. (2013) K. A. Syed, S.-F. Pang, Y. Zhang, and Y.-H. Zhang, J. Chem. Phys. 138, 024901 (2013).
- Klähn et al. (2004) M. Klähn, G. Mathias, C. K otting, M. Nonella, J. Schlitter, K. Gerwert, and P. Tavan, J. Phys. Chem. A 108, 6186 (2004).
- Ebner et al. (2005) C. Ebner, U. Onthong, and M. Probst, J. Mol. Liq. 118, 15 (2005).
- Corno et al. (2006) M. Corno, C. Busco, B. Civalleria, and P. Ugliengo, Phys. Chem. Chem. Phys. 8, 2464 (2006).
- Saenger and Kuhs (1992) A. T. Saenger and W. F. Kuhs, Z. Kristallogr. 199, 123 (1992).
- Fleet and Pan (1995) M. E. Fleet and Y. Pan, Am. Mineral. 80, 329 (1995).
- Rulis et al. (2004) P. Rulis, L. Ouyang, and W. Y. Ching, Phys. Rev. B 70, 155104 (2004).
- Sudarsan et al. (1972) K. Sudarsan, R. Young, and P. Mackie, Mater. Res. Bull. 7, 1331 (1972).
- Calzolari and Buongiorno Nardelli (2013) A. Calzolari and M. Buongiorno Nardelli, Sci. Rep. 3, 2999 (2013).
- Tsuda and Arends (1994) H. Tsuda and J. Arends, J. Dent. Res. 73, 1703 (1994).
- Rehman and Bonfield (1997) I. Rehman and W. Bonfield, J. Mater. Sci.: Mater Med. 8, 1 (1997).
- Cuscó et al. (1998) R. Cuscó, F. Guitián, S. de Aza, and L. Artús, J. Eur. Chem. Soc. 18, 1301 (1998).
- Leroy et al. (2000) G. Leroy, N. Leroy, G. Penel, C. Rey, P. Lafforgue, and E. Bres, Appl. Spectr. 54, 1521 (2000).
- Klee (1970) W. E. Klee, Z. Kristallogr. 131, 95 (1970).
- Klee and Engel (1970) W. E. Klee and G. Engel, J. Inorg. Nucl. Chem. 32, 1837 (1970).
- Penel et al. (1997) G. Penel, G. Leroy, C.Rey, B. Sombret, J. P. Huvenne, and E. Bres, J. Mater. Sci: Mater. Med. 8, 271 (1997).
- Baddiel and Berry (1966) C. B. Baddiel and E. E. Berry, Spectr. Acta 22, 1407 (1966).
- Wei et al. (2003) M. Wei, J. H. Evans, T. Bostrom, and L. Grondahl, J. Mater. Sci.: Mater Med. 14, 311 (2003).
- Antonakos et al. (2007) A. Antonakos, E. Liarokapis, and T. Leventouri, Biomater. 28, 3043 (2007).
- Giannozzi et al. (2017) P. Giannozzi, O. Andreussi, T. Brumme, O. Bunau, M. Buongiorno Nardelli, M. Calandra, R. Car, C. Cavazzoni, D. Ceresoli, M. Cococcioni, N. Colonna, I. Carnimeo, A. D. Corso, S. de Gironcoli, P. Delugas, R. A. DiStasio, A. Ferretti, A. Floris, G. Fratesi, G. Fugallo, R. Gebauer, U. Gerstmann, F. Giustino, T. Gorni, J. Jia, M. Kawamura, H.-Y. Ko, A. Kokalj, E. Küçkbenli, M. Lazzeri, M. Marsili, N. Marzari, F. Mauri, N. L. Nguyen, H.-V. Nguyen, A. O. de-la Roza, L. Paulatto, S. Poncé, D. Rocca, R. Sabatini, B. Santra, M. Schlipf, A. P. Seitsonen, A. Smogunov, I. Timrov, T. Thonhauser, P. Umari, N. Vast, X. Wu, and S. Baroni, J. Phys.: Cond. Matt. 29, 465901 (2017).
- Thonhauser et al. (2015) T. Thonhauser, S. Zuluaga, C. A. Arter, K. Berland, E. Schröder, and P. Hyldgaard, Phys. Rev. Lett. 115, 136402 (2015).
- Langreth et al. (2009) D. C. Langreth, B. I. Lundqvist, S. D. Chakarova-Käck, V. R. Cooper, M. Dion, P. Hyldgaard, A. Kelkkanen, J. Kleis, L. Kong, S. Li, P. G. Moses, E. Murray, A. Puzder, H. Rydberg, E. Schröder, and T. Thonhauser, J. Phys.: Conden. Matt. 21, 084203 (2009).
- Vanderbilt (1990) D. Vanderbilt, Phys. Rev. B 41, R7892 (1990).
- Korotin et al. (2000) M. Korotin, T. Fujiwara, and V. Anisimov, Phys. Rev. B 62, 5696 (2000).
- Cococcioni and de Gironcoli (2005) M. Cococcioni and S. de Gironcoli, Phys. Rev. B 71, 035105 (2005).
- Agapito et al. (2015) L. A. Agapito, S. Curtarolo, and M. Buongiorno Nardelli, Phys. Rev. X 5, 1 (2015).
- Gopal et al. (2015) P. Gopal, M. Fornari, S. Curtarolo, L. A. Agapito, L. S. I. Liyanage, and M. Buongiorno Nardelli, Phys. Rev. B 91, 245202 (2015).
- Eaton et al. (2018) M. Eaton, A. Catellani, and A. Calzolari, Opt. Express 26, 5342 (1 (2018).
- Cigarini et al. (2018) L. Cigarini, A. Ruini, A. Catellani, and A. Calzolari, Phys. Chem. Chem. Phys. 20, 5021 (2018).
- Supka et al. (2017) A. R. Supka, T. E. Lyons, L. Liyanage, P. D’Amico, R. A. R. Al Orabi, S. Mahatara, P. Gopal, C. Toher, D. Ceresoli, A. Calzolari, S. Curtarolo, M. Buongiorno Nardelli, and M. Fornari, Comput. Mater. Sci. 136, 76 (2017).
- Buongiorno Nardelli et al. (2018) M. Buongiorno Nardelli, F. T. Cerasoli, M. Costa, S. Curtarolo, R. D. Gennaro, M. Fornari, L. Liyanage, A. R. Supka, and H. Wang, Comput. Mater. Sci. 143, 462 (2018).
- Tomasi et al. (2005) J. Tomasi, B. Mennucci, and R. Cammi, Chem. Rev. 105, 2999 (2005).
- Andreussi et al. (2012) O. Andreussi, I. Dabo, and N. Marzari, J. Chem. Phys. 136, 064102 (2012).
ACKNOWLEDGEMENTS
The authors thank Dr. Andrew Supka for technical support and Dr. Mary J. Tecklenburg for suggesting the problem. M.F. and M.B.N. acknowledge collaboration with the AFLOW Consortium (http://www.aflow.org) under the sponsorship of DOD-ONR (Grants N000141310635 and N000141512266).
AUTHOR CONTRIBUTIONS STATEMENT
A.C. coordinated the project providing calculations, data analysis and co-writing the text; B.P. generated the initial structures; S.C. co-wrote the manuscript; M.B.N. analysed the results and co-wrote the manuscript; M.F. conceived the project and co-wrote the manuscript.
ADDITIONAL INFORMATION
Supplementary information
Supplementary Information includes details on the crystalline structure of hexagonal apatite crystals (Sec. S1.); the method (Tab 1) and on the electronic structure (Sec. S2) the X-ray spectra (Sec. S3) and the dielectric and vibrational properties (Sec. S4) of FAp, HAp and CFAp systems; the polarized (Sec. S5) and isotope-substituted (Sec. S6) Raman spectra as well as the polarized Raman spectra of alternative apatite crystals (Sec. S7).
Competing interests
The authors declare no competing interests.
Figure Legends
Tables
| present | 419 | 587 | 951 | 1032 |
|---|---|---|---|---|
| (water) | ||||
| present | 412 | 588 | 931 | 1013 |
| (apatite) | ||||
| expa | 420 | 567 | 938 | 1017 |
| (water) |
a Ref. 30
| mode | Present | Expa | Expb | Expc | |
|---|---|---|---|---|---|
| FAp | 437–460 | 315–471 | 429–470 | 431–473 | |
| 591–654 | 566–603 | 560–615 | 569–6151 | ||
| 1011 | 960 | 962 | 963 | ||
| 1065–1165 | 1040–1200 | 1032–1090 | 1034-1104 | ||
| mode | Present | Expa | Expd | Expe | |
| HAp | 445–484 | 350–472 | 433–448 | 473 | |
| 595–661 | 564–725 | 580–614 | 570–601 | ||
| 1013 | 950–980 | 963 | 962 | ||
| 1023–1194 | 1028-1209 | 1029-1077 | 1042-1088 | ||
| mode | Present | Expf | |||
| CFAp | 434–468 | 440-557 | |||
| 590–655 | 570–602 | ||||
| 994 | 966 | ||||
| 1003–1178 | 1083–1156 |