Present address: ]Institut Laue-Langevin, F-38042 Grenoble Cedex, France
Present address: ]Institut Laue-Langevin, F-38042 Grenoble Cedex, France
Effects of one valence proton on seniority and angular momentum of neutrons in neutron-rich Sb isotopes
Abstract
Background: Levels fulfilling seniority scheme and relevant isomers are commonly observed features in semi-magic nuclei, for example in Sn isotopes (). Seniority isomers in Sn, with dominantly pure neutron configurations, directly probe the underlying neutron-neutron () interaction. Further, an addition of a valence proton particle or hole, through neutron-proton () interaction, affects the neutron seniority as well as the angular momentum.
Purpose: Benchmark the reproducibility of the experimental observables, like the excitation energies () and the reduced electric quadrupole transition probabilities (), with the results obtained from shell model interactions for neutron-rich Sn and Sb isotopes with 82. Study the sensitivity of the aforementioned experimental observables to the model interaction components. Further, explore from a microscopic point of view the structural similarity between the isomers in Sn and Sb, and thus the importance of the valence proton.
Methods: The neutron-rich 122-131Sb isotopes were produced as fission fragments in the reaction 9Be(238U, f) with 6.2 MeV/u beam energy. An unique setup, consisting of AGATA, VAMOS++ and EXOGAM detectors, was used which enabled the prompt-delayed gamma-ray () spectroscopy of fission fragments in the time range of 100 ns - 200 s.
Results: New isomers, prompt and delayed transitions were established in the even-A 122-130Sb isotopes. In the odd-A 123-131Sb isotopes, new prompt and delayed -ray transitions were identified, in addition to the confirmation of the previously known isomers. The half-lives of the isomeric states and the transition probabilities of the observed transitions depopulating these isomers were extracted.
Conclusions: The experimental data was compared with the theoretical results obtained in the framework of Large-Scale Shell-Model (LSSM) calculations in a restricted model space. Modifications of several components of the shell model interaction were introduced to obtain a consistent agreement with the excitation energies and the transition probabilities in neutron-rich Sn and Sb isotopes. The isomeric configurations in Sn and Sb were found to be relatively pure. Further, the calculations revealed that the presence of a single valence proton, mainly in the orbital in Sb isotopes, leads to significant mixing (due to the interaction) of: (i) the neutron seniorities () and (ii) the neutron angular momentum (). The above features have a weak impact on the excitation energies, but have an important impact on the transition probabilities. In addition, a constancy of the relative excitation energies irrespective of neutron seniority and neutron number in Sn and Sb was observed.
I Introduction
The Sn isotopes, with basically a spherical shape, span between two doubly magic nuclei, the neutron-deficient 100Sn () and the neutron-rich 132Sn (, ). A constant trend, as a function of neutron number, in the excitation energies () of the state and the parabolic shape (with a dip around = 66) of the reduced electric quadrupole transition probabilities (), was observed for the even-A Sn isotopes Casten (2000); nud (2019). The observed trend has recently been clarified using state-of-the-art Monte-Carlo Shell-Model (MCSM) calculations with a large model space, where the dip in the was shown to correspond to a novel shape evolution from moderately deformed phase to pairing (seniority) phase around Togashi et al. (2018). These calculations required huge computational resources, hence only , , and states were calculated for fitting purpose. Recently, the parabolic behaviour of the in even-A 116-130Sn was described in the generalised seniority () scheme in Ref. Maheshwari (2016), showing the necessity of the incorporation of configuration mixing of neutron , and orbitals instead of a pure orbital, with generalised seniority being pure = 2 ( stands for neutron seniority, which refers to the number of unpaired neutrons). It is known that seniority is a good quantum number for . This becomes a partial symmetry in the case of in 72,74Ni Morales et al. (2018). In these isotopes, the () state has a lower excitation energy than the (), leading to a disappearance of the seniority () isomers. At present, there is no indication of disappearance of () seniority isomers in the Sn isotopes (), indicating that the state in Sn is still a pure = 2 state. Recent results on the low-lying high-spin states in even-A 124-128Sb () and 122-126In () suggested that there is a significant mixing of the seniorities, = 1 and 3, due to the presence of a single valence proton particle/hole in the / orbital Rejmund et al. (2016). It was shown in Ref. Rejmund et al. (2016) that the interaction of a single proton particle/hole in the / spin-orbit partners in Sb/In isotopes, respectively with the neutrons energetically favoured the state with one broken pair of neutrons (breaking of the seniority) over a state with no broken pairs for the low-lying high-spin states.
The experimental study of nuclei near the shell closures serves as an important test bench for directly probing the nucleon-nucleon interaction. This acts as important input for existing shell-model interactions and allows to improve the predictive power of such calculations. In particular, the mass A 130 region, near shell closure, is an interesting area of research in contemporary nuclear physics, as 132Sn is so far the heaviest neutron-rich unstable doubly magic nucleus and it is possible to access this region with the recent advent of new accelerator facilities and large detector arrays Bhattacharyya et al. (2001); Cottle (2010); Jones et al. (2010); Rosiak et al. (2018). The excitation energies () and the transition strengths () of neighbouring nuclei near 132Sn act as a testing ground to shell-model calculations and the associated interactions Coraggio et al. (2015); Teruya et al. (2015); Biswas et al. (2016); Rejmund et al. (2016); Wang et al. (2017); Kim et al. (2018).
Even-A 118-130Sn isotopes possess and isomers, with dominant neutron and configurations, respectively Fogelberg et al. (1981); Pietri et al. (2011); Astier et al. (2012); Iskra et al. (2014). Similarly, odd-A 119-129Sn isotopes display and isomers with dominant and configurations, respectively Lozeva et al. (2008); Astier et al. (2012); Iskra et al. (2016), an additional hole in the orbital coupled to the counterparts, and isomers in even-A Sn, respectively. The experimental data from these nuclei, due to proton shell closure, probe the neutron-neutron () interaction. Odd-A 121-131Sb isotopes have and isomers with dominant and configurations Judson et al. (2007); Watanabe et al. (2009a, b); Genevey et al. (2003); J. Genevey et al. (2000), an additional proton particle in coupled to the and isomers in even-A Sn, respectively. The isomers in even-A 122-128Sb isotopes, except for 130Sb, were not known and are newly observed in this work. The experimental data on Sb isotopes, in addition to the information obtained for Sn, probe the neutron-proton () interaction. The present manuscript discusses the four different cases of configurational similarities between Sn and Sb:
Case I: () in even-A Sn and () in odd-A Sb
Case II: () in even-A Sn and () in odd-A Sb
Case III: () in odd-A Sn and () in even-A Sb
Case IV: () in odd-A Sn and () in even-A Sb.
II Experimental Details
The neutron-rich 122-131Sb isotopes were produced as fission fragments via fusion- and transfer-induced fission reactions at GANIL, using a 238U beam at an energy of 6.2 MeV/u, with typical beam intensity of 1 pnA on a 9Be target (1.6 and 5 m thick). The unambiguous isotopic identification of the fission fragments (, , ) was achieved using the VAMOS++ spectrometer, placed at 20∘ relative to the beam axis Rejmund et al. (2011); Navin et al. (2014); Navin (2014). The focal plane detection system of VAMOS++ was constituted of a Multi-Wire Proportional Counter (MWPC), two drift chambers and a segmented ionization chamber. The AGATA -ray tracking array, consisting of 32 crystals, was placed at 13.5 cm from the target position Akkoyun et al. (2012). The velocity vector of the recoiling ions (measured by Dual Position-Sensitive MWPC (DPS-MWPC) detector Vandebrouck et al. (2016), placed at the entrance of the VAMOS++ spectrometer, and the -ray emission angle (determined using AGATA) were used to obtain the Doppler corrected prompt rays (), on an event-by-event basis. Gamma-ray interaction points, determined by Pulse Shape Analysis (PSA) and GRID search algorithm techniques, were tracked using the Orsay Forward Tracking (OFT) algorithm, as described in Ref. Kim et al. (2017). The delayed rays () were detected using seven EXOGAM HPGe Clover detectors Simpson et al. (2000), arranged in a wall like configuration at the focal plane of VAMOS++. The particle identification (PID) spectra, intrinsic resolutions of the spectrometer (, , ) and additional experimental details are given in Ref. Kim et al. (2017).
The contamination from neighboring isobars, arising from the resolution in atomic number , was subtracted for prompt -ray spectra. In addition to the background reduction for the delayed spectra as suggested in Ref. Kim et al. (2017), the subtraction in delayed spectra for neighboring isotopes was performed for all the Sb isotopes. The - matrices (, , and ) were generated for both the prompt (P) and delayed (D) transitions for all the Sb isotopes. The uncertainties in the energy of the prompt and delayed rays is 1 keV. The efficiencies for the prompt and delayed rays were determined separately, as mentioned in Ref. Kim et al. (2017). The correction for the half-lives as mentioned in Ref. Kim et al. (2017), was also taken into account. The spin-parities were assigned based on systematics and shell model calculations. One- (), two- () and three-component fits, where are the fitting parameters, were carried out for the estimation of half-lives of the states, wherever required. The conversion coefficients used for the estimation of the B(E2) transition probabilities were taken from BrIcc Kibédi et al. (2008).
III Experimental Results
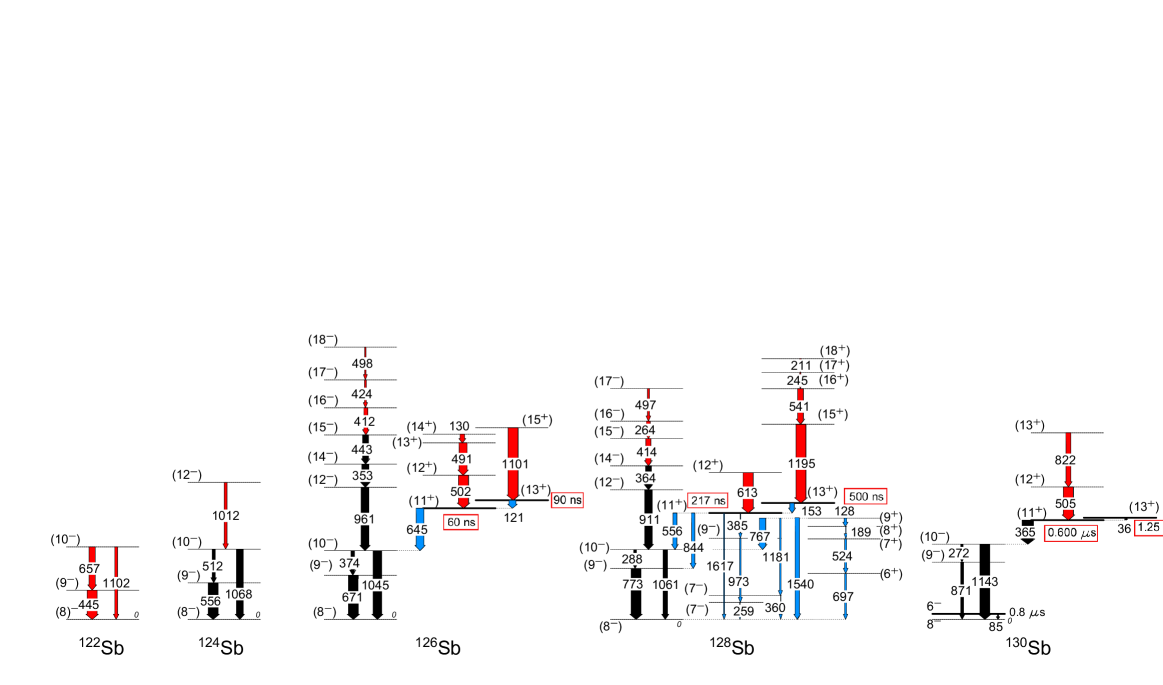
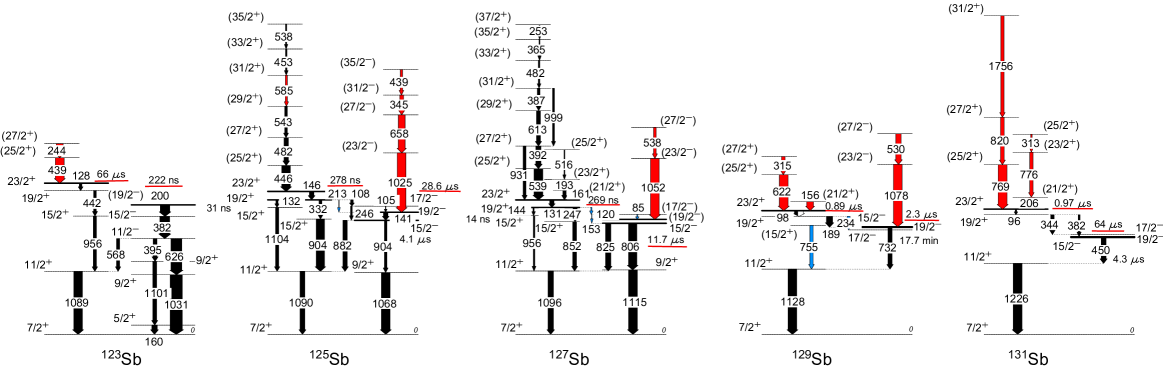
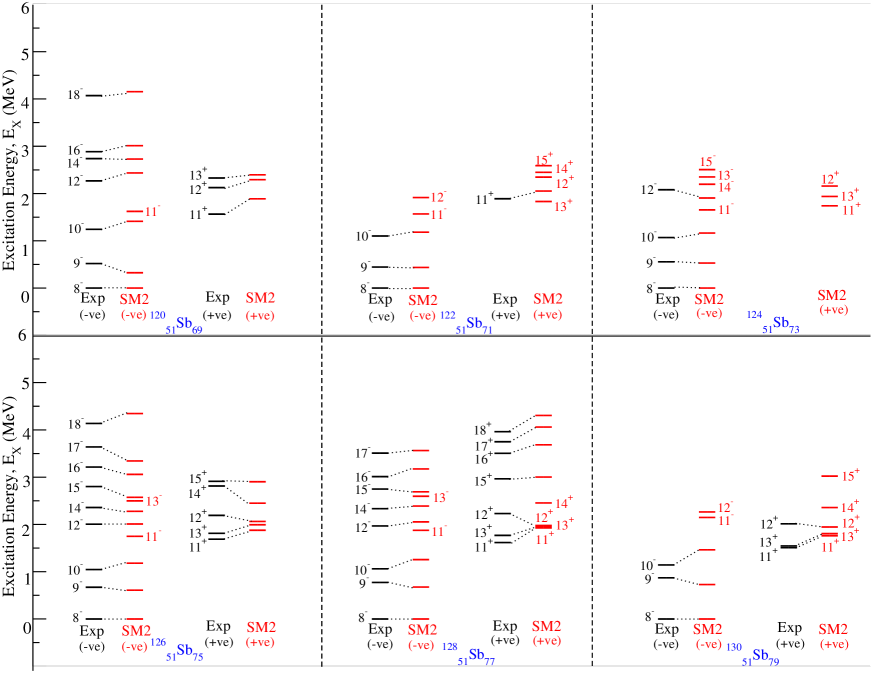
A summary of the level schemes for all the odd-A and even-A 122-131Sb isotopes are shown in Fig. 1. Already known -ray transitions are shown in black. Newly identified prompt and delayed transitions are shown by red and blue, respectively. Already known half-lives which have not been measured in this work are shown. The remeasured and newly measured half-lives have been indicated by a red line and a red box, respectively. The width of the arrows are proportional to the intensity of the transitions. The intensities of the prompt and delayed transitions have been separately measured and the lowest transition is normalized to 100 in each case. The prompt -ray transition emitted by the complementary fission fragment Navin et al. (2014); Navin (2014) (mainly from the fusion-fission) are observed and identified (marked by ”c” in all the spectra) in the low energy part of the -ray spectra. The random coincidences with X-ray emitted by 238U is also observed and is marked by an symbol.
III.1 122Sb
Previous measurements on 122Sb were reported in Refs. van Gunsteren (1977); Langevin-Joliot et al. (1988). The level scheme as obtained in the present work is shown in Fig. 1. Table 1 shows the properties of all the transitions assigned in this work.
| Eγ | Iγ | |||
|---|---|---|---|---|
| 445.2 | 100 | (8)- | 445 | 0 |
| 657.2 | 63(14) | (9 | 1102 | 445 |
| 1102.2 | 29(18) | (8)- | 1102 | 0 |
.
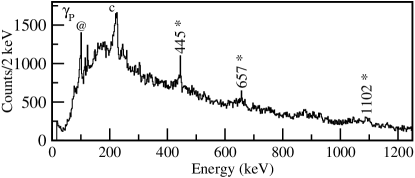
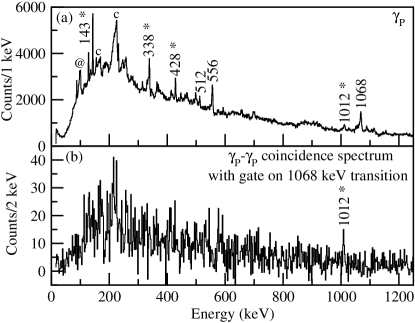
The and gated tracked Doppler corrected prompt singles -ray () spectrum for 122Sb is shown in Fig. 2. Three new prompt transitions 445, 657 and 1102 keV transitions are seen and these are marked with an asterisk. Based on the relative intensities, the 445 keV -ray is placed above the level (a 4.2 min isomeric state observed in Ref. van Gunsteren (1977)). In addition, it follows the systematics with the higher even-A Sb isotopes. Due to low statistics, no - coincidence could be carried out. However, based on the summation of gammas, the intensities and the systematics, the 657 keV is placed above the 445 keV with the level decaying by the 1102 keV to the state. No and gated delayed rays () in 122Sb could be identified from the present experiment.
III.2 123Sb
| Eγ | Iγ | |||
| 244.1 | 78(16) | (27/2 (25/2 | 3298 | 3054 |
| 439.2 | 100 | (25/2 23/2+ | 3054 | 2615 |
| 128.2 | 29(16) | 23/2 19/2+ | 2615 | 2487 |
| 159.8 | 63(36) | 5/2 7/2+ | 160 | 0 |
| 200.4 | 108(57) | (19/2 15/2- | 2239 | 2039 |
| 382.0 | 112(54) | 15/2 11/2- | 2039 | 1657 |
| 395.4 | 44(23) | 11/2 9/2+ | 1657 | 1261 |
| 441.6 | 32(11) | 19/2 15/2+ | 2487 | 2045 |
| 568.2 | 35(17) | 11/2 11/2+ | 1657 | 1089 |
| 626.0 | 125(56) | 11/2 9/2+ | 1657 | 1031 |
| 956.0 | 37(14) | 15/2 11/2+ | 2045 | 1089 |
| 1030.5 | 141(64) | 9/2 7/2+ | 1031 | 0 |
| 1089.0 | 100 | 11/2 7/2+ | 1089 | 0 |
| 1101.0 | 44(22) | 9/2 5/2+ | 1261 | 160 |
The spectroscopy of 123Sb isotope was previously studied in Refs. Porquet et al. (2005); Judson et al. (2007); Jones et al. (2008); Watanabe et al. (2009a). The level scheme as obtained in the present work is shown in Fig. 1. Table 2 shows the properties of all the transitions assigned in this work.
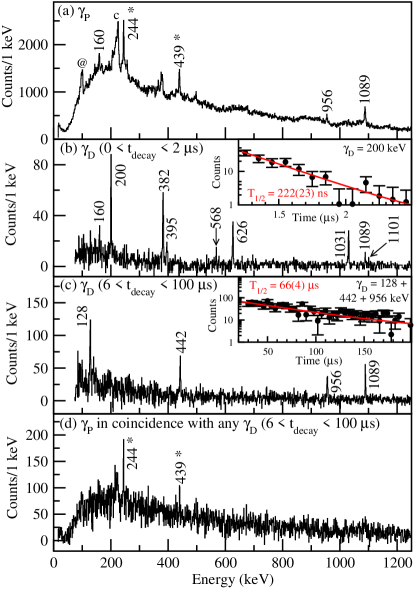
The and gated -ray spectra for 123Sb are shown in Fig. 3. The tracked Doppler corrected prompt singles -ray spectrum () for 123Sb is shown in Fig. 3(a). Previously observed 160, 956 and 1089 keV transitions are seen in this spectrum. Two new prompt -ray transitions, namely 244 and 439 keV, are identified and these are marked with an asterisk. The delayed -ray spectrum () for 0 2 s is shown in Fig. 3(b), yielding 160, 200, 382, 395, 568, 626, 1031, 1089 and 1101 keV transitions, as expected from previous works. The half-life fit (one-component) for the decay spectrum upon gating on 200 keV transition yields a value of = 222(23) ns for the (19/2-) state (in agreement with the quoted value of 214(3) ns in Ref. Watanabe et al. (2009a)), which gives B(E2; ) = 6.9(7) e2fm4. However, the weak delayed transitions, which were mentioned in Refs. Watanabe et al. (2009a); Jones et al. (2008), namely the 949, 1007, 1260 and 1656 keV transitions, are not observed owing to the low statistics in our dataset. Similarly, Fig. 3(c) shows the delayed -ray spectrum () for 6 100 s, leading to 128, 442, 956 and 1089 keV transitions. A half-life fit (one-component) for the decay spectrum upon gating on 128, 442 and 956 keV transitions yields a value of = 66(4) s for the state (in agreement with the value of 65(1) s reported in Ref. Watanabe et al. (2009a)), which gives B(E2; ) = 0.15(1) e2fm4. However, the weak transitions 100, 148, 348, 375 and 1250 keV, which were mentioned in Ref. Watanabe et al. (2009a), are not observed owing to the low statistics in our dataset. The tracked Doppler corrected in coincidence with any (for 6 100 s) is shown in Fig. 3(d). This spectrum yields the two newly identified prompt -ray transitions, 244 and 439 keV transitions. In order to confirm these newly found prompt transitions, a gate when applied on the prompt 244 and 439 keV transitions yielded the delayed 128 keV (not shown in this figure). Thus these two new transitions are placed above the isomer. However, the tracked Doppler corrected in coincidence with any for 0 2 s, did not result in any new prompt rays and hence no -ray is placed above the (19/2-) isomer.
III.3 124Sb
The -ray spectroscopy measurement on the high-spin states in 124Sb was previously reported in Ref. Rejmund et al. (2016). The level scheme as obtained in the present work is shown in Fig. 1. Table. 3 shows the properties of all the transitions assigned in this work.
The and gated tracked Doppler corrected prompt singles -ray spectrum for 124Sb is shown in Fig. 4(a). The already identified rays in Ref. Rejmund et al. (2016), namely 512, 556 and 1068 keV are seen. Other than these, four new prompt 143, 338, 428 and 1012 keV -ray transitions are identified (marked with an asterisk). Figure 4(b) shows the and gated tracked Doppler corrected prompt - coincidence (-) spectrum with gate on the 1068 keV transition. This shows that the 1012 keV transition is in coincidence and hence is placed in the level scheme. The placement of 1012 keV transition in the level scheme follows the systematics with the other even-A Sb isotopes. The other prompt transitions 143, 338 and 428 keV are not placed as these are not observed in the coincidence spectrum. These rays probably belong to the side band (as observed above the isomer in the case of 126Sb). No delayed rays could be identified for 124Sb, using the present setup.
| Eγ | Iγ | |||
|---|---|---|---|---|
| 512.3 | 30(6) | ( (9 | 1068 | 556 |
| 556.0 | 100 | ( (8 | 556 | 0 |
| 1012.0 | 29(6) | (12 (10 | 2080 | 1068 |
| 1068.4 | 69(13) | (10 (8 | 1068 | 0 |
III.4 125Sb
Previous measurements on the -ray spectroscopy of high-spin states in 125Sb were reported in Refs. Porquet et al. (2005); Judson et al. (2007); Ressler et al. (2010). The level scheme as obtained in the present work is shown in Fig. 1. Table 4 shows the properties of all the transitions assigned in this work.
| Eγ | Iγ | |||
| 345.3 | 45(5) | (31/2 (27/2 | 4138 | 3795 |
| 438.7 | 26(3) | (35/2 (31/2 | 4579 | 4138 |
| 446.5 | 100 | (25/2 23/2+ | 2919 | 2472 |
| 453.1 | 17(2) | (33/2 (31/2 | 4981 | 4528 |
| 482.0 | 50(3) | (27/2 (25/2 | 3401 | 2919 |
| 538.1 | 13(3) | (35/2 (33/2 | 5366 | 4934 |
| 542.7 | 30(2) | (29/2 (27/2 | 3943 | 3401 |
| 584.8 | 23(3) | (31/2 (29/2 | 4528 | 3943 |
| 657.8 | 79(6) | (27/2 (23/2 | 3795 | 3138 |
| 1025.4 | 100 | (23/2 19/2- | 3138 | 2112 |
| 105.1 | 6(4) | 17/2 19/2- | 2217 | 2112 |
| 108.1 | 29(19) | 19/2 17/2- | 2326 | 2217 |
| 132.1 | 24(13) | 19/2 15/2+ | 2326 | 2194 |
| 140.7 | 51(28) | 19/2 15/2- | 2112 | 1972 |
| 146.3 | 52(27) | 23/2 19/2+ | 2472 | 2326 |
| 213.3 | 5(2) | 19/2 19/2- | 2326 | 2112 |
| 245.9 | 19(11) | 17/2 15/2- | 2217 | 1972 |
| 332.0 | 34(13) | 19/2 15/2+ | 2326 | 1994 |
| 881.8 | 50(17) | 15/2 11/2+ | 1972 | 1090 |
| 903.8 | 95(32) | 15/2 9/2+ | 1972 | 1068 |
| 904.1 | 29(10) | 15/2 11/2+ | 1994 | 1090 |
| 1067.7 | 100 | 9/2 7/2+ | 1068 | 0 |
| 1089.7 | 54(18) | 11/2 7/2+ | 1090 | 0 |
| 1104.1 | 35(12) | 15/2 11/2+ | 2194 | 1090 |
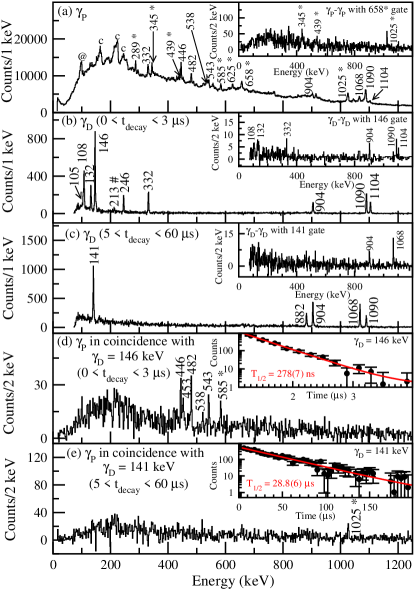
The and gated -ray spectra for 125Sb is shown in Fig. 5. The tracked Doppler corrected prompt singles -ray spectrum () for 125Sb is shown in Fig. 5(a). The previously known 332, 446, 482, 453, 538, 543, 904, 1068, 1090 and 1104 keV transitions are observed. Seven new prompt -ray transitions, namely 289, 345, 439, 585, 625, 658, and 1025 keV transitions are identified (marked with an asterisk). The inset shows the tracked Doppler corrected prompt - coincidence spectrum with gate on the newly identified 658 keV transition. This spectrum shows that the 345, 439, 658 and 1025 keV rays are in coincidence. A similar coincidence spectrum was obtained for the 446, 453, 482, 538, 543 and 585 keV transitions (not shown in this figure). No rays are seen in coincidence with the 289 and 625 keV transitions, hence these are not placed in the level scheme. The delayed -ray () spectrum for 0 3 s is shown in Fig. 5(b) yielding 105, 108, 132, 146, 213, 246, 332, 904 (15/2 11/2+), 1090 and 1104 keV transitions, as expected from the level scheme. The 213 keV is newly identified and this is marked with an hash in the spectrum. The inset of Fig. 5(b) shows the delayed - coincidence spectrum with gate on 146 keV transition, yielding all the intense delayed transitions. Similarly, Fig. 5(c) shows the delayed -ray spectrum for 5 60 s, leading to 141, 882, 904 (15/2 9/2+), 1068 and 1090 keV transitions. The inset of Fig. 5(c) shows the delayed - coincidence spectrum with gate on 141 keV transition, yielding 904 and 1068 keV rays as expected from previous works. The tracked Doppler corrected in coincidence with = 146 keV (for 0 3 s) is shown in Fig. 5(d). This spectrum yields the prompt -ray transitions, 446, 453, 482, 538, 543 and 585 keV transitions. In the previous Ref. Porquet et al. (2005), these prompt transitions, except 585 keV, were assigned negative-parities and placed above the isomer. Here we propose these transitions to be positive-parity states and placed above the isomer, as observed from prompt-delayed coincidences. Based on the intensities, the 585 keV transition is placed above the 543 keV transition, and the 453 and 538 keV transitions are replaced. The 432 keV transition, seen in Ref. Porquet et al. (2005), is not observed in coincidence, hence it is not assigned in the present level scheme. The half-life fit (one-component) for the decay spectrum upon gating on 146 keV transition yields a value of = 278(7) ns for the (in agreement with the value of 272(16) ns reported in Ref. Judson et al. (2007)), which is shown in the inset of Fig. 5(d). This leads to B(E2; ) = 21.3(6) e2fm4. The tracked Doppler corrected in coincidence with = 141 keV for 5 60 s, resulted in the observation of the newly identified 1025 keV -ray. As seen from the inset of Fig. 5(a), the 345, 439, 658 and 1025 keV transitions are in coincidence, and hence are placed above the isomer. The inset of Fig. 5(d) shows the half-life fit (two-component with one component fixed to 278 ns) for the decay spectrum upon gating on 141 keV transition yield a value of = 28.8(6) s for the state (in agreement with the quoted value of 28.0(7) s in Ref. Judson et al. (2007)), which yields B(E2; ) = 0.24(1) e2fm4.
III.5 126Sb
| Eγ | Iγ | |||
| 130.1 | 44(4) | (14 (13 | 2813 | 2682 |
| 352.9 | 72(7) | (14 (12 | 2359 | 2006 |
| 373.5 | 35(5) | (10 (9 | 1045 | 671 |
| 411.9 | 39(5) | (16 (15 | 3214 | 2802 |
| 423.5 | 17(2) | (17 (16 | 3638 | 3214 |
| 443.3 | 59(7) | (15 (14 | 2802 | 2359 |
| 491.4 | 78(7) | (13 (12 | 2682 | 2191 |
| 497.6 | 13(2) | (18 (17 | 4135 | 3638 |
| 501.8 | 100 | (12 (11 | 2191 | 1689 |
| 671.2 | 100 | (9 (8 | 671 | 0 |
| 961.4 | 79(11) | (12 (10 | 2006 | 1045 |
| 1044.9 | 87(7) | (10 (8 | 1045 | 0 |
| 1101.1 | 100 | (15 (13 | 2912 | 1811 |
| 121.3 | 70(43) | (13 (11 | 1811 | 1689 |
| 644.6 | 76(29) | (11 (10 | 1689 | 1045 |
Gamma-ray spectroscopy measurements on the high-spin states in 126Sb was previously reported in Ref. Rejmund et al. (2016). The level scheme as obtained in the present work is shown in Fig. 1. Table. 5 shows the properties of all the transitions assigned in this work.
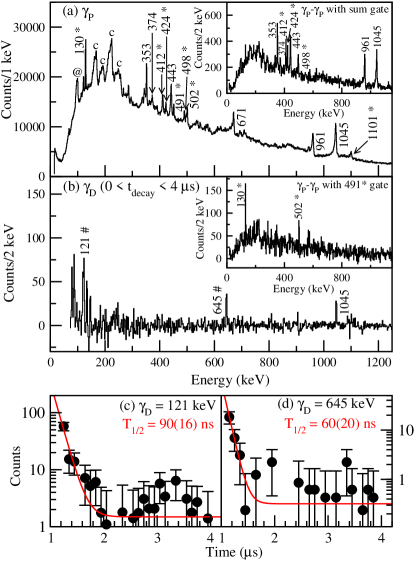
The and gated -ray spectra for 126Sb are shown in Fig. 6. The tracked Doppler corrected prompt singles -ray spectrum () for 126Sb is shown in Fig. 6(a). The already known rays from Ref. Rejmund et al. (2016), namely 353, 374, 443, 671, 961 and 1045 keV are observed. In addition, new prompt rays 130, 412, 424, 491, 498, 502 and 1101 keV (marked with an asterisk) are identified. The tracked Doppler corrected prompt - coincidence (-) spectrum with a sum gate of 353, 443 and 961 keV prompt -ray transitions is shown in the inset of Fig. 6(a). This spectrum shows that the 353, 374, 412, 424, 443, 498, 671, 961 and 1045 keV transitions are in coincidence and the newly observed transitions are marked with an asterisk. Figure 6(b) shows the delayed -ray () singles spectrum, with 0 4 s. This spectrum shows the presence of two new delayed 121 and 645 keV transitions, besides the 1045 keV transition (marked with an hash). The inset in Fig. 6(b) shows the tracked Doppler corrected prompt - coincidence spectrum (-) gated on the newly identified 491 keV transition. This shows that the 130, 491 and 502 keV transitions are in coincidence and these are placed above the state in the level scheme, following the systematics with higher even-A Sb isotopes. Also in Fig. 6(a), the newly identified 1101 keV transition, is not observed in the tracked Doppler corrected prompt spectra (insets of Fig. 6(a) and (b)). Following the systematics with 128Sb, this is placed above the state. The decay spectrum of the delayed 121 keV transition is shown in Fig. 6(c). An exponential fit (one-component) yields a value of 90(16) ns. This gives B(E2; ) = 131(28) e2fm4. The half-life of the 645 keV transition was also measured with = 60(20) ns, as shown in Fig. 6(d) (using a two-component fit with one component fixed to 90 ns).
III.6 127Sb
Previous -ray spectroscopy measurements on 127Sb were reported in Refs. Apt (1974); Porquet et al. (2005); Watanabe et al. (2009b). The level scheme as obtained in the present work is shown in Fig. 1. Table 6 shows the properties of all the transitions assigned in this work.
| Eγ | Iγ | |||
| 161.4 | 38(2) | (21/2 23/2+ | 2486 | 2325 |
| 192.6 | 15(2) | (23/2 (21/2 | 2678 | 2486 |
| 252.7 | 11(5) | (37/2 (35/2 | 5354 | 5101 |
| 365.1 | 12(2) | (35/2 (33/2 | 5101 | 4736 |
| 386.7 | 31(3) | (31/2 (29/2 | 4255 | 3868 |
| 391.8 | 60(3) | (27/2 (25/2 | 3256 | 2864 |
| 482.0 | 17(5) | (33/2 (31/2 | 4736 | 4255 |
| 516.1 | 13(3) | (25/2 (23/2 | 3194 | 2678 |
| 538.1 | 30(2) | (27/2 (23/2 | 3579 | 3041 |
| 539.1 | 100 | (25/2 23/2+ | 2864 | 2325 |
| 612.8 | 46(3) | (29/2 (27/2 | 3868 | 3256 |
| 930.9 | 32(2) | (27/2 (23/2 | 3256 | 2325 |
| 999.0 | 21(3) | (31/2 (27/2 | 4255 | 3256 |
| 1052.4 | 100 | (23/2 (19/2 | 3041 | 1989 |
| 84.8 | 11(9) | (17/2 (19/2 | 2074 | 1989 |
| 119.9 | 12(7) | 19/2 (17/2 | 2194 | 2074 |
| 131.1 | 49(28) | 23/2 19/2+ | 2325 | 2194 |
| 143.5 | 14(7) | 19/2 15/2+ | 2194 | 2051 |
| 153.1 | 2(1) | (17/2 15/2- | 2074 | 1920 |
| 246.9 | 47(20) | 19/2 15/2+ | 2194 | 1948 |
| 806.0 | 97(33) | 15/2 9/2+ | 1920 | 1115 |
| 824.8 | 61(21) | 15/2 11/2+ | 1920 | 1096 |
| 852.5 | 43(15) | 15/2 11/2+ | 1948 | 1096 |
| 956.2 | 17(6) | 15/2 11/2+ | 2051 | 1096 |
| 1095.8 | 61(20) | 11/2 7/2+ | 1096 | 0 |
| 1114.6 | 100 | 9/2 7/2+ | 1115 | 0 |
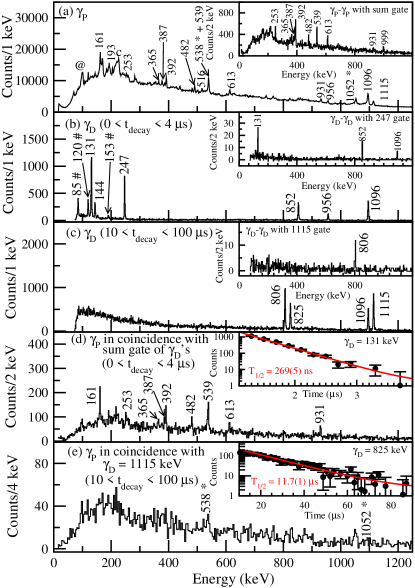
The and gated -ray spectra for 127Sb is shown in Fig. 7. The tracked Doppler corrected prompt singles -ray spectrum () for 127Sb is shown in Fig. 7(a). The previously known 161, 193, 253, 365, 387, 392, 482, 516, 613, 931, 956, 999, 1096 and 1115 keV transitions are seen. Two new prompt -ray transitions, namely 538 and 1052 keV transitions, are identified and these are marked with an asterisk. The inset shows the tracked Doppler corrected prompt - coincidence spectrum with sum gate on the 387, 392, 539, and 613 keV -ray transitions. This spectrum shows that the 253, 365, 387, 392, 482, 539, 613, 931 and 999 keV rays are in coincidence. A similar coincidence spectrum is obtained for 161, 193, and 516 keV transitions (not shown in this figure). The delayed singles -ray () spectrum for 0 4 s is shown in Fig. 7(b), yielding 85, 120, 131, 144, 153, 247, 852, 956 and 1096 keV transitions, as expected from the previous works. The 85, 120, and 153 keV transitions are newly identified (marked with hash). The inset shows the delayed - coincidence spectrum with gate on 247 keV transition, yielding 131, 852 and 1096 keV transitions, as reported in previous measurements. The newly observed delayed transitions are placed in accordance with that of 125Sb and summation of gammas. Similarly, Fig. 7(c) shows the singles -ray spectrum for 10 100 s, leading to 806, 825, 1096 and 1115 keV transitions. The inset shows the delayed - coincidence spectrum with gate on 1115 keV transition, yielding 806 keV -ray as expected from previous works. The -ray transition, 69 keV, between the () and (similar 200 and 141 keV transitions were observed in 123,125Sb isotopes, respectively) could not be observed with the present setup, as it is below the energy threshold. Assuming similar structure with the other odd-A Sb isotopes, the () state can be assumed to be an isomeric state in 127Sb. The tracked Doppler corrected in coincidence with sum gate of ’s namely 85, 120, 131, 144, 247, 852, 956, and 1096 keV transitions (for 0 4 s) is shown in Fig. 7(d). This spectrum yields the prompt -ray transitions, 161, 253, 365, 387, 392, 482, 539, 613 and 931 keV transitions. In the previous reference Porquet et al. (2005), these prompt transitions were assigned negative-parities and placed above the () isomer. Instead, we suggest these to be positive-parity states (placed above the isomer), as observed from the prompt-delayed coincidences. The half-life fit (one-component), shown in the inset of Fig. 7(c), for the decay spectrum upon gating on 131 keV transition yields a value of = 269(5) ns for the state (close to the value of 234(12) ns reported in Ref. Watanabe et al. (2009b)), which has been shown in the inset. This gives B(E2; ) = 33.4(7) e2fm4. However, the tracked Doppler corrected in coincidence with = 1115 keV for 10 100 s, resulted in the observation of the newly identified 538 and 1052 keV rays. These two transitions are thus placed above the () isomer, in accordance with the other odd-A Sb isotopes. The inset shows the half-life fit (two-component with one component fixed to 269 ns) for the decay spectrum upon gating on 825 keV transition, which yields a value of = 11.7(1) s for the isomer (in agreement with the value of 11(1) s reported in Ref. Apt (1974)).
III.7 128Sb
| Eγ | Iγ | |||
| 211.1 | 10(5) | (18 (17 | 3961 | 3749 |
| 244.8 | 20(4) | (17 (16 | 3749 | 3505 |
| 263.9 | 37(4) | (16 (15 | 3011 | 2748 |
| 288.4 | 27(3) | (10 (9 | 1061 | 773 |
| 364.3 | 60(1) | (14 (12 | 2333 | 1969 |
| 413.9 | 52(2) | (15 (14 | 2748 | 2333 |
| 497.0 | 20(1) | (17 (16 | 3508 | 3011 |
| 541.3 | 58(3) | (16 (15 | 3505 | 2964 |
| 612.9 | 100 | (12 (11 | 2230 | 1617 |
| 773.0 | 100 | (9 (8 | 773 | 0 |
| 910.9 | 76(2) | (12 (10 | 1969 | 1061 |
| 1061.4 | 46(2) | (10 (8 | 1061 | 0 |
| 1195.1 | 100 | (15 (13 | 2964 | 1769 |
| 127.8 | 12(7) | (9 (8 | 1540 | 1412 |
| 152.6 | 45(24) | (13 (11 | 1769 | 1617 |
| 189.4 | 11(5) | (8 (7 | 1412 | 1223 |
| 259.4 | 11(5) | (7 (8 | 259 | 0 |
| 359.9 | 14(6) | (7 (8 | 360 | 0 |
| 384.8 | 13(5) | (11 (9 | 1617 | 1232 |
| 523.6 | 25(9) | (7 (6 | 1223 | 697 |
| 556.2 | 42(15) | (11 (10 | 1617 | 1061 |
| 696.9 | 17(6) | (6 (8 | 697 | 0 |
| 767.0 | 63(22) | (9 (9 | 1540 | 773 |
| 843.8 | 32(11) | (11 (9 | 1617 | 773 |
| 973.3 | 20(7) | (9 (7 | 1232 | 259 |
| 1181.2 | 4(2) | (9 (7 | 1540 | 360 |
| 1540.4 | 43(15) | (9 (8 | 1540 | 0 |
| 1617.2 | 10(3) | (11 (8 | 1617 | 0 |
Previous -ray spectroscopy measurement on the high-spin states in 128Sb was shown in Ref. Rejmund et al. (2016). The level scheme as obtained in the present work is shown in Fig. 1. Table. 7 shows the properties of all the transitions assigned in this work.
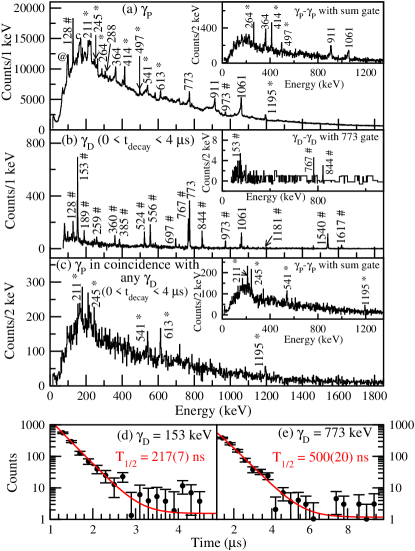
The and gated -ray spectra for 128Sb is shown in Fig. 8. The tracked Doppler corrected prompt singles -ray spectrum () for 128Sb is shown in Fig. 8(a). The already known -rays, namely 288, 364, 773, 911, and 1061 keV, are seen. In addition, this spectrum shows many new prompt rays, namely the 211, 245, 264, 414, 497, 541, 613 and 1195 keV transitions (marked with asterisk). Besides, the 128 and 973 keV transitions are also seen (marked with hash) are observed in both (Fig. 8(a)) and delayed spectrum () (Fig. 8(b)). The inset in Fig. 8(a) shows the prompt - coincidence spectrum (-) with a sum gate on the 264, 364 and 414 keV prompt transitions. This spectrum shows that the 264, 364, 414, 497, 911 and 1061 keV transitions are in coincidence. The delayed -ray () singles spectrum, with 0 4 s is shown in Fig. 8(b). This spectrum shows new delayed -ray transitions namely, 128, 153, 189, 259, 360, 385, 524, 556, 697, 767, 844, 973, 1181, 1540 and 1617 keV (marked with hash), in addition to the known 773 and 1061 keV transition. The delayed - coincidence spectrum (-) with gate on the 773 keV transition is shown in the inset of Fig. 8(b). This spectrum shows that the 153, 767 and 844 keV are in coincidence with the 773 keV transition. Figure 8(c) shows the prompt spectrum () in coincidence with any delayed -ray transition with 0 4 s is shown in Fig. 8(c). The inset in Fig. 8(c) shows the - coincidence spectrum with gate on the newly identified 541 and 1195 keV transitions. This spectrum shows that 211, 245, 541 and 1195 keV transitions are in coincidence and placed above the () isomer. But Fig. 8(c) shows 613 keV transition which is not present in the inset of Fig. 8(c). Hence, the 613 keV transition is placed above the () isomer. Fig. 8(d) and (e) shows the decay curves for 153 and 773 keV transitions. An exponential fit for these curves yields values 217(7) ns (using one-component fit) and 500(20) ns (using two-component fit with one component fixed to 217 ns), respectively. This gives B(E2; ) = 23.1(8) e2fm4.
III.8 129Sb
References Genevey et al. (2003); Huck et al. (1982); Stone (1987) reported the previous -ray spectroscopy measurements on 129Sb. The level scheme as obtained in the present work is shown in Fig. 1. Table 8 shows the properties of all the transitions assigned in this work.
| Eγ | Iγ | |||
| 156.1 | 55(4) | (21/2 23/2+ | 2295 | 2139 |
| 314.7 | 44(4) | (27/2 (25/2 | 3075 | 2761 |
| 529.7 | 69(10) | (27/2 (23/2 | 3469 | 2939 |
| 622.1 | 100 | (25/2 23/2+ | 2761 | 2139 |
| 1078.6 | 100 | (23/2 19/2- | 2939 | 1851 |
| 98.3 | 38(7) | 23/2 19/2+ | 2139 | 2040 |
| 189.2 | 71(34) | 19/2 19/2- | 2040 | 1851 |
| 234.0 | 35(16) | 19/2 (17/2 | 2040 | 1806 |
| 732.5 | 47(17) | 15/2 11/2+ | 1861 | 1128 |
| 755.0 | 37(15) | (15/2 11/2+ | 1883 | 1128 |
| 1128.5 | 100 | 11/2 7/2+ | 1128 | 0 |
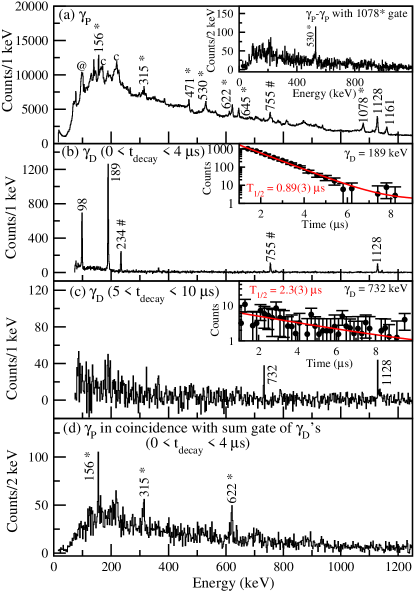
The and gated -ray spectra for 129Sb are shown in Fig. 9. The tracked Doppler corrected prompt singles -ray spectrum () for 129Sb is shown in Fig. 9(a). The previously observed 1128 and 1161 keV transitions are seen. Many new prompt -ray transitions, namely 156, 315, 471, 530, 622, 645 and 1078 keV transitions are identified (marked with an asterisk). The 755 keV (marked with an hash) is observed in both prompt () (Fig. 9(a)) and delayed spectrum () (Fig. 9(b)). The 1161 keV is actually depopulating the state to the ground-state Huck et al. (1982); Stone (1987), and this is not shown in the current level scheme. The inset shows the tracked Doppler corrected prompt - coincidence spectrum with gate on the newly identified 1078 keV transition. This spectrum shows that the 530 and 1078 keV transitions are in coincidence. A similar coincidence spectrum is obtained for the 315 and 622 keV transitions (not shown in this figure). However, no coincidences are seen upon gating on the 471 and 645 keV transitions, and hence these are not placed in the level scheme. The delayed singles -ray () spectrum for 0 4 s is shown in Fig. 9(b), yielding 98, 189, 234, 755 and 1128 keV transitions, as expected from the previous works. The 234 and 755 keV transitions are newly observed (marked with hash). The 234 keV is placed below the state decaying to state, by following the systematics with the 120 keV in 127 Sb and 108 keV in 131Sb. The 755 keV on the other hand is assigned to be depopulating the ) to the state, in accordance with the 852 keV in 127Sb and the shell model calculations. The required 157 keV from to , as seen in the lower odd-A Sb isotopes (442, 332, 247 keV in 123-127Sb, respectively), is not seen in the delayed spectrum. The half-life fit (one-component) for the decay spectrum upon gating on 189 keV transition yields a value of = 0.89(3) s (in agreement with the value of 1.1(1) s reported in Ref. Genevey et al. (2003)), which gives B(E2; ) = 25.3(8) e2fm4 for the state. Similarly, Fig. 9(c) shows the -ray spectrum for 5 10 s, leading to 732 and 1128 keV transitions. A half-life fit (two-component with one component fixed to 0.89 s) for the decay spectrum upon gating on 732 keV transition yields a value of = 2.3(3) s for the state (in agreement with the value of 2.2(2) s reported in Ref. Genevey et al. (2003)). The tracked Doppler corrected in coincidence with the sum gate of ’s, namely 98, 189, 234 and 755 keV delayed transitions (0 4 s) is shown in Fig. 9(d). This spectrum yields the newly identified prompt 156, 315 and 622 keV -ray transitions. Thus, all these transitions are placed above the isomer. Since the 156 keV transition is not observed in coincidence with 315 and 622 keV transitions (not shown in this figure), it is assigned depopulating from to state, in accordance with the 161 keV in 127Sb and 206 keV in 131Sb. In addition, the in coincidence with all these newly observed prompt transitions are studied and all of these yield the 98, 189 and 1128 keV transitions (not shown in this figure). The tracked Doppler corrected in coincidence with any for 5 10 s, did not result in any new prompt rays and hence no transitions are placed above the isomer. No prompt-delayed correlations could be carried out for the isomer, as it has a very long half-life of 17.7 min. As the inset of Fig. 9(a) shows the coincidence of 530 and 1078 keV transitions and a similar systematics has been observed in the lower odd-A Sb isotopes, these transitions are placed above the isomer.
III.9 130Sb
| Eγ | Iγ | |||
| 504.9 | 100 | (12 (11 | 2050 | 1545 |
| 821.8 | 48(8) | (13 (12 | 2872 | 2050 |
| 84.7 | 11(10) | 6 8- | 85 | 0 |
| 272.1 | 23(9) | (10 (9 | 1143 | 871 |
| 365.2 | 113(42) | (11 (10 | 1508 | 1143 |
| 871.1 | 29(7) | (9 8- | 871 | 0 |
| 1143.4 | 100 | (10 8- | 1143 | 0 |
Previous measurement on the high-spin states using -ray spectroscopy in 130Sb was reported in Ref. Genevey et al. (2002). The level scheme as obtained in the present work is shown in Fig. 1. Table. 9 shows the properties of all the transitions assigned in this work.
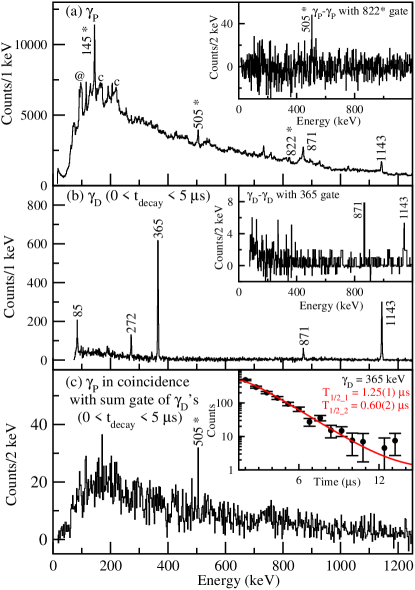
The and gated -ray spectra for 130Sb are shown in Fig. 10. The tracked Doppler corrected prompt singles -ray spectrum () for 130Sb is shown in Fig. 10(a). The already known 871 and 1143 keV rays are observed. In addition, three new prompt transitions, namely 145, 505 and 822 keV transitions are observed, which are marked with an asterisk. The inset in Fig. 10(a) shows the tracked Doppler corrected prompt - coincidence spectrum (-) with gate on the newly identified 822 keV transition. This shows that the 505 and 822 keV transitions are in coincidence, as shown in the level scheme. But 145 keV is not observed in coincidence and hence not placed in the level scheme. Figure. 10(b) shows the delayed -ray () singles spectrum with 0 5 s. All the known delayed rays, namely 85, 272, 365, 871 and 1143 keV transitions are observed. The delayed - (-) coincidence spectrum with gate on 365 keV transition is shown in the inset of Fig. 10(b). Figure 10(c) shows the tracked Doppler corrected in coincidence with the sum gate of = 365 and 1143 keV transitions. This yields the newly identified 505 keV transition. As from the inset of Fig. 10(a), the 505 and 822 keV transitions are seen in coincidence, these two transitions are placed above the () state, following the systematics with the lower even-A Sb isotopes. The inset in Fig. 10(c) shows the decay curve for the delayed 365 keV transition. A one-component fit to this transition yielded a value shorter than 1.8(2) s for the () state Genevey et al. (2002). The discrepancy in the of () state may be due to the time of flight of 2 s for the setup used in Ref. Genevey et al. (2002), that bias the measurement of the half-life to higher values. Thus, the () state might also have a half-life, as observed in the lower even-A Sb isotopes. A two component fit (as shown in the lower inset in Fig. 10(c)) was carried out, which yielded a half-life of 1.25(1) s for the (13+) state and 0.600(15) s for the () state. The B(E2; ) = 105(6) e2fm4 was obtained.
III.10 131Sb
The high-spin -ray spectroscopy of 131Sb was previously reported in Refs. J. Genevey et al. (2000); Schussler et al. (1977). The level scheme as obtained in the present work is shown in Fig. 1. Table 10 shows the properties of all the transitions assigned in this work.
| Eγ | Iγ | |||
| 206.1 | 56(4) | (21/2 23/2+ | 2372 | 2166 |
| 313.3 | 16(3) | (25/2 (23/2 | 3461 | 3148 |
| 768.7 | 100 | (25/2 23/2+ | 2935 | 2166 |
| 776.0 | 38(5) | (23/2 (21/2 | 3148 | 2372 |
| 820.0 | 43(4) | (27/2 (25/2 | 3755 | 2935 |
| 1755.7 | 36(5) | (31/2 (27/2 | 5510 | 3755 |
| 96.3 | 11(8) | 23/2 19/2+ | 2166 | 2070 |
| 343.6 | 30(11) | 19/2 17/2- | 2070 | 1726 |
| 382.4 | 16(6) | 19/2 19/2- | 2070 | 1688 |
| 450.0 | 61(22) | 15/2 11/2+ | 1676 | 1226 |
| 1226.2 | 100 | 11/2 7/2+ | 1226 | 0 |
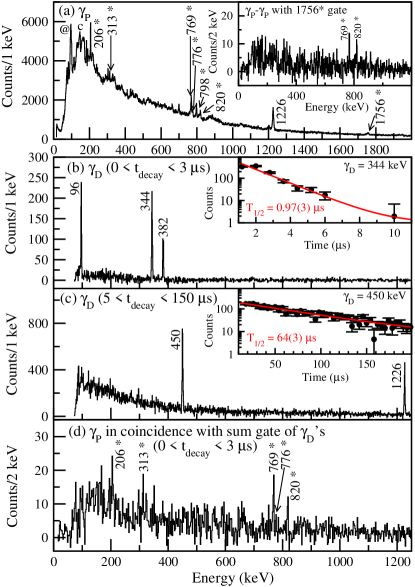
The and gated -ray spectra for 131Sb are shown in Fig. 11. The tracked Doppler corrected prompt singles -ray spectrum () for 131Sb is shown in Fig. 11(a). The previously known 1226 keV transition is seen in this spectrum. However the other transitions, namely, 96, 344, 382, and 450 keV are not seen in Fig. 11(a), as these decay directly from long-lived isomers. In addition, many new prompt -ray transitions, namely 206, 313, 769, 776, 798, 820 and 1756 keV transitions, are identified (marked with an asterisk). The inset shows the tracked Doppler corrected prompt - coincidence spectrum with gate on the newly idientified 1756 keV transition. This spectrum shows that the 769, 820 and 1756 keV transitions are in coincidence. A similar coincidence spectrum is obtained for the 206, 313 and 776 keV transitions (not shown in this figure). However, no coincidences could be observed with a gate on the 798 keV transition, and hence this is not placed in the level scheme. The delayed singles -ray () spectrum for 0 3 s is shown in Fig. 11(b), yielding 96, 344 and 382 keV transitions, as observed in previous measurements. The half-life fit (one-component) for the decay spectrum upon gating on 344 keV transition yields a value of = 0.97(3) s for the state (in agreement with the value of 1.1(2) s given in Ref. J. Genevey et al. (2000)), yielding B(E2; ) = 24.6(8) e2fm4. Similarly, Fig. 11(c) shows the delayed -ray spectrum for 5 150 s, leading to 450 and 1226 keV transitions. A half-life fit (using a three component fit with two compnents fixed to 0.97 s and 4.3 s) for the decay spectrum upon gating on 450 keV transition yields a value of = 64(3) s for the state (in agreement with 65(5) s quoted by Ref. J. Genevey et al. (2000)). The B(E2; ) = 41(8) e2fm4, as given in Ref. Judson et al. (2007). The tracked Doppler corrected in coincidence with the sum gate of the ’s, namely 96, 344 and 382 keV delayed transitions (for 0 3 s) is shown in Fig. 11(d). This spectrum yields almost all the newly identified prompt -ray transitions, that are placed above the isomer. In addition, the in coincidence with all the newly observed prompt transitions are studied and all of these yield the 96, 344 and 382 keV transitions (not shown in this figure). However, the tracked Doppler corrected in coincidence with any for 5 150 s, did not result in any new prompt rays and hence no transitions are placed above the isomer. Also, no transitions could be placed above the isomer.
IV Discussion
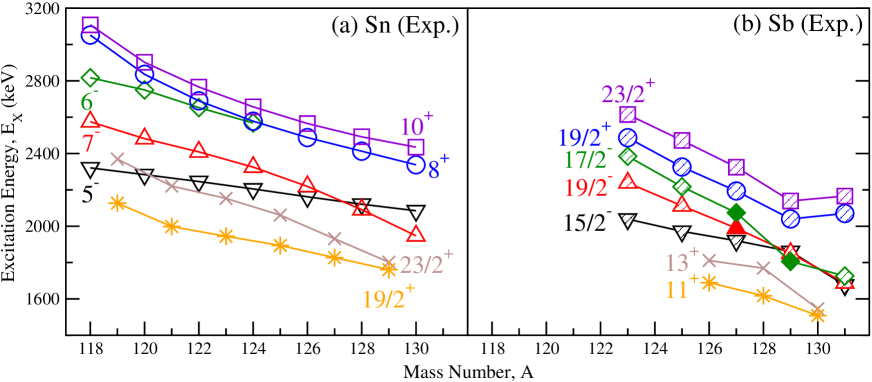
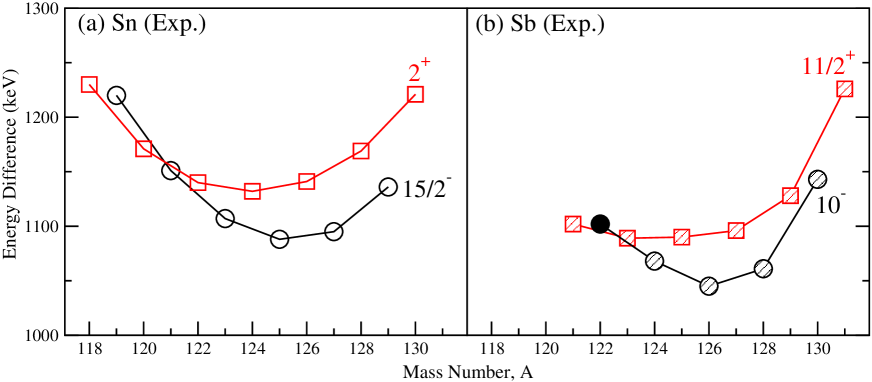
A systematic study of both odd-A and even-A 122-131Sb isotopes was carried out in this work. The observed excited states in 122-131Sb (Z = 51) isotopes have a close correspondence with those in 121-130Sn (Z = 50) isotopes. This can be evidenced from the similarities in the energy differences of the low-lying states in the even-A/odd-A Sn i.e. and odd-A/even-A Sb i.e. , respectively. This is depicted in Fig. 12. Similar correspondence for selected high-spin states is presented in Fig. 13. These similarities are due to the fact that the Sb isotopes have a single valence proton particle in the orbital in addition to neutrons in the corresponding Sn isotopes.
A better understanding of the aforementioned correspondence for the high-spin states in Sb and Sn isotopes was achieved by performing shell model calculations, with the interaction used in Ref. Rejmund et al. (2016) (denoted by SM1). The model space was constituted of a restricted single-particle space consisting of active particles, the neutrons in () , , orbits, and a proton in () orbit near the Fermi surface. This interaction was derived from the original jj55pn interaction Hjorth-Jensen et al. (1995), where the diagonal Two-Body Matrix Elements (TBMEs) were adjusted to account for the missing correlations in the restricted model space. The modified (original) multiplets, used in Ref. Rejmund et al. (2016) were:
(i) = -0.6048 (-0.3024), and 0.22104 (0.14814) for and 2, respectively;
(ii) = -0.959904 (-0.59994) for ;
(iii) = -1.88544 (-0.94545), -0.88533 (-0.435330), 0.20683 (0.10683), 0.27145 (0.17145), and 0.33148 (0.23148) for and 10, respectively;
(iv) = -0.08335 (0.016650) for ; and
(v) = 0.05607 (-0.06399), for ;
where represents the Hamiltonian.
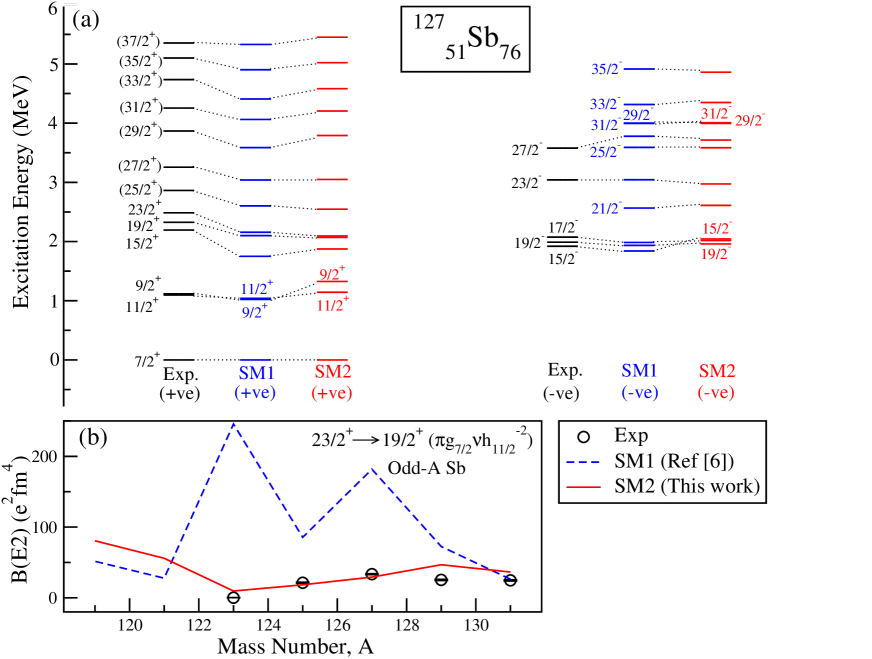
Effective charges of = 0.9 and = 1.8 were chosen to reproduce the known values in 130Sn and 134Te isotopes. The calculations were performed using the shell model code, NATHAN Caurier et al. (1999). Using SM1, the excitation energies could be well reproduced, while the binding energies and transition probabilities were not properly reproduced. This is illustrated for 127Sb for the level energies and for the in odd-A Sb isotopes in Fig. 14. Similar inconsistencies were observed for the other isomeric transitions (not shown in the figure).
Therefore, to improve the agreement of values, the following parameters of the shell model interaction were modified (denoted by SM2):
(i) the monopole part of was reduced by 185 keV, which led to an improved reproduction of the binding energies and the for the even-A Sn isotopes;
(ii) the monopole part of was reduced by 450 keV, which led to a better reproduction of the in odd-A Sb isotopes;
(iii) the pairing term, , was increased by 260 keV, which led to the agreement of all the values, except those for the odd-A Sb isotopes. Also, all the excitation energies became higher by 2 MeV;
(iv) the pairing term, , was increased by 140 keV, to compensate for this increase in excitation energies as well as seeing to it that the ’s of all the Sn and Sb do not change drastically;
(v) the () was reduced by 400 keV, which reproduced the ’s for the odd-A Sb as well; and
(vi) the monopole part of was increased by 30 keV to achieve a better reproduction of in odd-A Sn isotopes.
These modifications led to the reproduction of the binding energies (within 2 MeV), excitation energies (within 500 keV) and the transition strengths (within 50 ) for the isotopic chains of 119-130Sn and 121-131Sb. The energies of the excited states for 127Sb and the improved values for the odd-A Sb isotopes are shown in Fig. 14. The reason behind the large discrepancy in the ’s between SM1 and SM2 can be understood based on the difference in the wavefunctions obtained in both calculations. The wavefunctions from SM2 are much more fragmented configuration wise than those in SM1, leading to the dramatic reduction in the values.
IV.1 Excitation energies
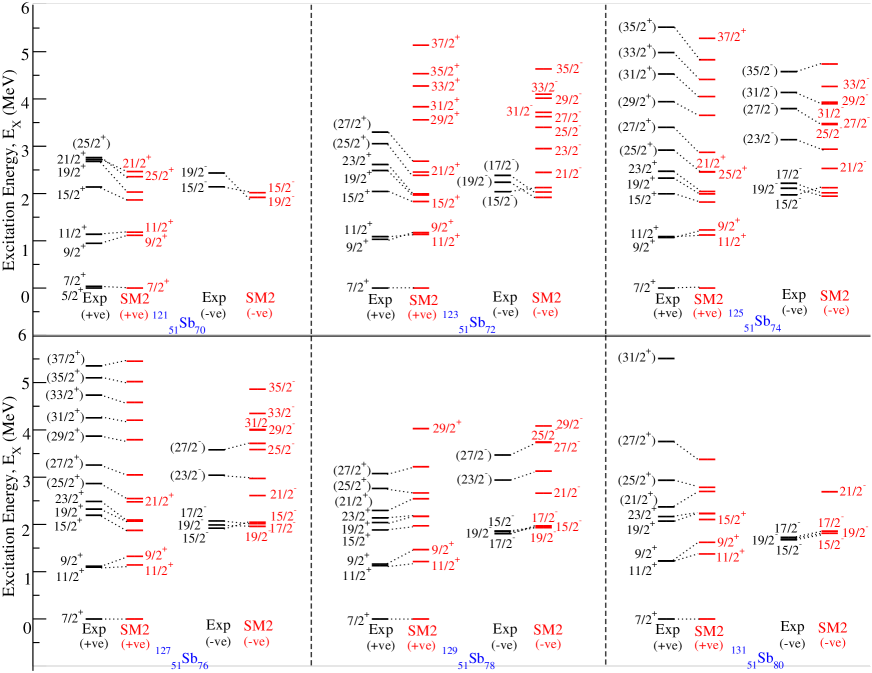
A comparison of the experimental (black) and calculated (red) level schemes (using SM2) for both the positive (+ve) and negative (-ve) parities in odd-A 123-131Sb isotopes is shown in Fig. 15. The data for 121Sb is taken from Ref. Watanabe et al. (2009a) and is also shown in this figure for comparison. The calculated order for the and states are inverted only for the odd-A 123-125Sb isotopes. A mismatch in the ordering of the , and states are observed in 121-129Sb isotopes, as these states are very close in energy. Similarly, Fig. 16 shows the comparison of the experimental (black) and calculated (red) level schemes for both the positive (+ve) and negative (-ve) parities in even-A 122-130Sb isotopes. The data for 120Sb is taken from Ref. Liu et al. (2014) and is also shown in this figure for comparison. This figure shows that the experimental energies are in reasonable agreement with the theoretical calculations.
Isomeric , , and were previously observed in odd-A Sb isotopes. These were interpreted as the odd proton coupled to the known isomeric , , and states in the corresponding even-(A-1) Sn isotopes, respectively Apt (1974). These states along with the and states for even-A Sn and the and states for odd-A Sb are shown in Fig. 13(a) and (b), respectively. In addition, the evolution of and states in odd-A Sn; and and states in even-A Sb are shown in these plots. The newly identified ) and ) states in 127Sb; and the ) state in 129Sb (from the current experimental analysis) fit in the systematics. Comparison with the Sn isotopes shows that the energies of the positive-parity states in Sb follow a similar pattern to that of the Sn isotopes, with a slight dip in the case of 129Sb. Also, the crossing of the and observed at 128Sn is seen in the equivalent states in 129Sb. In addition, the newly identified and states in even-A Sb isotopes follow a similar pattern to the corresponding and states in odd-A Sn isotopes.
IV.2 Transition probabilities
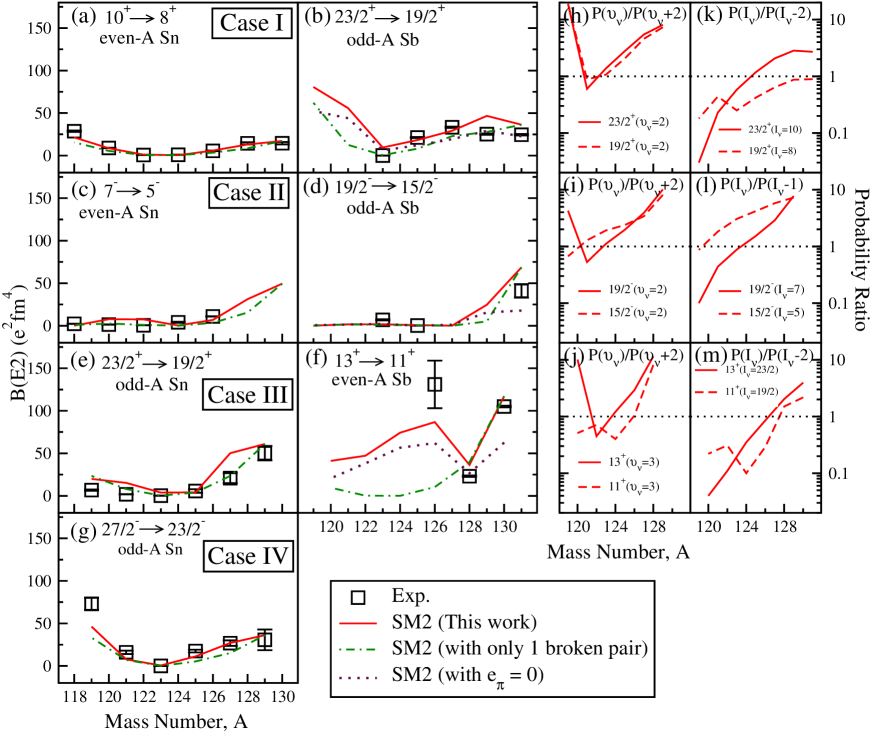
The experimental values along with SM2 shell model calculations are shown in Fig. 17.
Case I: (a) in even-A 118-130Sn Fogelberg et al. (1981); Broda et al. (1992); Iskra et al. (2016), (b) in odd-A 123-131Sb (see text),
Case II: (c) in even-A 118-126Sn Iskra et al. (2016), (d) in odd-A 123-131Sb (see text),
Case III: (e) in odd-A 119-129Sn Lozeva et al. (2008); Iskra et al. (2016), (f) states in the even-A 126-130Sb (see text), and
Case IV: (g) in odd-A 119-129Sn isotopes Mayer et al. (1994); Lozeva et al. (2008); Iskra et al. (2016).
The full calculations are shown by red solid lines, those restricted to one broken pair are shown by dash-dotted green lines, and the full calculations with proton effective charge, = 0, are shown by dotted violet lines. The seniority mixing, represented by the ratio of probabilities of lowest, natural () and higher () neutron seniorities , are shown in Fig. 17 (h-j) for Cases I-III, respectively. The dotted black line with = 1 represents that the mixing of seniorities, and , are equal. Similarly, Fig. 17 (k-m) for Cases I-III, respectively, denote the neutron angular momentum mixing, represented by the ratio of probabilities of highest () and lower ( or ) neutron angular momenta or . The dotted black line, similar to the case of neutron seniorities, denotes that the mixing of and or are equal.

The present calculations agree well with the experimental values and the experimental trends are reproduced. In general, the shape of the curves for Sn follow a parabolic behaviour, as expected for seniority scheme. The full calculation and the one restricted to one broken pair, in Sn, are very similar and also the calculated neutron seniority = 2, 3 dominates for odd-A, even-A Sn, respectively. In addition, the behaviour of for odd-A Sb isotopes is similar to that of the corresponding Sn, except the even-A Sb. The proton charge () does not have a considerable impact on the , except in even-A Sb. A detailed discussion of the four different cases, mentioned above, is given below:
Case I: From shell model calculations, it is seen that the dominant configuration of the and states in even-A Sn is , while that of the and states in odd-A Sb is . The nature of the curves in Fig. 17 (a) and (b) is not completely identical. This is evident from the differences in the full calculations and that restricted to one broken pair in Sb. For a microscopic understanding behind this difference, a comparison of the neutron seniority for the and states was carried out. Figure. 17 (h) shows that the lowest neutron seniority is mixed with for both states. The mixing increases with the increasing number of valence neutron holes. However, for the lowest A, the number of available neutron pairs is reduced in the restricted model space, which leads to a sudden drastic decrease in seniority mixing.
In addition to mixing of neutron seniorities, neutron angular momentum mixing is also observed, as shown in Fig. 17 (k). The angular momentum mixing also increases with increase in the number of valence neutron holes. A comparison of neutron seniority and neutron angular momentum mixing plots shows that the angular momentum mixing is the dominant one.
Case II: Shell model calculations show that the dominant configuration of the and states in even-A Sn is , while that of the and states in odd-A Sb is . The nature of the curves in Fig. 17 (c) and (d) is similar. A comparison of the neutron seniority for the and states was carried out. Figure. 17 (i) shows that the lowest neutron seniority is mixed with the for both the states, similar to Case I. In addition to mixing of neutron seniorities, neutron angular momentum mixing is also observed, as shown in Fig. 17 (l), which is of similar order as the seniority mixing. The angular momentum mixing also increases with increase in the number of valence neutron holes.
Case III: The shell model calculations show that the dominant configuration of the and states in odd-A Sn is , while that of the and states in even-A Sb is . The nature of the curves in Fig. 17 (e) and (f) is significantly different. This is also evident from the differences in the full calculations and that restricted to one broken pair in Sb. The calculations with proton charge restricted to 0 show that the neutrons have a considerable impact on the in even-A Sb. For a microscopic understanding behind this difference, a comparison of the neutron seniority for the and states was carried out. Figure. 17 (j) shows that the lowest neutron seniority is mixed with the for both states. The mixing increases with the increase in the number of valence neutron holes. In addition to mixing of neutron seniorities, neutron angular momentum mixing is also observed, as shown in Fig. 17 (m). The angular momentum mixing also increases with increase in the number of valence neutron holes. A comparison of neutron seniority and neutron angular momentum mixing plots show that the angular momentum mixing is the dominant one, just like in the Case I. It can be noted that around , as compared to the earlier two cases, both the seniority and angular momentum mixing are significant; the higher seniority () and the lower angular momentum () dominate the and states.
Case IV: The shell model calculations show that the dominant configuration of the and states in odd-A Sn is . The corresponding isomer in even-A Sb with configuration is expected at . In the present work, the states in 126,128Sb decay by transitions to states, and hence no isomer was observed. In 120Sb, in contrast, the state decays via a 148 keV transition to the state and has a half-life ns Liu et al. (2014). The nature of the curve in Fig. 17 (g) is a parabola, similar to Fig. 17 (a). The present calculations show that the dominant seniority for these states is = 3, which in fact is in agreement with the calculations assuming only one broken pair.
IV.3 Neutron pair breaking energies
A striking feature of the constancy of the energy differences, where the increase in the number of broken neutron pairs is involved, was observed and is shown in Fig. 18. Figure 18(a) shows particular states in even-A Sn () (124Sn), and odd-A Sn () (125Sn) isotopes, which involve the breaking of a pair of neutrons, leading to increase in seniority from to , where at different excitation energies. Similar states in odd-A Sb () (125Sb) and even-A Sb () (126Sb) isotopes are also shown in the same figure. All the arrows represent the energy difference quantum with magnitude of 1.1 MeV. The blue arrow represents breaking of first pair of neutrons in even-A Sn ()). The red arrows are for all the other transitions. A plot of the energy differences in 119-130Sn and 121-131Sb isotopes is shown in Fig. 18(b). A subset of this figure, including only the lower spins, was shown earlier in Fig. 12. This figure shows that the average energy for the breaking of the first and second pair of neutrons is 1.1 MeV, and this is constant (with a deviation of 100 keV) for a wide range of mass numbers, irrespective of the excitation energy and mixing of neutron seniorities () in the case of Sn and Sb. In addition, it follows the behaviour of even-A Sn () isotopes.
V Summary and Conclusions
The neutron-rich 122-131Sb isotopes were produced as fission fragments in the reaction 9Be (238U, f) with 6.2 MeV/u beam energy. The isomers already known in the odd-A 123-131Sb isotopes were confirmed and a number of new prompt and delayed transitions were identified for all these isotopes. New isomers, prompt and delayed rays were identified in the even-A 122-130Sb isotopes. These results could be achieved using the unique combination of AGATA, VAMOS++ and EXOGAM detectors, which was used for the prompt-delayed spectroscopy of fission fragments. A good agreement was achieved between the experiment and the results of the shell-model calculations in the restricted model space using an optimised interaction. Also the level schemes were in good agreement with that of the corresponding states in the Sn isotopes. The presence of a single valence proton particle in the orbital leads to a neutron seniority mixing and neutron angular momentum mixing in the Sb isotopes for all the states. The angular momentum mixing, in general, was found to be significantly stronger than the seniority mixing. This work shows that further experimental work is required to search for new isomers in the even-A 122,124Sb isotopes, which could not be observed in this work either due to low statistics, too long half-life or too short half-life. This will give more insight into the nature of the values, and hence the mixing of seniorities and angular momenta due to the interaction.
VI Acknowledgements
The authors would like to thank the AGATA Collaboration for the availability of the AGATA -ray tracking array at GANIL. We acknowledge the important technical contributions of GANIL accelerator staff. We thank C. Schmitt and A. O. Macchiavelli for help in various aspects of data collection. We also thank P. Van Isacker for his valuable discussions on the theoretical interpretation and careful reading of the manuscript. PB and AM acknowledge support from the Polish National Science Centre (NCN) under Contract No. 2016/22/M/ST2/00269 and the French LEA COPIGAL project. SBi, RB, SBh, SBh and RP acknowledge support from CEFIPRA project No. 5604-4 and the LIA France-India agreement. HLC and PF acknowledge support from the U.S. Department of Energy, Office of Science, Office of Nuclear Physics under Contract No. DE-AC02-05CH11231 (LBNL). RMPV acknowledge partial support by Ministry of Science, Spain, under the grants BES-2012-061407, SEV-2014-0398, FPA2017-84756-C4 and by EU FEDER funds. AJ was supported by the Spanish Ministerio de Economía y Competitividad under contract FPA2017-84756-C4-2-P.
References
- Casten (2000) R. F. Casten, Nuclear Structure from a Simple Perspective (Oxford Science Publications, 2000).
- nud (2019) NUDAT2, http://www.nndc.bnl.gov/nudat2/ (2019).
- Togashi et al. (2018) T. Togashi, Y. Tsunoda, T. Otsuka, N. Shimizu, and M. Honma, Phys. Rev. Lett. 121, 62501 (2018).
- Maheshwari (2016) B. Maheshwari and A. K. Jain, Phys. Lett. B 753, 122 (2016).
- Morales et al. (2018) A. I. Morales, G. Benzoni, H. Watanabe, G. de Angelis, S. Nishimura, L. Coraggio, A. Gargano, N. Itaco, T. Otsuka, Y. Tsunoda, P. Van Isacker, F. Browne, et al., Phys. Lett. B 781, 706 (2018).
- Rejmund et al. (2016) M. Rejmund, A. Navin, S. Biswas, A. Lemasson, M. Caamaño, E. Clément, O. Delaune, F. Farget, G. de France, B. Jacquot, and P. Van Isacker, Phys. Lett. B 753, 86 (2016).
- Bhattacharyya et al. (2001) P. Bhattacharyya, P. J. Daly, C. T. Zhang, Z. W. Grabowski, S. K. Saha, R. Broda, B. Fornal, I. Ahmad, D. Seweryniak, I. Wiedenhöver, M. P. Carpenter, R. V. F. Janssens, et al., Phys. Rev. Lett 87, 062502 (2001).
- Cottle (2010) P. Cottle, Nature 465, 561 (2010).
- Jones et al. (2010) K. L. Jones, A. S. Adekola, D. W. Bardayan, J. C. Blackmon, K. Y. Chae, K. A. Chipps, J. A. Cizewski, L. Erikson, C. Harlin, R. Hatarik, R. Kapler, R. L. Kozub, et al., Nature 465, 454 (2010).
- Rosiak et al. (2018) D. Rosiak, M. Seidlitz, P. Reiter, H. Naïdja, Y. Tsunoda, T. Togashi, F. Nowacki, T. Otsuka, G. Colò, K. Arnswald, T. Berry, A. Blazhev, et al., Phys. Rev. Lett. 121, 252501 (2018).
- Coraggio et al. (2015) L. Coraggio, A. Covello, A. Gargano, N. Itaco, and T. T. S. Kuo, Phys. Rev. C 91, 041301(R) (2015).
- Teruya et al. (2015) E. Teruya, N. Yoshinaga, K. Higashiyama and A. Odahara, Phys. Rev. C 92, 034320 (2015).
- Biswas et al. (2016) S. Biswas, R. Palit, A. Navin, M. Rejmund, A. Bisoi, M. S. Sarkar, S. Sarkar, S. Bhattacharyya, D. C. Biswas, M. Caamaño, M. P. Carpenter, D. Choudhury, et al., Phys. Rev. C 93, 034324 (2016).
- Wang et al. (2017) H.-K. Wang, S. K. Ghorui, K. Kaneko, Y. Sun, and Z. H. Li, Phys. Rev. C 96, 054313 (2017).
- Kim et al. (2018) Y. H. Kim, M. Rejmund, P. Van Isacker and A. Lemasson, Phys. Rev. C 97, 041302(R) (2018).
- Fogelberg et al. (1981) B. Fogelberg, K. Heyde and J. Sau, Nucl. Phys. A 352, 157 (1981).
- Pietri et al. (2011) S. Pietri, A. Jungclaus, M. Górska, H. Grawe, M. Pfützner, L. Cáceres, P. Detistov, S. Lalkovski, V. Modamio, Z. Podolyák, P. H. Regan, D. Rudolph, et al., Phys. Rev. C 83, 044328 (2011).
- Astier et al. (2012) A. Astier, M.-G. Porquet, C. Theisen, D. Verney, I. Deloncle, M. Houry, R. Lucas, F. Azaiez, G. Barreau, D. Curien, O. Dorvaux, G. Duchêne, et al., Phys. Rev. C 85, 054316 (2012).
- Iskra et al. (2014) W. Iskra, R. Broda, J. Wrzesinski, M. P. Carpenter, C. J. Chiara, B. Fornal, N. Hoteling, R. V. Janssens, F. G. Kondev, W. Królas, T. Lauritsen, T. Pawat, et al., Act. Phys. Pol. B 89, 395 (2014).
- Lozeva et al. (2008) R. L. Lozeva, G. S. Simpson, H. Grawe, G. Neyens, L. A. Atanasova, D. L. Balabanski, D. Bazzacco, F. Becker, P. Bednarczyk, G. Benzoni, N. Blasi, A. Blazhev, et al., Phys. Rev. C 77, 064313 (2008).
- Iskra et al. (2016) L. W. Iskra, R. Broda, R. V. F. Janssens, C. J. Chiara, M. P. Carpenter, B. Fornal, N. Hoteling, F. G. Kondev, W. Królas, T. Lauritsen, T. Pawłat, D. Seweryniak, et al., Phys. Rev. C 93, 014303 (2016).
- Judson et al. (2007) D. S. Judson, A. M. Bruce, T. Kibédi, G. D. Dracoulis, A. P. Byrne, G. J. Lane, K. H. Maier, C.-B. Moon, P. Nieminen, J. N. Orce, and M. J. Taylor, Phys. Rev. C 76, 054306 (2007).
- Watanabe et al. (2009a) H. Watanabe, G. J. Lane, G. D. Dracoulis, T. Kibédi, A. P. Byrne, P. Nieminen, R. O. Hughes, F. G. Kondev, M. P. Carpenter, R. V. F. Janssens, T. Lauritsen, D. Seweryniak, et al., Phys. Rev. C 79, 024306 (2009a).
- Watanabe et al. (2009b) H. Watanabe, G. J. Lane, G. D. Dracoulis, a. P. Byrne, P. Nieminen, F. G. Kondev, K. Ogawa, M. P. Carpenter, R. V. F. Janssens, T. Lauritsen, D. Seweryniak, S. Zhu, et al., Eur. Phys. J. A 42, 163 (2009b).
- Genevey et al. (2003) J. Genevey, J. A. Pinston, H. R. Faust, R. Orlandi, A. Scherillo, G. S. Simpson, I. S. Tsekhanovich, A. Covello, A. Gargano, and W. Urban, Phys. Rev. C 67, 054312 (2003).
- J. Genevey et al. (2000) J. Genevey, J.A. Pinston, H. Faust, C. Foin, S. Oberstedt, and M. Rejmund, Eur. Phys. J. A 9, 191 (2000).
- Rejmund et al. (2011) M. Rejmund, B. Lecornu, A. Navin, C. Schmitt, S. Damoy, O. Delaune, J. M. Enguerrand, G. Fremont, P. Gangnant, L. Gaudefroy, B. Jacquot, J. Pancin, et al., Nucl. Instr. and Meth. A 646, 184 (2011).
- Navin et al. (2014) A. Navin, M. Rejmund, C. Schmitt, S. Bhattacharyya, G. Lhersonneau, P. van Isacker, M. Caamaño, E. Clément, O. Delaune, F. Farget, G. de France, and B. Jacquot, Phys. Lett. B 728, 136 (2014).
- Navin (2014) A. Navin and M. Rejmund, “Gamma-ray spectroscopy of neutron-rich fission fragments,” in Yearkbook of Encyclopedia of Science and Technology (McGraw-Hill, 2014).
- Akkoyun et al. (2012) S. Akkoyun, A. Algora, B. Alikhani, F. Ameil, G. de Angelis, L. Arnold, A. Astier, A. Ataç, Y. Aubert, C. Aufranc, A. Austin, S. Aydin, et al., Nucl. Instr. and Meth. A 668, 26 (2012).
- Vandebrouck et al. (2016) M. Vandebrouck, A. Lemasson, M. Rejmund, G. Fremont, J. Pancin, A. Navin, C. Michelagnoli, J. Goupil, C. Spitaels, and B. Jacquot, Nucl. Instr. and Meth. A 812, 112 (2016).
- Kim et al. (2017) Y. H. Kim, A. Lemasson, M. Rejmund, A. Navin, S. Biswas, C. Michelagnoli, I. Stefan, R. Banik, P. Bednarczyk, S. Bhattacharya, S. Bhattacharyya, E. Clément, et al., Eur. Phys. J. A 53, 162 (2017).
- Simpson et al. (2000) J. Simpson, F. Azaiez, G. DeFrance, J. Fouan, J. Gerl, R. Julin, W. Korten, P. Nolan, B. Nyakó, G. Sletten, and P. Walker, Act. Phys. Hung. Ser. Heavy Ion Phys. 11, 159 (2000).
- Kibédi et al. (2008) T. Kibédi, T. Burrows, M. Trzhaskovskaya, P. Davidson, and C. Nestor, Nucl. Instr. and Meth. A 589, 202 (2008).
- van Gunsteren (1977) W. F. van Gunsteren and D. Rabenstein, Z. Phys. A 282, 55 (1977).
- Langevin-Joliot et al. (1988) H. Langevin-Joliot, V. Datar, E. Gerlic, J. Van de Wiele, F. Azaiez, S. Fortier, S. Gales, J. Guillot, J. M. Maison, C. P. Massolo, G. Duhamel, and G. Perrin, Phys. Rev. C 38, 1168 (1988).
- Porquet et al. (2005) M. G. Porquet, T. Venkova, R. Lucas, A. Astier, A. Bauchet, I. Deloncle, A. Prévost, F. Azaiez, G. Barreau, A. Bogachev, N. Buforn, A. Buta, et al., Eur. Phys. J. A 24, 39 (2005).
- Jones et al. (2008) G. A. Jones, S. J. Williams, P. M. Walker, Z. Podolyák, S. Zhu, M. P. Carpenter, J. J. Carroll, R. S. Chakrawarthy, P. Chowdhury, I. J. Cullen, G. D. Dracoulis, A. B. Garnsworthy, et al., Phys. Rev. C 77, 034311 (2008).
- Ressler et al. (2010) J. J. Ressler, J. A. Caggiano, C. J. Francy, P. N. Peplowski, J. M. Allmond, C. W. Beausang, L. A. Bernstein, D. L. Bleuel, J. T. Burke, P. Fallon, A. A. Hecht, D. V. Jordan, et al., Phys. Rev. C 81, 014301 (2010).
- Apt (1974) K. E. Apt and W. B. Walters, Phys. Rev. C 9, 310 (1974).
- Huck et al. (1982) H. Huck, M. L. Pérez and J. J. Rossi, Phys. Rev. C 26, 621 (1982).
- Stone (1987) C. A. Stone and W. B. Walters, Z. Phys. A 328, 257 (1987).
- Genevey et al. (2002) J. Genevey, J. A. Pinston, C. Foin, M. Rejmund, H. Faust, and B. Weiss, Phys. Rev. C 65, 034322 (2002).
- Schussler et al. (1977) F. Schussler, J. Blachot, J. P. Bocquet and E. Monnand, Z. Phys. A 281, 229 (1977).
- Liu et al. (2014) L. Liu, S. Y. Wang, Z. Q. Chen, C. Liu, B. Qi, D. P. Sun, S. Wang, Q. An, C. J. Xu, P. Zhang, Z. Q. Li, C. Y. Niu, et al., Phys. Rev. C 90, 014313 (2014).
- Broda et al. (1992) R. Broda, R. H. Mayer, I. G. Bearden, P. Benet, P. J. Daly, Z. W. Grabowski, M. P. Carpenter, R. V. F. Janssens, T. L. Khoo, T. Lauritsen, E. F. Moore, S. Lunardi, et al., Phys. Rev. Lett. 68, 1671 (1992).
- Mayer et al. (1994) R. H. Mayer, D. T. Nisius, I. G. Bearden, P. Bhattacharyya, L. Richter, M. Sferrazza, Z. W. Grabowski, P. J. Daly, R. Broda, B. Fornal, I. Ahmad, M. P. Carpenter, et al., Phys. Lett. B 336, 308 (1994).
- Hjorth-Jensen et al. (1995) M. Hjorth-Jensen, T. T. Kuo and E. Osnes, Physics Reports 261, 125 (1995).
- Caurier et al. (1999) E. Caurier, G. Martinez-Pinedo, F. Nowacki, A. Poves, J. Retamosa, and A. P. Zuker, Phys. Rev. C 59, 2033 (1999).