Vorticity, kinetic energy, and suppressed gravitational wave production in strong first-order phase transitions
Abstract
We have performed the first 3-dimensional simulations of strong first-order thermal phase transitions in the early Universe. For deflagrations, we find that the rotational component of the fluid velocity increases as the transition strength is increased. For detonations, however, the rotational velocity component remains constant and small. We also find that the efficiency with which kinetic energy is transferred to the fluid falls below theoretical expectations as we increase the transition strength. The probable origin of the kinetic energy deficit is the formation of reheated droplets of the metastable phase during the collision, slowing the bubble walls. The rate of increase in the gravitational wave energy density for deflagrations in strong transitions is suppressed compared to that predicted in earlier work. This is largely accounted for by the reduction in kinetic energy. Current modelling therefore substantially overestimates the gravitational wave signal for strong transitions with deflagrations, in the most extreme case by a factor of . Detonations are less affected.
The Laser Interferometer Space Antenna (LISA), scheduled for launch in 2034, will open the mHz band of the emerging field of gravitational wave astronomy Audley et al. (2017). One of the most exciting goals of LISA is to probe the early universe by searching for gravitational wave signals from a first-order phase transition.
While the Standard Model is a cross-over Kajantie et al. (1996, 1997), there are many extensions with first-order phase transitions. These range from adding a scalar singlet Profumo et al. (2007); Espinosa et al. (2012); Cline and Kainulainen (2013); Profumo et al. (2015); Beniwal et al. (2019) or doublet Kakizaki et al. (2015); Dorsch et al. (2017); Basler et al. (2017), to models with spontaneously broken conformal symmetry Randall and Servant (2007); Konstandin et al. (2010); Konstandin and Servant (2011); von Harling and Servant (2018); Dillon et al. (2018); Megías et al. (2018); Bruggisser et al. (2018). There are also models with phase transitions in hidden sectors Schwaller (2015); Addazi and Marciano (2018); Aoki et al. (2017); Croon et al. (2018); Breitbach et al. (2018); Okada and Seto (2018); Hasegawa et al. (2019). Non-perturbative methods are sometimes necessary to establish the order of the phase transition Gorda et al. (2019); Gould et al. (2019); Kainulainen et al. (2019).
An important parameter of a first-order phase transition is the trace anomaly difference, which quantifies the energy available for conversion to shear stress, and hence the power of the gravitational wave signal. If the trace anomaly difference is comparable to the radiation energy density of the universe, we call the transition ‘strong’. We denote the ratio of the trace anomaly to the thermal energy , in which case a strong transition has . We call ‘very strong’; our results do not access this region.
Substantial progress has been made in understanding gravitational wave production from first-order transitions with weak () to intermediate () strength using numerical simulations Hindmarsh et al. (2014); Giblin and Mertens (2014); Hindmarsh et al. (2015, 2017), as well as modelling Hindmarsh (2018); Jinno and Takimoto (2017); Konstandin (2018). While the fluid motion is well-described as a linear superposition of sound waves after a weak transition Hindmarsh et al. (2014), rotational modes and turbulence are expected in stronger transitions Witten (1984); Kurki-Suonio (1985), which could substantially affect the gravitational wave signal Kamionkowski et al. (1994); Caprini et al. (2008); Gogoberidze et al. (2007); Caprini et al. (2009a, b); Niksa et al. (2018).
At the same time, investigation of the underlying particle physics models indicates that intermediate to strong transitions are common in conservative extensions of the Standard Model Ellis et al. (2018, 2019), and very strong transitions are possible in models of composite Higgs and nearly conformal potentials Randall and Servant (2007); Konstandin et al. (2010); Konstandin and Servant (2011); von Harling and Servant (2018); Dillon et al. (2018); Megías et al. (2018); Bruggisser et al. (2018). It is also clear that LISA will be most likely to observe transitions where nonlinear effects like shocks and turbulence become important Hindmarsh et al. (2017). Recent work tackling the non-linear regime includes gravitational wave production from magnetohydrodynamic turbulence Pol et al. (2019) and studies of shock collisions using a mixture of 1-dimensional simulations and modelling Jinno et al. (2019).
In this paper, we present results from the first numerical simulations of strong first-order phase transitions. We measure the fraction of the fluid kinetic energy in rotational modes, as traced by the mean-square velocity. As we increase the strength of the transition, this proportion grows substantially for deflagrations, with up to of the mean square velocity found in rotational motion. The rotational proportion is far less for detonations, remaining roughly constant for all transition strengths.
As the transition strength is increased, the efficiency of fluid kinetic energy production decreases below expectation. For deflagrations, this is associated with reduced wall speeds for expanding bubbles and reheating of the region in front of the walls, reducing the pressure difference Kurki-Suonio (1985); Konstandin and No (2011); Mégevand and Ramírez (2018). The kinetic energy loss leads to a suppression in the gravitational wave power, by a factor which can be as small as O(). This means that current models substantially overestimate gravitational wave production from strong transitions with deflagrations. Detonations are less affected.
We model the phase transition with a real scalar field , coupled to a perfect fluid. We assume that there is no extra physics generating a magnetic field either before or during the phase transition. The model follows that used in previous work Ignatius et al. (1994); Hindmarsh et al. (2015, 2017), differing by a change in the effective potential and therefore the equation of state. Our previous work used the high-temperature expansion of the one-loop thermal effective potential, and we found that in stronger transitions, the total energy could drop below the scalar potential energy, which is unphysical. In this scenario, our algorithm would compute the temperature to be imaginary, causing a crash. Indeed, the high-temperature expansion is known to fail well below ; for example, the speed of sound diverges and then becomes imaginary. To fix this we have introduced a simpler bag model equation of state, described below. The new equation of state changes only how the relevant thermodynamic parameters and are realised in terms of the parameters of the potential and field-fluid coupling term. The flows around the expanding bubbles, and hence the gravitational wave spectrum, depend on the underlying theory only through and the wall speed , with the overall frequency scale set by the redshifted mean bubble separation.
Our coupled field-fluid system has energy-momentum tensor
| (1) |
where , with fluid 3-velocity v and associated Lorentz factor . The internal energy and pressure are
| (2) |
and the enthalpy is .
The zero-temperature effective potential is
| (3) |
where is chosen such that , and is the value of in the broken phase at . We denote the potential energy difference between the vacua by .
We write the thermal effective potential of our bag model as
| (4) |
where models the change in degrees of freedom during the transition. We take
| (5) |
where with the effective number of relativistic degrees of freedom in the symmetric phase. Both and are stationary points of the function for all . For our choice of the minima of become degenerate at , as required.
The energy-momentum tensor can be decomposed into field and fluid parts, coupled through a friction term,
| (6) |
Ref. Hindmarsh et al. (2017) used a field- and temperature-dependent friction parameter . Although this models high temperature physics more accurately Liu et al. (1992), strong transitions can reach small temperatures and again the high-temperature approximation fails. With small temperatures we also find numerical instabilities and so revert to using a constant .
The phase transition strength is parametrised by the trace anomaly difference
| (7) |
where . The strength parameter is then
| (8) |
where is the nucleation temperature and the radiation energy density.
We assume that the duration of the phase transition is much less than the Hubble time , and neglect the effect of expansion. This is comparable to the statement that , where is the mean bubble separation. In this regime the contribution of bubble collisions to the gravitational wave signal is negligible. To neglect expansion the final simulation time must also be much smaller than . For all our simulations .
The mean gravitational wave energy density is
| (9) |
where is the simulation volume, is the transverse traceless metric perturbation and the line indicates averaging over a characteristic period of the gravitational waves. We find in Fourier space by a standard technique Garcia-Bellido et al. (2008); Hindmarsh et al. (2014, 2015), sourced only by the fluid, the dominant contribution when and Hindmarsh et al. (2014, 2015, 2017).
We express the gravitational wave energy density in terms of the parameter , with the critical energy density. Our assumptions on and ensure that at all times. They also ensure that the gravitational backreaction is negligible compared to the pressure forces, as the wavelength of the density perturbations is much less than the Jeans length , where is the energy density contrast averaged over the wavelength being considered111For the parameter space we consider, we determined that the variation of the energy density is at most a factor of twenty in the asymptotic fluid profile that develops around an expanding bubble; will be less than this due to averaging over a given wavelength.. We leave a deeper analysis of gravitational backreaction in the case to a later study.
We perform a series of three-dimensional simulations of the field-fluid system. The simulation code is the same as used in Ref. Hindmarsh et al. (2017) except for the above changes.
We scan over for three subsonic deflagrations with asymptotic wall speeds , and two detonations with . The asymptotic wall speeds, and their fluid profiles, are found with a spherically symmetric version of the code Hindmarsh et al. (2015, 2017); Kurki-Suonio and Laine (1996, 1995), run with the same parameters until . As we increase , the maximum velocity of the asymptotic fluid profile increases. For each , there is a maximum , and hence a maximum strength , above which solutions either do not exist (subsonic deflagrations), or change into hybrids. We do not consider hybrids here.
The values of needed for these wall speeds are given in the supplemental material. By comparison, the Standard Model estimate is John and Schmidt (2001); Liu et al. (1992); Moore and Prokopec (1995).
All simulations have the number of bubbles , lattice spacing , timestep , and lattice sites, giving a mean bubble separation . All bubbles are nucleated simultaneously with a gaussian profile at the same locations at the start of each simulation. The initial profile of the bubbles is insignificant as they approach the same asymptotic profile.
We fix , , and , in turn fixing . This sets the relative change in degrees of freedom to . To change the transition strength we vary .
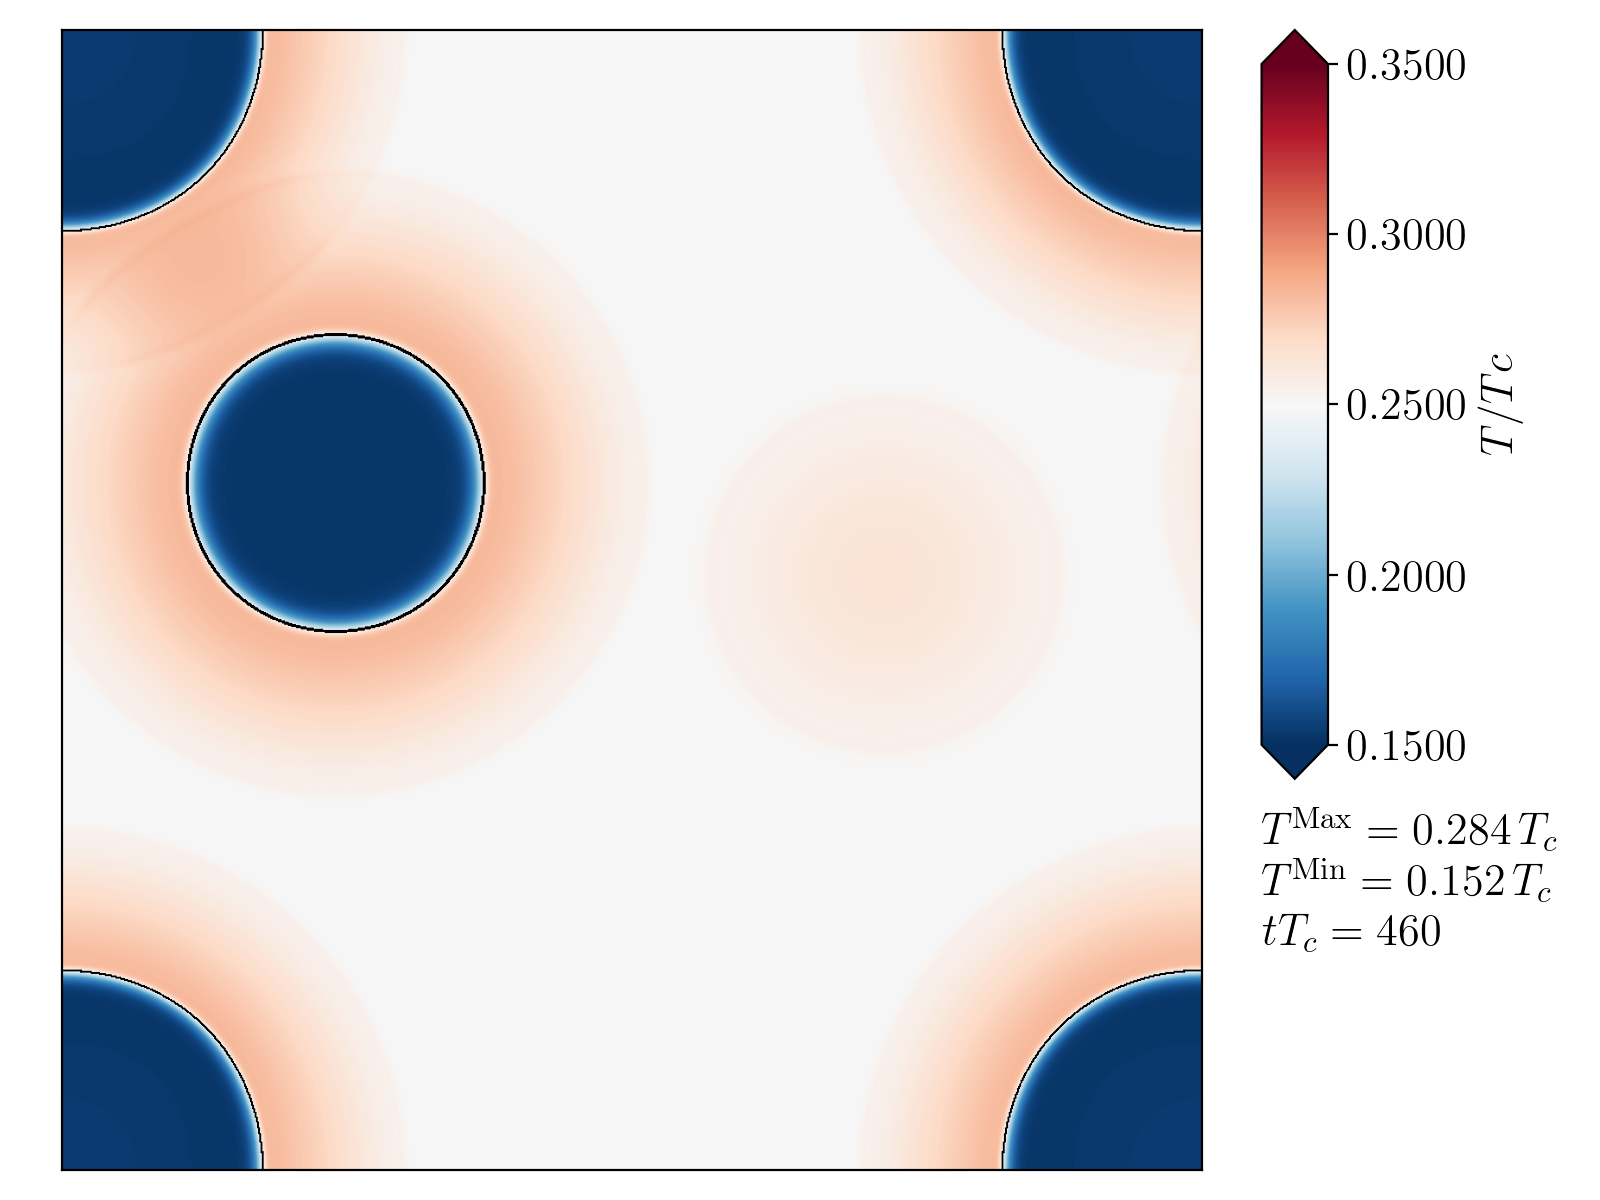
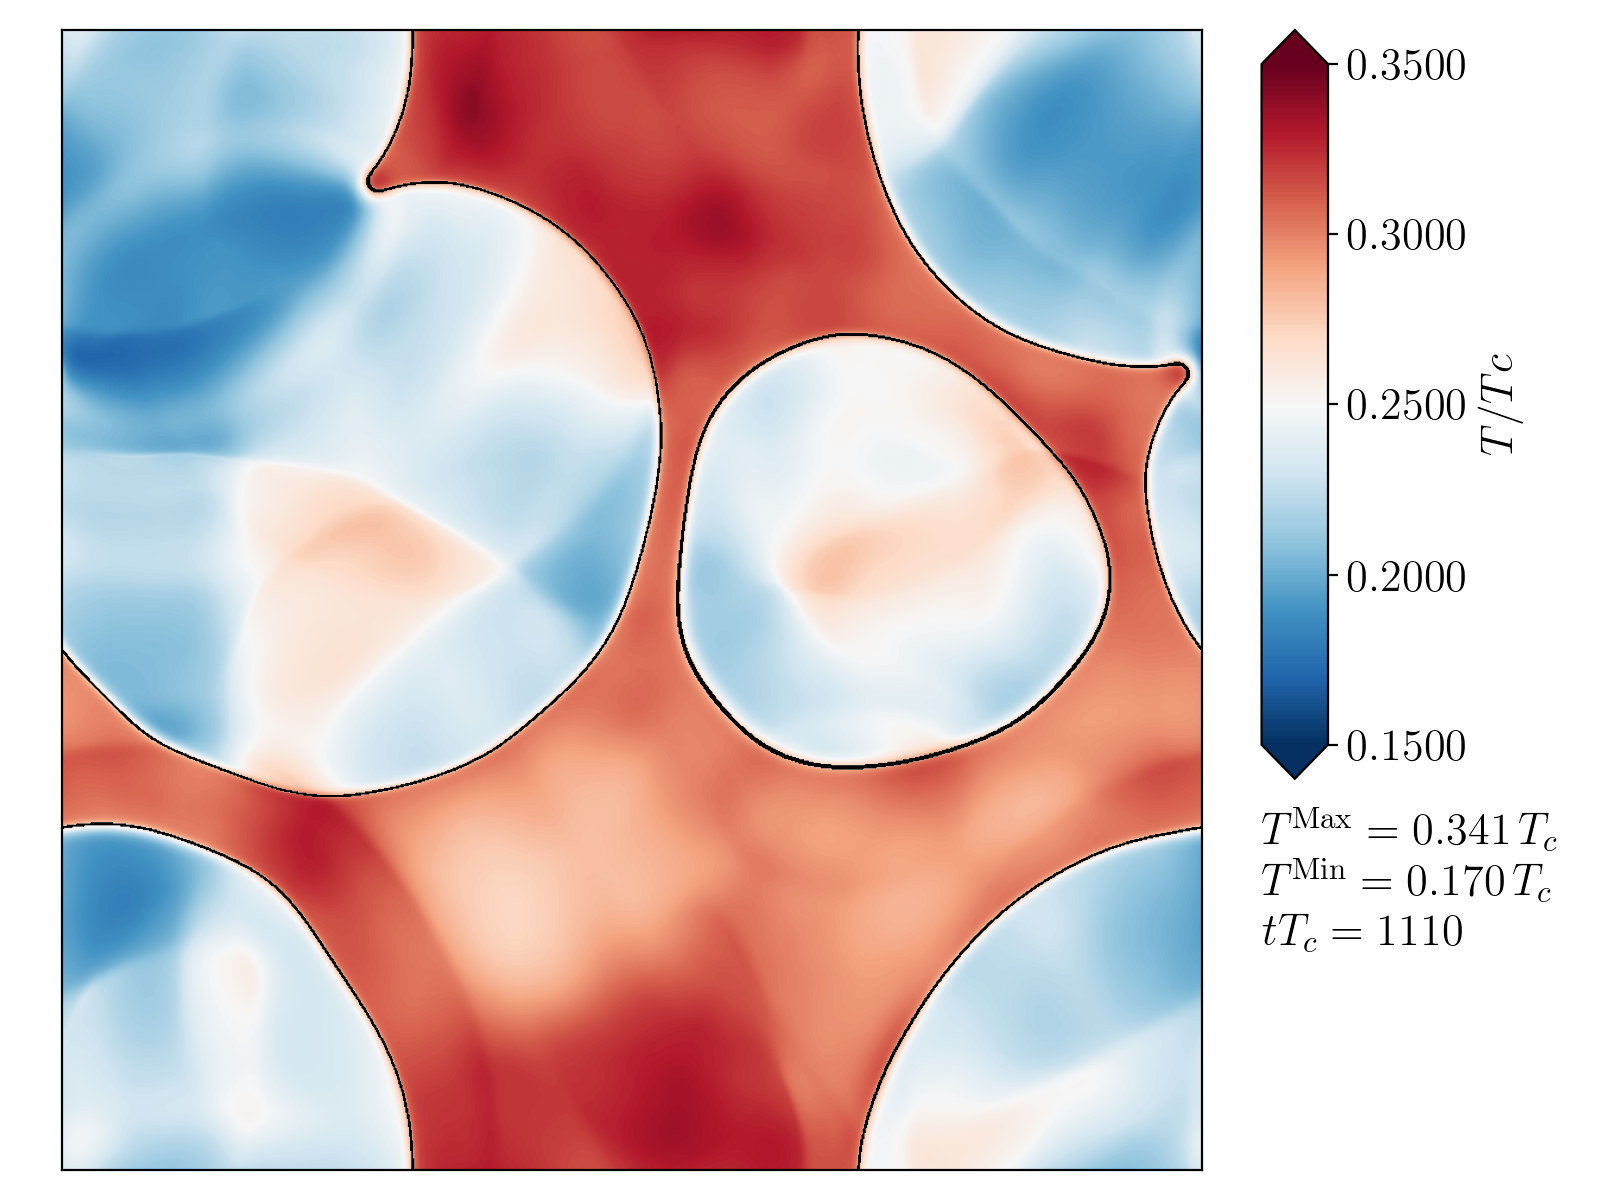
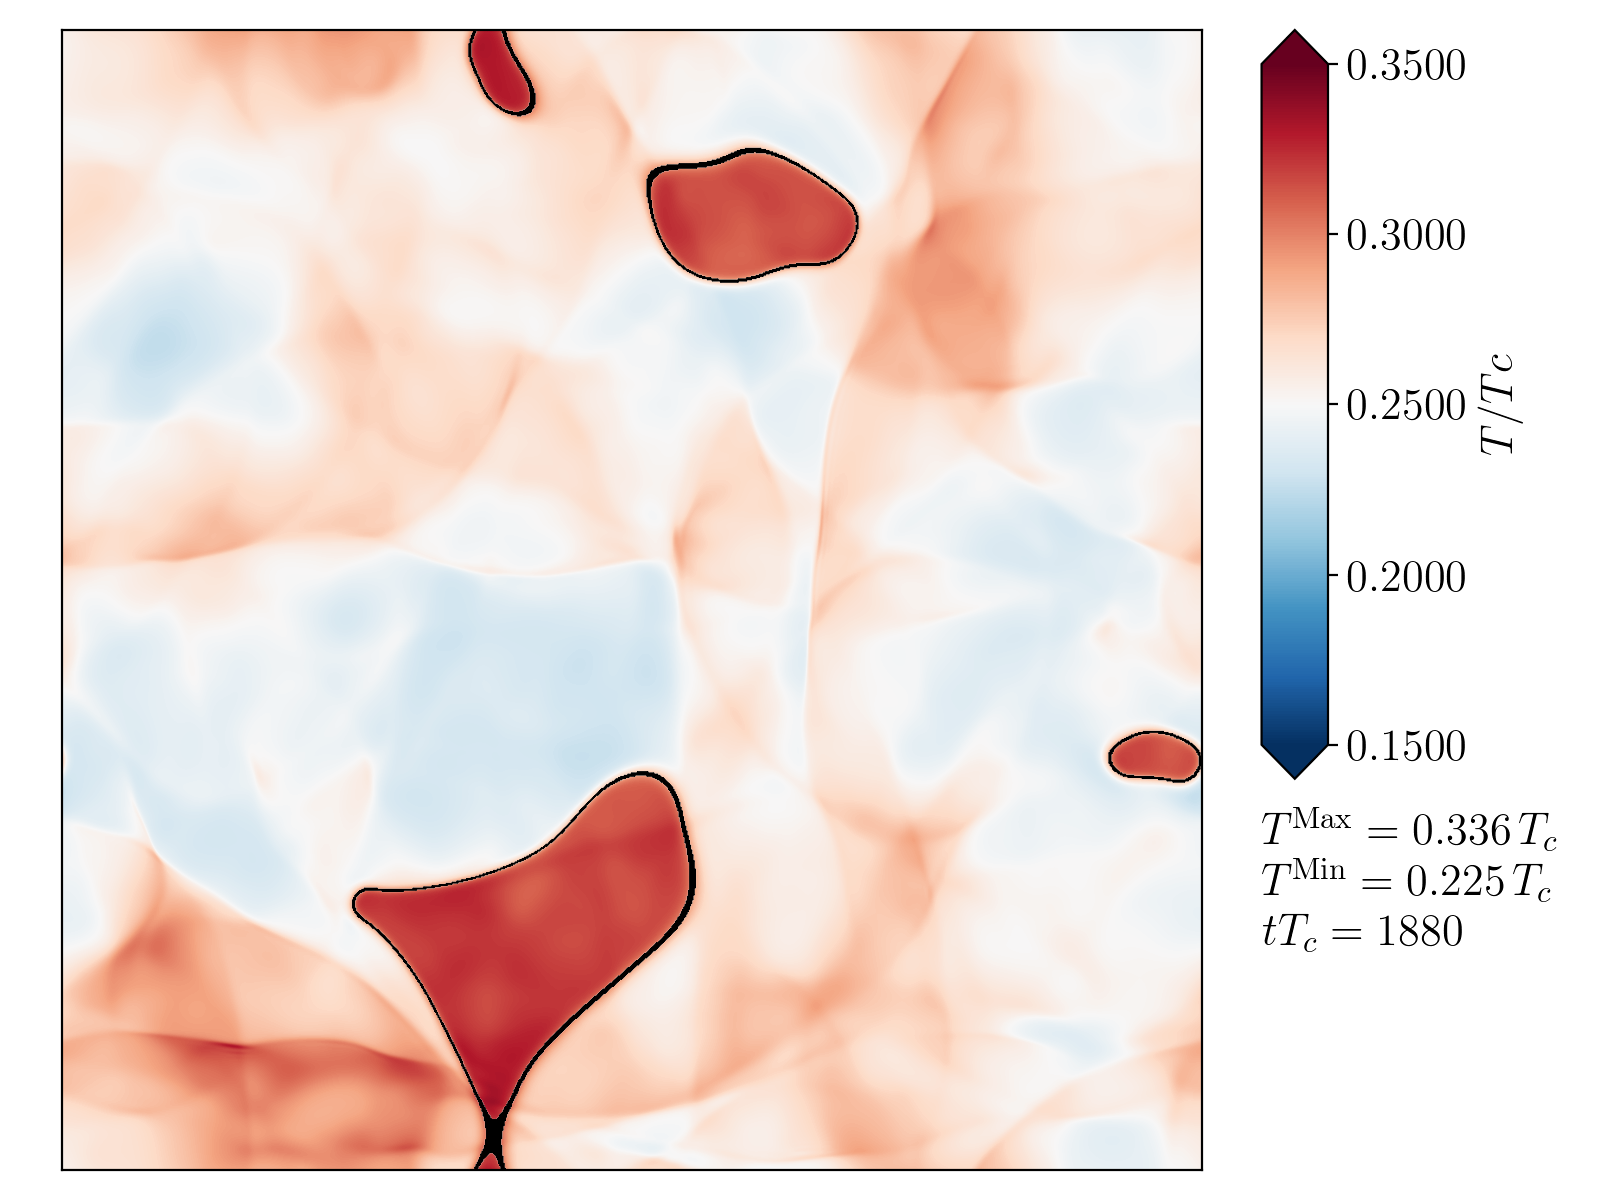
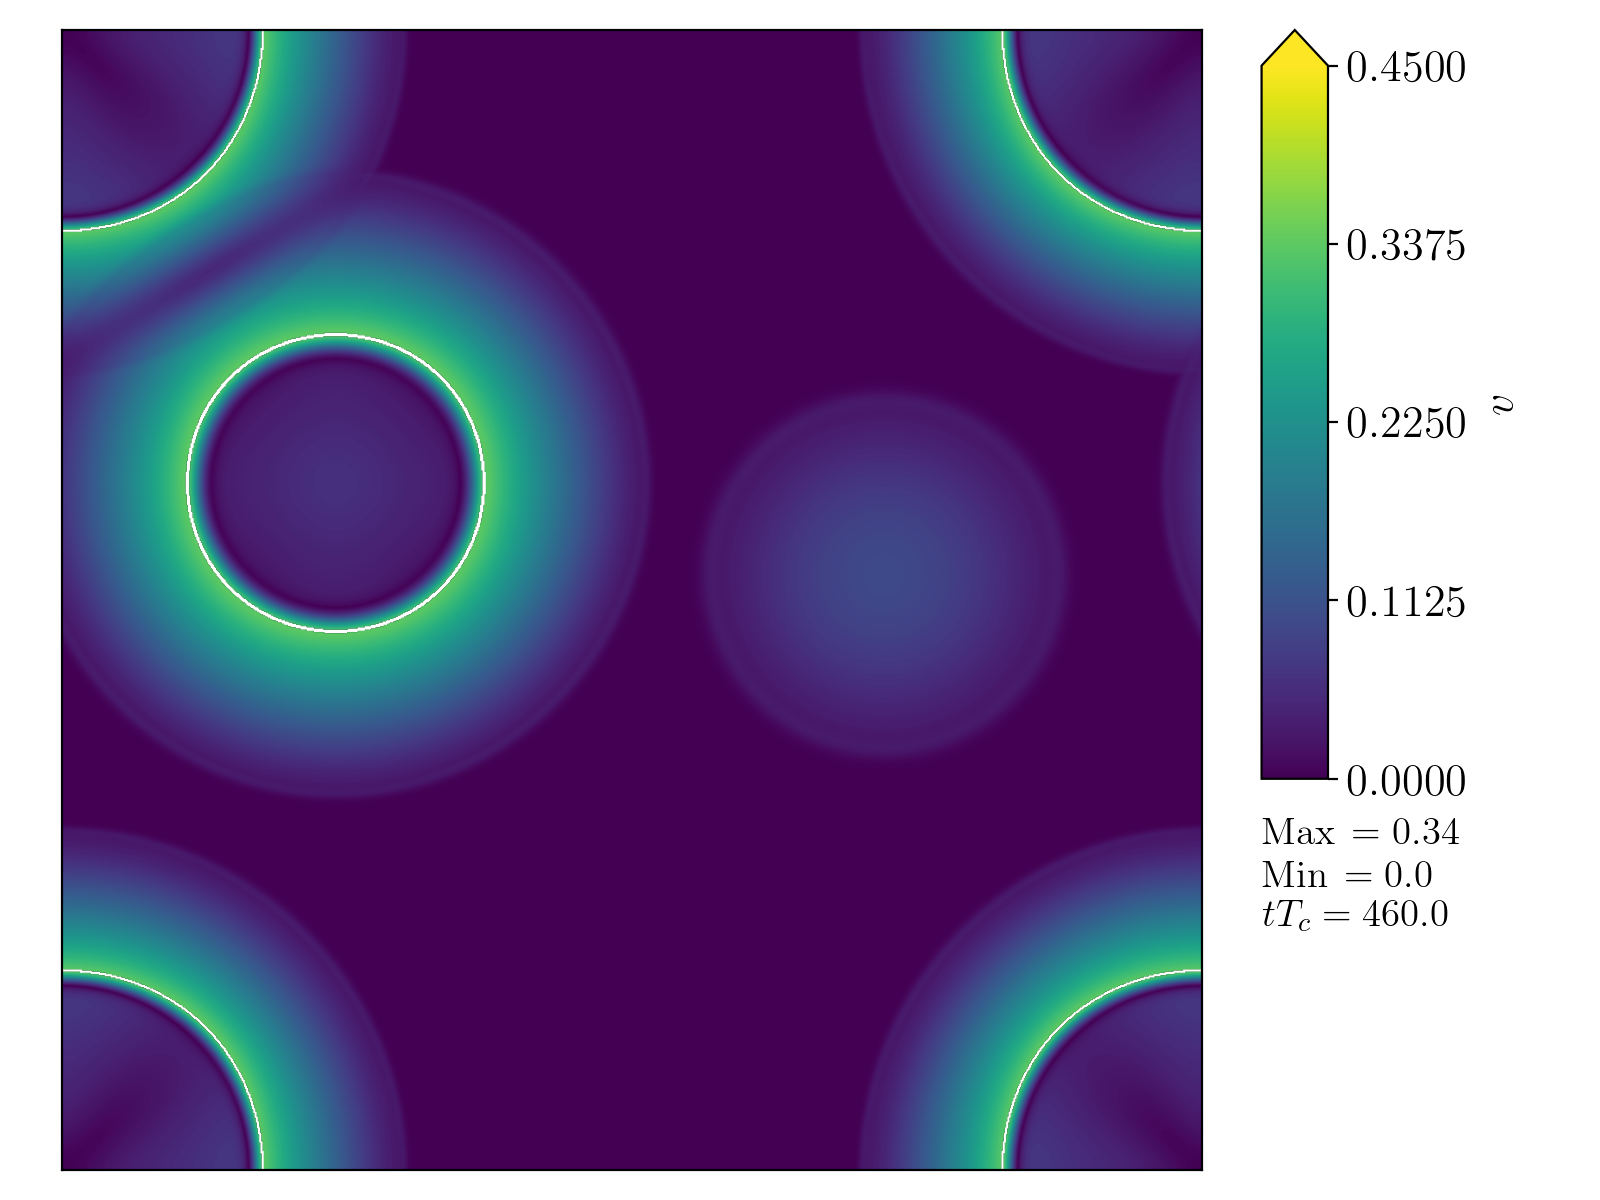
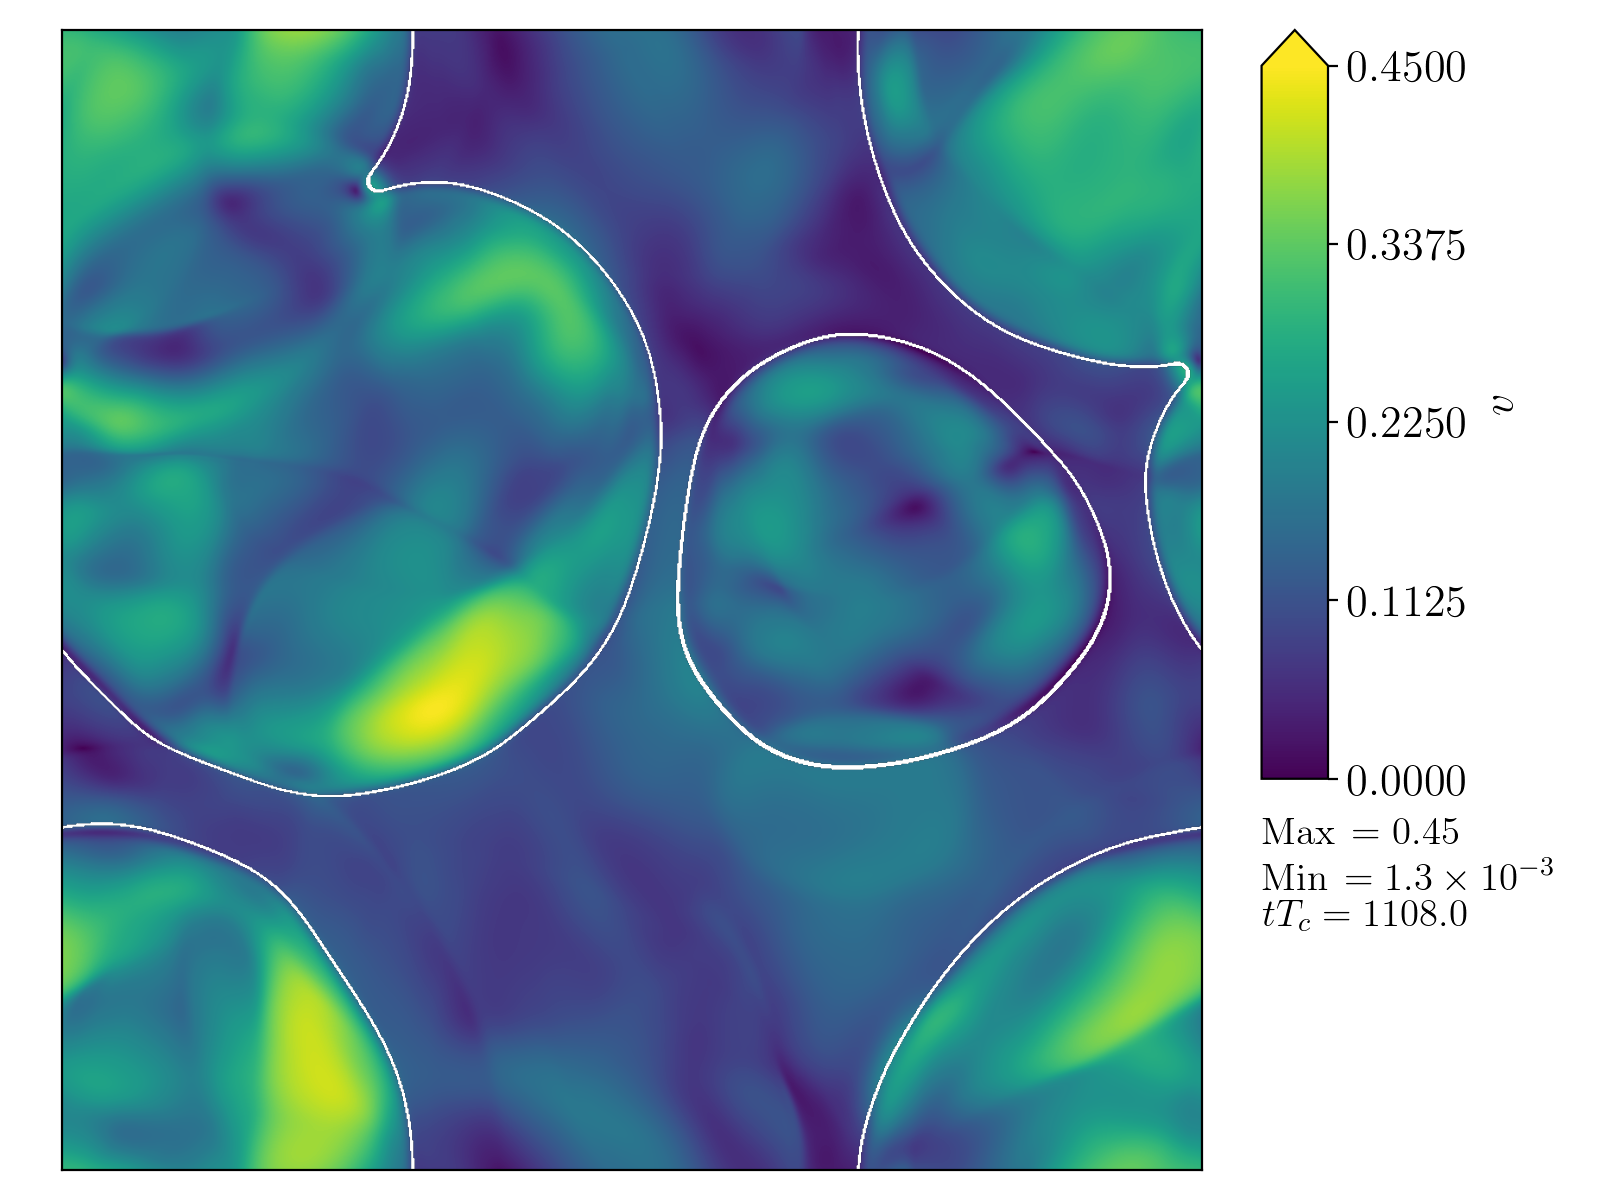
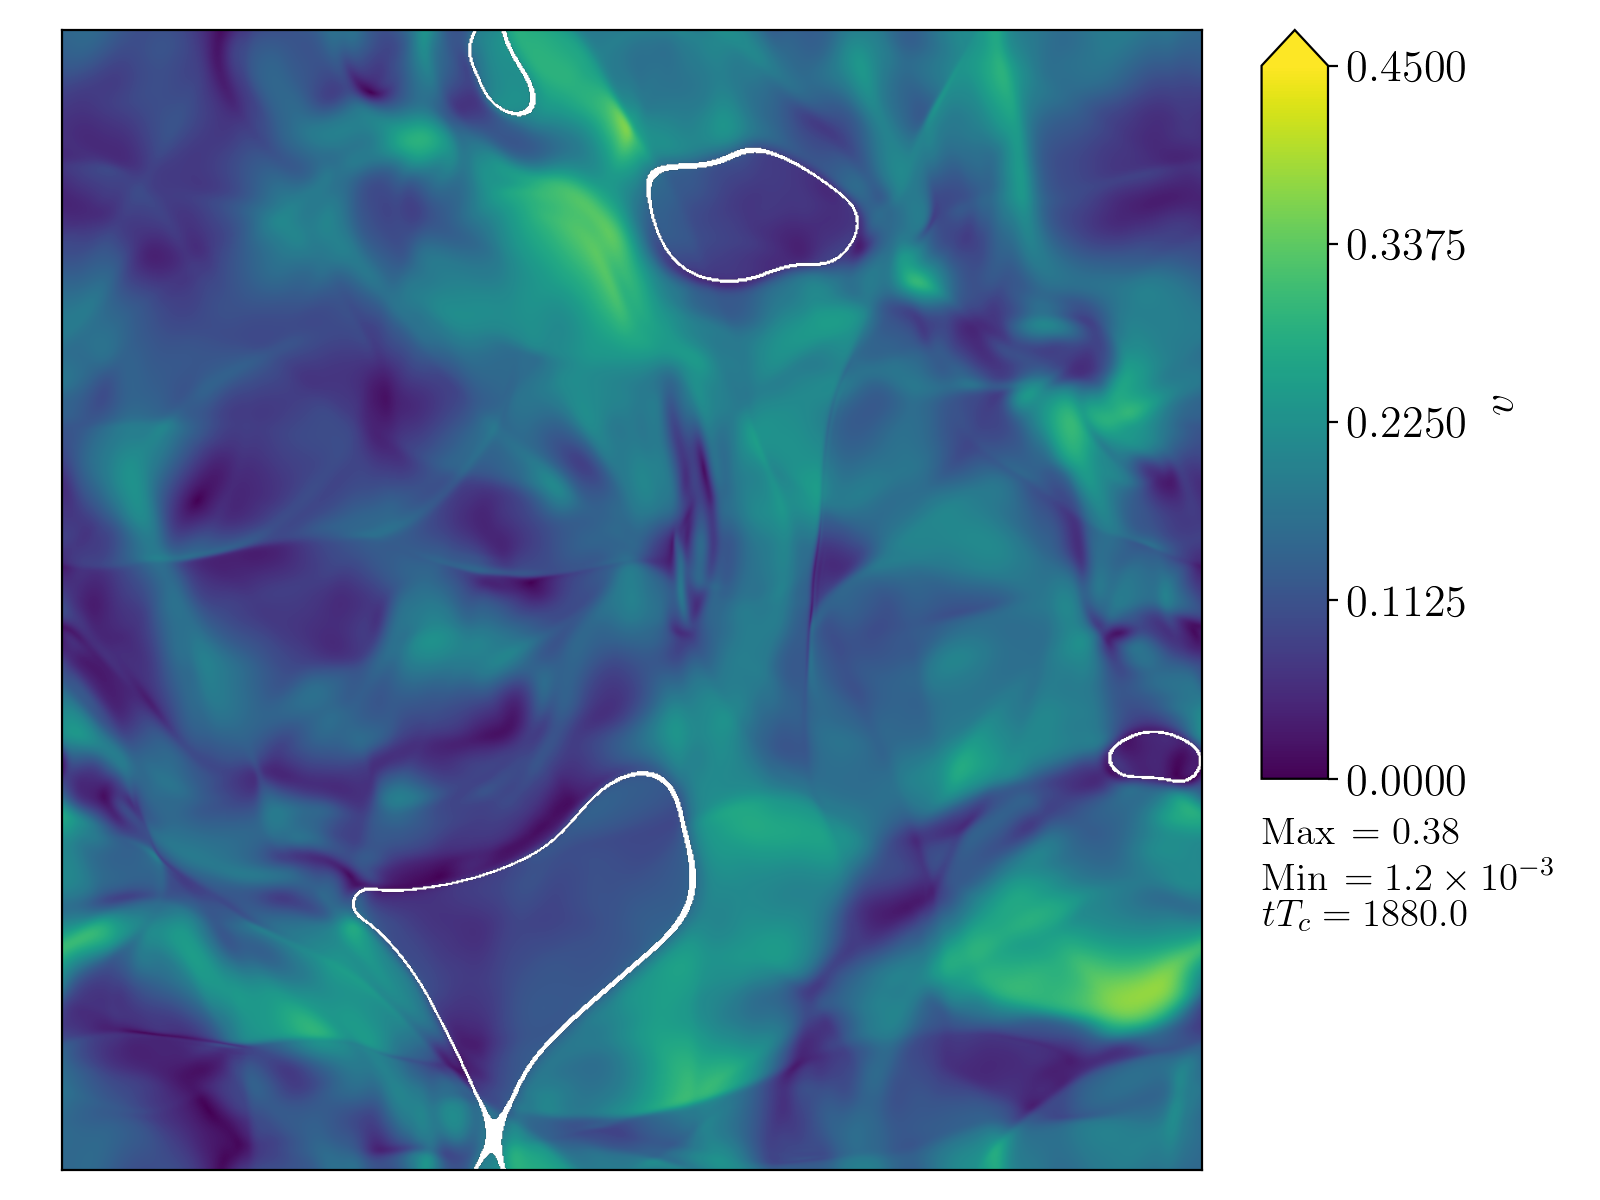
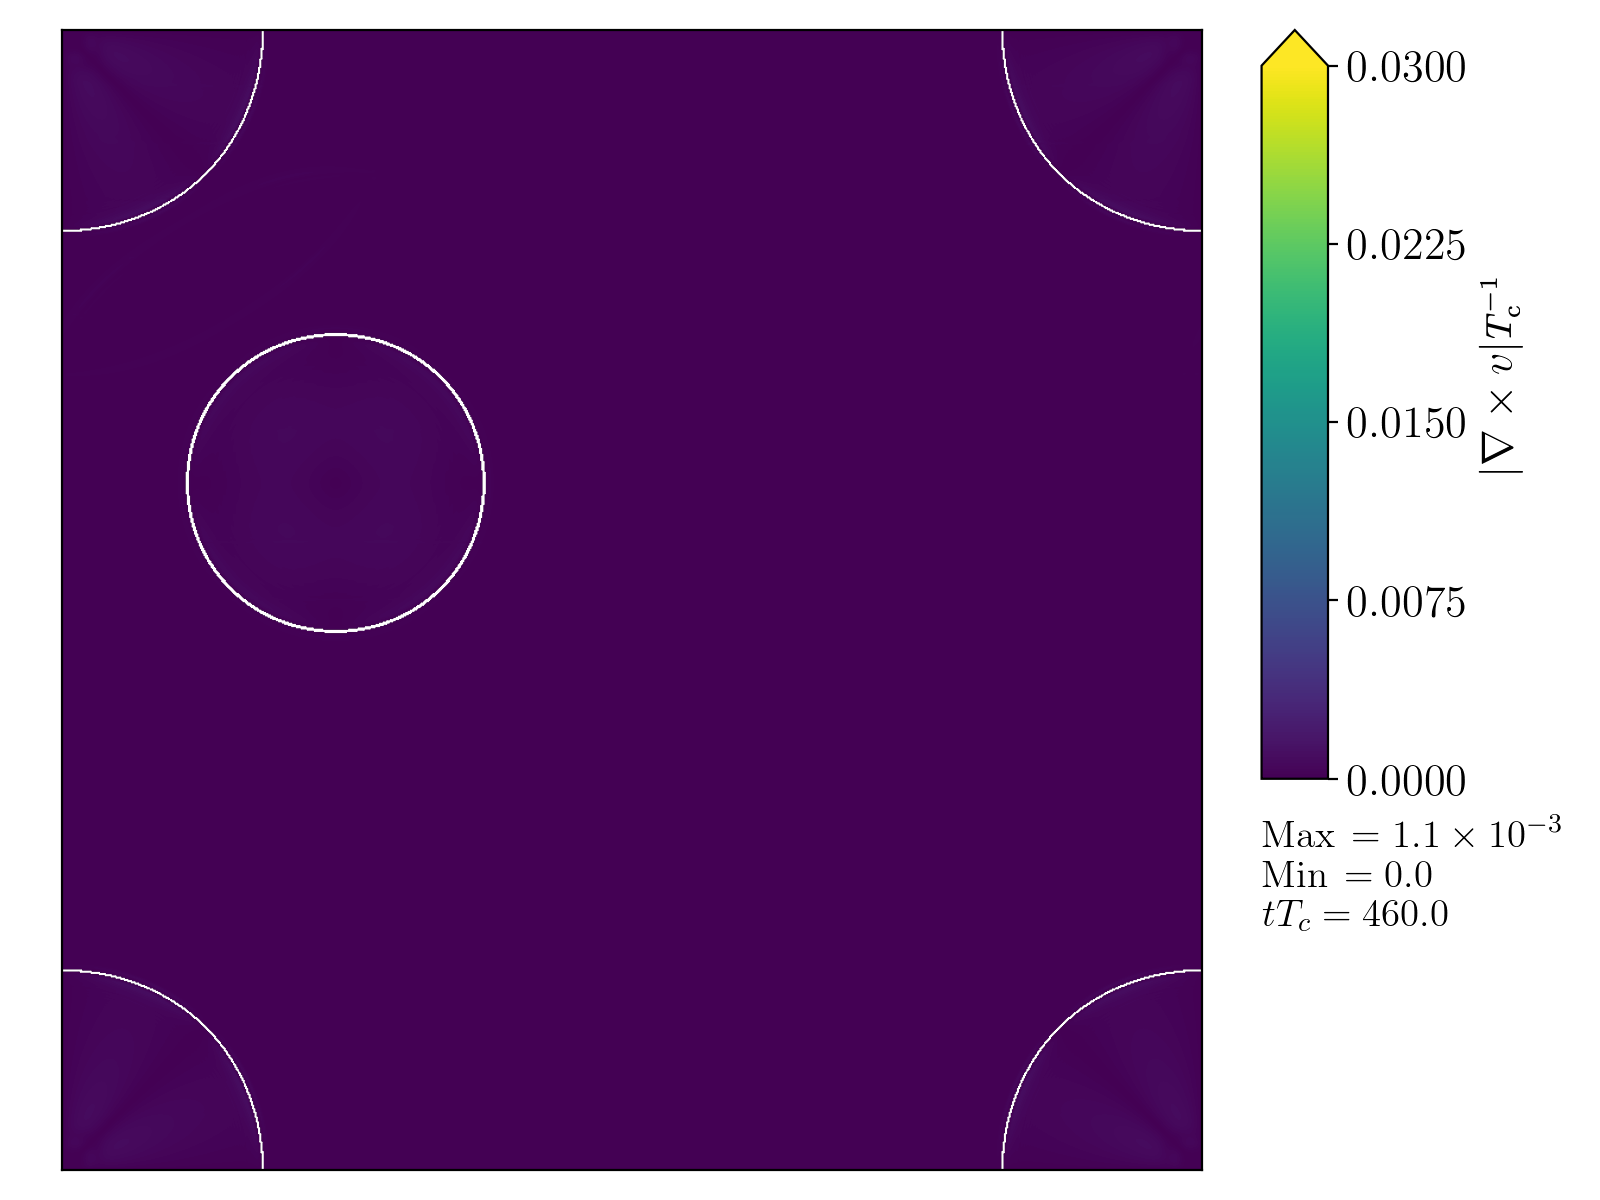
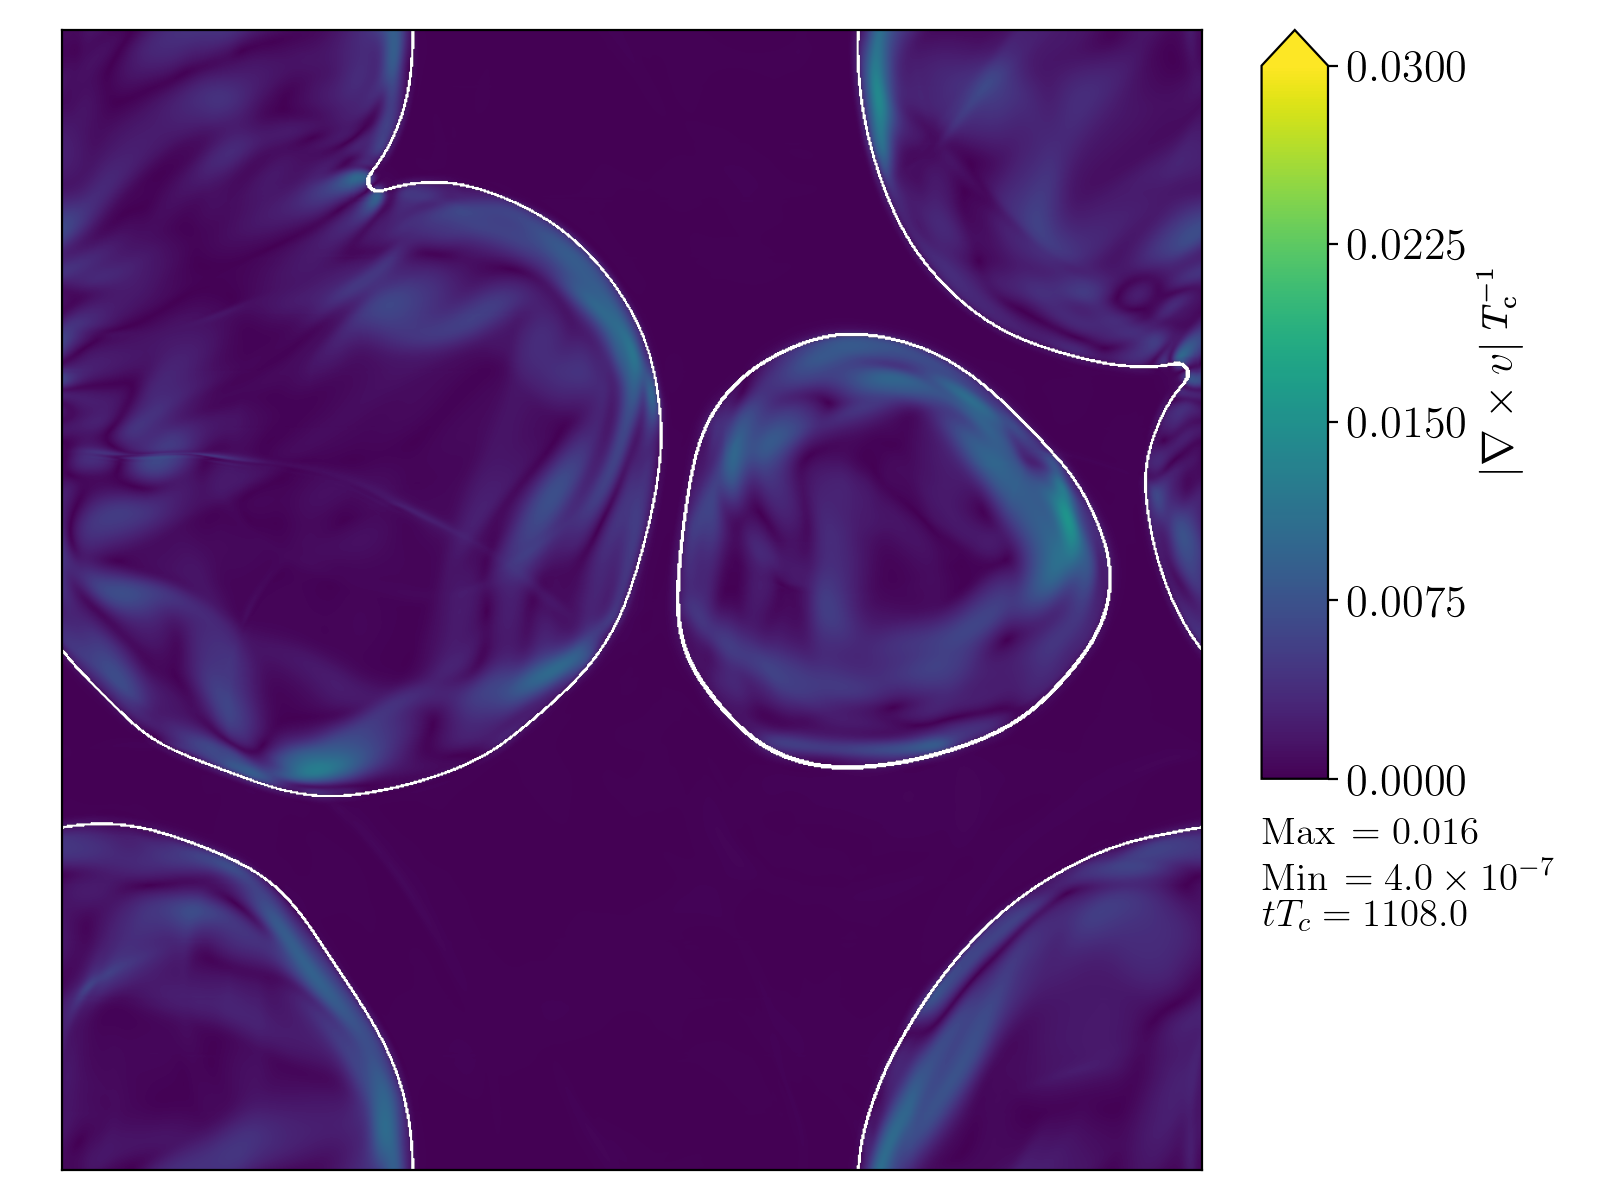
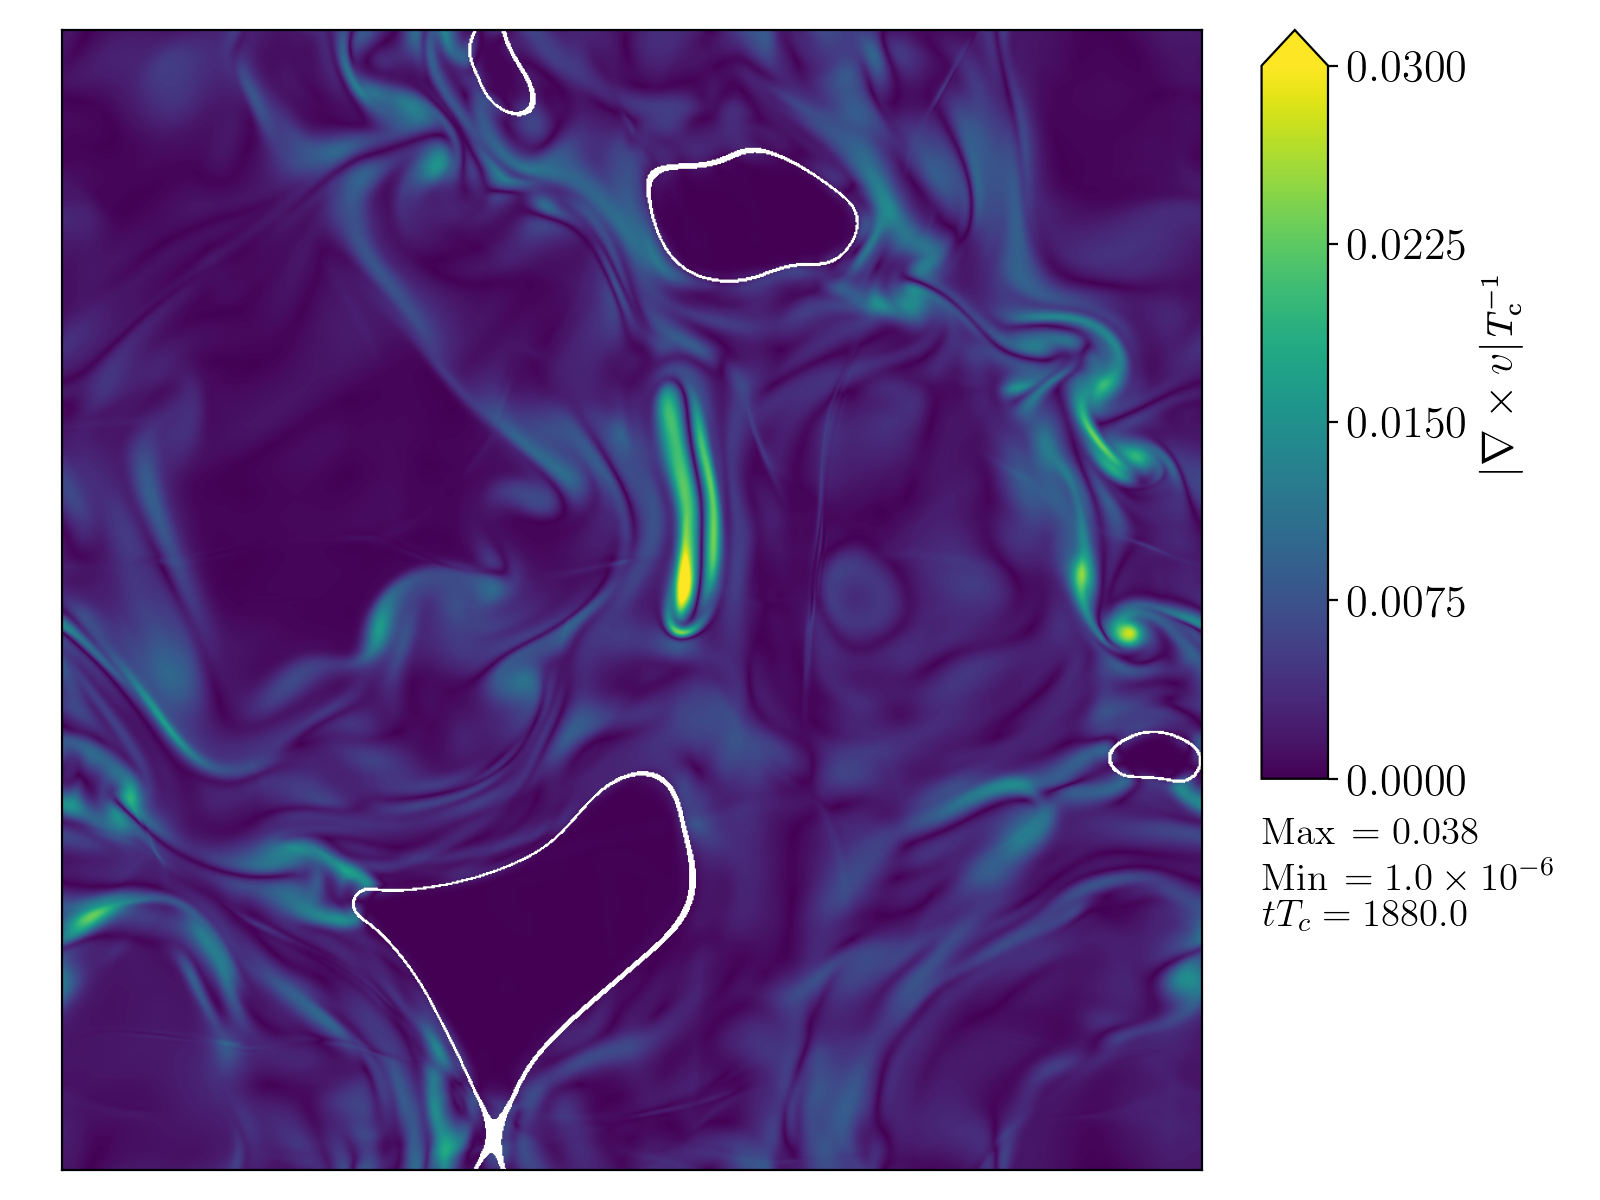
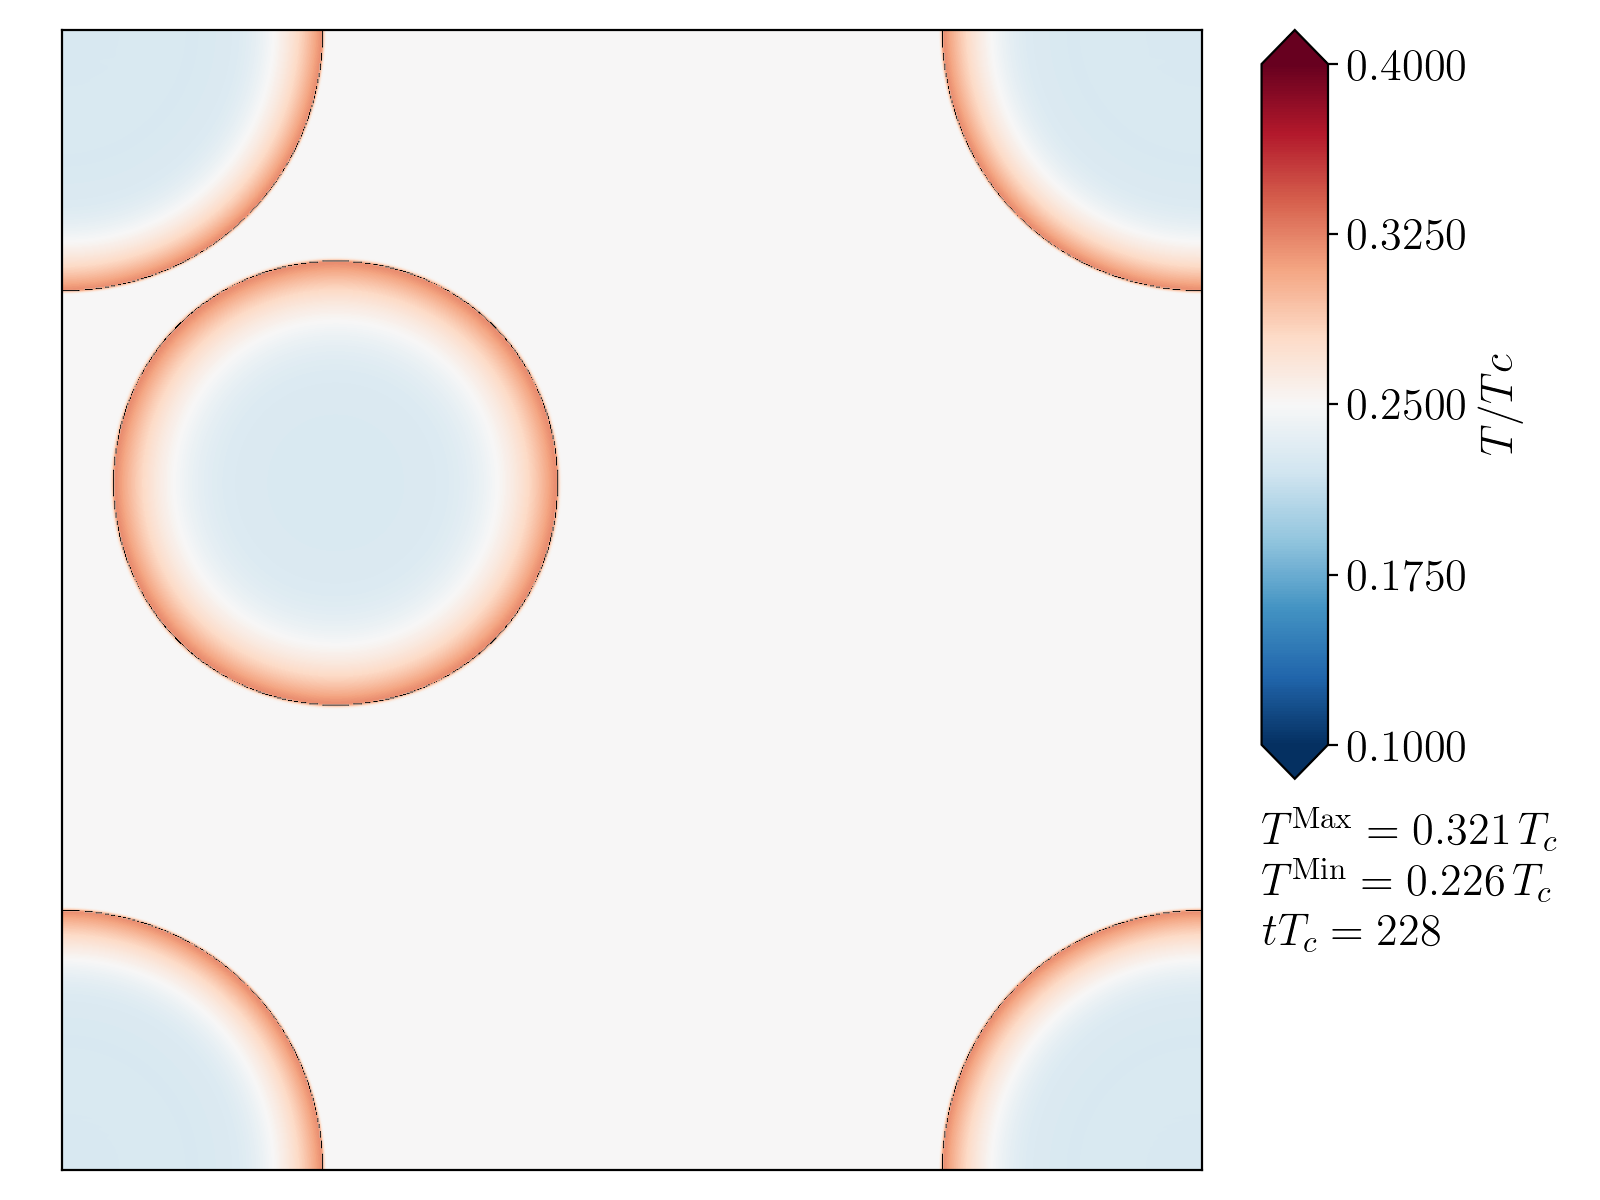
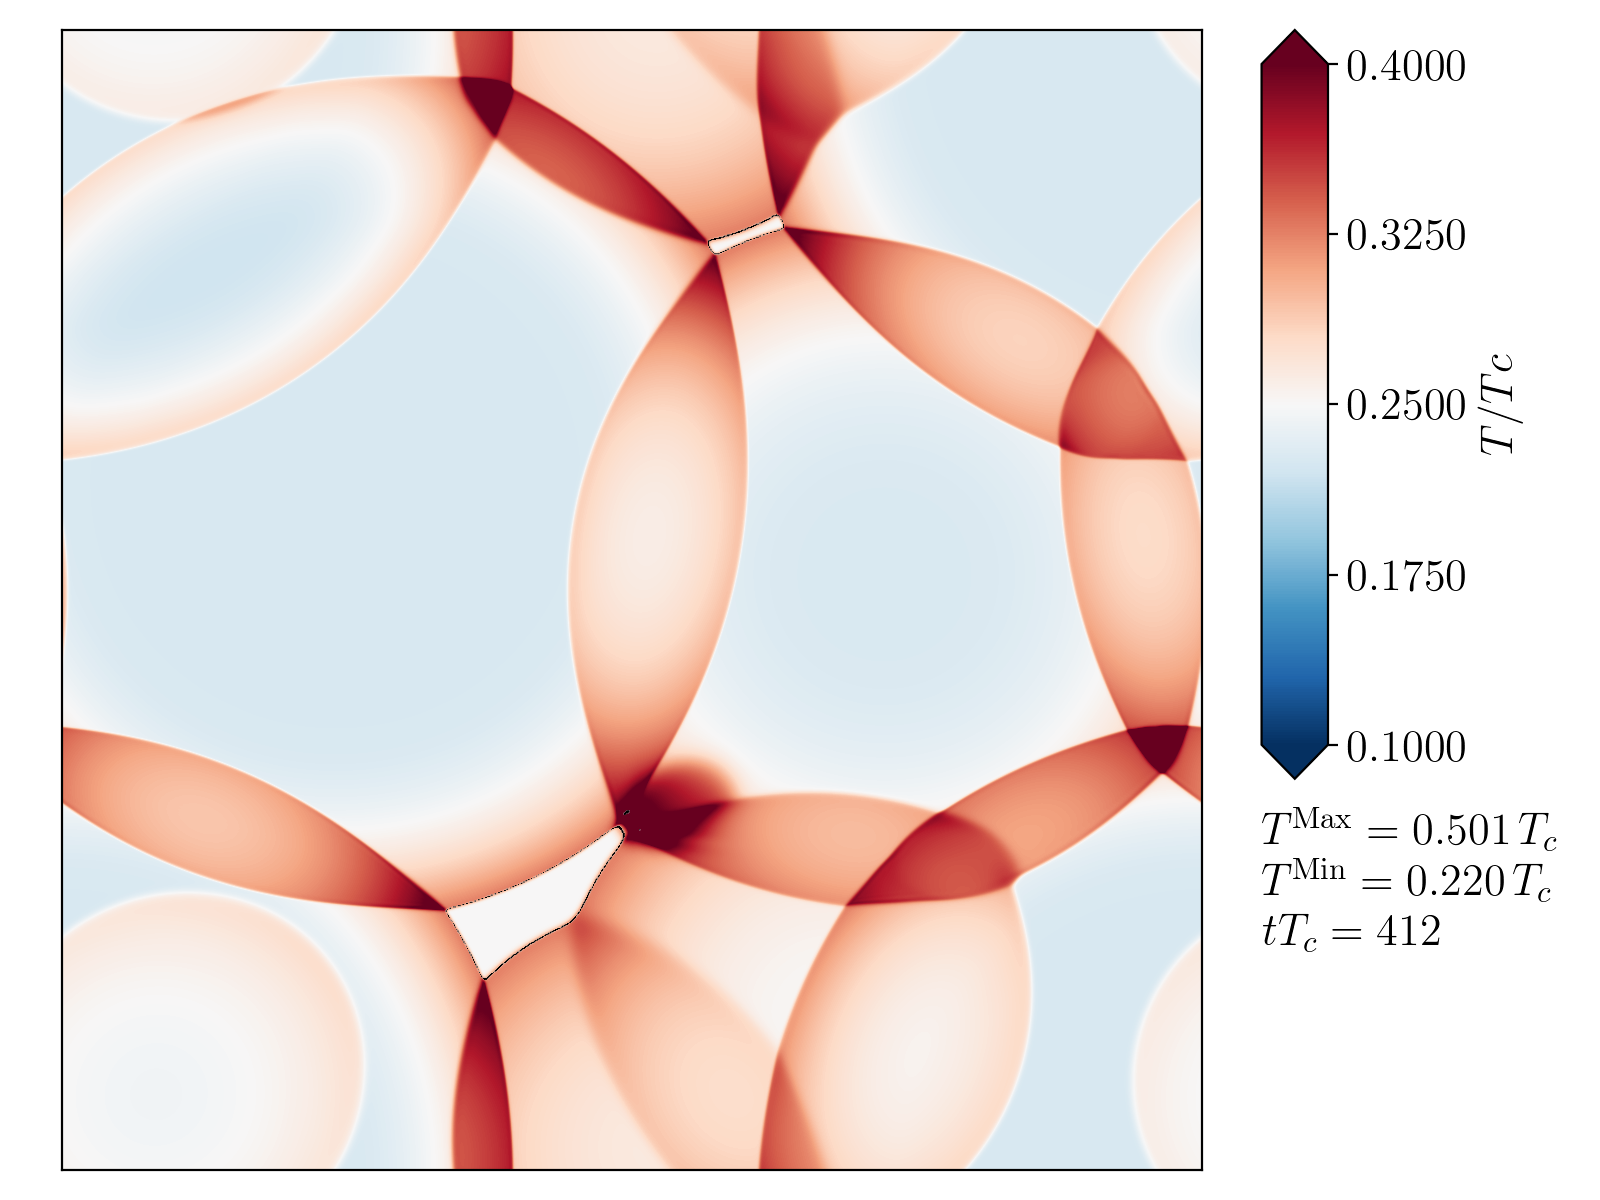
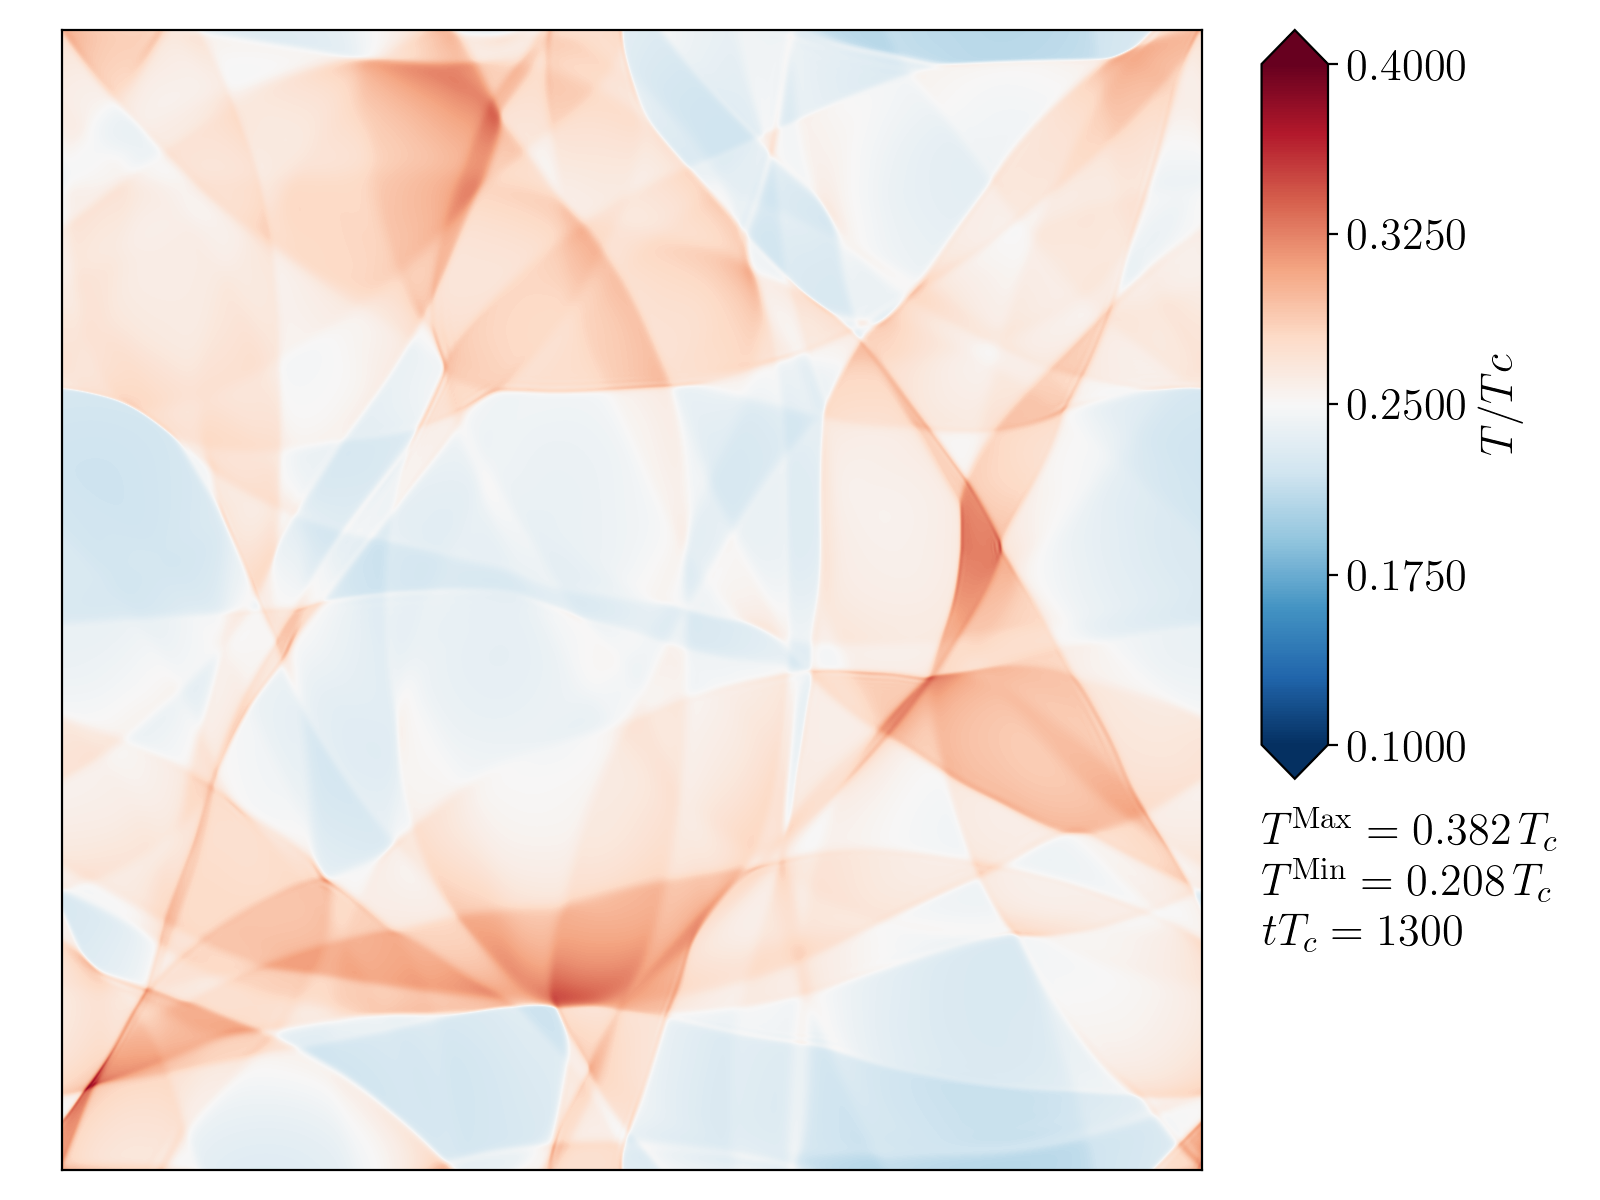
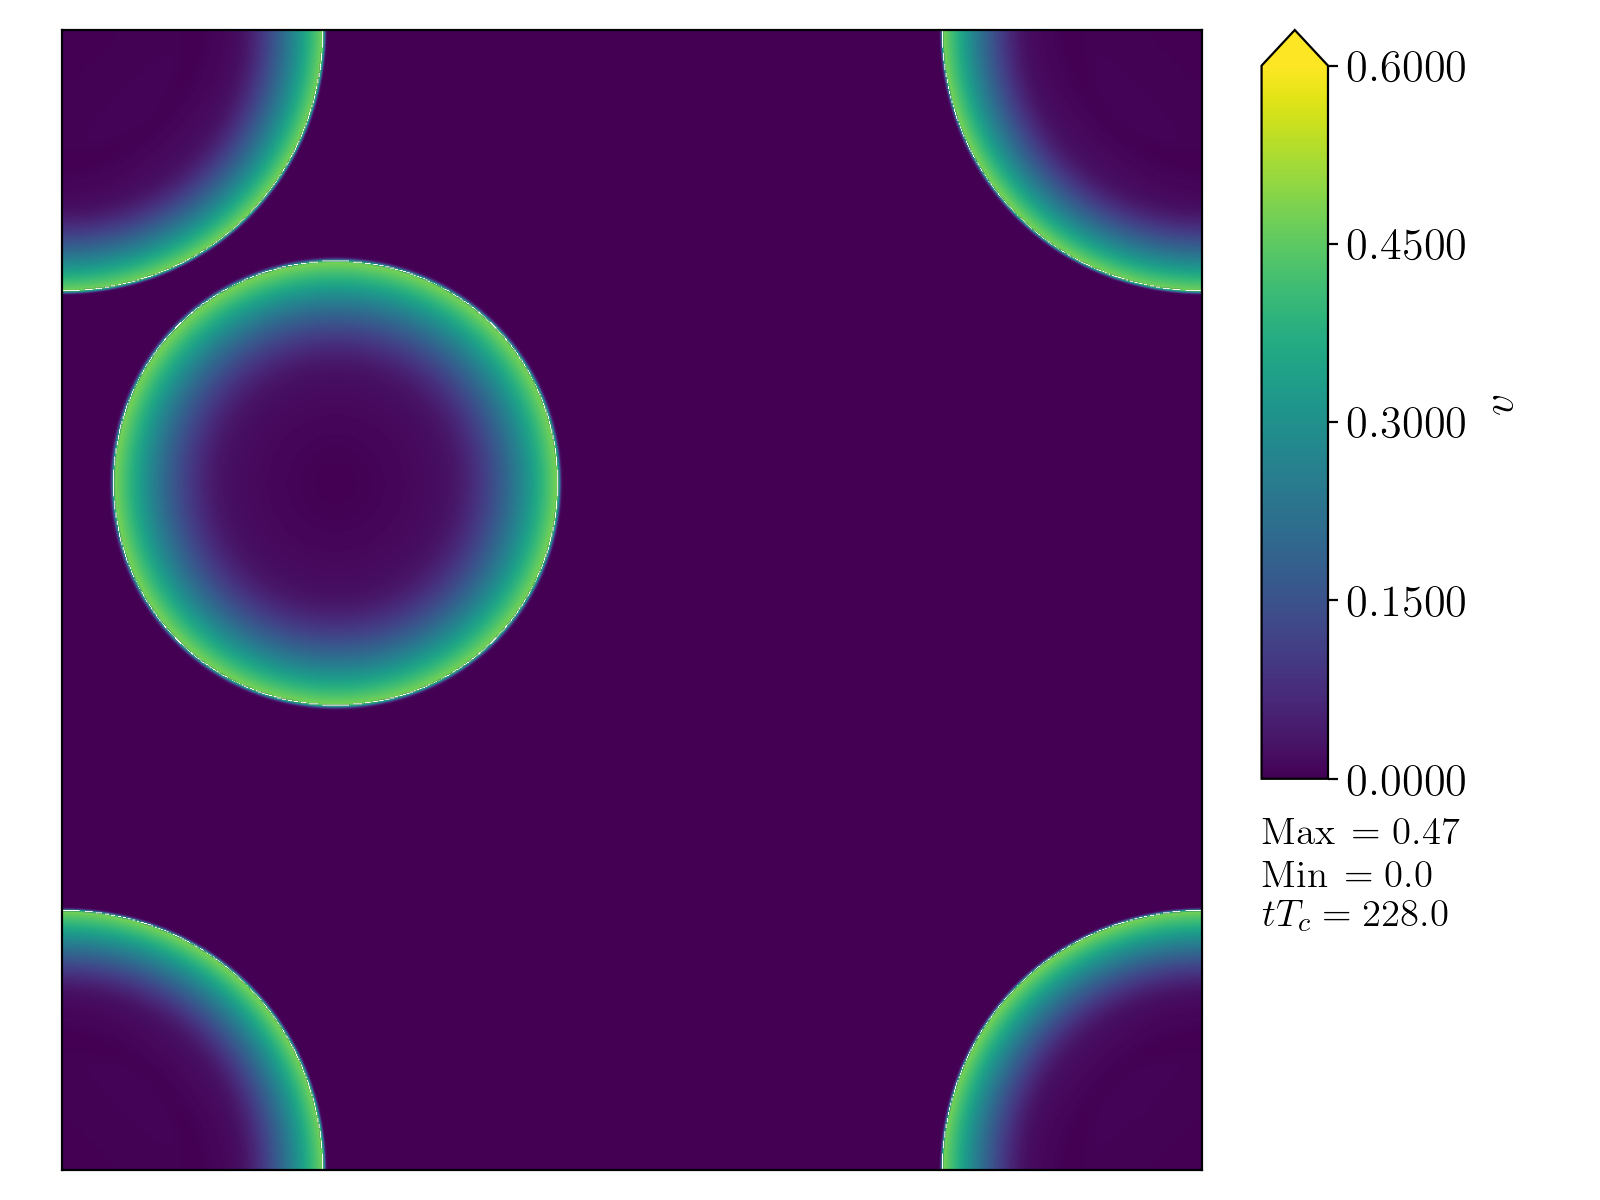
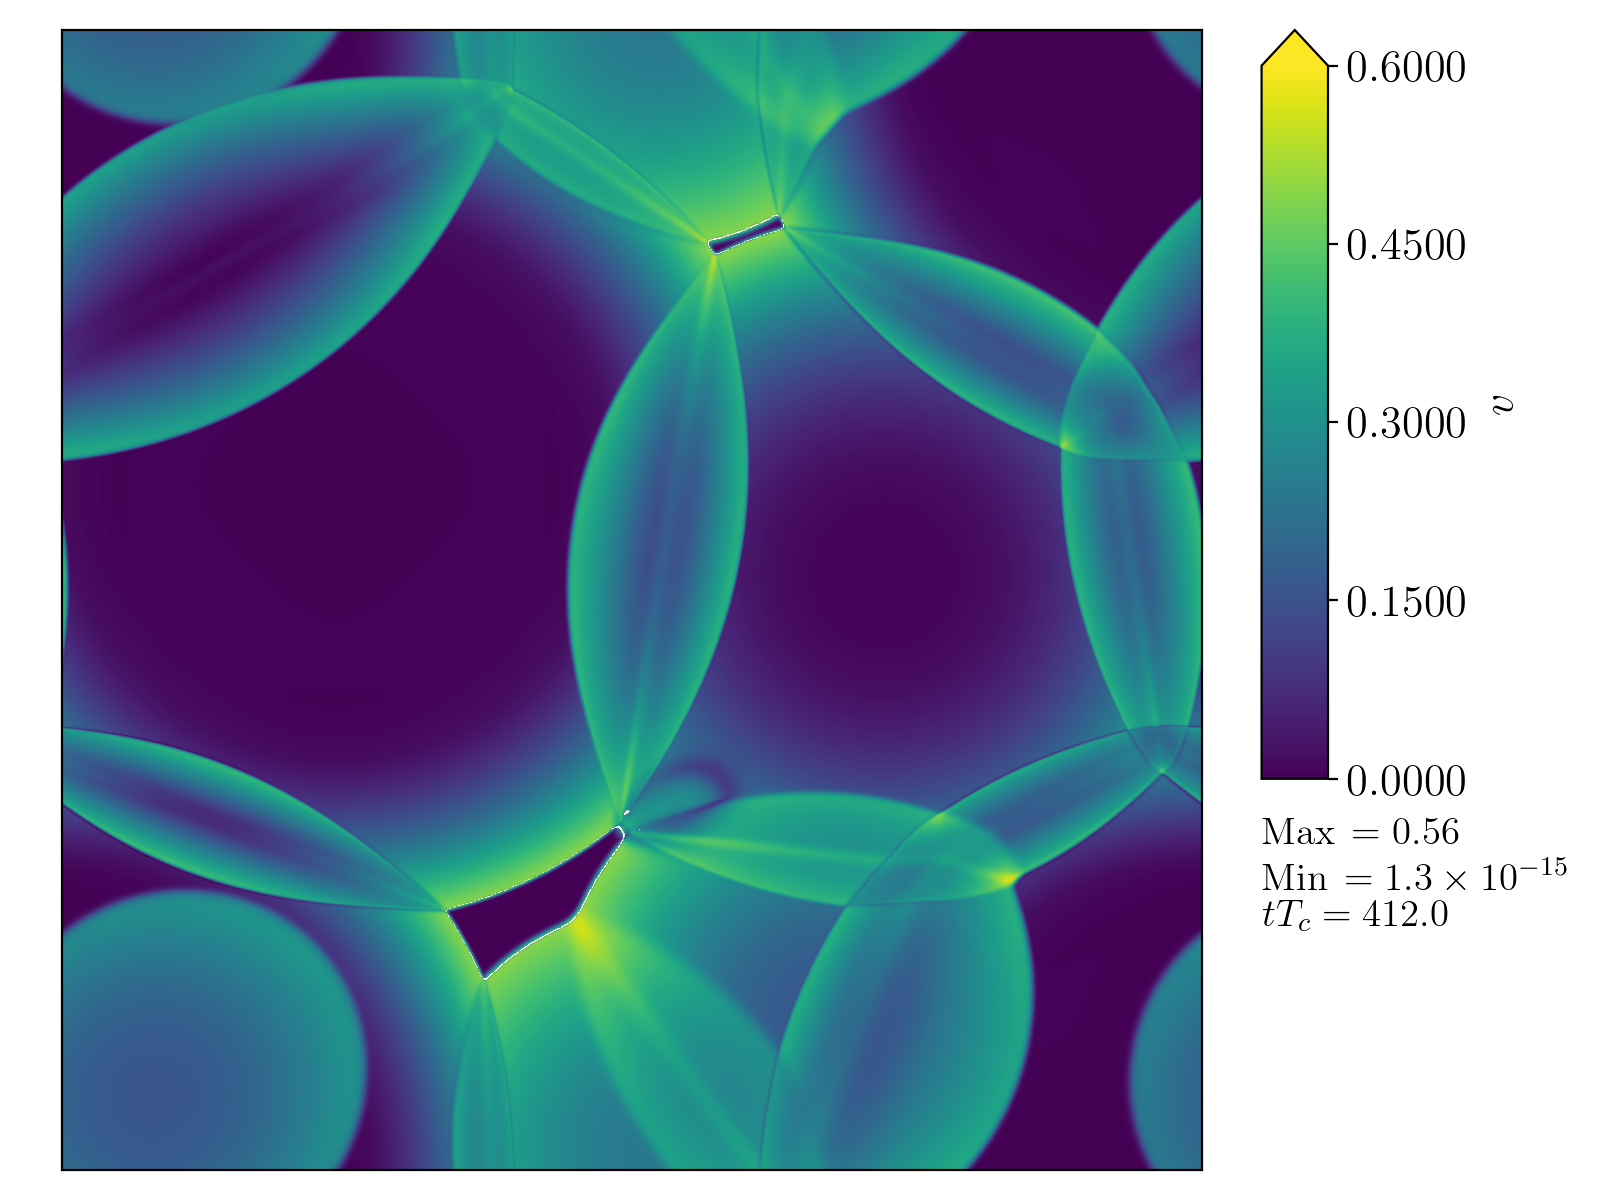
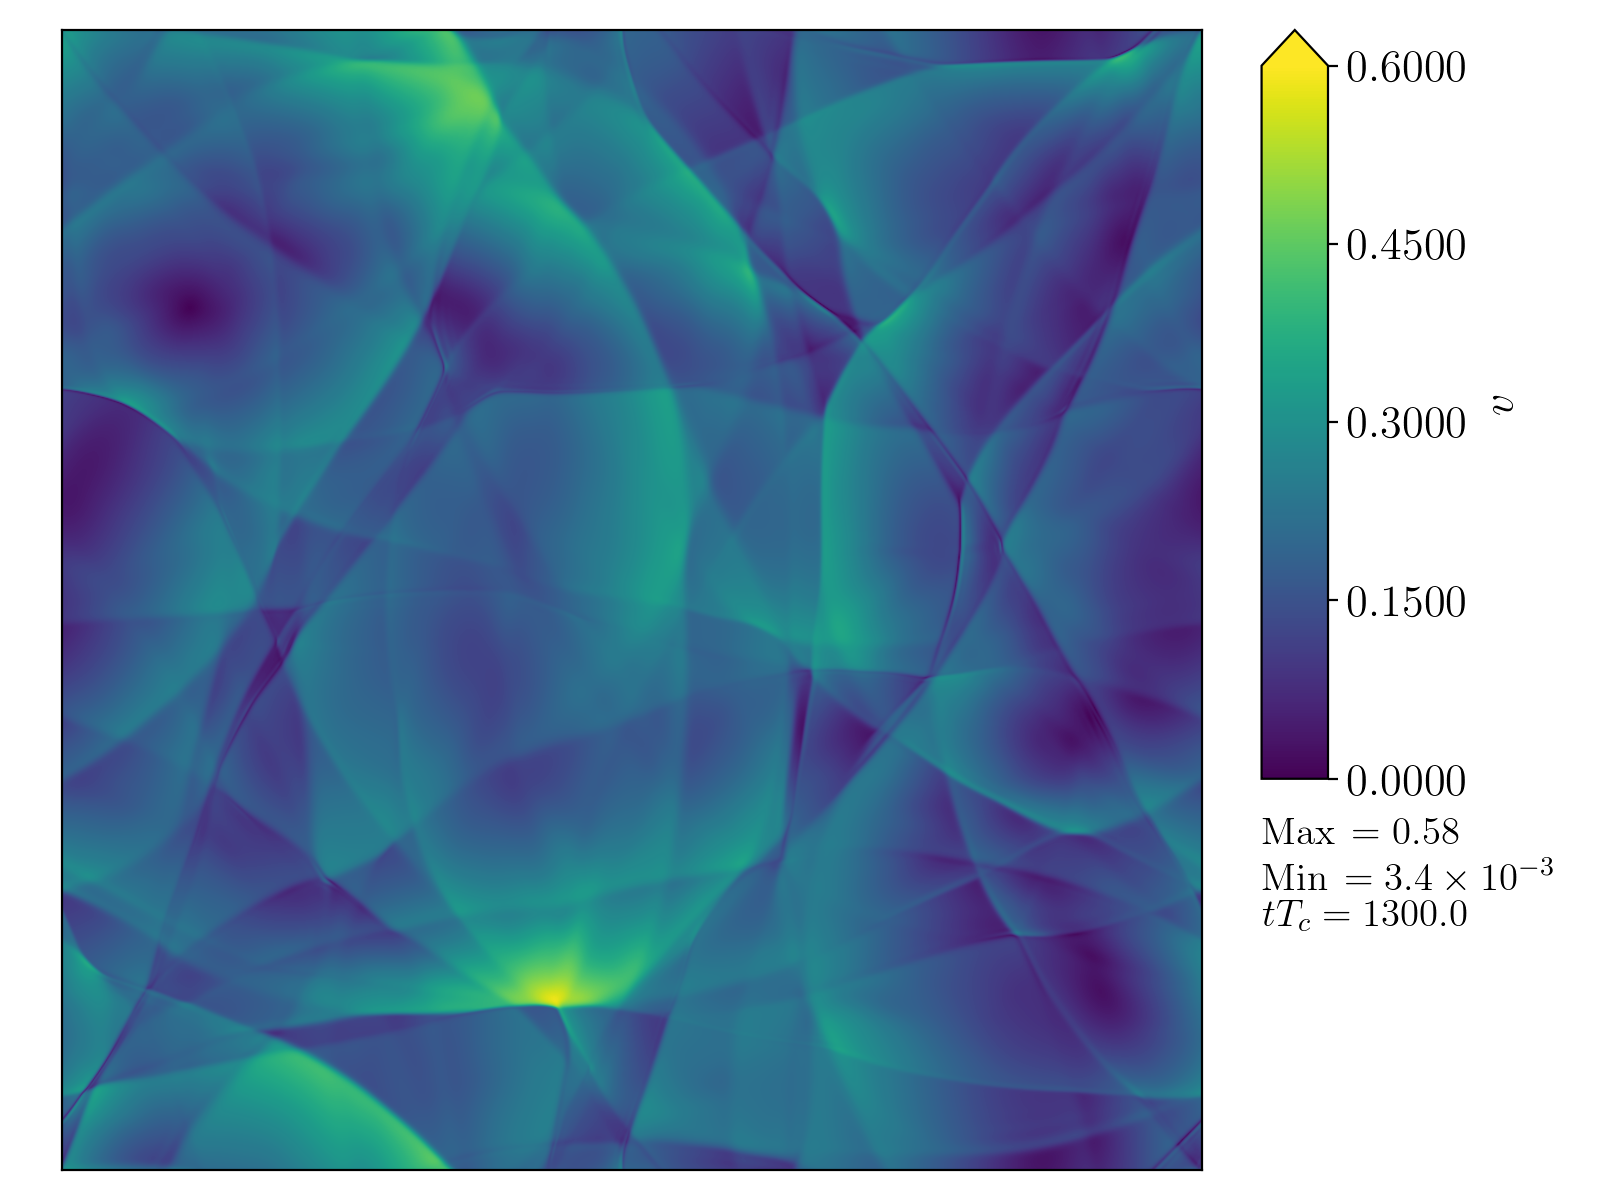
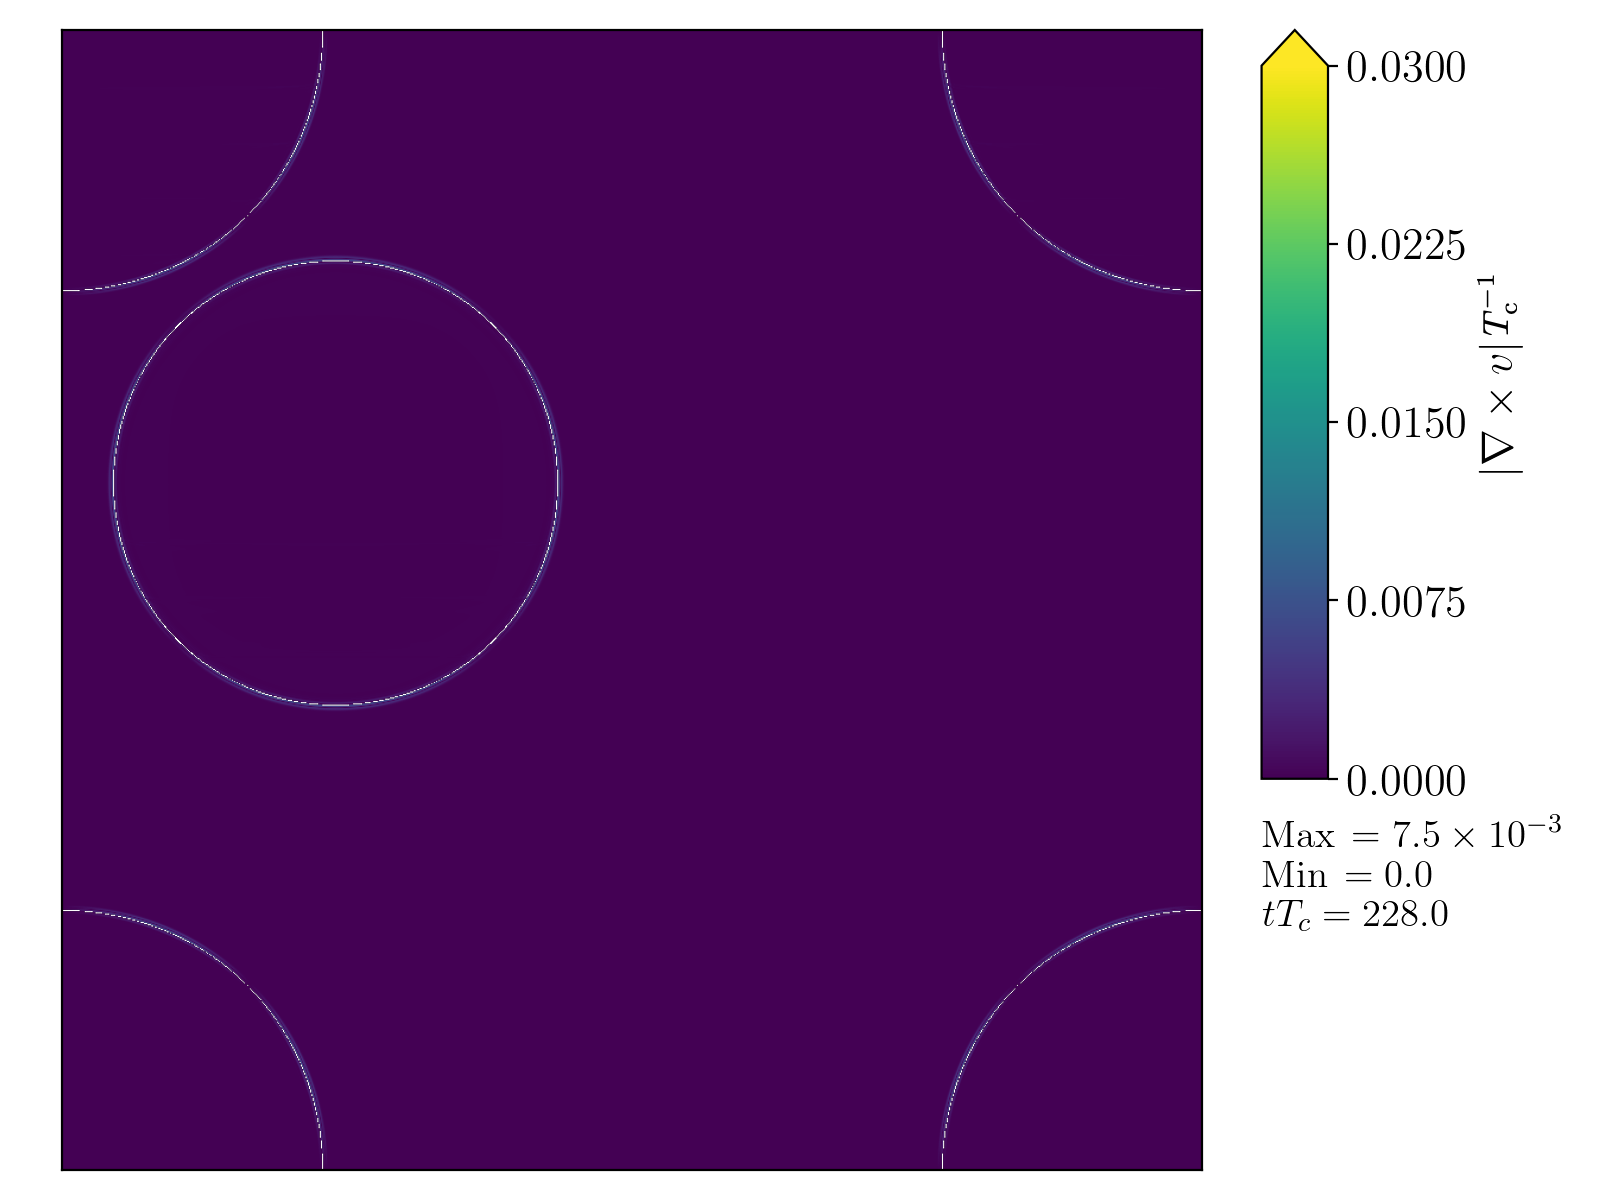
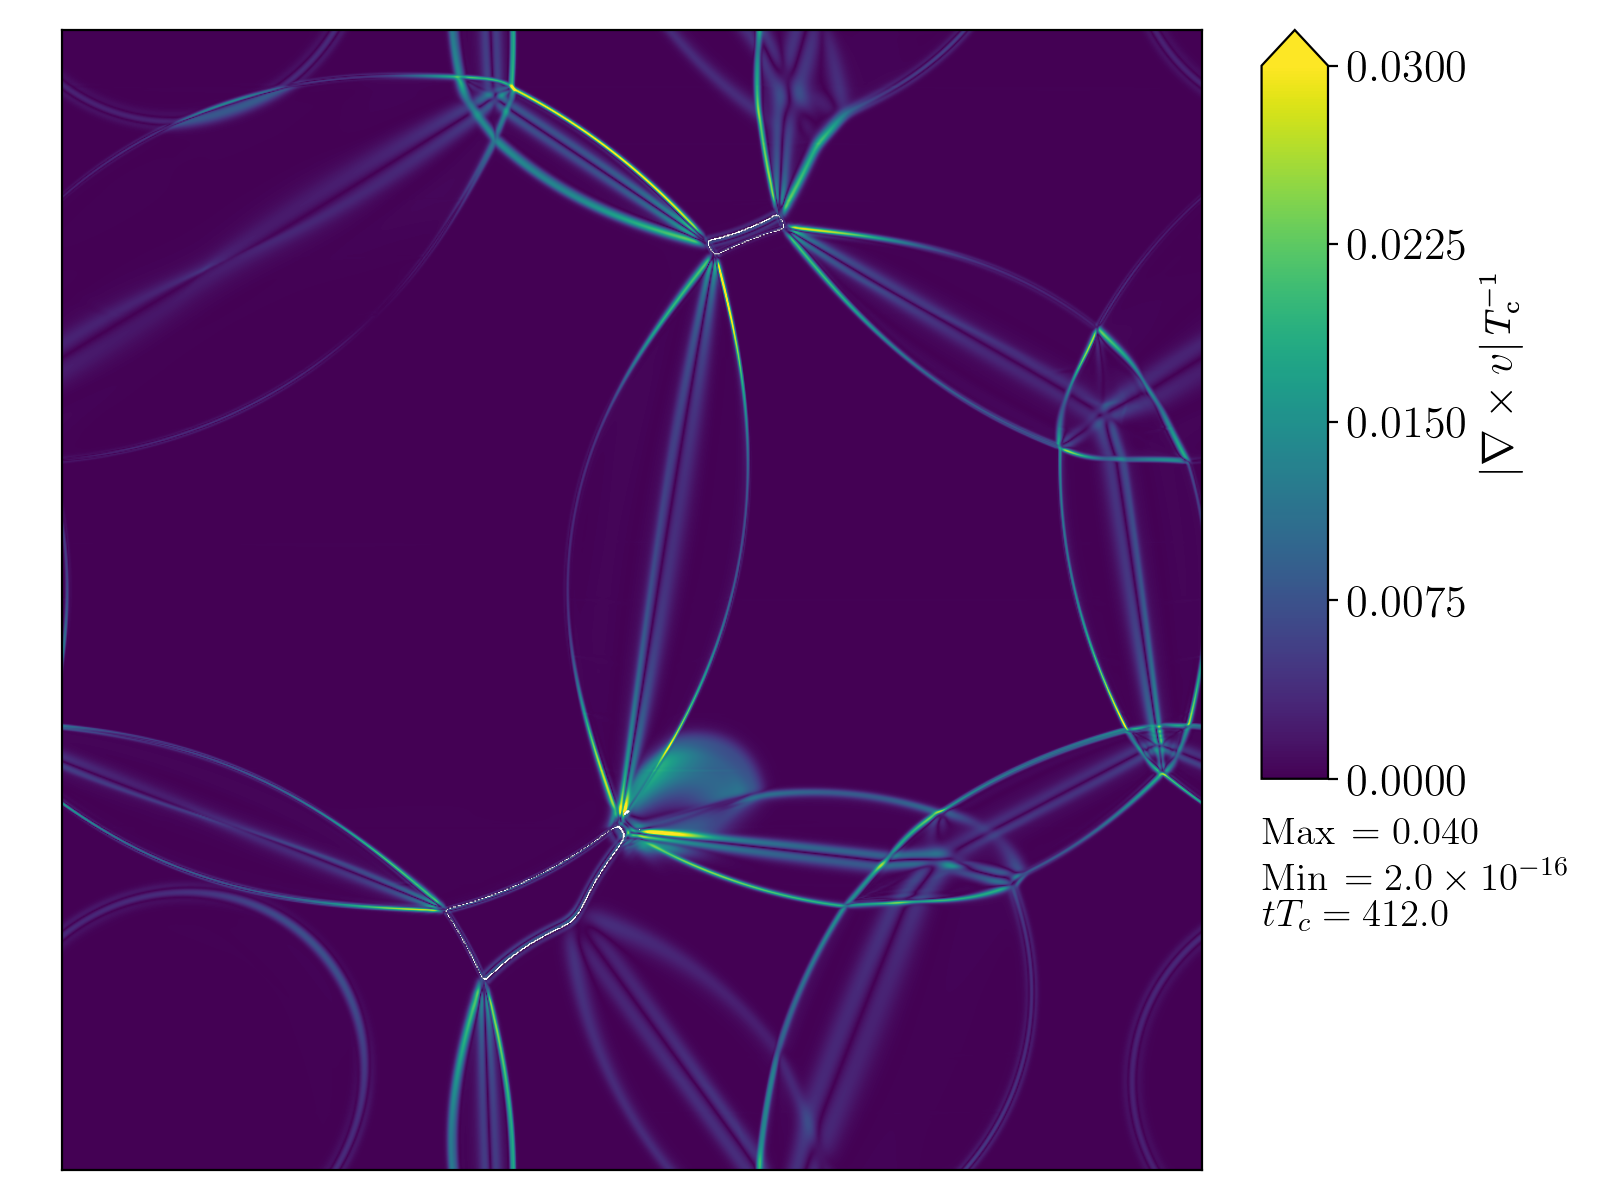
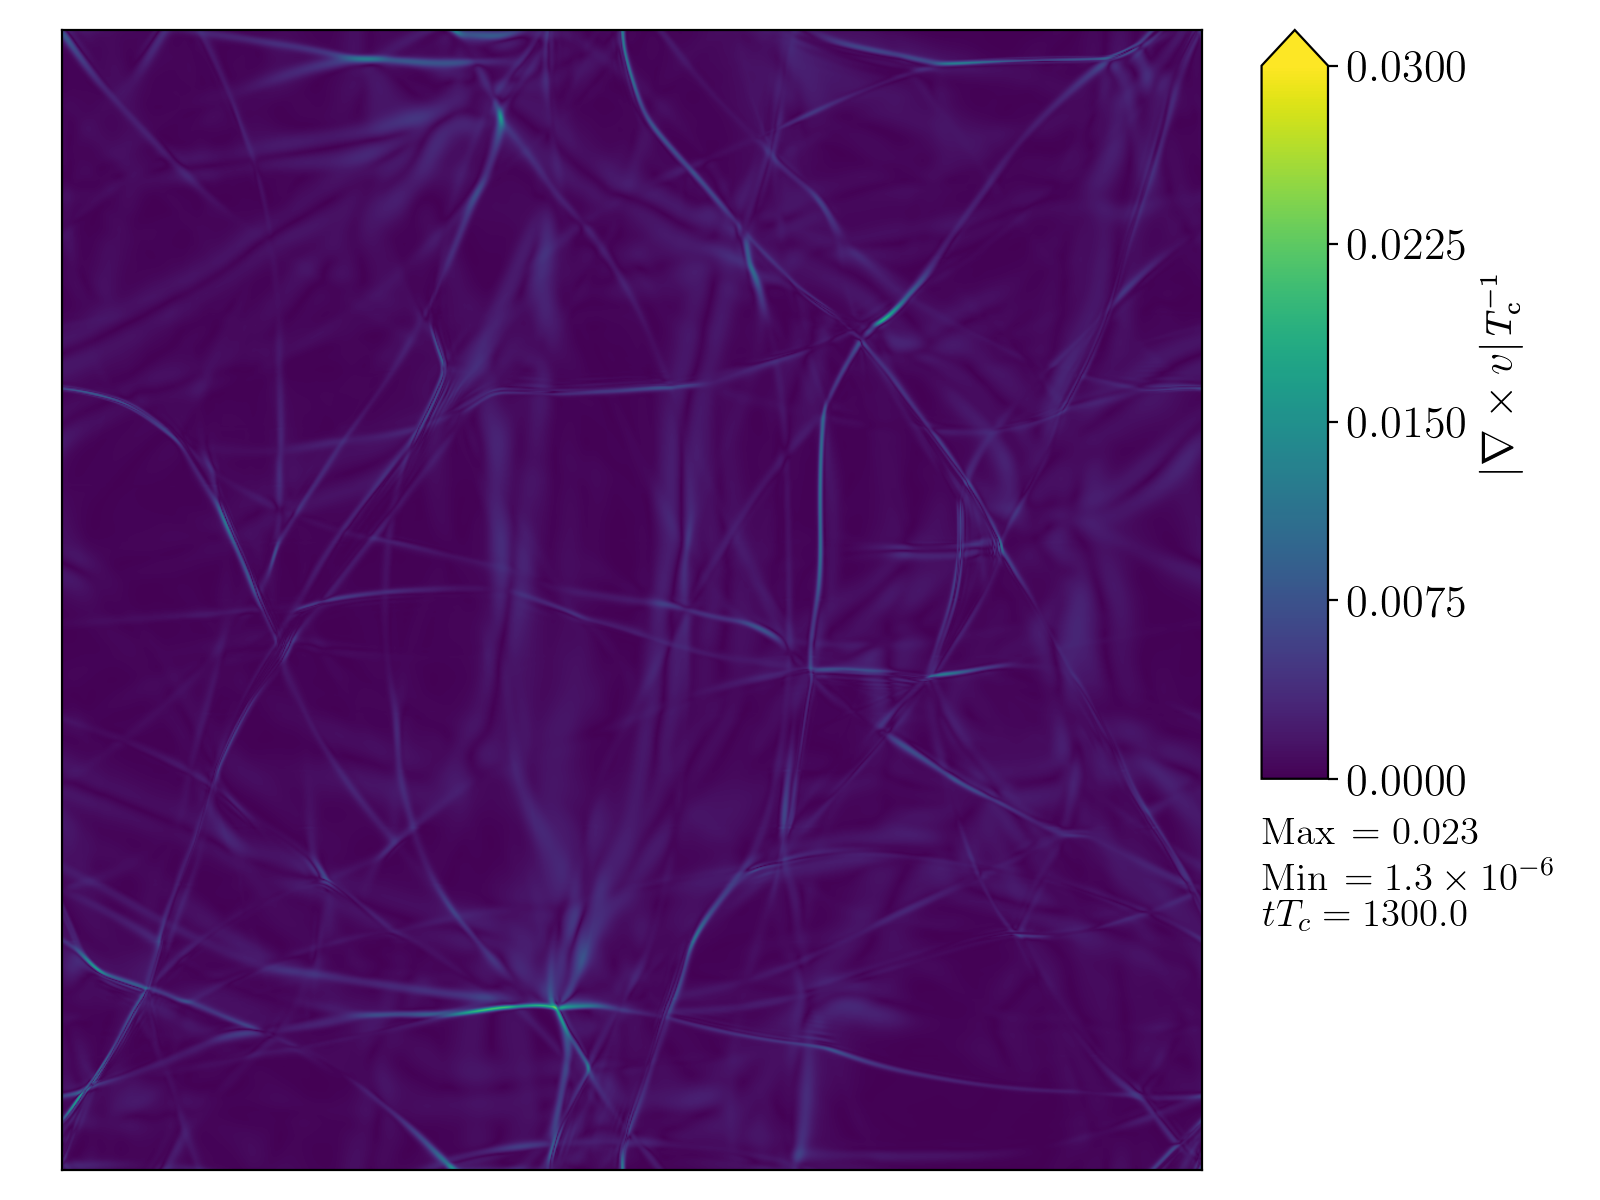
We output slices of the temperature , fluid speed and vorticity magnitude . Movies created from these slices are available at Cutting (2019). Selected stills are included in the supplemental material.
We measure the RMS fluid 3-velocity , and its irrotational and rotational parts and . We also track the enthalpy-weighted RMS four-velocity defined as
| (10) |
where the mean enthalpy density. This gives an indication of the magnitude of the shear stress, the source of gravitational waves.
A similar quantity can be constructed to track the progress of the phase transition
| (11) |
proportional to the total area of the phase boundary. We call the time when reaches its maximum the peak collision time, . Note that . To see how these global quantities evolve during a detonation and a deflagration see Fig. 10 in the supplemental material.
To check the dependence of our key observables on lattice spacing, we perform simulations with the same physical volume and various lattice spacings for and and . We find that , , and converge with lattice spacing. We perform a quadratic fit with for each quantity, finding that and differ from the continuum limit by . The quantity that is most sensitive to the grid is which we underestimate from the continuum limit by . We also test convergence of key observables with timestep, finding in all cases that convergence is better for than for . It is important to check how close the colliding bubbles are to their asymptotic profile. We find that spherically symmetric bubbles with diameter have at worst within of the asymptotic . In the supplemental material we show our convergence test results and the deviation from asymptotic for all and considered here.
From our simulations we see that a rotational component of velocity is generated during the bubble collision phase. In order to gauge the relative amount of kinetic energy in the rotational component of velocity, we consider the ratio of the maxima of mean square 3-velocities . We plot this in Fig. 1. As we increase for the deflagrations, we see that the proportion of the velocity found in rotational modes increases dramatically, whereas for detonations it stays constant. The deflagrations with smaller wall velocities have a larger proportion of the velocity in rotational modes. For , the ratio , and if we naively extrapolate the trend in the last few points up to this increases to .
Fig. 11 of the supplemental material shows that the vorticity is generated inside the bubbles, not outside where the fluid shells first interact.

To better understand transfer of energy from the scalar field to the fluid, we plot how and change as we increase for detonations with and deflagrations with (Fig. 2). When reaches its maximum, the volumes in each phase are approximately equal. As the phase boundary sweeps out the remaining regions of metastable phase, relaxes to zero. It is striking that for deflagrations the relaxation takes longer as we increase , whereas for detonations the shape of remains unchanged. The phase boundaries in a deflagration must therefore move more slowly in the later stages, as the transition strength increases.

The reason for the slowing is that the metastable phase is reheated by the fluid shells in front of the bubble walls Kurki-Suonio (1985); Konstandin and No (2011); Mégevand and Ramírez (2018). Towards the end of the transition the remaining metastable phase forms into hot droplets (see Fig. 11 in the supplemental material). The higher pressure inside the droplets opposes their collapse.
For detonations, where the fluid shell develops behind the bubble wall, shrinking regions of the metastable phase are not reheated (see Fig. 12 in the supplemental material).
Fig. 2 also shows that increases with , as one expects from the increasing scalar potential energy. However, the maximum is below that expected from a single bubble, which is a good estimate of at low Hindmarsh et al. (2015, 2017).
To obtain the single-bubble estimate, simulations of expanding spherical bubbles are performed, and the expected enthalpy-weighted RMS velocity is that of the fluid shell when the wall reaches a diameter of . We then take the ratio with the maximum of in each simulation, shown in Fig. 3. Note that due to finite volume effects oscillates in our simulations, giving an O(10%) uncertainty to this estimate.
For all wall speeds, the ratio of to decreases as we increase the transition strength. However, for deflagrations the decrease in the kinetic efficiency is more dramatic, and more rapid for slower walls: in the slowest deflagration (), reaches . The decrease is approximately linear; a naive linear extrapolation to the maximum possible strength is indicated by open circles. The loss of kinetic energy is probably a result of the slowing discussed above, limiting the transfer of energy.

The deficit in kinetic energy can be expected to reduce the gravitational wave signal. In current modelling Caprini et al. (2016); Hindmarsh et al. (2017), the expected gravitational wave density parameter from a flow with at time is
| (12) |
where has been shown to be a constant of in weak and intermediate transitions. Here, we take . In Fig. 4 we plot the ratio of to , where is averaged over the final of the simulation. In the most extreme case, and , the ratio is . This is even less than the kinetic energy suppression suggests, a factor of .
A table of simulation parameters and measured quantities can be found in the supplemental material.

We have performed the first 3-dimensional simulations of strong first-order phase transitions, with the strength parameter up to an order of magnitude larger than those previously studied Hindmarsh et al. (2017).
A rotational component of velocity is generated during the collision phase. For deflagrations, the ratio grows rapidly with , reaching for . For detonations, the ratio is O()—showing no consistent trend with .
For stronger phase transitions a smaller proportion of the scalar potential energy is transferred into fluid kinetic energy than is expected from the behaviour of isolated bubbles. For deflagrations, we suppose that the deficit is due to reheating of the metastable phase slowing the bubble walls during the collision phase. The deficit can be substantial, with falling to for in our simulations, and could fall as low as using a naive linear extrapolation to the maximum possible strength at that wall speed.
The gravitational wave intensity is lower than expected, by a factor of order for the strongest deflagration with the lowest wall speed. This can mostly be accounted for by the kinetic energy deficit. Detonations do not suffer such a dramatic suppression, with the smallest suppression factor about for .
Our results have important consequences for gravitational waves from phase transitions. They indicate that the current model Caprini et al. (2016); Hindmarsh et al. (2017) overestimates the gravitational wave power spectrum for strong transitions, by a factor of a few for detonations, and by an order of magnitude or more for deflagrations. We estimate222We use PTPlot v1.01, http://www.ptplot.org/ptplot/Caprini:2019egz, to compute and plot signal to noise ratio (SNR) curves from first-order phase transitions for LISA. We choose and an optimistic . The resulting plot shows that an SNR of 10 requires of at least 0.07 for all . that to obtain a signal to noise ratio of 10 must be at least 0.07. Therefore the kinetic energy suppression we observe will probably render transitions with unobservable except for within a very small region of parameter space. Faster walls suffer less suppression, though the observable parameter space is still reduced.
We plan larger simulations to characterise more precisely the suppression, and its effect on observability.
Acknowledgements.
The authors would like to thank Chiara Caprini, Kari Rummukainen, and Danièle Steer for helpful discussions. Our simulations made use of the resources of the Finnish Centre for Scientific Computing CSC. DC (ORCID ID 0000-0002-7395-7802) is supported by an STFC Studentship. MH (ORCID ID 0000-0002-9307-437X) acknowledges support from the Science and Technology Facilities Council, grant no. ST/P000819/1. DJW (ORCID ID 0000-0001-6986-0517) is supported by an Science and Technology Facilities Council Ernest Rutherford Fellowship, grant no. ST/R003904/1, by the Research Funds of the University of Helsinki, and by the Academy of Finland, grant no. 286769.References
- Audley et al. (2017) H. Audley et al., (2017), arXiv:1702.00786 [astro-ph.IM] .ω
- Kajantie et al. (1996) K. Kajantie, M. Laine, K. Rummukainen, and M. E. Shaposhnikov, Phys.Rev.Lett. 77, 2887 (1996), arXiv:hep-ph/9605288 [hep-ph] .ω
- Kajantie et al. (1997) K. Kajantie, M. Laine, K. Rummukainen, and M. E. Shaposhnikov, Nucl.Phys. B493, 413 (1997), arXiv:hep-lat/9612006 [hep-lat] .ω
- Profumo et al. (2007) S. Profumo, M. J. Ramsey-Musolf, and G. Shaughnessy, JHEP 08, 010 (2007), arXiv:0705.2425 [hep-ph] .ω
- Espinosa et al. (2012) J. R. Espinosa, T. Konstandin, and F. Riva, Nucl. Phys. B854, 592 (2012), arXiv:1107.5441 [hep-ph] .ω
- Cline and Kainulainen (2013) J. M. Cline and K. Kainulainen, JCAP 1301, 012 (2013), arXiv:1210.4196 [hep-ph] .ω
- Profumo et al. (2015) S. Profumo, M. J. Ramsey-Musolf, C. L. Wainwright, and P. Winslow, Phys. Rev. D91, 035018 (2015), arXiv:1407.5342 [hep-ph] .ω
- Beniwal et al. (2019) A. Beniwal, M. Lewicki, M. White, and A. G. Williams, JHEP 02, 183 (2019), arXiv:1810.02380 [hep-ph] .ω
- Kakizaki et al. (2015) M. Kakizaki, S. Kanemura, and T. Matsui, Phys. Rev. D92, 115007 (2015), arXiv:1509.08394 [hep-ph] .ω
- Dorsch et al. (2017) G. C. Dorsch, S. J. Huber, T. Konstandin, and J. M. No, JCAP 1705, 052 (2017), arXiv:1611.05874 [hep-ph] .ω
- Basler et al. (2017) P. Basler, M. Krause, M. Muhlleitner, J. Wittbrodt, and A. Wlotzka, JHEP 02, 121 (2017), arXiv:1612.04086 [hep-ph] .ω
- Randall and Servant (2007) L. Randall and G. Servant, JHEP 05, 054 (2007), arXiv:hep-ph/0607158 [hep-ph] .ω
- Konstandin et al. (2010) T. Konstandin, G. Nardini, and M. Quiros, Phys. Rev. D 82, 083513 (2010).ω
- Konstandin and Servant (2011) T. Konstandin and G. Servant, JCAP 1112, 009 (2011), arXiv:1104.4791 [hep-ph] .ω
- von Harling and Servant (2018) B. von Harling and G. Servant, JHEP 01, 159 (2018), arXiv:1711.11554 [hep-ph] .ω
- Dillon et al. (2018) B. M. Dillon, B. K. El-Menoufi, S. J. Huber, and J. P. Manuel, Phys. Rev. D98, 086005 (2018), arXiv:1708.02953 [hep-th] .ω
- Megías et al. (2018) E. Megías, G. Nardini, and M. Quirós, JHEP 09, 095 (2018), arXiv:1806.04877 [hep-ph] .ω
- Bruggisser et al. (2018) S. Bruggisser, B. Von Harling, O. Matsedonskyi, and G. Servant, JHEP 12, 099 (2018), arXiv:1804.07314 [hep-ph] .ω
- Schwaller (2015) P. Schwaller, Phys. Rev. Lett. 115, 181101 (2015), arXiv:1504.07263 [hep-ph] .ω
- Addazi and Marciano (2018) A. Addazi and A. Marciano, Chin. Phys. C42, 023107 (2018), arXiv:1703.03248 [hep-ph] .ω
- Aoki et al. (2017) M. Aoki, H. Goto, and J. Kubo, Phys. Rev. D96, 075045 (2017), arXiv:1709.07572 [hep-ph] .ω
- Croon et al. (2018) D. Croon, V. Sanz, and G. White, JHEP 08, 203 (2018), arXiv:1806.02332 [hep-ph] .ω
- Breitbach et al. (2018) M. Breitbach, J. Kopp, E. Madge, T. Opferkuch, and P. Schwaller, (2018), arXiv:1811.11175 [hep-ph] .ω
- Okada and Seto (2018) N. Okada and O. Seto, Phys. Rev. D98, 063532 (2018), arXiv:1807.00336 [hep-ph] .ω
- Hasegawa et al. (2019) T. Hasegawa, N. Okada, and O. Seto, Phys. Rev. D99, 095039 (2019), arXiv:1904.03020 [hep-ph] .ω
- Gorda et al. (2019) T. Gorda, A. Helset, L. Niemi, T. V. I. Tenkanen, and D. J. Weir, JHEP 02, 081 (2019), arXiv:1802.05056 [hep-ph] .ω
- Gould et al. (2019) O. Gould, J. Kozaczuk, L. Niemi, M. J. Ramsey-Musolf, T. V. I. Tenkanen, and D. J. Weir, (2019), arXiv:1903.11604 [hep-ph] .ω
- Kainulainen et al. (2019) K. Kainulainen, V. Keus, L. Niemi, K. Rummukainen, T. V. I. Tenkanen, and V. Vaskonen, (2019), arXiv:1904.01329 [hep-ph] .ω
- Hindmarsh et al. (2014) M. Hindmarsh, S. J. Huber, K. Rummukainen, and D. J. Weir, Phys.Rev.Lett. 112, 041301 (2014), arXiv:1304.2433 [hep-ph] .ω
- Giblin and Mertens (2014) J. T. Giblin and J. B. Mertens, Phys.Rev. D90, 023532 (2014), arXiv:1405.4005 [astro-ph.CO] .ω
- Hindmarsh et al. (2015) M. Hindmarsh, S. J. Huber, K. Rummukainen, and D. J. Weir, Phys. Rev. D92, 123009 (2015), arXiv:1504.03291 [astro-ph.CO] .ω
- Hindmarsh et al. (2017) M. Hindmarsh, S. J. Huber, K. Rummukainen, and D. J. Weir, Phys. Rev. D96, 103520 (2017), arXiv:1704.05871 [astro-ph.CO] .ω
- Hindmarsh (2018) M. Hindmarsh, Phys. Rev. Lett. 120, 071301 (2018), arXiv:1608.04735 [astro-ph.CO] .ω
- Jinno and Takimoto (2017) R. Jinno and M. Takimoto, Phys. Rev. D95, 024009 (2017), arXiv:1605.01403 [astro-ph.CO] .ω
- Konstandin (2018) T. Konstandin, JCAP 1803, 047 (2018), arXiv:1712.06869 [astro-ph.CO] .ω
- Witten (1984) E. Witten, Phys.Rev. D30, 272 (1984).ω
- Kurki-Suonio (1985) H. Kurki-Suonio, Nucl.Phys. B255, 231 (1985).ω
- Kamionkowski et al. (1994) M. Kamionkowski, A. Kosowsky, and M. S. Turner, Phys.Rev. D49, 2837 (1994), arXiv:astro-ph/9310044 [astro-ph] .ω
- Caprini et al. (2008) C. Caprini, R. Durrer, and G. Servant, Phys.Rev. D77, 124015 (2008), arXiv:0711.2593 [astro-ph] .ω
- Gogoberidze et al. (2007) G. Gogoberidze, T. Kahniashvili, and A. Kosowsky, Phys.Rev. D76, 083002 (2007), arXiv:0705.1733 [astro-ph] .ω
- Caprini et al. (2009a) C. Caprini, R. Durrer, and G. Servant, JCAP 0912, 024 (2009a), arXiv:0909.0622 [astro-ph.CO] .ω
- Caprini et al. (2009b) C. Caprini, R. Durrer, T. Konstandin, and G. Servant, Phys.Rev. D79, 083519 (2009b), arXiv:0901.1661 [astro-ph.CO] .ω
- Niksa et al. (2018) P. Niksa, M. Schlederer, and G. Sigl, Class. Quant. Grav. 35, 144001 (2018), arXiv:1803.02271 [astro-ph.CO] .ω
- Ellis et al. (2018) J. Ellis, M. Lewicki, and J. M. No, (2018), 10.1088/1475-7516/2019/04/003, [JCAP1904,003(2019)], arXiv:1809.08242 [hep-ph] .ω
- Ellis et al. (2019) J. Ellis, M. Lewicki, J. M. No, and V. Vaskonen, (2019), arXiv:1903.09642 [hep-ph] .ω
- Pol et al. (2019) A. R. Pol, S. Mandal, A. Brandenburg, T. Kahniashvili, and A. Kosowsky, (2019), arXiv:1903.08585 [astro-ph.CO] .ω
- Jinno et al. (2019) R. Jinno, H. Seong, M. Takimoto, and C. M. Um, (2019), arXiv:1905.00899 [astro-ph.CO] .ω
- Konstandin and No (2011) T. Konstandin and J. M. No, JCAP 1102, 008 (2011), arXiv:1011.3735 [hep-ph] .ω
- Mégevand and Ramírez (2018) A. Mégevand and S. Ramírez, Nucl. Phys. B928, 38 (2018), arXiv:1710.06279 [astro-ph.CO] .ω
- Ignatius et al. (1994) J. Ignatius, K. Kajantie, H. Kurki-Suonio, and M. Laine, Phys.Rev. D49, 3854 (1994), arXiv:astro-ph/9309059 [astro-ph] .ω
- Liu et al. (1992) B.-H. Liu, L. D. McLerran, and N. Turok, Phys. Rev. D46, 2668 (1992).ω
- Garcia-Bellido et al. (2008) J. Garcia-Bellido, D. G. Figueroa, and A. Sastre, Phys.Rev. D77, 043517 (2008), arXiv:0707.0839 [hep-ph] .ω
- Kurki-Suonio and Laine (1996) H. Kurki-Suonio and M. Laine, Phys.Rev. D54, 7163 (1996), arXiv:hep-ph/9512202 [hep-ph] .ω
- Kurki-Suonio and Laine (1995) H. Kurki-Suonio and M. Laine, Phys.Rev. D51, 5431 (1995), arXiv:hep-ph/9501216 [hep-ph] .ω
- John and Schmidt (2001) P. John and M. G. Schmidt, Nucl. Phys. B598, 291 (2001), [Erratum: Nucl. Phys.B648,449(2003)], arXiv:hep-ph/0002050 [hep-ph] .ω
- Moore and Prokopec (1995) G. D. Moore and T. Prokopec, Phys.Rev. D52, 7182 (1995), arXiv:hep-ph/9506475 [hep-ph] .ω
- Cutting (2019) D. Cutting, (2019), see movies of strong phase transitions available at https://vimeo.com/album/5968055.ω
- Espinosa et al. (2010) J. R. Espinosa, T. Konstandin, J. M. No, and G. Servant, JCAP 1006, 028 (2010), arXiv:1004.4187 [hep-ph] .ω
- Caprini et al. (2016) C. Caprini et al., JCAP 1604, 001 (2016), arXiv:1512.06239 [astro-ph.CO] .ω
I Supplemental Material
I.1 Field and fluid equations of motion
In order to obtain the equations of motion for our field and fluid system we focus on the coupling between the field and fluid parts of our energy momentum tensor. The current of the energy-momentum tensor can be split into field and fluid parts and coupled through a dissipative friction term,
| (13) | ||||
| (14) |
We can then write this coupling term as
| (15) |
From these two equations we can extract the equation of motion for our system. By taking Eq (13) and dividing through by we obtain
| (16) |
We find the equation of motion for the fluid energy density by contracting Eq (14) with giving
| (17) |
Finally we obtain an expression for the fluid momentum density by considering the spatial components of Eq (14),
| (18) |
I.2 Gravitational waves
To obtain the gravitational wave energy density we must first calculate the transverse traceless perturbations in the metric, . We operate in linearised gravity and therefore the equation of motion for is
| (19) |
where is the transverse traceless projection of the energy-momentum tensor.
Due to the numerical cost of computing the transverse traceless components of the energy-momentum tensor, it is useful to instead track an auxiliary tensor Garcia-Bellido et al. (2008) which evolves according to
| (20) |
Then to obtain from we apply the transverse traceless projector in wave space,
| (21) |
where
| (22) |
and
| (23) |
This method then allows us to only need to perform the necessary Fourier transforms and projections to calculate the gravitational wave energy density at regular intervals rather than every timestep.
I.3 Resolution convergence
To ensure the validity of our simulations we performed a series of lattice resolution checks. To do this we repeated two simulations with and and for a variety of different lattice spacings and timesteps while keeping the total physical volume and duration of the simulations fixed. We plot the convergence of several key quantities with in Fig. 5 through Fig. 7. We also plot a quadratic fit for the convergence of each quantity with . We can see that all quantities converge. The worst convergence is for which for we underestimate by up to from the extrapolation to the continuum limit. We also performed tests for convergence of our simulations with . For the error from our simulations is within from the continuum limit for and and for .


I.4 Convergence to asymptotic fluid flow
In addition to testing convergence with lattice spacing, we also check how close the fluid shells around colliding bubbles in our simulation are to the final asymptotic profiles. To do this we perform spherically symmetric 1D simulations of isolated bubbles and calculate from the fluid shell when the bubble has diameter . We then compare this to calculated from the fluid shell at , i.e when the diameter is and the profile has reached its asymptotic solution. We plot the ratio of these two quantities for all and in Fig. 8. We can see that the bubbles colliding with the diameter of the average bubble seperation are within of the asymptotic for all simulations. We believe this to be sufficient for this study, and save a further investigation on the convergence with increasing for a future work.

I.5 Parameter space
In order to understand the regions of parameter space mapped out by our simulations, it can be illuminating to plot the asymptotic maximum fluid flow velocity against the wall velocity for each simulation point. We do this in Fig. 9. Plotting the parameter space in this manner separates subsonic-deflagrations, supersonic-deflagrations, and detonations. Stronger phase transitions with the same wall velocity have a larger value of . Transitions with are forbidden as this would mean that in the wall frame fluid was flowing out from the bubble. We additionally colour each simulation point by the suppression factor in gravitational waves found in our study.

I.6 Evolution of global quantities
In Fig. 10 we plot how and evolve for a deflagration and a detonation, both with strength . We see that a rotational component of velocity is generated during the bubble collision phase, and that the deflagration generates more efficiently than the detonation. We also see that, for the deflagration, decreases more slowly than it increases, indicating a slowing down of the phase boundary.

I.7 Simulation slice stills
In this supplemental material we include various stills taken from movies of our simulations of strong phase transitions in the early universe, which can be seen in Fig. 11 and Fig. 12. The movies these stills have been taken from can be found in a Vimeo album Cutting (2019).
