Discovery of four apparently cold dusty galaxies at –5.85 in the COSMOS field:
direct evidence of CMB impact on high-redshift galaxy observables
Abstract
We report Atacama Large Millimetre Array (ALMA) observations of four high-redshift dusty star-forming galaxy candidates selected from far-Infrared (FIR)/submm observations in the COSMOS field. We securely detect all galaxies in the continuum and spectroscopically confirm them at z=3.62–5.85 using ALMA 3mm line scans, detecting multiple CO and/or [CI] transitions. This includes the most distant dusty galaxy currently known in the COSMOS field, ID85001929 at z=5.847. These redshifts are lower than we had expected as these galaxies have substantially colder dust temperatures (i.e., their SEDs peak at longer rest frame wavelengths) than most literature sources at z¿4. The observed cold dust temperatures are best understood as evidence for optically thick dust continuum in the FIR, rather than the result of low star formation efficiency with rapid metal enrichment. We provide direct evidence that, given their cold spectral energy distributions, CMB plays a significant role biasing their observed Rayleigh-Jeans (RJ) slopes to unlikely steep values and, possibly, reducing their CO fluxes by a factor of two. We recover standard RJ slopes when the CMB contribution is taken into account. High resolution ALMA imaging shows compact morphology and evidence for mergers. This work reveals a population of cold dusty star-forming galaxies that were under-represented in current surveys, and are even colder than typical Main Sequence galaxies at the same redshift. High FIR dust optical depth might be a widespread feature of compact starbursts at any redshift.
Subject headings:
galaxies: evolution — galaxies: ISM — galaxies: high-redshift — submillimeter: galaxies1. Introduction
Dust temperature is an important parameter of the interstellar medium (ISM) of galaxies, encoded in the shape of their infrared spectral energy distribution (SED) (Draine & Li, 2007). It is strongly correlated with the mean intensity of the radiation field , that in turn can be used to infer the metallicity-weighted star formation efficiency (i.e., SFE/Z, Magdis et al. 2012).
It is now well established that for main-sequence (MS) galaxies111Here and in the rest of the paper we are discussing massive galaxies, above ., which dominate cosmic star formation at all observed redshifts (Rodighiero et al., 2011; Schreiber et al., 2015), the dust temperature is rising with redshift up to at least . From the analysis of infrared SEDs at mid-infrared to millimeter wavelengths for individual MS galaxies and for stacked ensembles, Magdis et al. (2012) were first to measure the evolution of dust temperature with redshift, finding that MS galaxies have more intense radiation fields and thus warmer temperatures as the redshift increases from to 2. By stacking far-infrared and submillimetre data from the Herschel Space Observatory, Magnelli et al. (2014) studied the evolution of the dust temperature of MS galaxies up to , largely confirming these results. Later on, Béthermin et al. (2015) found that the mean intensity of the radiation field increases with increasing redshift up to in MS galaxies, following the trend (somewhat faster than in Magdis et al. 2012) and consistent with models that account for the decrease in the gas metallicity with redshift. Using both individual detections and stacks of Herschel and Atacama Large Millimetre Array (ALMA) imaging, Schreiber et al. (2018) also found a consistent trend of increasing dust temperature with redshifts up to for MS galaxies. The typical scatter across the MS at fixed redshift is about 0.2-0.3 dex in terms of the intensity of the radiation field and 10-13% in terms of (Magdis et al., 2012; Schreiber et al., 2018). Similar trends of dust temperature have been reported by simulations (Liang et al., 2019).
On the other hand, starburst galaxies (SBs) have a different trend of dust temperature with redshift with respect to MS galaxies, and show an almost constant from to and perhaps further (Béthermin et al., 2015; Schreiber et al., 2018), when fitted with optically thin dust models like MS galaxies. These SBs are galaxies situated substantially above the MS and are typically (U)LIRGs in the local Universe. At moderate redshifts (up to –2), SB galaxies are observed to have hotter dust and higher star formation efficiency (SFE) with respect to MS galaxies. Ensemble average dust temperatures for SBs are not currently measured with good accuracy at . However, quite intriguingly, the extrapolation of the trends found by Béthermin et al. (2015) suggests that dust in typical SBs might become colder than MS galaxies starting somewhere at , and possibly all the way to higher redshifts if the dust temperature-redshift trends discussed above persist in the earlier Universe. It is currently unclear what could cause such a reversal from the local Universe, where ULIRGs are much warmer than spirals and display much higher star formation efficiencies (SFEs), as a result of the merger process (e.g., Renaud et al. 2018, 2019).
A case of a fairly cold starburst at high redshift has already been observed, individually, in the GN20 galaxy (, Daddi et al. 2009; Tan et al. 2014). Its dust temperature has been estimated as K (Magdis et al., 2012), colder than the average dust temperature of MS galaxies at the same redshift. Still, most super-luminous dusty systems at are typically found to show fairly hot dust temperature ( K, e.g., Riechers et al., 2013; Smolčić et al., 2015; Riechers et al., 2017; Pavesi et al., 2018). While dusty galaxies colder than GN20 have not been seen yet at , it is unclear whether the GN20 case is just a curiosity, or the tip of the iceberg for a cold galaxy population missing in current studies. Thus, investigating galaxy SEDs on larger samples at is fundamental to answer this question. Although hundreds of square degrees have been mapped at FIR/(sub)mm wavelengths to sufficient depths that should allow detection of dusty star-forming galaxies (DSFGs) with a roughly fixed SFR threshold up to –10 (particularly from Herschel SPIRE and submm/mm ground based detectors, Zavala et al. 2018), only a handful of sources have been spectroscopically confirmed to lie at (Capak et al., 2011; Walter et al., 2012; Vieira et al., 2013; Smolčić et al., 2015; Riechers et al., 2017; Pavesi et al., 2018) and only three at (Riechers et al., 2013; Strandet et al., 2017; Zavala et al., 2018; Fudamoto et al., 2017). These samples were pre-selected by their red colors in far-infrared bands (Riechers et al., 2013, 2017) and/or strong detections at (sub)mm wavelengths (e.g., Walter et al., 2012; Strandet et al., 2017). The SED shapes and FIR colors of galaxies are subject to the well known degeneracy between dust temperature and redshift, so that the same far-IR SED can be reproduced either by relatively hot dust continuum emission at high redshift, or by intrinsically colder dust at lower redshift. Nevertheless, the spectroscopically confirmed samples at –5 are all displaying fairly hot dust content, and cold dusty samples similar to GN20 have not been reported yet.
The persistent sparsity of these very high-z SMG samples is likely not only due to the intrinsic rarity of massive dusty galaxies in the early Universe, going along with the decrease in the star formation rate density to early times (Lilly et al., 1996; Madau et al., 1998; Madau & Dickinson, 2014; Liu et al., 2018), but also to incompleteness, i.e., missing detections of more typical objects at faint fluxes in heavily blended FIR/(sub)mm images. To counter these problems a number of new generation FIR catalogs have been built (Béthermin et al., 2010, 2012, 2015; Roseboom et al., 2010; Elbaz et al., 2011; Safarzadeh et al., 2015; Hurley et al., 2017; Lee et al., 2013), that should allow in principle selection of DSFGs down to lower luminosities and up to highest redshifts. Notably, we have been developing new ’super-deblended’ catalogs (Liu et al., 2018; Jin et al., 2018) that provide state-of-the-art FIR photometry with well behaved quasi-Gaussian uncertainties while limiting as much as possible the effects of blending from the poor IR PSFs of current ground-based facilities. Our super-deblended catalogs detect a substantial number of FIR-detected galaxy candidates for which only a small fraction of spectroscopic identifications are as yet available. Given the less extreme luminosities of these candidates, it is more difficult to identify their redshifts spectroscopically. Detection of rest-frame UV/optical lines is time-consuming (Chapman et al., 2005; Capak et al., 2011), and infeasible for DSFGs that are invisible in HST imaging (e.g., Walter et al., 2012; Riechers et al., 2013). IR/(sub)mm fluxes and FIR lines are easier accessible in these objects than optical features (partially by construction), so that (sub)mm line scans (e.g., CO, [CII]) are more efficient for confirming redshifts for IR-selected star-forming samples at 5–7 (Walter et al., 2012; Riechers et al., 2013; Vieira et al., 2013; Strandet et al., 2017; Fudamoto et al., 2017). This method is becoming more prevalent in the ALMA era although the lower luminosity galaxies still require comparably longer efforts for succeeding.
For cold sources in particular, there are extra difficulties stemming not only from the intrinsically fainter luminosities, but also from the effects caused by the cosmic microwave background (CMB) at high redshift. The CMB, increasing in temperature proportionally to , provides an additional source of heating to the ISM, thus increasing the CO luminosities for high-rotational number transitions (e.g., Silk & Spaans 1997). However, taking into account the higher background against which the respective lines must be detected, it actually suppresses any such boost (Papadopoulos et al., 2000). By modeling CO line emission in starburst galaxies, Combes et al. (1999) found that the hotter CMB at high-z does not help the detection of CO lines and the net effect is negative. For Milky-Way (MW) type galaxies, Obreschkow et al. (2009) found that the CO lines will be dramatically suppressed by the weak contrast against the CMB at and might become totally undetectable at . da Cunha et al. (2013) quantified the CMB effects on (sub-)millimeter observations of high-redshift galaxies at , and concluded that the inferred dust and molecular gas masses can be severely underestimated for cold systems if the impact of the CMB is not properly taken into account. Zhang et al. (2016) studied the CMB effect on the observed structural and dynamical characteristics of galaxies. They found that elevated CMB at high-z can dramatically shrink the emergent continuum and low-J CO brightness distributions of the cold molecular gas, thus erasing spatial and spectral contrasts between their brightness distributions and the CMB. This can strongly affect the measurements of dust and gas distribution scale-lengths and velocity fields, and thus the enclosed dynamical masses in galaxies.
It is clear that the potentially dramatic effects of the CMB, and the resulting biases against the coldest sources, will need to be considered carefully when designing and conducting observations. At the same time, studying cold dusty galaxies at higher-z, discovering more examples of them, will be providing the chance to obtain observational confirmation of the predicted CMB effects, while at the same time helping to clarify the cosmic evolution of dust temperature in galaxies with less biases. This is crucial for constraining the physics of star formation and galaxy formation in the very early Universe.
In this paper, we report the discovery of four remarkably cold dusty galaxies at . These galaxies were selected in the FIR/(sub)mm super-deblended catalog in the COSMOS field (Jin et al., 2018). We present here their spectroscopic observations with ALMA Band 3 scans which confirm their redshifts and allow a detailed investigation of their physical properties. The paper is organized as follow. We discuss the targets selection and ALMA observations in Sect.2. The analysis of ALMA spectra, line identifications and redshift estimates are discussed in Sect.3. Sect.4 focuses on the derivation of physical parameters for our target galaxies, with an evaluation of the impact of the CMB on observables. We discuss the implication of these results in Sect.5 and provide our summary and conclusions in Sect.6. We use standard cosmology (73, 0.23, 0.73) and a Chabrier IMF.
We emphasize here that throughout the paper we discuss the coldness of the SED as an objective, directly measured property, reflected in the wavelength location of the peak of the spectral energy distribution, in the rest frame. This is thus independent of any physical, model dependent estimate of the actual effective dust temperature. In fact, an hypothesis we will address in the discussion of this paper is that many of these cold sources are only seemingly cold due to optical depth, while their physical dust temperatures could be much higher. Regardless of the true dust temperature, the CMB effects depend only on the shape of the SED.
2. Sample selection, ALMA observations and data reduction
In the FIR/(sub)mm super-deblended catalog in the COSMOS field, Jin et al. (2018) selected a sample of 85 high-redshift candidates with significant IR detection ( combined) from Herschel, SCUBA2, AzTEC and/or MAMBO images (Cowie et al., 2017; Geach et al., 2017; Aretxaga et al., 2011; Bertoldi et al., 2007). We singled out four galaxies among these candidates for further ALMA follow-up, based on their highest photometric redshifts that were derived using the HFLS3 template (Riechers et al., 2013). Among these four galaxies, ID20010161 was originally detected in the VLA 3 GHz catalog (Smolčić et al., 2017), while the others were found in residual images from the SCUBA2 850 m maps from Geach et al. (2017), after subtracting all known sources in our super-deblending process (see details in Sec. 4.5 in Jin et al. 2018). The four sources have no detection in HST nor in UltraVISTA images (McCracken et al., 2012; Laigle et al., 2016), while we found red IRAC counterparts in the Spitzer Large Area Survey with Hyper-Suprime-Cam (SPLASH, P. Capak et al., in preparation) imaging datasets, well-aligned with their VLA/SCUBA2 positions with offsets . The subsequent ALMA observations with sub-arcsec beam, described in the next sections, leave no further doubts on the correctness of the IRAC counterpart identification.
We followed-up the four sources with ALMA Band 3 spectroscopic scans in Cycle 5 (Project ID: 2017.1.00373.S, PI: S. Jin). The Band 3 observations were performed by combining 3 tunings covering 84–108 GHz with resolution of 16 MHz, which is a more efficient way than performing formal scans albeit at the price of small gaps (850km/s) within the spectral range. The observations were carried out with the array configuration C43-6 giving a synthesized beam of . The four galaxies were observed with track-sharing, each source was observed for 1.3 hours of on-source time in each tuning, reaching typical rms sensitivities of mJy per 500 km/s. We also used ALMA Band 6 imaging (Project ID: 2016.1.00279.S, PI: I. Oteo) available in the archive for two of of our targets. The Band 6 observations are taken in a single tuning at 230 GHz with 56 seconds of integration time per source. One of our sources has also 345 GHz imaging publicly available from the program 2016.1.00463.S (PI: Y. Matsuda). The sources are very strongly detected in the continuum but show no evidence for lines at 230 GHz or 345 GHz.
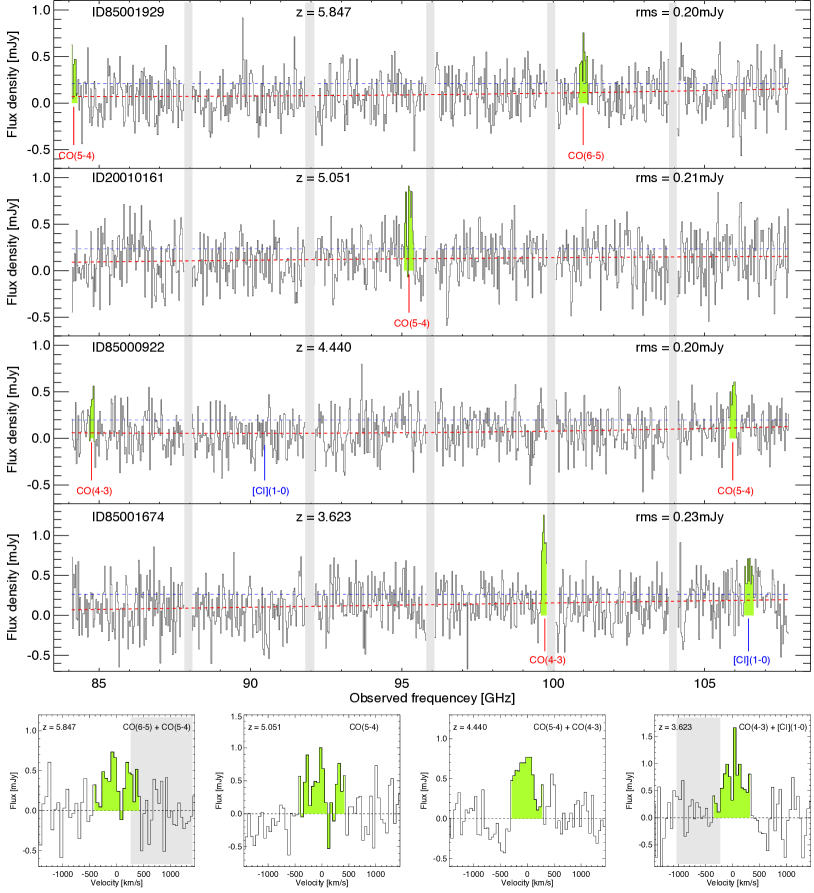
We processed the 3mm spectra by reproducing the observatory calibration with their custom-made script based on Common Astronomy Software Application package (CASA, McMullin et al., 2007). We converted the data into uvfits format to perform further analysis with the IRAM GILDAS tool working on the uv-space (visibility) data. The source positions are determined by the centroid of collapsed 3mm (and 1mm when available) data cubes which mostly show highly significant continuum detections, and used these positions for extracting spectra by fitting source models in the uv-space. We iteratively searched for evidence of resolved emission either in the continuum, emission line candidates, or combination there-of. Only one source was found to be resolved at more than the 3 level, as discussed below. We further extracted spectra for this source with Gaussian models, and use point-source models for the rest. The original spectra with noise are extracted with a resolution of 16MHz per channel. We verified that the noise estimates per channel are reliable from global statistics. We present the binned and noise-normalized spectra in Fig 1.
We also verified the FIR/(sub)mm photometry of the sources that resulted from SCUBA2 residual maps by obtaining new super-deblended photometry using their better determined positions from ALMA. The difference with the original photometry in Jin et al. (2018) is entirely negligible.
| ID | FWZI | ||||||||||
|---|---|---|---|---|---|---|---|---|---|---|---|
| [Jy km/s] | [km/s] | [Jy km/s] | |||||||||
| 85001929 | 5.847 | 5.22 (CO6-5) | 3925 | 7.0e-4 | 885 | 3.27 (CO5-4) | 12 | 0.013 | 0.9e-5 | ||
| 20010161 | 5.051∗ | 5.97 (CO5-4) | 4188 | 1.2e-5 | 850 | – | – | – | – | 1.2e-5 | |
| 85000922 | 4.440 | 4.68 (CO5-4) | 5162 | 0.014 | 608 | 3.55 (CO4-3) | 13 | 0.005 | 0.7e-4 | ||
| 85001674 | 3.623 | 6.33 (CO4-3) | 4294 | 1.3e-6 | 747 | 4.44 ([CI]1-0) | 13 | 1.4e-4 | 1.8e-10 |
Notes: : significance of the first line; : flux density of the first line; : number of effective trials following Eq.2; : chance probability of the first line; FWZI: full width at zero intensity of the lines; : significance of the second line; : flux density of the second line; : number of trials for the second line; : chance probability of the second line; : chance probability of 2 lines. ∗ this redshift is less secure as it is based on single-line identification (see text for details).
3. Redshift confirmation
By sweeping through their full 3mm (continuum subtracted) spectrum, we blindly search for the single emission line feature with the highest significance for each galaxy, following the same line-searching algorithm applied in Daddi et al. (2015), Coogan et al. (2018) and Puglisi et al. (2019). This algorithm returns both the SNR and the optimum velocity range of the line, by determining the pair of starting channel and ending channel, across which the line flux is integrated, that corresponds to the lowest chance probability for the line (hence highest detection significance). The the flux density (Table 1) is integrated over this velocity range which basically corresponds to the FWZI (full width at zero intensity) of the line, which is highlighted in green in Fig. 1 and shown in Table 1. Simulations and double-Gaussian fits carried out in Coogan et al. (2018) show that typically this FWZI is very close to the actual FWHM of the line. As shown in Fig. 1, the most significant lines in the 4 spectra are detected at 5–6 with full velocity widths of 608–885 km/s (Table 1). These linewidths are large but comparable to whose found in the literature for SMGs (e.g., Daddi et al. 2009; Riechers et al. 2013, 2017; Marrone et al. 2018).
3.1. Chance probability of emission lines
We run extensive simulations to determine how to compute the chance probability of finding emission lines (with the same line searching algorithm) as produced by noise fluctuations in a given spectral scan, depending on the SNR of the feature, its linewidth (broader lines are more unlikely to happen by chance because fewer independent realizations are available within the observed range – see also González-López et al. 2019) and also based on the full velocity range spanned by the data, the velocity sampling, and the range of acceptable linewidths (from 100 to 1000 km s-1 in this case). We assume well-behaved Gaussian noise in the data, as verified to hold for our ALMA spectra. We define the probability that a line detection is due to noise fluctuations as:
| (1) |
where is the probability to have a line with SNR up to what observed, in a single trial (approaching 1 for high sigma events) and the exponent is the effective number of trials which, based on our simulations, can be well approximated by:
| (2) |
where and are the number of channels in the entire spectrum scanned and in the recovered line, respectively, while and define the allowed velocity range of lines to be searched, expressed as number of channels. Notice that a naive treatment would account only for the first term (ratio of full velocity in spectrum divided by line velocity), while in reality the number of effective realizations is considerably larger. In fact, less than a full line-velocity shift is required to imply a new realization, and the number of effective realizations depends also on the range of velocity widths searched as the line-width is not known a-priori. We emphasize that this recipe, and in particular Eq.2, holds only in the assumption that there is no active spatial search for the line position, as in our case where the position for the spectral extractions are all strongly constrained by the continuum detections. When one is blindly searching for emission lines having also to determine their spatial position, the number of effective trials would be much larger as Eq.2 would require to be multiplied by the number of effective spatial positions searched 222This is typically assumed to be the area within the primary beam divided by the area covered by half the synthesized beam, although dedicated simulations would be required to confirm this accurately..
3.2. Measuring redshifts for our sample
We report the spurious probability for the strongest line in each spectrum in Table 1 (). They are below 0.1% in all cases except for the 4.7 line of ID85000922 that has a 1.4% probability of being spurious, by itself.
Then we searched for additional matching lines based on the redshift solutions determined by the first ones, using the same velocity range as determined by the primary line, assuming they are CO transitions. We excluded, in fact, solutions in which the primary line was [CI] or H2O, given that stronger accompanying CO lines would have been detected in the spectra in those cases. Meaningful second lines were detected in 3 galaxies with significance of 3.3–4.4. We compute chance probabilities to find matching second lines () based on the significance of each line and the number of search trials performed (). The combined probability for the two-line match is in all cases or lower, hence we consider these three galaxies as reliable spectroscopic confirmations. The redshifts (and line identifications) are determined as CO(5-4)/CO(6-5) at , CO(4-3)/CO(5-4) at and CO(4-3)/[CI](1-0) at (Fig. 1). In Fig. 1-bottom, we present zooms to the weighted averages of lines detected for each galaxy after continuum subtraction. Given that the CO(4-3) line of ID85001674 partially falls in a frequency gap, we ultimately calculate its redshift and velocity width from the [CI](1-0) line. We note that the confirming/second line for ID85001929 is located at the edge of the spectral range, and only partially covered by our data. Still, the available signal within the velocity range pre-determined by the first line is strong enough that its spurious probability is at 0.013. We thus maintain that this identification is secure333Interestingly, some excess flux at 1.1 mm is found in its FIR SED (Fig. 3), which hints at the presence of a bright [CII] 158m line at a consistent redshift that is boosting the AzTEC and MAMBO photometry. However, to make an impact this would need to be at the level of many dozens Jy*km/s, which would imply to ratios at the level of local galaxies . Direct observations are required to confirm this tentative evidence.. Therefore, ID85001929 at is now the most distant known SMG in the COSMOS field, at a higher redshift than the recently found dusty galaxy CRLE at (Pavesi et al., 2018).
The ID20010161 has a single line detection at 95.2 GHz with 5.97 significance and a spurious probability of (Table 1), hence it is highly secure. However the redshift identification is less secure, as there are multiple solutions given the lack of a second line. We disfavor the single line identification as CO(7-6) at given the lack of [CI](2-1) (the formal signal within the expected velocity range gives -2.7 at 95.5 GHz) and H2O() (0.07 at 88.8 GHz) lines, since the H2O line is typically 0.4–1.1 of the high-J CO flux in high-z lensed ULIRGs (Omont et al., 2013; Yang et al., 2016, 2019). We also exclude CO(6-5) at because of the lack of detection of H2O() (-1.075 at 103.6 GHz). The solution with CO(4-3) at is also less likely due to the lack of any [CI](1-0) signal (-0.7 at 101.7 GHz), although it is not unconceivable that [CI](1-0) might be intrinsically faint for this source as it can reach % of the CO(4-3) flux (e.g., Walter et al. 2011; Valentino et al 2018; 2019). This redshift is less secure given that no confirming lines are present in its spectrum. However, we consider the most likely identification of this line as CO(5-4) at , for which we would not expect other significant lines in the observed range. In the following we will use this redshift identification for this source. If the redshift should turn out to be instead , its dust temperature would be even lower and the conclusions derived from these sources even further strengthened.
These redshift identifications consistently confirm that no strong lines are expected in the 230 GHz spectral ranges of the Oteo data nor in the 345 GHz spectral range of the Matsuda data, for either of the two galaxies for which 230 GHz or 345 GHz observations are available.
4. Results
4.1. Multi-wavelength imaging and morphology
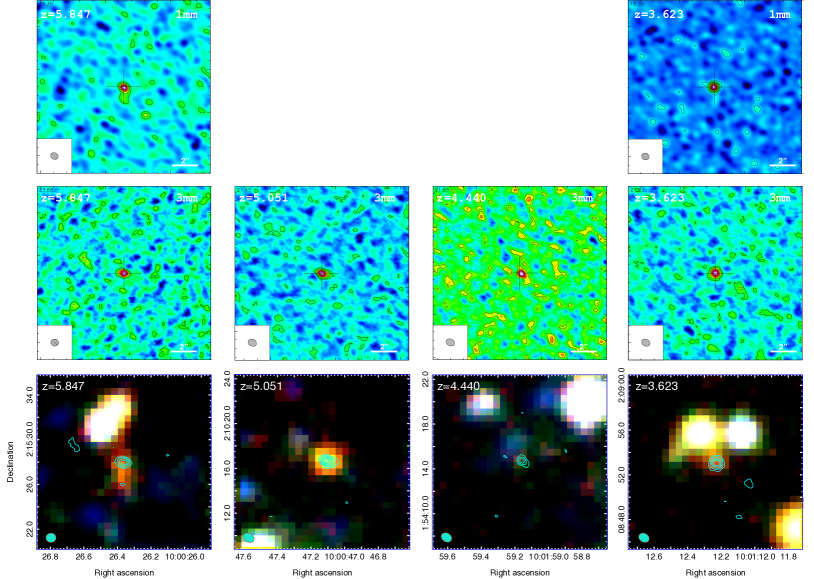
In Fig. 2, we present ALMA (clean) images for this sample. We solidly detected continuum emission with peak significance of 9–14 at 3 mm for the four sources, 13–19 at 1mm and 29 at 870 m for those in which these are available (Table 2). We measured their sizes by fitting models in uv space in the ALMA 1/0.8 mm and 3 mm collapsed datasets (also adding lines when available, but these provide only a modest contribution being at substantially lower SNRs). We combine the different tracers for a single galaxy in the uv space, following the procedure presented in Puglisi et al. (2019). Only the lowest redshift galaxy, ID85001674 at , is resolved with a FWHM size of ( kpc), implying a SFR surface density () of . The remaining sources are unresolved, we show their size upper limits (and lower limits of SFR surface density ) in Table 3. ID85000922 at has a size limit of kpc, and the other two galaxies at appear to be more compact with FWHM sizes kpc. The measured sizes of our ALMA sources are significantly smaller than the 3 GHz sizes reported by Miettinen et al. (2017) for a sample of 115 known SMGs in the COSMOS field, with a median size of kpc. In contrast, our measured sizes are close to the ALMA sizes of high-z SMGs from Ikarashi et al. (2015) and Simpson et al. (2015), who report median sizes of kpc at 1.1 mm, and kpc at m, respectively. Our ALMA sizes also agree with the 10 GHz-selected sample in Murphy et al. (2017), which has a median size of kpc.
| ID | [mJy] | [mJy] | [mJy] |
|---|---|---|---|
| 85001929 | – | ||
| 20010161 | – | – | |
| 85000922 | – | – | |
| 85001674 |
The high compactness of this sample is unlikely to be caused by AGN activity, because the emission from any dusty torus would be negligible at FIR/(sub)mm wavelength, and it cannot dominate the 3 mm emission (rest frame m for this sample). In any case, we do not see any evidence for an AGN component in their cold SEDs (see Sec. 5.2) and none is X-ray detected from Jin et al. (2018). Therefore, we speculate that the compact morphology in this very highly star-forming sample is a consequence of ongoing mergers, similarly to local ultra-luminous infrared galaxies (ULIRGs) (Soifer et al., 2000; Juneau et al., 2009) and high-z compact starbursts (Puglisi et al., 2017; Calabrò et al., 2019; Marrone et al., 2018).
In Fig. 2-bottom, we show +SPLASH color images for this sample. All sources have red counterpart in SPLASH images quite consistent with the ALMA imaging, however, only two of them are entirely consistent in position and extension with the ALMA detections. The SPLASH counterpart of the galaxy appears to be more extended than its ALMA morphology, the IRAC peak being located about to the south, where some faint extension is seen at 1 mm in the ALMA imaging as well (Fig. 2-top-left). ID85000922 at has a very faint SPLASH IRAC 3.6 m counterpart at its ALMA position, while the blue source with offset appears to be unrelated having a well constrained (Laigle et al., 2016).
The ID20010161 and ID85001674 galaxies are detected in the 3 GHz image with and (Smolčić et al., 2017; Daddi et al., 2017), showing infrared-to-1.4 GHz radio luminosity ratio and 2.4, which agree well with the evolution of for star forming galaxies in Delhaize et al. (2017), while the other sources are either marginally or not detected in the radio (). No signal is observed in the UltraVISTA band (or any shorter wavelength) for our sources, which thus could be qualified as -band dropouts. No photometric redshift is, of course, available for these sources in near-IR or optically selected catalogs.
| ID | ||||||||||||
|---|---|---|---|---|---|---|---|---|---|---|---|---|
| [] | [K] | [K] | [K] | [M⊙] | [M⊙] | [M⊙] | (1) | (1) | ||||
| 85001929 | 12.81.8 | 2.50.2 | 2.20.2 | 2.10.2 | 403 | 423 | 618 | 3.50.6 | 4.31.1 | 2.20.9 | 2.00.4(2) | 2.95.5(2) |
| 20010161 | 6.21.0 | 2.40.2 | 2.00.2 | 1.90.2 | 323 | 354 | 406 | 8.72.5 | 10.42.9 | 7.72.1 | 1.30.2 | 1.80.3 |
| 85000922 | 5.11.0 | 3.70.6 | 2.3 | 2.10.4 | 20 4 | 304 | 426 | 18.39.8 | 10.21.3 | 7.02.3 | 0.90.2 | 1.30.3 |
| 85001674 | 3.30.8 | 2.70.2 | 2.20.2 | 2.10.2 | 232 | 242 | 415 | 29.28.9 | 33.68.1 | 13.03.7 | 0.80.1(2) | 1.20.2(2) |
Notes: : IR luminosity at 8–1000 corrected for CMB effect (dashed curve in Fig. 3); , and : RJ slope, dust temperature and dust mass from optically thin MBB fits without accounting for CMB; , and : RJ slope, dust temperature and dust mass from optically thin MBB fits accounting for CMB effect; , and : RJ slope, dust temperature and dust mass from optically thick MBB fits accounting for CMB effect; : CO(5-4) luminosities corrected for CMB effect assuming in LTE condition. (1) . (2) the observed CO(5-4) luminosities for these two sources are extrapolated as and , respectively.
4.2. Cold dust against the CMB
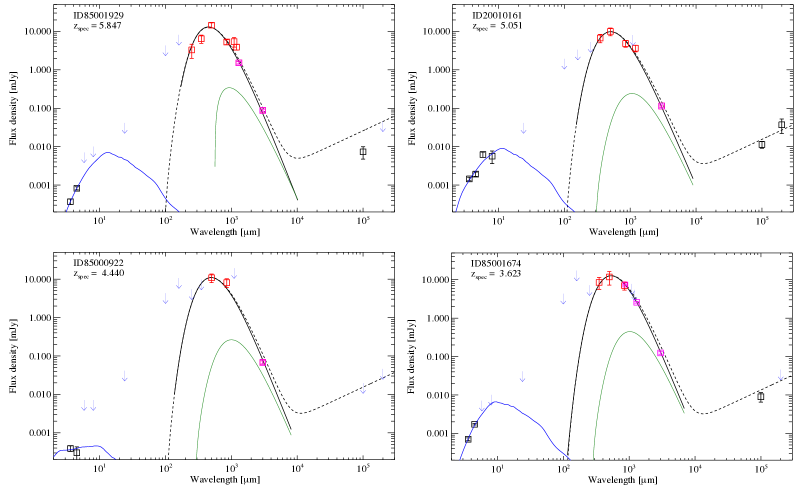
We collected super-deblended FIR/(sub)mm photometry together with the ALMA 0.8/1mm and 3mm continuum measurements for deriving their full dust SEDs. We start by fitting these SEDs using modified black-body (MBB) models from Casey et al. (2012) with free and , not accounting for the effect of the CMB. We find that these galaxies are fitted with very cold dust temperatures –41 K and abnormally steep RJ slopes –3.7 which appear to be well determined with relatively small errors, particularly for the two objects with highly accurate 1mm and 3mm ALMA continuum measurements in the RJ tail. Such steep slopes had not been reported in literature previously. However, galaxies are always observed against the CMB, and the CMB effect on the continuum would be non-negligible on dusty SEDs especially for our systems which appear to be fairly cold for their high-z (da Cunha et al., 2013).
We thus use alternative optically thin MBB SEDs (Magdis et al., 2012) accounting for the CMB effect on dust continuum following the prescriptions by da Cunha et al. (2013). MBB models are not ideal to describe the Wien part of galaxies SEDs but are appropriate here, given the photometric sampling available for our galaxies. We convert the luminosity of MBB models to multiplying by a constant of 1.35, a median value for starburst sample (Magdis et al., 2012) based on comparison with Draine and Li (2007). In Fig. 3, we show the best fit to the observed photometry with solid curves, while dashed curves indicate the intrinsic SEDs before accounting for the CMB effect on the continuum (green curve). We can clearly see that the CMB depresses the dust continuum at longer wavelengths, severely impacting its level at 3 mm (see Section 4.4), thus making the observed RJ slope steeper. In Table 3, we list derived parameters for fits with and without accounting for the CMB. In both cases we find consistently cold dust temperature –42 K, which are also consistent with those derived by fitting Casey et al. (2012) models. The consistence of and shows that accounting for the CMB effect does not alter for this sample, implying that the effects of the – degeneracy are negligible for our galaxies, within the uncertainties. This is because the CMB is affecting the observed continuum at long enough wavelengths, while it has barely any effect on the peak of the dust SED where is measured. We verified that the impact of the CMB on the derived is negligible out to , even for a galaxy with intrinsic K, the marginal overestimate of would be less than 1 K in that case. Strikingly, the SEDs corrected for CMB effect yield 2-2.2 , consistent with typical values found in the literature for star-forming galaxies, within the uncertainties (of about 0.2 in ).
Have we thus really directly detected the effect of the CMB on galaxy SEDs, for the first time (as far as we know)? This appears to be the case as we argue that the values of order 2.4–3 are not plausible and the CMB is indeed required to obtain a physically meaningful interpretation of the SEDs of our targets. In fact, large Herschel surveys have been used to constrain the slopes of local galaxies finding and up to a maximum of 2 (Boselli et al., 2012; Bianchi, 2013). None of the local galaxies with an apparent best fitting is at more than 1-sigma from (Rémy-Ruyer et al., 2013). Also, although our high redshift sample might be somewhat unusual because of particularly cold dust for its redshift (as discussed in more details later on in this paper), there is no evidence for steeper slope in cold galaxies in literature. E.g., our Milky-way ( K) is colder than this sample but has no steep beta slope, where the analysis of the full MW dust SED yields (Planck Collaboration et al., 2011). Without accounting for the CMB, the best constrained galaxies in our sample (not considering ID85000922 given its poor SED444Note that the galaxy ID85000922 () has also an abnormally steep but with very large uncertainty. When including the CMB we still fit its SED with a fixed , which seems required for producing both a good fit to the data and a conservatively cold dust temperature K. However, it should be noted that its dusty SED is not well constrained given the weak signal in the Herschel bands and we suspect that the SCUBA2 850 m photometry is boosted by noise.) have at significance ranging from 2 to 3.5. Taken together, their average SED is steeper than at about the level. Therefore, we conclude that the steep observed slopes are unambiguous evidence that the CMB is having a measurable effect on our target galaxies, which arises from a severe reduction of the dust continuum observed at 3 mm, or about beyond 500 m in the rest-frame.
4.3. Cold galaxies in the distant Universe
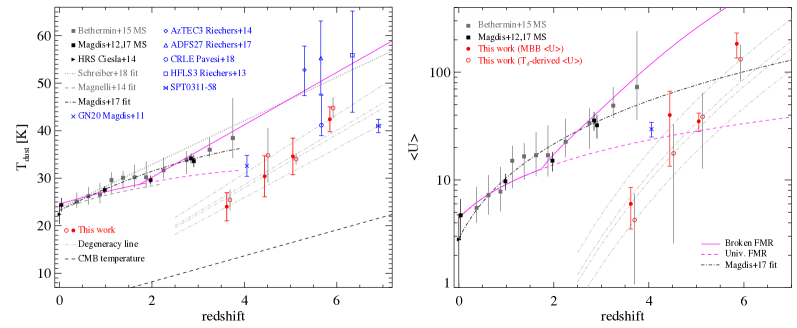
In general, the impact of CMB on galaxy SEDs can be expressed as a function of the contrast between dust and CMB temperatures, with the highest impact when these temperatures are close. We recall that what counts is the apparent temperature, as encoded in the SED shape and rest-frame peak rather than the intrinsic temperature (which could differ in the case of high optical depths). It is therefore relevant to evaluate how the for our galaxies relates to the cosmic evolution of temperatures in galaxies and the CMB. In Fig. 4-, we compare dust temperature for our sample to various objects taken from the literature (Schreiber et al., 2018; Béthermin et al., 2015; Magdis et al., 2011; Riechers et al., 2013, 2014, 2017; Pavesi et al., 2018; Ciesla et al., 2014), and to the evolving CMB temperature, versus redshift. We also fitted the available photometry for the SPT0311-58 galaxy (Strandet et al., 2017; Marrone et al., 2018), and obtained K using the same MBB models including the CMB effect. In Fig. 4-, we present the comparison in terms of the intensity of the radiation field : all values are consistently and homogeneously measured using the DL07 (Draine & Li, 2007) models, eliminating any systematics in the – diagram coming from different assumptions of and fitting techniques of the MBB models. In terms of both and , this sample has significant cold dust content with respect to both main-sequence galaxies and SMGs.
The galaxy has the highest and in this sample, though, its is still lower than the extrapolation of the – correlation for MS galaxies, and its is lower than the extrapolation from a broken fundamental metallicity relation (FMR) as in Béthermin et al. (2015). The source shows a dust temperature similar to the starburst GN20 (Daddi et al., 2009). The and ones have the coldest in this sample, which are just moderately above the CMB temperature by factors of 1.5–2.0. Not counting this study, among previously known galaxies, only GN20 is robustly colder than MS galaxies while CRLE is lower than the MS at only significance. The cold dust in SPT0311-58 at had not been reported previously. A significant population of cold galaxies is now clearly detected.
Please note that increase of with redshift within our sample of four targets is simply a selection effect: we had originally selected our targets to be at based on photometric redshifts derived using an HFLS3 template. As a result, the lower the redshift with respect to , the intrinsically colder the temperature necessarily is (and larger the implied dust masses). We show the – degeneracy trends for each galaxy in our sample in Fig. 4 (and 7): any redshift trend that our four targets might define is spurious as linked to this degeneracy and affected by selection. If we had used a cold dust template like GN20 we would have obtained –5.5 for our targets, which appear to be closer to the observations.
4.4. CMB impacts observables
We review and summarize here how CMB impacts various observables for this sample, as a necessary step before proceeding to infer their global properties for understanding their nature, and also as a reference for designing and conducting future observations of high-z dusty galaxies.
Continuum: The CMB acts as a non-negligible background for cold systems against which the line and continuum emission are measured (Combes et al., 1999; Papadopoulos et al., 2000; da Cunha et al., 2013). According to Eq. 18 in da Cunha et al. (2013), given the observed dust temperatures in our galaxies, the ratios of intrinsic/observed continuum are in the range of 1.32–1.45 at 3 mm and 1.06–1.09 at 1 mm. These ratios are monotonically increasing towards lower redshifts for our sample, an effect due to the fact that lower redshift objects are colder and closer in relative terms to the CMB temperature at each redshift. The induced underestimate on the intrinsic dust continuum is more severe at 3 mm, and this has to be carefully accounted for when designing and conducting observations for high redshift galaxies. The IR luminosities of the galaxies are also somewhat affected by the CMB, with a small underestimate by a factor of .
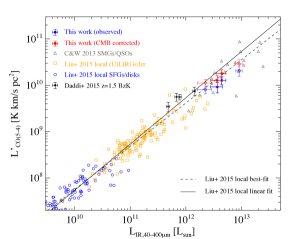
CO emission: A higher CMB temperature enhances the population of the high-J CO levels, and also corresponds to a higher background against which the lines must be detected (Combes et al., 1999; Papadopoulos et al., 2000; Obreschkow et al., 2009). Ultimately for fundamental thermodynamic reasons: for any collisionally excited transition. Then when the kinetic temperature of a cold gas reservoir get closer to the CMB temperature, its low-J CO lines brightness diminish by contrast to the background (Papadopoulos et al., 2000; da Cunha et al., 2013). Given the limited range of transitions observed for our galaxies, and the degeneracy between temperature and density in the analysis of CO SLEDs (e.g., Weiß et al. 2005; Dannerbauer et al. 2009; Daddi et al. 2015), it is not possible to properly estimate the expected effect for our galaxies. Nevertheless, one could obtain some guidance by assuming for example that the kinetic temperature of the gas in the CO transitions we observed is close to the dust temperature in the same galaxies, as expected for local thermodynamic equilibrium (LTE). This would imply observed CO fluxes at the level of 70% of the intrinsic ones according to Eq. 32 in da Cunha et al. (2013). This seems to be reasonably consistent with observations. In Fig. 5 we present the CO(5-4) luminosities of this sample in the diagram. The average ratio of the observed CO(5-4) luminosity (blue data points) to is lower than the best fit and lower than the linear fit in Liu et al. (2015a). Thus, the CMB effect provides a reasonable explanation for the seemingly low CO fluxes observed in our sample, albeit we cannot fully demonstrate this lacking a measurement of the gas kinetic temperature. This is nevertheless interesting information for planning follow-up searches for CO emission in high redshift galaxies, as reduction factors of up to in fluxes, due to the CMB, might not be uncommon to be encountered, particularly for galaxies with low CO excitation temperatures.
Size measurement: The CMB might also affect the 3mm continuum sizes of our sources, in the case that gradients are present, similarly to local spiral galaxies in which the outskirts are colder. In that case, the outskirt surface brightness would be impacted more strongly by the CMB than the hotter centers, resulting in apparently smaller half light radii. Taking as examples the temperature gradients found in some typical local galaxies M 31, M 33 and NGC 628, Zhang et al. (2016) computed that this effect could be at the level of 10–20% at 4–5 for 3mm bands, while negligible size bias is expected at mm. Given that this effect is in any case not very strong (even for surface brightness it would be at most 40% for the local examples in Zhang et al. 2016), and that our sources are very compact and possibly merging driven starbursts where we consider it unlikely that they might have strong gradients, we conclude that the CMB should not impact strongly the size measurements for this sample (the situation could be different for extended cold reservoirs in high-z disks). We can verify this directly for the galaxy ID85001674 at . This objects is the coldest and closest in relative terms of the CMB temperature, and shows a combined size from 3mm+1mm+0.8mm observations. The sizes measured from 1mm/0.8mm data alone are and , both about 1–1.5 lower than the combined size. This is contrary to what expected if CMB was affecting sizes, showing that indeed any CMB-induced size bias should be quite small.
Line widths and dynamical masses: Together with sizes, velocity widths are used to estimate dynamical masses of galaxies, as we report in Table 3 (), following the relations given in Daddi et al. (2010); Coogan et al. (2018). The CMB could also impact the observed CO line width , in the presence of gas kinetic temperature gradients, as described above for the sizes. The magnitude of this effect has not been quantified so far, but we could expect that it should be roughly comparable to the one on sizes, i.e., probably small. The CO spectra of the galaxies in this work are still relatively low in SNR, and thus we assume that any CMB effect on linewidths would likely be in the noise for our sources. In any case, the net effect of the CMB on derivation of dynamical mass from observables could imply they are somewhat underestimated given .
Being much less affected by CMB and with higher intrinsic luminosities, [CII] m observations would be particularly valuable for this and other high redshift samples. They would provide robust measurements on both size and dynamics, with minimal effects from the CMB. However, see discussion later in Sect.5.2 for other reasons why [CII] m might be affected also in these galaxies.
5. Discussion
We have presented evidence for the existence of a population of fairly cold dusty star-forming galaxies in the distant Universe, with SED shapes seemingly much colder (i.e., peaking at longer rest frame wavelengths) than what is expected for average MS galaxies at the same redshift. We also showed that such cold galaxies are substantially affected by the CMB, so that observed mm fluxes are suppressed by factors up to 1.5, and CO fluxes might be reduced by factors up to 2, or perhaps more for lower-J transitions. This implies that there are observational biases against such cold galaxies, and their real number density might be higher than what has been recovered so far. Up to the point that they might be the majority among SB galaxies in the distant Universe, if the trend determined by Béthermin et al. (2015) for SBs from –2 continues to higher redshifts. This raises obvious questions: why are these galaxies so cold? and particularly, why can SB galaxies become systematically colder than MS galaxies, when at the opposite situation is observed? In order to address these questions, we had some closer look at the overall physical properties that can be derived for these galaxies, given the observations available. In physical terms, the values reflect the ratio of SFE to metallicity. Hence these questions can be rephrased in equivalent terms: are these galaxies low-efficiency star-formers, even lower efficiency than typical MS galaxies? or particularly metal rich? Should we consider them to be typical disk-like star-formers at their redshifts, or might they be merger-affected typical starbursts?
5.1. Physical properties
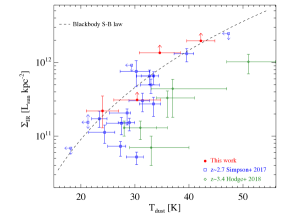
SFR surface density: We measure the SFR surface densities by converting the estimates into SFRs (Kennicutt, 1998) and dividing by the area . We compared the SFR surface density to data from the literature, particularly taking samples shown in an analogous figure from Simpson et al. (2017). In Fig. 6, our sample shows a trend of increasing luminosity surface density with dust temperature, consistent with trends in the lower-z sample of Simpson et al. (2017) and Hodge et al. (2018). Meanwhile our sample shows a higher luminosity surface density than any lower-z sample. Our values are at the limit of the Stefan-Boltzmann law, consistent with a single emitting, homogeneous starburst core. Our sample shows comparable SFR surface density with respect to local (U)LIRGs (Liu et al., 2015b), which are 2–3 orders of magnitude higher than normal spirals. The coldest galaxy () in this sample appears to be even colder than local IR-detected spirals from Liu et al. (2015b), while it has higher by 2–3 orders of magnitude. The high SFR surface densities suggest these galaxies are rather efficient starbursts than low-efficiency disks. Their extreme compactnesses indeed suggest mergers. In fact, using the evolutionary trend found by van der Wel et al. (2014) we would expect that a disk-like galaxy at with to have a FWHM size of kpc, substantially larger than the sizes we have measured for our objects (Table 4).
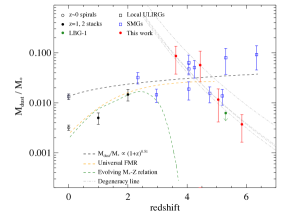
Dust and stellar masses: MBB dust masses are listed in Table 4. We calculated dust mass from DL07 templates, where we use the intrinsic SED (i.e., corrected for the CMB effect) of each galaxy as recovered from the MBB and took 6 data points (from 80 to 3000 m in rest-frame) and fit those data points with DL07. The MBB dust masses are consistent within 20% with the mass scaled to DL07, both result in a massive dust content for this sample. To constrain their stellar masses, we collected IRAC photometry in literature (Sanders et al., 2007) for the source, and obtained SPLASH photometry for the others by PSF fitting the SPLASH images on ALMA positions. We fit stellar SEDs using a 200 Myr template allowing for dust attenuation, following Liu et al. (2018). We list stellar masses in Table 4. Despite the IRAC detections well in the optical rest frame we expect uncertainties at least at the level of for our galaxies, given the lack of detections of age dependent features in their optical SEDs. In some cases the dust to stellar mass ratios can reach 10% levels (Fig. 7), much higher than what is found for typical MS galaxies and consistent with merger-driven systems like bright SMGs (see also Tan et al. 2014; Rujopakarn et al. 2019).
| ID | FWHM size | ||||||
|---|---|---|---|---|---|---|---|
| ′′ (kpc) | [M⊙] | [M⊙] | [] | [M⊙] | [M⊙] | [M⊙] | |
| 85001929 | (1.90) | 11.65.8 | – | 5.71.3 | |||
| 20010161 | (1.55) | 9.05.2 | – | 12.52.8 | |||
| 85000922 | (2.83) | 1.81.6 | – | 25.18.6 | |||
| 85001674 | 0.420.04 (3.100.30) | 3.92.0 | 17.62.6 | 9.72.2 | 48.312.1 |
Notes: : stellar mass; : dynamic mass within FWHM size; SFR surface density , where is half of the FWHM size.
Starburstiness: As defined by the ratio of the specific SFR for a given galaxy to the same specific SFR of an average MS galaxy at that redshift. At redshifts the MS value is not very securely determined, so this classification is uncertain. However, taking the extrapolation of the trends defined in Schreiber et al. (2015), we found that the galaxy has a starburstiness SFR/SFR, and appears thus to be a secure starburst galaxy despite its large uncertainty on the stellar mass. The remaining galaxies have fairly high masses, and starburstiness of 1.5–2.7, which are all above the MS extrapolation at but not by large factors. In fact, they could be considered MS galaxies in the definition by Rodighiero et al. (2011). However, as shown by several works (e.g., Elbaz et al. 2018; Puglisi et al. 2019), a substantial number of compact, probably merger-driven galaxies are observed even within the MS boundary at high masses, already at intermediate redshift .
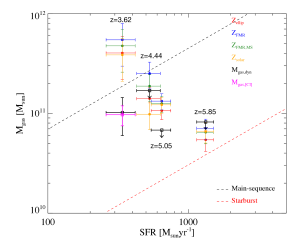
Gas masses: Inferring gas masses would be the most direct way to establish whether these objects are high or low efficiency star-formers. We constrain the total gas mass (molecular plus any atomic gas) of our sample using 3 different methods: (1) based on the dynamical mass (3 of which are only upper limits), after subtracting stellar mass using the equation 3 in Daddi et al. (2010), assuming of dark matter; (2) based on dust mass scaled to DL07, using FMR, FMR MS, elliptical and solar metallicity based G/D conversion factors, respectively; (3) for the galaxy with a [CI](1-0) detection, given the tight correlations between [CI] and low-J CO in local and high-z galaxies (Valentino et al., 2018; Jiao et al., 2017, 2019), we estimated its gas mass using the relation in Valentino et al. (2018) assuming an excitation temperature of 30 K, and show the resulting in Table 4. We cannot estimate gas masses from CO as the lowest-J transition we detect is CO(4-3), whose conversion to CO(1-0) is plagued by too large and uncertain excitation corrections. In Fig. 8, we compared the 3 different derivations of gas masses in the Schmidt-Kennicutt plane. Comparing to the relations for SBs and MS galaxies taken from Sargent et al. (2014), one can see that most values tend to be towards the high SFEs typical of SBs, with quite some large range and large uncertainties as exemplified by the scatter in the derived gas masses from different methods and assumptions. However it is interesting to consider the source which is the coldest in absolute terms and closest to the CMB temperature, and has also alternative derivations of gas mass from the [CI] luminosity and the dynamical mass. These two latter estimates agree well between them but are lower than the estimate based on by factors of 4–5, suggesting that are probably overestimated.
5.2. Optically thick dust emission in the FIR?
The behaviour displayed by the galaxy ID85001674, as discussed in the previous subsection, suggests an alternative explanation for the nature of these cold galaxies, which could solve a number of problems with them, particularly the coldest ones. In fact, the dust to stellar mass ratios of the coldest galaxies are very large, reaching 10% which seems very high (Fig. 7 and 8). Given that the mass in dust can be taken as a proxy of the mass in metals, this would imply that the metallicity in these objects could be truly extreme. Similarly, also the gas to stellar mass fraction would be seemingly or higher, as is only expected for primordial galaxies, which would be in contradiction with the high metallicities (Fig. 8. All these values are derived from estimates, and in all cases assuming models with optically thin dust emission. These measurements are not supported by dynamical estimate of the gas masses, nor by derivation from [CI](1-0), a transition known to be in most cases optically thin given the low fractional abundance of carbon in the neutral form (Valentino et al., 2018). It could well be that the dust continuum emission is instead optically thick in these systems, even at the peak of the emission and possibly somewhat beyond, similar to the optically thick SB nuclei found in Arp 220 (Papadopoulos et al., 2010; Wilson et al., 2014; Scoville et al., 2017). This is supported by the extreme compactness of our sources, and their very high SFR surface densities. A simple calculation for ID85001674 assuming a spherical geometry with constant density of dust within the measured radius , using the measured dust mass from the thin models, and using from the Jones et al. (2013) opacity models would imply an optical depth () at 100m rest (the observed SED peak) towards the center of about 1. Of course, there are many implicit assumptions and unknowns in this calculation555see also the similar calculation for SMG attenuation in SMG by Simpson et al. (2017), suggesting hundreds of magnitudes of attenuation of the optical rest frame light, but certainly the case for optically thick dust until the observed SED peak is a plausible one for this galaxies (and for the others, which are likely even more compact).
If the dust emission is optically thick around 100m (and possibly beyond), the suppression of the Wiens emission would make the observed SEDs seem cold, while the intrinsic temperatures would be much higher (e.g., Scoville & Kwan 1976; Condon et al. 1991; Conley et al. 2011; Scoville 2012). Conversely, together with the underestimate in we would be overestimating by some factor which would depend ultimately on the optical depth (i.e., from the ratio between the intrinsic and the real ). In all cases (hence SFR) derivations would be unaffected.
The standard treatment of optically thick emission assumes a constant at all wavelengths (e.g., Casey et al. 2012) and is unlikely to be realistic, given that radial gradients of are expected (e.g., Scoville 2012). Explicitly accounting for such effects is difficult and we hope to present calculations of more physical thick models in future works. Nevertheless we have fitted our targets using the more standard approach of optically thick sources with constant temperature, and accounting for the effects of the CMB. Results are reported in Table 3 along with the other estimates. The empirical evidence discussed above for ID85001674 requires that we might be overestimating dust masses by factors of up to 4–5 for our sample. These thick models indeed already account for a reduction of for ID85001674 and for the other galaxies. True corrections might be even larger.
If these sources are really optically thick, than the ultimate reason why CMB is so strongly affecting these galaxies is not because their physical dust temperatures are cold but because they seem cold. Similarly, this would also explain why these galaxies seem to be colder than MS galaxies, when they actually might not be in reality. values in Table 3 derived for the thick fits are already comparable or larger than MS galaxies at the same redshifts. In this case their CO kinetic temperatures would also be higher, rendering CMB effects on their line fluxes negligible: the reduction of CO fluxes might be instead due to high optical depths (see also Papadopoulos et al. 2010).
A strong reduction of in SBs would, finally, also solve the problematic observations that their dust to stellar mass ratios are larger than those of MS galaxies (Béthermin et al., 2015), while dynamical estimates suggest the gas to stellar mass ratios are near unity (Silverman et al., 2015, 2018a, 2018b). The case should be thus seriously considered that many of the merging driven SBs are actually optically thick in the FIR, a case previously proposed for local ULIRGs by Papadopoulos et al. (2010).
More observations would be needed to confirm the optically thick case. One interesting path would be comparing to [CI] derived excitation temperatures, given that [CI] lines should remain thin (Cortzen et al 2019 submitted). Another possibility would be to use [CII]m as a direct tracer of the gas mass (Zanella et al., 2018) and from there more realistic estimates via assumptions of G/D ratios: while [CII] could be in principle heavily affected by optical depth effects, it seems to provide fair gas mass estimates in local ULIRGs (perhaps by lucky coincidence). More observations are also needed to establish whether these cold (i.e., with long peak rest wavelengths) SEDs are prevalent in the distant Universe, and if the optically thick case could provide a general explanation for the odd inversion that seems to take place at high redshifts, with SB galaxies becoming colder than MS galaxies.
6. Summary and conclusions
We have used ALMA to obtain spectroscopic redshifts and investigate the properties of 4 galaxies detected in the FIR in the super-deblended catalog by Jin et al. (2018), and selected to be at based on photometric redshift derived using a well studied galaxy, HFLS3. Our findings can be summarized as follows:
we securely confirm the redshifts to be at based on multiple CO/CI transitions, with the exception of one object that has only one secure line detected, for which we derive a less secure .
our sample contains the most distant spectroscopically confirmed IR-detected galaxy in COSMOS, ID85001929 at .
when not accounting for CMB effects the galaxies display highly unusual steep slopes in the Rayleigh-Jeans regimes. The slopes are back to normal when accounting for the CMB. We think this could be the first direct evidence of the impact of the CMB on galaxy observables at high redshifts.
our galaxies are anomalously cold (i.e., peak at long rest wavelengths), colder than what typical Main Sequence galaxies are expected to be at these redshifts.
while in general cold dust emission is observed in galaxies with low star formation efficiency, which is typically found in quiescent star forming disks, our galaxies appear instead to be efficient star formers with compact sizes and high SFR surface densities, more typical of galaxy mergers.
we investigate possible reasons for the coldness of the observed FIR spectral energy distributions. An interesting possibility is that the galaxies have optically thick dust emission up until the peak of their emission at about 100 m, and possibly beyond. We propose a scheme of high dust optical depths ’hiding’ a warm compact dust mass associated with star-forming, merger-driven ’cores’, rather than fitting the associated IR SED with large cold dust reservoirs.
a large fraction of high (and even low) redshift SBs being optically thick in the FIR would provide an appealing solution into a number of odd observations for this population, including claims of extreme gas fractions and their seemingly redshift-independent evolution. Future work is required to demonstrate whether this is actually the case.
References
- Aretxaga et al. (2011) Aretxaga, I., Wilson, G. W., Aguilar, E., et al. 2011, MNRAS, 415, 3831
- Bertoldi et al. (2007) Bertoldi, F., Carilli, C., Aravena, M., et al. 2007, ApJS, 172, 132
- Béthermin et al. (2010) Béthermin, M., Dole, H., Cousin, M., & Bavouzet, N. 2010, A&A, 516, A43
- Béthermin et al. (2012) Béthermin, M., Le Floc’h, E., Ilbert, O., et al. 2012, A&A, 542, A58
- Béthermin et al. (2015) Béthermin, M., Daddi, E., Magdis, G., et al. 2015, A&A, 573, A113
- Bianchi (2013) Bianchi, S. 2013, A&A, 552, A89
- Boselli et al. (2012) Boselli, A., Ciesla, L., Cortese, L., et al. 2012, A&A, 540, A54
- Calabrò et al. (2019) Calabrò, A., Daddi, E., Puglisi, A., et al. 2019, A&A, 623, A64
- Capak et al. (2011) Capak, P. L., Riechers, D., Scoville, N. Z., et al. 2011, Nature, 470, 233
- Carilli et al. (2013) Carilli, C. L., Riechers, D., Walter, F., et al. 2013, ApJ, 763, 120
- Casey et al. (2012) Casey, C. M., Berta, S., Béthermin, M., et al. 2012, ApJ, 761, 140
- Chapman et al. (2005) Chapman, S. C., Blain, A. W., Smail, I., & Ivison, R. J. 2005, ApJ, 622, 772
- Ciesla et al. (2014) Ciesla, L., Boquien, M., Boselli, A., et al. 2014, A&A, 565, A128
- Combes et al. (1999) Combes, F., Maoli, R., & Omont, A. 1999, A&A, 345, 369
- Condon et al. (1991) Condon, J. J., Huang, Z.-P., Yin, Q. F., & Thuan, T. X. 1991, ApJ, 378, 65
- Conley et al. (2011) Conley, A., Cooray, A., Vieira, J. D., et al. 2011, ApJ, 732, L35
- Coogan et al. (2018) Coogan, R. T., Daddi, E., Sargent, M. T., et al. 2018, MNRAS, 479, 703
- Cowie et al. (2017) Cowie, L. L., Barger, A. J., Hsu, L.-Y., et al. 2017, ApJ, 837, 139
- da Cunha et al. (2013) da Cunha, E., Groves, B., Walter, F., et al. 2013, ApJ, 766, 13
- Daddi et al. (2009) Daddi, E., Dannerbauer, H., Stern, D., et al. 2009, ApJ, 694, 1517
- Daddi et al. (2010) Daddi, E., Bournaud, F., Walter, F., et al. 2010, ApJ, 713, 686
- Daddi et al. (2015) Daddi, E., Dannerbauer, H., Liu, D., et al. 2015, A&A, 577, A46
- Daddi et al. (2017) Daddi, E., Jin, S., Strazzullo, V., et al. 2017, ApJ, 846, L31
- Dannerbauer et al. (2009) Dannerbauer, H., Daddi, E., Riechers, D. A., et al. 2009, ApJ, 698, L178
- Delhaize et al. (2017) Delhaize, J., Smolčić, V., Delvecchio, I., et al. 2017, A&A, 602, A4
- Draine & Li (2007) Draine, B. T., & Li, A. 2007, ApJ, 657, 810
- Elbaz et al. (2011) Elbaz, D., Dickinson, M., Hwang, H. S., et al. 2011, A&A, 533, A119
- Elbaz et al. (2018) Elbaz, D., Leiton, R., Nagar, N., et al. 2018, A&A, 616, A110
- Fudamoto et al. (2017) Fudamoto, Y., Ivison, R. J., Oteo, I., et al. 2017, MNRAS, 472, 2028
- Geach et al. (2017) Geach, J. E., Dunlop, J. S., Halpern, M., et al. 2017, MNRAS, 465, 1789
- González-López et al. (2019) González-López, J., Decarli, R., Pavesi, R., et al. 2019, arXiv e-prints, arXiv:1903.09161
- Hodge et al. (2018) Hodge, J. A., Smail, I., Walter, F., et al. 2018, arXiv e-prints, arXiv:1810.12307
- Hurley et al. (2017) Hurley, P. D., Oliver, S., Betancourt, M., et al. 2017, MNRAS, 464, 885
- Ikarashi et al. (2015) Ikarashi, S., Ivison, R. J., Caputi, K. I., et al. 2015, ApJ, 810, 133
- Jiao et al. (2017) Jiao, Q., Zhao, Y., Zhu, M., et al. 2017, ApJ, 840, L18
- Jiao et al. (2019) Jiao, Q., Zhao, Y., Lu, N., et al. 2019, ApJ, 880, 133
- Jin et al. (2018) Jin, S., Daddi, E., Liu, D., et al. 2018, ApJ, 864, 56
- Jones et al. (2013) Jones, A. P., Fanciullo, L., Köhler, M., et al. 2013, A&A, 558, A62
- Juneau et al. (2009) Juneau, S., Narayanan, D. T., Moustakas, J., et al. 2009, ApJ, 707, 1217
- Kennicutt (1998) Kennicutt, Jr., R. C. 1998, ApJ, 498, 541
- Laigle et al. (2016) Laigle, C., McCracken, H. J., Ilbert, O., et al. 2016, ApJS, 224, 24
- Lee et al. (2013) Lee, N., Sanders, D. B., Casey, C. M., et al. 2013, ApJ, 778, 131
- Liang et al. (2019) Liang, L., Feldmann, R., Kereš, D., et al. 2019, MNRAS, 489, 1397
- Lilly et al. (1996) Lilly, S. J., Le Fevre, O., Hammer, F., & Crampton, D. 1996, ApJ, 460, L1
- Liu et al. (2015a) Liu, D., Gao, Y., Isaak, K., et al. 2015a, ApJ, 810, L14
- Liu et al. (2018) Liu, D., Daddi, E., Dickinson, M., et al. 2018, ApJ, 853, 172
- Liu et al. (2015b) Liu, L., Gao, Y., & Greve, T. R. 2015b, ApJ, 805, 31
- Madau & Dickinson (2014) Madau, P., & Dickinson, M. 2014, ARA&A, 52, 415
- Madau et al. (1998) Madau, P., Pozzetti, L., & Dickinson, M. 1998, ApJ, 498, 106
- Magdis et al. (2011) Magdis, G. E., Elbaz, D., Dickinson, M., et al. 2011, A&A, 534, A15
- Magdis et al. (2012) Magdis, G. E., Daddi, E., Béthermin, M., et al. 2012, ApJ, 760, 6
- Magdis et al. (2017) Magdis, G. E., Rigopoulou, D., Daddi, E., et al. 2017, A&A, 603, A93
- Magnelli et al. (2014) Magnelli, B., Lutz, D., Saintonge, A., et al. 2014, A&A, 561, A86
- Marrone et al. (2018) Marrone, D. P., Spilker, J. S., Hayward, C. C., et al. 2018, Nature, 553, 51
- McCracken et al. (2012) McCracken, H. J., Milvang-Jensen, B., Dunlop, J., et al. 2012, A&A, 544, A156
- McMullin et al. (2007) McMullin, J. P., Waters, B., Schiebel, D., Young, W., & Golap, K. 2007, in Astronomical Society of the Pacific Conference Series, Vol. 376, Astronomical Data Analysis Software and Systems XVI, ed. R. A. Shaw, F. Hill, & D. J. Bell, 127
- Miettinen et al. (2017) Miettinen, O., Novak, M., Smolčić, V., et al. 2017, A&A, 602, A54
- Murphy et al. (2017) Murphy, E. J., Momjian, E., Condon, J. J., et al. 2017, ApJ, 839, 35
- Obreschkow et al. (2009) Obreschkow, D., Heywood, I., Klöckner, H.-R., & Rawlings, S. 2009, ApJ, 702, 1321
- Omont et al. (2013) Omont, A., Yang, C., Cox, P., et al. 2013, A&A, 551, A115
- Papadopoulos et al. (2010) Papadopoulos, P. P., Isaak, K., & van der Werf, P. 2010, ApJ, 711, 757
- Papadopoulos et al. (2000) Papadopoulos, P. P., Röttgering, H. J. A., van der Werf, P. P., et al. 2000, ApJ, 528, 626
- Pavesi et al. (2018) Pavesi, R., Riechers, D. A., Sharon, C. E., et al. 2018, ApJ, 861, 43
- Planck Collaboration et al. (2011) Planck Collaboration, Ade, P. A. R., Aghanim, N., et al. 2011, A&A, 536, A16
- Puglisi et al. (2017) Puglisi, A., Daddi, E., Renzini, A., et al. 2017, ApJ, 838, L18
- Puglisi et al. (2019) Puglisi, A., Daddi, E., Liu, D., et al. 2019, ApJ, 877, L23
- Rémy-Ruyer et al. (2013) Rémy-Ruyer, A., Madden, S. C., Galliano, F., et al. 2013, A&A, 557, A95
- Renaud et al. (2019) Renaud, F., Bournaud, F., Agertz, O., et al. 2019, arXiv e-prints, arXiv:1902.02353
- Renaud et al. (2018) Renaud, F., Athanassoula, E., Amram, P., et al. 2018, MNRAS, 473, 585
- Riechers et al. (2013) Riechers, D. A., Bradford, C. M., Clements, D. L., et al. 2013, Nature, 496, 329
- Riechers et al. (2014) Riechers, D. A., Carilli, C. L., Capak, P. L., et al. 2014, ApJ, 796, 84
- Riechers et al. (2017) Riechers, D. A., Leung, T. K. D., Ivison, R. J., et al. 2017, ApJ, 850, 1
- Rodighiero et al. (2011) Rodighiero, G., Daddi, E., Baronchelli, I., et al. 2011, ApJ, 739, L40
- Roseboom et al. (2010) Roseboom, I. G., Oliver, S. J., Kunz, M., et al. 2010, MNRAS, 409, 48
- Rujopakarn et al. (2019) Rujopakarn, W., Daddi, E., Rieke, G. H., et al. 2019, arXiv e-prints, arXiv:1904.04507
- Safarzadeh et al. (2015) Safarzadeh, M., Ferguson, H. C., Lu, Y., Inami, H., & Somerville, R. S. 2015, ApJ, 798, 91
- Sanders et al. (2007) Sanders, D. B., Salvato, M., Aussel, H., et al. 2007, ApJS, 172, 86
- Sargent et al. (2014) Sargent, M. T., Daddi, E., Béthermin, M., et al. 2014, ApJ, 793, 19
- Schreiber et al. (2018) Schreiber, C., Elbaz, D., Pannella, M., et al. 2018, A&A, 609, A30
- Schreiber et al. (2015) Schreiber, C., Pannella, M., Elbaz, D., et al. 2015, A&A, 575, A74
- Scoville et al. (2017) Scoville, N., Murchikova, L., Walter, F., et al. 2017, ApJ, 836, 66
- Scoville (2012) Scoville, N. Z. 2012, Evolution of star formation and gas, ed. J. Falcón-Barroso & J. H. Knapen, 491
- Scoville & Kwan (1976) Scoville, N. Z., & Kwan, J. 1976, ApJ, 206, 718
- Silk & Spaans (1997) Silk, J., & Spaans, M. 1997, ApJ, 488, L79
- Silverman et al. (2015) Silverman, J. D., Daddi, E., Rodighiero, G., et al. 2015, ApJ, 812, L23
- Silverman et al. (2018a) Silverman, J. D., Daddi, E., Rujopakarn, W., et al. 2018a, ApJ, 868, 75
- Silverman et al. (2018b) Silverman, J. D., Rujopakarn, W., Daddi, E., et al. 2018b, ApJ, 867, 92
- Simpson et al. (2015) Simpson, J. M., Smail, I., Swinbank, A. M., et al. 2015, ApJ, 799, 81
- Simpson et al. (2017) —. 2017, ApJ, 839, 58
- Smolčić et al. (2015) Smolčić, V., Karim, A., Miettinen, O., et al. 2015, A&A, 576, A127
- Smolčić et al. (2017) Smolčić, V., Novak, M., Bondi, M., et al. 2017, A&A, 602, A1
- Soifer et al. (2000) Soifer, B. T., Neugebauer, G., Matthews, K., et al. 2000, AJ, 119, 509
- Strandet et al. (2017) Strandet, M. L., Weiss, A., De Breuck, C., et al. 2017, ApJ, 842, L15
- Tan et al. (2014) Tan, Q., Daddi, E., Magdis, G., et al. 2014, A&A, 569, A98
- Valentino et al. (2018) Valentino, F., Magdis, G. E., Daddi, E., et al. 2018, ApJ, 869, 27
- van der Wel et al. (2014) van der Wel, A., Franx, M., van Dokkum, P. G., et al. 2014, ApJ, 788, 28
- Vieira et al. (2013) Vieira, J. D., Marrone, D. P., Chapman, S. C., et al. 2013, Nature, 495, 344
- Walter et al. (2011) Walter, F., Weiß, A., Downes, D., Decarli, R., & Henkel, C. 2011, ApJ, 730, 18
- Walter et al. (2012) Walter, F., Decarli, R., Carilli, C., et al. 2012, Nature, 486, 233
- Weiß et al. (2005) Weiß, A., Walter, F., & Scoville, N. Z. 2005, A&A, 438, 533
- Wilson et al. (2014) Wilson, C. D., Rangwala, N., Glenn, J., et al. 2014, ApJ, 789, L36
- Yang et al. (2016) Yang, C., Omont, A., Beelen, A., et al. 2016, A&A, 595, A80
- Yang et al. (2019) Yang, C., Gavazzi, R., Beelen, A., et al. 2019, arXiv e-prints, arXiv:1903.00273
- Zanella et al. (2018) Zanella, A., Daddi, E., Magdis, G., et al. 2018, MNRAS, 481, 1976
- Zavala et al. (2018) Zavala, J. A., Montaña, A., Hughes, D. H., et al. 2018, Nature Astronomy, 2, 56
- Zhang et al. (2016) Zhang, Z.-Y., Papadopoulos, P. P., Ivison, R. J., et al. 2016, Royal Society Open Science, 3, 160025