Anomalous Charge Noise in Superconducting Qubits
Abstract
We have used Ramsey tomography to characterize charge noise in a weakly charge-sensitive superconducting qubit. We find a charge noise that scales with frequency as over 5 decades with and a magnitude . The noise exponent and magnitude of the low-frequency noise are much larger than those seen in prior work on single electron transistors, yet are consistent with reports of frequency noise in other superconducting qubits. Moreover, we observe frequent large-amplitude jumps in offset charge exceeding 0.1; these large discrete charge jumps are incompatible with a picture of localized dipole-like two-level fluctuators. The data reveal an unexpected dependence of charge noise on device scale and suggest models involving either charge drift or fluctuating patch potentials.
Superconducting quantum circuits are a leading physical platform for scalable quantum computing, with small-scale qubit arrays nearing the threshold of quantum supremacy Boixo et al. (2018); Neill et al. (2018). The progress of recent years has been enabled by designs that isolate the qubit mode from sources of noise and dissipation inherent in the materials used to realize the device. However, these approaches entail design compromises that could impede continued scaling. For example, the highly successful transmon design Koch et al. (2007) achieves exponential insensitivity against charge noise at the expense of reduced anharmonicity. As a result, leakage out of the computational subspace represents a significant problem for large-scale transmon arrays, as it cannot be mitigated with standard error correction codes Fowler (2013). At the same time, there are proposals for new qubit designs that provide protection against noise at the hardware level, including charge-parity qubits Douçot and Ioffe (2012); Bell et al. (2014), fluxon pair qubits Bell et al. (2016), and 0- qubits Groszkowski et al. (2018). However, in many of these implementations one needs accurate control over the offset charge environment of the device. These considerations motivate a detailed study of charge noise in modern superconducting qubit circuits.
Previous measurements of charge noise in single electron transistors (SETs) and first-generation charge qubits showed a power spectral density with between 1.0 and 1.25 Kuzmin et al. (1989); Zimmerli et al. (1992a, b); Visscher et al. (1995); Verbrugh et al. (1995); Song et al. (1995); Wolf et al. (1997); Kenyon et al. (2000); Nakamura et al. (2002); Gustafsson et al. (2013); Freeman et al. (2016) and noise magnitude . The standard microscopic picture of this noise is a distribution of two-level fluctuators (TLF) Dutta and Horn (1981); Kenyon et al. (2000); Clemens Müller (2017) that can activate or tunnel between local minima in a potential energy landscape, leading to switching behavior in the time domain and a Lorentzian power spectral density. A bath of TLF with a broad distribution of characteristic rates gives rise to the ubiquitous noise.
Here we describe measurements of charge noise in a charge-tunable qubit that departs slightly from the transmon regime. We find a charge noise power spectral density that is up to 4 orders of magnitude larger at 1 Hz than that seen in SETs, suggesting an unexpected dependence of the noise on device scale. Moreover, we observe a large number of discrete charge jumps in excess of . The measured distribution of charge jumps is not compatible with charge motion over microscopic length scales, as described by the standard picture of dipole-like TLF. Finally, the measured noise exponent is incompatible with the exponents reported for SETs, pointing to a new noise mechanism. While our measured noise is strikingly different from that seen in SETs, it is consistent with reports of frequency noise in other superconducting qubits Ristè et al. (2013); Serniak et al. (2018).
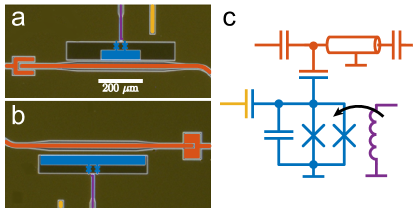
The device geometry is shown in Fig. 1. Each die consists of a charge-sensitive qubit and a charge-insensitive reference transmon coupled to a common readout resonator. The devices were fabricated on high-resistivity silicon; the circuit groundplane, qubit islands, and all control and readout elements were made from sputtered niobium and defined using optical lithography and reactive ion etching. The Al-AlOx-Al compound Josephson junctions of the qubits were fabricated using electron-beam lithography and double-angle evaporation. We have performed detailed studies of charge noise in two nominally identical devices. In the following we focus on a single device (qubit A). Data from a second charge-sensitive device (qubit B) are qualitatively similar and are presented in the Supplemental Materials for further information. ; devices were originally designed to probe correlations of low-frequency flux and charge noise; these measurements .
The parameters for qubit A are GHz at the flux-insensitive point and MHz, corresponding to a qubit transition frequency 5.38 GHz. The readout mode for qubit A resonates at 6.744 GHz. The qubit is coupled to the resonator with a coupling strength of 100 MHz and the state is read out dispersively with a qubit state-dependent shift of MHz. The resonator is strongly coupled to the output port with a decay time ns to allow for rapid repeated measurements. The offset charge is controlled through an on-chip capacitance to the qubit island of 100 aF, with a 20:1 voltage division at the millikelvin stage. The device is measured in a dilution refrigerator with a base temperature of 35 mK.
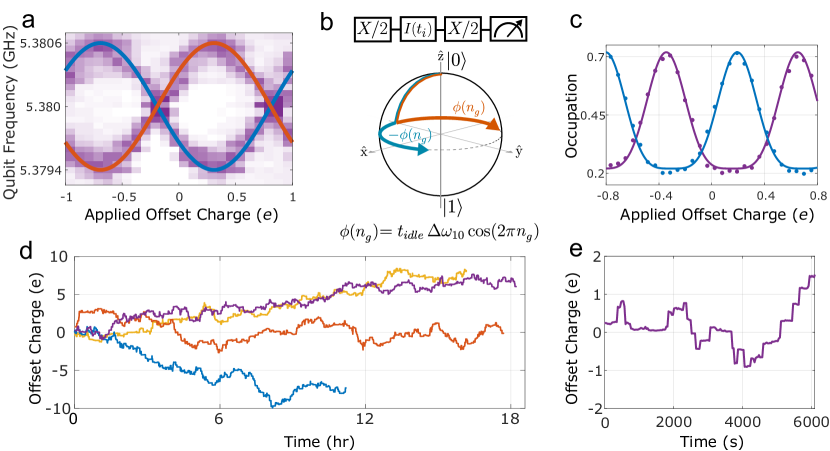
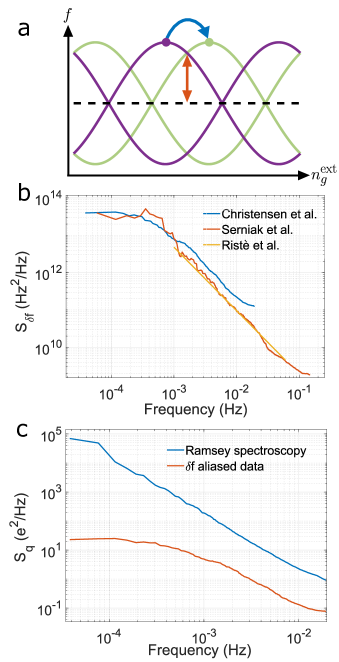
While typical transmon devices involve a ratio in the range 50-100 Koch et al. (2007); Schreier et al. (2008), leading to a charge dispersion ranging from 10 kHz to 1 Hz, the ratio for qubit A yields a charge dispersion = 600 kHz. The qubit energy spectrum is given by , where is the charge-averaged qubit frequency and is the offset charge on the qubit island expressed in units of (Fig. 2a). The dependence of the qubit transition frequency on offset charge renders the device sensitive to quasiparticle (QP) poisoning Lutchyn et al. (2006). Here, single QPs tunnel across the Josephson junctions on sub-millisecond timescales Ristè et al. (2013); Serniak et al. (2018), changing by 0.5 and giving rise to distinct parity bands in the qubit spectrum.
To measure fluctuations in the offset charge on the qubit island, we perform a series of Ramsey experiments at varying charge bias points using a pulse sequence that maps offset charge onto population of the qubit excited state (Fig. 2b). With QP tunneling rates far exceeding the repetition rate of the Ramsey experiments, we require the experiment to be independent of parity of the qubit island. The sequence begins with a broadband (40 ns long) gate that addresses both parity bands. The qubit then undergoes free evolution for an interval , during which time it accumulates the phase , where the two signs correspond to the two possible parity states of the island. While the two parity states evolve in different directions around the equator of the Bloch sphere, they maintain the same projection onto the -axis. We set the idle time and use a final gate to map this projection onto the -axis of the Bloch sphere. Measurement of the qubit finds an excited state probability
| (1) |
where is the sum of an applied gate charge and a fluctuating intrinsic offset charge and the parameters and account for qubit decay during measurement and finite measurement visibility, respectively. Critically, is periodic in offset charge with period , and is thus insensitive to QP parity. We sweep the externally applied gate charge and determine by fitting the measured Ramsey data to Eq. (1). Using this technique, we can determine the offset charge to a precision of 0.02 over 20 s. Once is measured, we can then deterministically bias to any point in charge space.
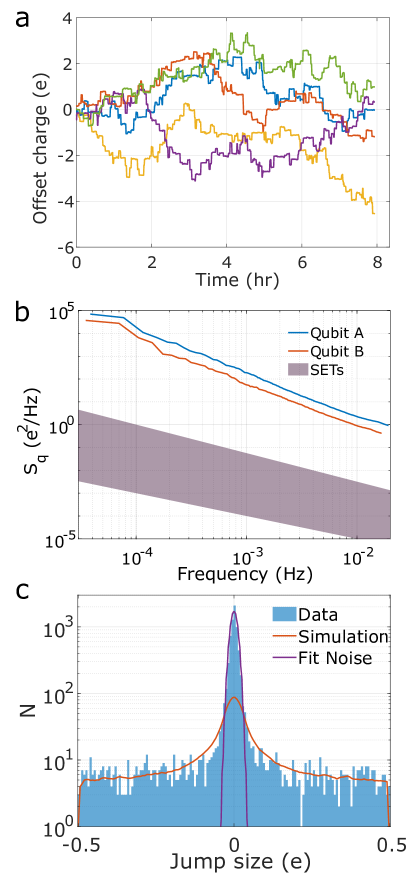
Repeated Ramsey scans of this type generate a time series of fluctuating offset charge; a set of such traces is shown in Fig. 2d. Interestingly, the charge trace shows occasional (once per 250 s) extremely large discrete jumps . The observed distribution of offset charge jumps is difficult to reconcile with a model of dipole-like microscopic TLF; this aspect of the data is discussed in detail below. Note that, as Ramsey tomography is periodic in an offset charge of 1, we can only determine changes in offset charge within the range ; any larger jump is aliased to a reduced value of offset charge (e.g., a 0.6 change looks identical to a -0.4 change).
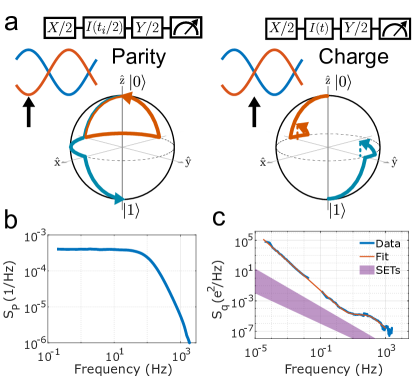
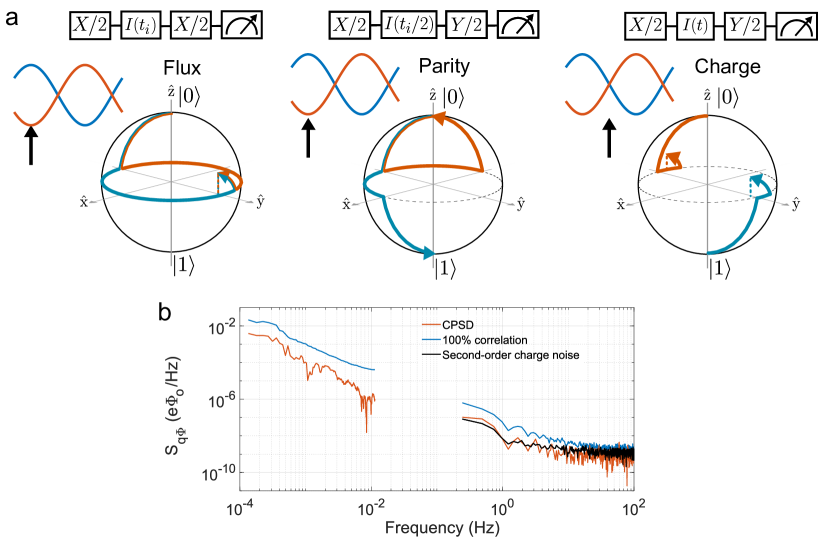
In order to characterize the fluctuating offset charge at higher frequency, we adopt a fast single-shot Ramsey protocol that simultaneously probes island parity and fluctuating offset charge. The measurement sequence is described in Fig. 3a. An initial Ramsey sequence maps the two parity states to the north and south poles of the Bloch sphere. Single-shot measurement of the qubit state provides access to QP parity of the qubit island. Following a short delay of 1 s to allow the cavity to return to its ground state, we perform a second single-shot Ramsey experiment that maps offset charge to qubit population irrespective of island parity. We bias the qubit to the point of maximal charge sensitivity and perform an gate that rotates the two qubit parity states to opposite sides of the equator of the Bloch sphere. Noise in the charge bias causes the two states to accumulate phase in opposite directions; however, a subsequent gate maps the accumulated phase to the same polar angle on the Bloch sphere. Due to the presence of large jumps in offset charge on a few-minute timescale, we interleave with this sequence a separate Ramsey-based scan of offset charge every 15 s in order to characterize and compensate large jumps in offset charge. By repeating the two-step protocol with a duty cycle of 10 kHz, we generate two time series of single-shot measurement results, the first of which provides access to island parity and the second of which provides access to fluctuating offset charge. For each separate time series (QP parity or charge), we partition the time trace into two interleaved traces, compute the cross spectrum, and average over many measurement cycles to suppress quantum projection noise, after Yan et al. (2012); Quintana et al. (2017).
The measured power spectral densities of QP parity switches and charge noise are shown in Figs. 3b-c. The power spectrum of QP parity is Lorentzian with a characteristic frequency of 255 Hz set by the rate of QP tunneling onto or off of the qubit island; this QP poisoning rate is consistent with other reported values in the superconducting qubit literature Ristè et al. (2013); Serniak et al. (2018). For the charge noise results presented in Fig. 3c, we combine the fast single-shot Ramsey results with the low-frequency charge noise power spectral density obtained from the time series presented in Fig. 2d. The power spectral density of offset charge fluctuations displays a spectrum, with and . The measured charge noise is inconsistent with a large body of literature on charge noise in SETs, both in the noise magnitude at 1 Hz and in the noise exponent.
While charge noise has not previously been reported on weakly charge-sensitive qubits of the transmon type, there are reports of frequency noise in similar charge-tunable qubits Ristè et al. (2013); Serniak et al. (2018). To compare our data to these prior experiments, we convert our measured offset charge to difference frequency using the relation . In this case, we find with noise exponent , which closely matches the other measured values (after proper normalization to the same charge dispersion) of and Ristè et al. (2013), and and Serniak et al. (2018). More details on this comparison can be found in the Supplemental Materials for further information. . While a conversion from frequency noise to charge noise is not possible due to non-trivial aliasing effects, the similar levels of frequency noise seen in these three independent qubit measurements suggest a common noise mechanism, despite the fact that these measurements span a range of substrate materials (Si – this work; Al2O3 – Ristè et al. (2013); Serniak et al. (2018)), base metal (Nb – this work; Al – Ristè et al. (2013); Serniak et al. (2018)), and cavity architecture (2D –this work; 3D – Ristè et al. (2013); Serniak et al. (2018)).
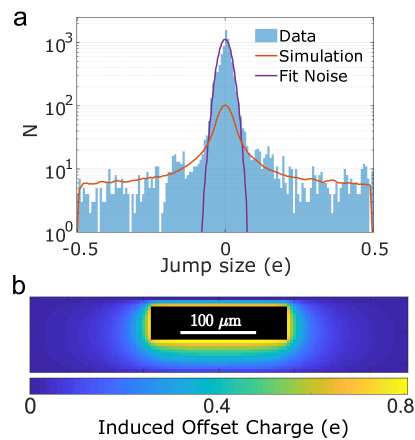
As this noise is substantially larger than what is seen in SET devices, it is instructive to consider the differences between the two systems. First, SETs are operated in the voltage state, whereas transmons are operated in the superconducting state. Naively one might expect to observe higher levels of noise in devices operated in the dissipative regime; SET measurements confirm this intuition, where higher voltage bias results in larger noise Verbrugh et al. (1995); Wolf et al. (1997). The other notable distinction is the large qubit capacitor pad. For our charge-sensitive device, with qubit charging energy MHz, the island dimensions are m2. For typical SETs, the island dimensions are submicron and charging energy is of order 40 GHz Schoelkopf et al. (1998); Aassime et al. (2001). It is thus reasonable to consider whether the enhanced noise seen in our devices is related to the difference in device scale. In the most widely accepted picture of low-frequency charge noise, the fluctuating offset charge is due to dipole-like TLF involving motion of a single electron charge over microscopic scales, with dipole moments of order 1 Debye Martinis et al. (2005). However, such localized dipolar fluctuators are only expected to produce a large change in offset charge when they are located within 100 nm of the Josephson junctions, which represent the boundary between the island and ground electrodes. However, we observe a broad distribution of discrete jumps in offset charge, with many large jumps in excess of . In Fig. 4 we plot the histogram of discrete charge jumps obtained from the time series in Fig. 2. In addition to a Gaussian central peak with width 0.02 set by the fit uncertainty in our Ramsey-based charge measurements, the histogram displays long tails corresponding to a large number of discrete charge jumps extending out to (as described above, any larger charge jumps are aliased into this interval). The frequency of large-magnitude charge jumps suggests a model involving motion or drift of charge as opposed to fluctuations of individual localized TLF. Indeed, the measured histogram is well modeled by random impingement of charge in the dielectric space between the qubit island and the ground electrode (see simulation results in Fig. 4a and simulated offset charge in Fig. 4b). Moreover, the large noise exponent is consistent with charge drift, as white current noise yields a charge spectrum that scales with frequency as . For example, it could be that the apparent scale dependence of charge noise is due to a device-dependent sensing area to a fixed background drift of charge in the substrate or in the vacuum environment of the qubit, e.g., due to the motion of ions in the native oxide of the silicon substrate Gorodokin and Zemlyanov (2004); Constant et al. (2000) or to the trapping and release of charged particles in the substrate or surrounding dielectrics due to the relaxation of thermal strain. However, other models are possible, including fluctuating patch potentials on the island electrode Turchette et al. (2000); Deslauriers et al. (2004), for which one would expect the charge noise to scale linearly with the area of the qubit island. We anticipate that systematic study of the dependence of charge noise on device geometry will elucidate the underlying noise mechanism.
In conclusion, we have used a charge-sensitive variant of the transmon qubit to characterize anomalous low-frequency charge noise. The large noise magnitude, the noise exponent approaching 2, and the high density of large discrete charge jumps are incompatible with the vast body of literature on charge noise in SETs yet consistent with prior reports of frequency noise in superconducting qubits, indicating a surprising dependence of charge noise on device scale. A deeper understanding of charge noise could guide the development of noise mitigation strategies that will open the design space for superconducting qubits, leading to devices with stronger anharmonicity that are less prone to leakage errors and thus more amenable to scaling.
We acknowledge helpful discussions with Mark Eriksson and Nathan Holman. This research was supported by an appointment to the Intelligence Community Postdoctoral Research Fellowship Program at University of Wisconsin - Madison, administered by Oak Ridge Institute for Science and Education through an interagency agreement between the U.S. Department of Energy and the Office of the Director of National Intelligence. The research is based upon work supported by the Office of the Director of National Intelligence (ODNI), Intelligence Advanced Research Projects Activity (IARPA), via the U.S. Army Research Office grant No. W911NF-16-1-0114. The views and conclusions contained herein are those of the authors and should not be interpreted as necessarily representing the official policies or endorsements, either expressed or implied, of the ODNI, IARPA, or the U.S. Government. Work by Y.R. and J.D. was performed under the auspices of the U. S. Department of Energy by Lawrence Livermore National Laboratory under Contract No. DE-AC52-07NA27344. Y.R., J.D., B.C. and R. M. acknowledge partial support under LLNL-LDRD SI-16-004.The authors acknowledge use of facilities and instrumentation at the UW-Madison Wisconsin Centers for Nanoscale Technology partially supported by the NSF through the University of Wisconsin Materials Research Science and Engineering Center (DMR-1720415). This work was performed in part at the Cornell NanoScale Science & Technology Facility (CNF), a member of the National Nanotechnology Coordinated Infrastructure (NNCI), which is supported by the National Science Foundation (Grant NNCI-1542081). LLNL-JRNL-776205.
References
- Boixo et al. (2018) S. Boixo, S. V. Isakov, V. N. Smelyanskiy, R. Babbush, N. Ding, Z. Jiang, M. J. Bremner, J. M. Martinis, and H. Neven, Characterizing quantum supremacy in near-term devices, Nature Physics 14, 595 (2018).
- Neill et al. (2018) C. Neill, P. Roushan, K. Kechedzhi, S. Boixo, S. V. Isakov, V. Smelyanskiy, A. Megrant, B. Chiaro, A. Dunsworth, K. Arya, R. Barends, B. Burkett, Y. Chen, Z. Chen, A. Fowler, B. Foxen, M. Giustina, R. Graff, E. Jeffrey, T. Huang, J. Kelly, P. Klimov, E. Lucero, J. Mutus, M. Neeley, C. Quintana, D. Sank, A. Vainsencher, J. Wenner, T. C. White, H. Neven, and J. M. Martinis, A blueprint for demonstrating quantum supremacy with superconducting qubits, Science 360, 195 (2018), http://science.sciencemag.org/content/360/6385/195.full.pdf .
- Koch et al. (2007) J. Koch, T. M. Yu, J. Gambetta, A. A. Houck, D. I. Schuster, J. Majer, A. Blais, M. H. Devoret, S. M. Girvin, and R. J. Schoelkopf, Charge-insensitive qubit design derived from the cooper pair box, Phys. Rev. A 76, 042319 (2007).
- Fowler (2013) A. G. Fowler, Coping with qubit leakage in topological codes, Phys. Rev. A 88, 042308 (2013).
- Douçot and Ioffe (2012) B. Douçot and L. B. Ioffe, Physical implementation of protected qubits, Reports on Progress in Physics 75, 072001 (2012).
- Bell et al. (2014) M. T. Bell, J. Paramanandam, L. B. Ioffe, and M. E. Gershenson, Protected josephson rhombus chains, Phys. Rev. Lett. 112, 167001 (2014).
- Bell et al. (2016) M. T. Bell, W. Zhang, L. B. Ioffe, and M. E. Gershenson, Spectroscopic evidence of the Aharonov-Casher effect in a cooper pair box, Phys. Rev. Lett. 116, 107002 (2016).
- Groszkowski et al. (2018) P. Groszkowski, A. D. Paolo, A. L. Grimsmo, A. Blais, D. I. Schuster, A. A. Houck, and J. Koch, Coherence properties of the 0-pi qubit, New Journal of Physics 20, 043053 (2018).
- Kuzmin et al. (1989) L. S. Kuzmin, P. Delsing, T. Claeson, and K. K. Likharev, Single-electron charging effects in one-dimensional arrays of ultrasmall tunnel junctions, Phys. Rev. Lett. 62, 2539 (1989).
- Zimmerli et al. (1992a) G. Zimmerli, T. M. Eiles, R. L. Kautz, and J. M. Martinis, Noise in the coulomb blockade electrometer, Appl. Phys. Lett. 61, 237 (1992a).
- Zimmerli et al. (1992b) G. Zimmerli, R. L. Kautz, and J. M. Martinis, Voltage gain in the single-electron transistor, Appl. Phys. Lett. 61, 2616 (1992b).
- Visscher et al. (1995) E. H. Visscher, S. M. Verbrugh, J. Lindeman, P. Hadley, and J. E. Mooij, Fabrication of multilayer single-electron tunneling devices, Appl. Phys. Lett. 66, 305 (1995).
- Verbrugh et al. (1995) S. M. Verbrugh, M. L. Benhamadi, E. H. Visscher, and J. E. Mooij, Optimization of island size in single electron tunneling devices: Experiment and theory, Journal of Applied Physics 78, 2830 (1995).
- Song et al. (1995) D. Song, A. Amar, C. J. Lobb, and F. C. Wellstood, Advantages of superconducting coulomb-blockade electrometers, IEEE Transactions on Applied Superconductivity 5, 3085 (1995).
- Wolf et al. (1997) H. Wolf, F. J. Ahlers, J. Niemeyer, H. Scherer, T. Weimann, A. B. Zorin, V. A. Krupenin, S. V. Lotkhov, and D. E. Presnov, Investigation of the offset charge noise in single electron tunneling devices, IEEE Transactions on Instrumentation and Measurement 46, 303 (1997).
- Kenyon et al. (2000) M. Kenyon, C. J. Lobb, and F. C. Wellstood, Temperature dependence of low-frequency noise in al-al2o3-al single-electron transistors, Journal of Applied Physics 88, 6536 (2000).
- Nakamura et al. (2002) Y. Nakamura, Y. A. Pashkin, T. Yamamoto, and J. S. Tsai, Charge echo in a cooper-pair box, Phys. Rev. Lett. 88, 047901 (2002).
- Gustafsson et al. (2013) M. V. Gustafsson, A. Pourkabirian, G. Johansson, J. Clarke, and P. Delsing, Thermal properties of charge noise sources, PRB 88, 245410 (2013).
- Freeman et al. (2016) B. M. Freeman, J. S. Schoenfield, and H. Jiang, Comparison of low frequency charge noise in identically patterned si/sio2 and si/sige quantum dots, Appl. Phys. Lett. 108, 253108 (2016).
- Dutta and Horn (1981) P. Dutta and P. M. Horn, Low-frequency fluctuations in solids: noise, RMP 53, 497 (1981).
- Clemens Müller (2017) J. L. Clemens Müller, Jared H. Cole, Towards understanding two-level-systems in amorphous solids - insights from quantum circuits, arXiv:1705.01108 [cond-mat.mes-hall] (2017).
- Ristè et al. (2013) D. Ristè, C. C. Bultink, M. J. Tiggelman, R. N. Schouten, K. W. Lehnert, and L. DiCarlo, Millisecond charge-parity fluctuations and induced decoherence in a superconducting transmon qubit, Nature Communications 4, 1913 (2013).
- Serniak et al. (2018) K. Serniak, M. Hays, G. de Lange, S. Diamond, S. Shankar, L. D. Burkhart, L. Frunzio, M. Houzet, and M. H. Devoret, Hot nonequilibrium quasiparticles in transmon qubits, Phys. Rev. Lett. 121, 157701 (2018).
- (24) S. S. M. for further information., .
- (25) T. devices were originally designed to probe correlations of low-frequency flux and a. d. i. t. S. M. charge noise; these measurements, which set an upper limit on flux-charge correlations at 6%, .
- Schreier et al. (2008) J. A. Schreier, A. A. Houck, J. Koch, D. I. Schuster, B. R. Johnson, J. M. Chow, J. M. Gambetta, J. Majer, L. Frunzio, M. H. Devoret, S. M. Girvin, and R. J. Schoelkopf, Suppressing charge noise decoherence in superconducting charge qubits, PRB 77, 180502 (2008).
- Lutchyn et al. (2006) R. M. Lutchyn, L. I. Glazman, and A. I. Larkin, Kinetics of the superconducting charge qubit in the presence of a quasiparticle, PRB 74, 064515 (2006).
- Yan et al. (2012) F. Yan, J. Bylander, S. Gustavsson, F. Yoshihara, K. Harrabi, D. G. Cory, T. P. Orlando, Y. Nakamura, J.-S. Tsai, and W. D. Oliver, Spectroscopy of low-frequency noise and its temperature dependence in a superconducting qubit, PRB 85, 174521 (2012).
- Quintana et al. (2017) C. M. Quintana, Y. Chen, D. Sank, A. G. Petukhov, T. C. White, D. Kafri, B. Chiaro, A. Megrant, R. Barends, B. Campbell, Z. Chen, A. Dunsworth, A. G. Fowler, R. Graff, E. Jeffrey, J. Kelly, E. Lucero, J. Y. Mutus, M. Neeley, C. Neill, P. J. J. O’Malley, P. Roushan, A. Shabani, V. N. Smelyanskiy, A. Vainsencher, J. Wenner, H. Neven, and J. M. Martinis, Observation of classical-quantum crossover of flux noise and its paramagnetic temperature dependence, Phys. Rev. Lett. 118, 057702 (2017).
- Schoelkopf et al. (1998) R. J. Schoelkopf, P. Wahlgren, A. A. Kozhevnikov, P. Delsing, and D. E. Prober, The radio-frequency single-electron transistor (rf-SET): A fast and ultrasensitive electrometer, Science 280, 1238 (1998).
- Aassime et al. (2001) A. Aassime, G. Johansson, G. Wendin, R. J. Schoelkopf, and P. Delsing, Radio-frequency single-electron transistor as readout device for qubits: Charge sensitivity and backaction, Phys. Rev. Lett. 86, 3376 (2001).
- Martinis et al. (2005) J. M. Martinis, K. B. Cooper, R. McDermott, M. Steffen, M. Ansmann, K. D. Osborn, K. Cicak, S. Oh, D. P. Pappas, R. W. Simmonds, and C. C. Yu, Decoherence in josephson qubits from dielectric loss, Phys. Rev. Lett. 95, 210503 (2005).
- Gorodokin and Zemlyanov (2004) V. Gorodokin and D. Zemlyanov, Metallic contamination in silicon processing, in 2004 23rd IEEE Convention of Electrical and Electronics Engineers in Israel (2004) pp. 157–160.
- Constant et al. (2000) I. Constant, F. Tardif, and J. Derrien, Deposition and removal of sodium contamination on silicon wafers, Semiconductor Science and Technology 15, 61 (2000).
- Turchette et al. (2000) Q. A. Turchette, Kielpinski, B. E. King, D. Leibfried, D. M. Meekhof, C. J. Myatt, M. A. Rowe, C. A. Sackett, C. S. Wood, W. M. Itano, C. Monroe, and D. J. Wineland, Heating of trapped ions from the quantum ground state, Phys. Rev. A 61, 063418 (2000).
- Deslauriers et al. (2004) L. Deslauriers, P. C. Haljan, P. J. Lee, K.-A. Brickman, B. B. Blinov, M. J. Madsen, and C. Monroe, Zero-point cooling and low heating of trapped ions, Phys. Rev. A 70, 043408 (2004).
- Nolt et al. (1985) I. G. Nolt, J. V. Radostitz, M. Carlotti, B. Carli, F. Mencaraglia, and A. Bonetti, Cosmic-ray backgrounds in infrared bolometers, International Journal of Infrared and Millimeter Waves 6, 707 (1985).
- Lanfranchi et al. (1999) M. Lanfranchi, B. Carli, A. Gignoli, C. Lee, and M. Ridolfi, Cosmic-ray flux detected by an ir bolometer operated on board of a stratospheric aircraft, Infrared Physics & Technology 40, 379 (1999).
- Karatsu et al. (2019) K. Karatsu, A. Endo, J. Bueno, P. J. de Visser, R. Barends, D. J. Thoen, V. Murugesan, N. Tomita, and J. J. A. Baselmans, Mitigation of cosmic ray effect on microwave kinetic inductance detector arrays, Appl. Phys. Lett. 114, 032601 (2019).
Supplemental Materials: Anomalous Charge Noise in Superconducting Qubits
I Fabrication details
The devices are realized through single-layer fabrication on high-resistivity () Si(100) wafers. After stripping the native SiOx with hydrofluoric acid, a 90 nm film of Nb is deposited at a rate of 45 nm/min. under conditions optimized to achieve slight compressive film stress. All features except the qubit junctions are then defined with an i-line projection aligner, and the Nb is etched using a recipe in an inductively coupled plasma reactive ion etch tool.
Qubit junctions are then made using a standard Dolan bridge process with a MMA/PMMA stack. Following an in situ ion mill to ensure good metallic contact with the base Nb layer, the junctions are formed by double-angle electron-beam evaporation of Al and thermal oxidation in a 90/10 Ar/O2 mixture.
II Comparison of and
To compare with the power spectra of frequency fluctuations presented in Ristè et al. (2013); Serniak et al. (2018), we convert our time series of offset charge to time series of difference frequency using the relation . The resulting power spectra of our data and of Ristè et al. (2013); Serniak et al. (2018) are plotted in Fig. S1b. The spectrum from the Ristè work is taken from the fit in Fig. S4 of Ristè et al. (2013). The spectrum from Serniak et al. is calculated from a raw time series provided by those authors. As the difference frequency can only vary between 0 and , at long time scales there is a white noise ceiling, as the variation in difference frequency is capped. To allow direct comparison of the frequency noise, we normalize all frequency spectra to match the 600 kHz charge dispersion in our qubit A: the device of Serniak et al. has a charge dispersion of 1.6 MHz, so we scale their spectrum by 0.14; while the device of Ristè et al. has an 880 kHz charge dispersion, so we scale their spectrum by 0.46.
To extract the magnitude and exponent of the frequency noise, we fit the spectrum from to Hz for our data and from to Hz for Serniak et al. (2018). We find for our measurements and ; for the data of Serniak et al. we find and ; while Ristè et al. cite and .
As noted in the main text, the conversion from to is not possible due to aliasing effects, thus there is no one-to-one mapping between the two functions (Fig. S1a). Our Ramsey-based approach can be thought of as tracking the full spectroscopy curve as a function of by sweeping . By tracking the full charge dispersion curve, we can monitor long-term drifts, with the only aliasing arising when two consecutive measurements differ in offset charge by a value larger than . If instead (as in the works of Ristè et al. (2013); Serniak et al. (2018)) no external bias is used and only the difference frequency at a single bias point is measured, then every data point is mapped to the interval . An example of this is shown in Fig. S1a, where two different instances of are displayed. With access only to difference frequency at a single bias point, it is impossible to uniquely determine the value of that produced the measured , and therefore an arbitrary choice must be made to assign a value to . This arbitrary choice must be made any time nears the boundary of the interval , as, e.g., and both correspond to the same difference frequency. Thus can never leave the interval . Critically, this aliasing applies to every measurement, whereas the aliasing from our approach only applies to changes in offset charge between two measurements that exceed .
The impact of the aliasing is shown in Fig. S1c. Here, we plot the charge noise power spectral density measured via Ramsey tomography in blue. We then convert our data to a time series of , and finally map from back to the gate charge interval . The power spectrum of the intentionally aliased data is plotted in orange. For the aliased data, we see a reduction of the noise exponent from 1.93 to 1.76, a reduction in the noise power by approximately two orders of magnitude, and a white noise ceiling at frequencies below Hz.
III Simulation of discrete charging events
To generate the histogram in Fig. 4a, we perform a COMSOL simulation to calculate the induced charge on the qubit island associated with nucleation of a discrete charge in the dielectric space between the qubit island and the circuit groundplane (Fig. 4b). We then permit both charge polarities, which would correspond either to the nucleation of both positive and negative charged particles, or to the adsorption/desorption of a single charged species. We sample the entire groundplane cavity with uniform density, appropriately alias the data to account for the finite dynamic range of our charge measurement (so that, e.g., is mapped to ), and histogram the results. This naive simulation yields surprising agreement with the measured distribution of discrete charge jumps.
Within a picture of impingement of discrete charges in the dielectric cavity of the qubit groundplane, the measured rate of charge jumps corresponds to a flux of charged particles of , which could be due, e.g., to a partial pressure of charged species of order Torr. This pressure corresponds to roughly 0.4 ions in the Al box housing the sample, so the drift of charge might be better viewed as due to some element within the sample box that releases charge at a rate of particles per second. For example, the charge could be generated from the relaxation of strain in the PCB material used to couple signals into and out of the sample box or from the relaxation of strain in the dielectric substrate itself.
Alternatively, it could be that free charge is generated by cosmic rays that are absorbed in the qubit substrate or in the material of the sample enclosure. However, the flux of cosmic rays is only at sea level Nolt et al. (1985); Lanfranchi et al. (1999); Karatsu et al. (2019), likely too low to account for observed rate of discrete charge jumps.
IV Measurements of qubit B
A second, nominally identical device (qubit B) was characterized in the same cooldown that yielded the data presented in the main text. The only difference between the devices was a slightly reduced of 9.9 GHz for qubit B compared to 10.8 GHz for qubit A. Time series of fluctuating offset charge in qubit B are shown in Fig. S2a. The charge power spectral density calculated from this data shows and (Fig. S2b). The histogram of discrete charge jumps measured in qubit B is shown in Fig. S2c along with the results of simulations of the type described in the previous section. In this case, the measurement cycle time was 30 s and the Gaussian central peak in the charge histogram corresponds to a fit uncertainty of 0.01. We find large discrete jumps in offset charge at a rate of one event per 290 s, corresponding to an impingement rate of .
V Charge-Flux Noise Correlation
A complete microscopic picture of low-frequency charge and flux noise is still lacking. To aid in the understanding of these noise sources, we performed a series of experiments on qubit A to probe charge-flux correlations, as observation of such correlations could be used to constrain possible microscopic models. Here we describe these measurements, which allow us to place an upper bound on the level of correlation between charge and flux fluctuators.
The measurement protocol involves interleaved single-shot Ramsey sequences executed at appropriate bias points in flux and charge space that provide access to flux noise, QP parity, and charge noise. The high-bandwidth flux noise measurement is performed at a charge bias that yields zero first-order sensitivity to charge noise and maximal sensitivity to QP parity, as shown in Fig. S3a. The idle time is fixed so that both parity bands are mapped to the same final qubit state. Since the experiment is conducted away from the upper flux sweet spot in order to achieve sensitivity to flux fluctuations, is reduced from its maximum value, resulting in a larger charge dispersion and a shorter idle time for the Ramsey-based flux noise measurements. By computing the cross power spectral density (CPSD) of single-shot flux and charge tomography scans, we probe correlations between flux and charge noise in the band from Hz to 100 Hz.
A low-frequency cross spectrum is taken by interleaving the offset charge measurement with a low-bandwidth measurement of the flux. This can be achieved by performing a standard Ramsey measurement at a flux-sensitive bias to determine the qubit free precession frequency and using the transfer function to extract the fluctuating bias flux. The Ramsey measurement is done with a fixed idle time (set by the frequency separation of the parity bands) and a varying phase of the final gate. Fitting the resulting Ramsey measurement then gives an estimate of the flux deviation. From the separate charge and flux time series we compute the CPSD of charge and flux noise.
In Fig. S3b we combine the low- and high-bandwidth charge-flux CPSD in a single plot. To understand the strength of the correlation, it is informative to compare the cross spectrum with the geometric mean of the direct charge and flux spectra . For maximally correlated noises, the magnitude of the CPSD will equal this quantity, with a well-defined phase across the spectrum. Note, however, that two uncorrelated time series will also have a CPSD with a magnitude equal to the geometric mean of the direct spectra, although in this case the phases of the cross spectrum will be random. As the magnitude of the sum of random phasors scales as , the noise floor is then set by , where is the number of averages per data point. For the low-bandwidth measurement, we average 250 spectra at a data rate of Hz, corresponding to 36 hours of measurement, setting the noise floor at 0.06. Indeed, the upper bound on charge-flux correlation achieved around Hz matches well with this noise floor set by finite averaging.
The high-bandwidth measurement protocol involves a much higher repetition rate of 10 kHz, so that finite averaging is not an issue. However, in contrast to the low-bandwidth schemes that allow direct monitoring of charge and flux, the fast single-shot protocol monitors the accumulation of spurious phase, and we rely on known transfer functions to map this phase to fluctuating charge and flux. The flux measurement is executed at a point where we are first-order insensitive to charge noise (and vice versa); however, the second-order sensitivity to charge noise at the charge sweet spot is non-negligible. Indeed, by performing a check experiment at a bias point that is insensitive to first order to both charge and flux noise, we find that the noise floor in our charge-flux CPSD is set by second-order charge noise (black trace in Fig. S3b), putting an upper bound on charge-flux correlation at 1 Hz at the level of 0.1.