Magnetic activities on active solar-type stars
Abstract:
We present results obtained from the studies of magnetic activities on four
solar-type stars (F-type star KIC 6791060, K-type star LO Peg, and two
M-type planet-hosting stars K2–33 and EPIC 211901114) by using optical
observations from several ground- and space-based telescopes. In this study,
we investigate magnetic activities such as spot-topographic evolution
and flaring events in these stars. We compare the results
obtained from this study with that of the Sun. In the surface temperature maps,
one active longitude has been detected in KIC 6791060, whereas in each of the
other three cases two active longitudes are seen. The spottedness was found
to vary in the range of 0.07–0.44%, 9–26%, 3.6–4.2%, and 4.5–5.3% for KIC 6791060,
LO Peg, K2–33, and EPIC 211901114, respectively. Several flaring events have
been identified in each star. An increasing trend in flaring frequency per stellar
rotation has been found in the stars with change in spectral type from F to M.
These findings indicate the increase in magnetic activities with the spectral type
of stars. This can be explained due to increasing the ratio of the thickness of the
convection zone to the radiation zone from F-type star to the M-type stars.
Keywords: stars: activity – star: magnetic field – stars: flare – stars: imaging – starspots
1 Introduction
Cool stars with spectral type from late-F to early-M have a similar internal structure to that of the Sun and are called as solar-type stars. In these stars, Hydrogen burning at the core is the process of energy generation. The energy is being transported outward through radiation (inner part of the star) and convection (outer part of the star) depending on the steepness of the temperature gradient. The interface between the radiation and the convection zones is called the “tachocline”. According to the current understanding of stellar dynamo theory, the magnetic field in the Sun is supposed to be generated by a naturally occurring dynamo mechanism operating inside. Solar-type stars with a similar internal structure to that of the Sun are expected to operate a similar kind of dynamo mechanism. However, the observational evidence of range of stellar rotation periods, surface gravities, masses and ages which put into the debate on the existing magnetic dynamo theory (see Favata et al. 2000, Karmakar et al. 2017). The observational evidence of the dynamo generated activities are presence of dark spots, flaring events, etc. In order to provide useful constraints for the dynamo theory, we are currently working on a project to investigate the magnetic activities in the stars with the same internal structure. We have selected an F-type star KIC 6791060, a K-type star LO Peg, and two M-type planet-hosting stars K2–33 and EPIC 211901114 to investigate the magnetic activities and compare the results with that of the Sun.
The basic parameters of the solar-type stars under studied are given in Table 1. KIC 6791060 is a poorly-known F5-type, main-sequence (Frasca et al. 2016), ultra-fast rotator (UFR) with a rotational period of 0.344 day. Balona (2015) has categorized this star as a rotationally variable star with magnitude of 10.57. Using the Gaia Data Release 2 (DR2), Gaia Collaboration (2018) derived parallax of this star to be 3.410.02 mas which corresponds to a distance of 290.7 pc by Bailer-Jones et al. (2018). LO Peg is an active, single, young, main-sequence, K5–8 type UFR with a rotational period of 0.42310.0001 day (Karmakar et al. 2016). LO Peg has been extensively studied in last two decades. Strong flaring activities in this star are identified from H and He I D3 observations (Jeffries et al. 1994, Eibe et al. 1999) as well as from optical observations (Taş 2011). Doppler images of LO Peg provided evidence of high polar activities (Piluso et al. 2008 and references therein). Several photometric, polarimetric, and X-ray studies also carried out by Dal & Taş (2003), Pandey et al. (2005), Csorvási (2006), Taş (2011), Karmakar et al. (2016), and Savanov et al. (2016).
| Object | Spectral Type | V | Period | Distance |
|---|---|---|---|---|
| (mag) | (day) | (pc) | ||
| KIC 6791060 | F5 | 10.57 | 0.344 | 290.7 |
| LO Peg | K5–8 | 9.25 | 0.4231 | 25.1 |
| K2–33 | M2 | 15.71 | 6.2895 | 139.3 |
| EPIC 211901114 | M2.7 | 16.85 | 8.6075 | 184.0 |
K2–33 is an extremely young, pre-main-sequence star of spectral type M2 located at a distance of 139.3 pc in the Upper Scorpius subgroup of the Scorpius–Centaurus Association (Mann et al. 2016). The age of this subgroup has been estimated to be 112 million years (Pecaut et al. 2012), while evolutionary models estimated the age of K2–33 as 9.3 million years (David et al. 2016). K2–33 is known to host one Neptune-sized exoplanet. The parallax measured for this star by Gaia DR2 is 7.150.08 mas (Gaia Collaboration 2018). The estimated radius for K2–33 is 1.050.07 (Mann et al. 2016). EPIC 211901114 is an active red-dwarf of spectral type M2.7 (Kraus et al. 2007) hosts a Jupiter size exoplanet (Rebull et al. 2017). EPIC 211901114 is a part of the Praesepe cluster and having an age of 790 million years (Rebull et al. 2017). Gaia Collaboration (2018) estimated the parallax of EPIC 211901114 to be 5.410.08 mas. Using Gaia DR2 Bailer-Jones et al. (2018) estimated a distance of EPIC 211901114 to be 184 pc.
The paper is structured as follows: in Section 2, we describe the observations that have been used in our analysis and the methods of data reduction. Section 3 describes data analysis and results obtained from our work and in Section 4, we present our discussion and conclusions.
2 Observations and Data Reduction
Observations of the selected stars have been carried out by using several ground and space-based observatories. KIC 6791060 was in the field that was observed by the first Kepler mission for four years starting from 2009, December 13 to 2013, December 13. The Kepler data were obtained in two different modes. In eighteen quarters, the observations were taken in long-cadence (LC mode; 30-min exposures) and in one quarter, the field was observed only in short-cadence (SC mode; 1-min exposures). We observed LO Peg in , , , and photometric bands using 6-m Special Astrophysical Observatory of RAS, 2-m IUCAA Girawali Observatory Telescope, 1.04-m ARIES Sampurnanand Telescope, 0.5-m Zvenigorod Observatory of INASAN, and 0.36-m Goddard Robotic Telescope. The exposure time was between 5 and 60 s depending on the seeing condition, filter, and telescope used. Apart from this, we have also used data from literature and archive. The details of the sources of band data are given in Karmakar et al. (2016) and Savanov et al. (2016).
3 Analysis and results
3.1 Optical light curves
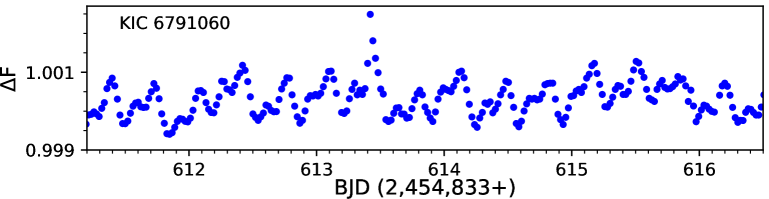
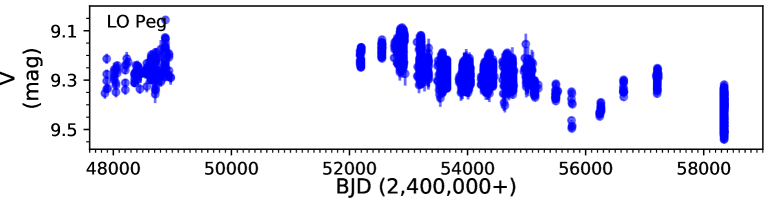
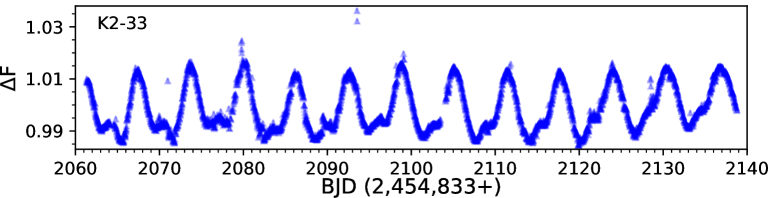
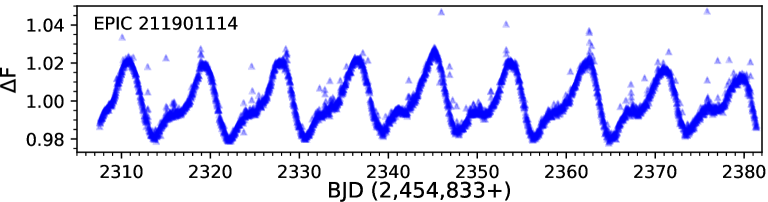
The optical light curves of the four objects are shown in Fig. 1. The top panel shows a part of the light curve of KIC 6791060 in the unit of normalized flux as observed with Kepler satellite. The second panel of Fig. 1 shows the 29 years long -band light curve of the K-type star LO Peg. The third and fourth panels show seventy days long light curves of K2–33 and EPIC 211901114, respectively. The light curves of KIC 6791060 and LO Peg display large variation in amplitudes both in short- and long-term time scales, whereas due to relatively smaller duration of observation, long-term variation in K2–33 and EPIC 211901114 is not well evident. However, in both cases, short time-scale variations have been seen.
We search for periodicities in all four objects using Scargle–Press period search method (Scargle 1982; Horne & Baliunas 1986; Press & Rybicki 1989). For KIC 6791060, in the Scargle–Press power spectrum the highest peak corresponds to a period of 0.343650.00004 day. This period could be the rotation period of the star. This derived period for KIC 6791060 agrees with previous determinations (Balona 2015, McQuillan et al. 2014). In the power spectrum, another peak was also seen which corresponds to a period of 0.343490.00004 day, and is separated by 0.00016 day from the rotational period. This multiple periodicity in the light curve results in a beat pattern in the four year long light curve near 550 and 1350 day in time = BJD – 2 454 833 day; (see bottom panel of Fig. 1 of Karmakar et al. 2018). This multiple periodicity could be a result of multiple spot groups located in different latitude. From the -band data of LO Peg we estimated the period to be 0.42310.0001 day. In our analysis we have also calculated the False Alarm Probability for any peak frequency using the method given by Horne & Baliunas (1986). Further, we have phase folded the data in each period that was detected above 99.9% significance level and found periodic modulation only for periods 5.98 and 2.2 year. The strongest peak in the power spectra of K2–33 and EPIC 211901114 corresponding to a period of 6.290.50 and 8.560.60 day, respectively. Mann et al. (2017) give the results of an independent determination of the stellar rotation periods, which agree with our derived values. Several flaring events were also detected during the observations of all four above mentioned stellar systems which will be discussed in Section 3.3.
3.2 Stellar surface imaging
Starspots move across the stellar disk with the rotation and thus modulate the total brightness. The inversion of the phased light curves into stellar images allow us to determine the locations of spots on the stellar surface. In order to do light curve inversion, we have used iph code (Savanov & Strassmeier 2008). According to the basic assumption of the model, the local intensity () of the stellar surface is the sum of the intensity of the photosphere () and from the cool spots () weighted by the spot filling factor through the following relation ; with . Here, the spot filling factor is defined as the fraction of the stellar surface covered by spots.
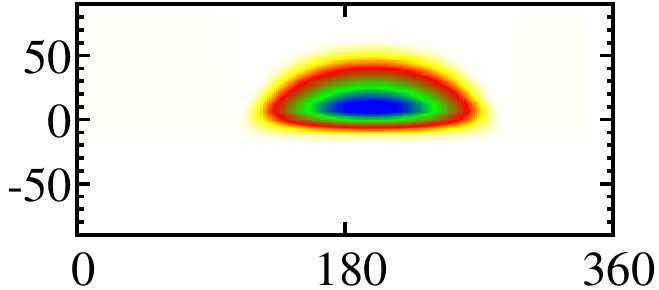
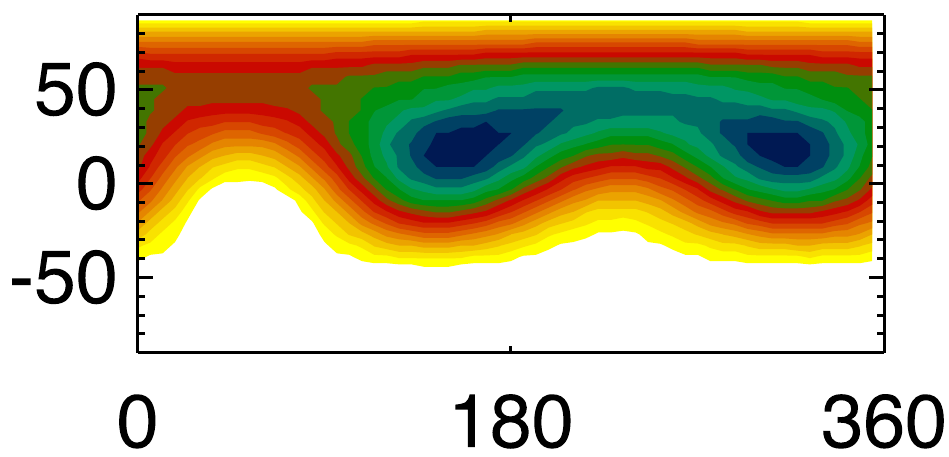
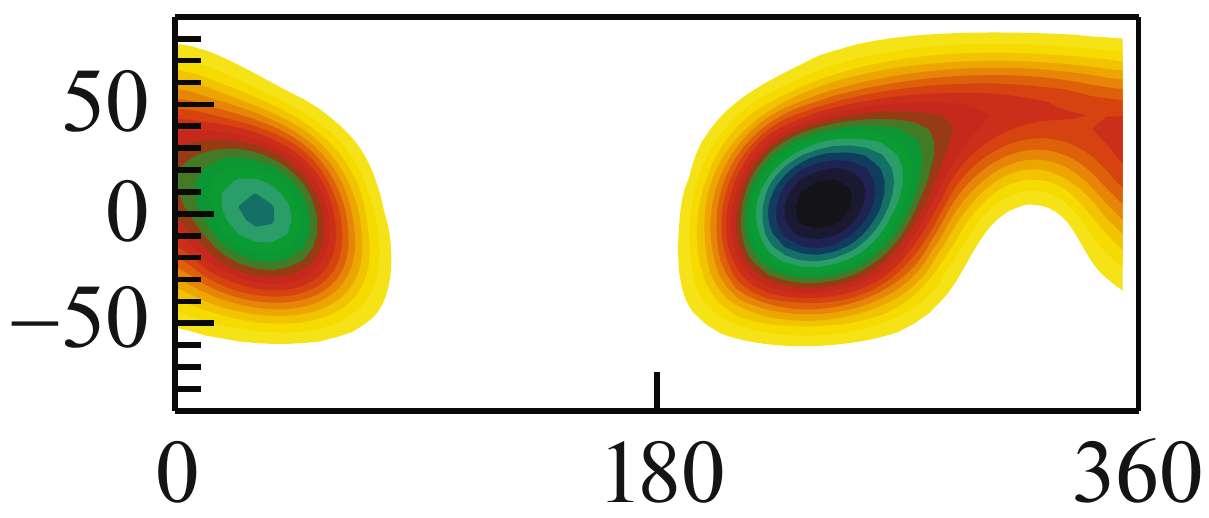
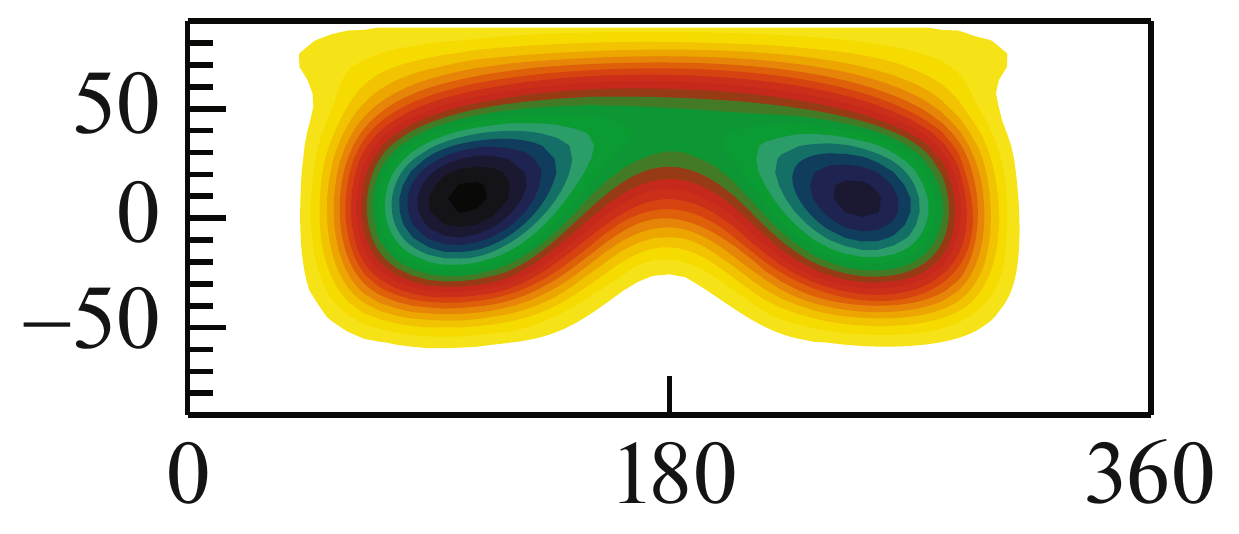
In the case of KIC 6791060, considering the duration of observation and its rotation period we made 3899 time-intervals (each interval corresponds to a single rotation of the star) to construct surface images. For LO Peg, we made 47 time intervals by manual inspection in such a way that each interval had sufficient number of data points without any noticeable changes in the shape of light curve. For K2–33 and EPIC 211901114, we divided all the observational data into 12 and 8 data sets, respectively, each successively covering one rotation period of the star. In each case, the individual light curves were analyzed using the iph code. In our modeling, the surface of the star was divided into a grid of pixels and the values of were determined for each grid pixel. We also considered the respective photospheric temperature and inclination. We adopted surface temperatures of KIC 6791060, LO Peg, K2–33, and EPIC 211901114 to be 6343, 4500, 3540, and 3440 K (Luo et al. 2016, Pandey et al. 2005, Mann et al. 2016, 2017) for our study. Spot temperature were assumed to be 1000 K lower than photospheric temperature (Savanov & Strassmeier 2008). The stellar astrophysical input parameters include a set of photometric fluxes calculated from an atmospheric model by Kurucz (1992) as a function of temperature and gravity. Representative surface maps for all four objects are shown in Fig. 2.
…Latitude (∘)
…Latitude (∘)
. Longitude (∘) Longitude (∘)
…Latitude (∘)
 …Latitude (∘)
 . Longitude (∘) Longitude (∘)
In case of KIC 6791060, we have found only one active longitude region. Over time, we found a shift in the position of the active region along the longitude during the four years observation of KIC 6791060. However, in the case of LO Peg, we found that the surface temperature maps contain clusters of spots at two longitudes. During the 29 years long observation of LO Peg, we have also detected the flipping of an active longitude region to a less active region by less than 180∘ along the longitude also known as flip-flop phenomenon. In case of K2–33 and EPIC 211901114, all the surface temperature maps contain clusters of spots at two longitudes which we represented as two active regions. For EPIC 211901114, we saw no relative variations of the position of the active region on the surface of the star. However, we did find such variations for K2–33. The estimated values of spottedness i.e. the total area of the visible surface covered by the spots for KIC 6791060, LO Peg, K2–33, and EPIC 211901114 vary in the range of 0.07–0.44%, 9–26%, 3.6–4.2%, 4.5–5.3%, respectively and is further discussed in Section 4.
3.3 Flaring events
Flaring events are the explosions on the stellar surface which releases huge amount of magnetic energy stored near the starspots into the outer atmosphere. In the light curves, the flaring events are identified as positive flux excursions throughout the data (see Fig. 1). In our flare analysis, we took great care to identify it correctly so that we do not miss any small flare and at the same time, do not consider an outlier as a flare. Due to the presence of homogeneous temporal resolution throughout the observation of KIC 6791060, K2–33, and EPIC 211901114, we have used the following approach. In the beginning, the light curves were detrended by fitting the sinusoids with periods as obtained from the period analysis. Then, we computed the moving standard deviation () of the detrended light curve. The data-length were taken as twice of the rotational period of the star. A large deviation in the data points from the detrended light curve gives a larger value of and were flagged as flare candidates. Finally, we manually verified all the flagged flare candidates and identified as flares only when 3 consecutive points lie above the 2.5 level.
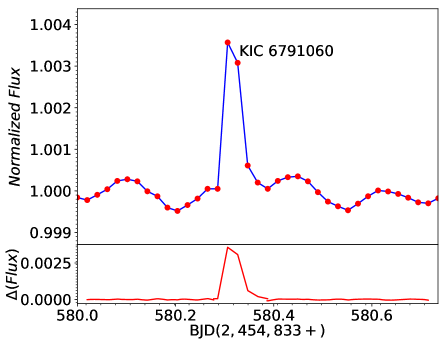
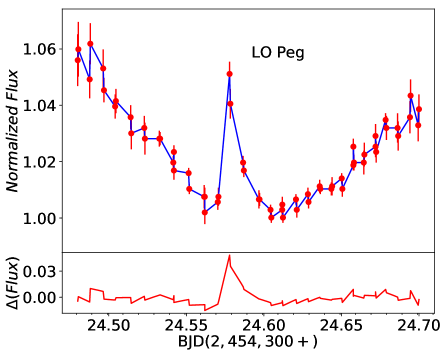
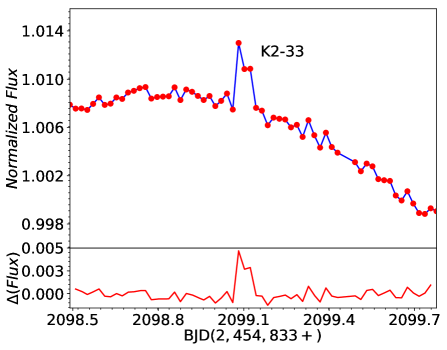
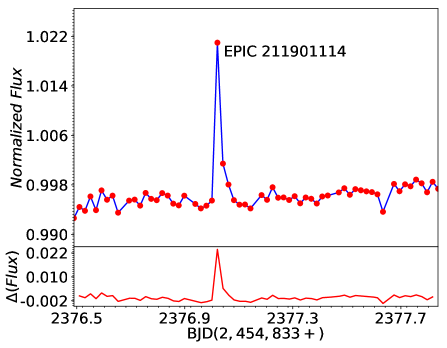
In case of LO Peg, as the light curve data were compiled with various ground and space-based observatory with different cadence and different uncertainties, we followed a different approach. We chose different epochs in such a way that each epoch contains a continuous single night observation with at least 16 data points and minimum observing span of 1 hour. A total of 501 epochs were found among which only 82 epochs have simultaneous observations with other three optical bands. The flare identification is carried out following the above criteria but with visual inspection of each epoch separately. Fig. 3 shows the light curve of representative flares of KIC 6791060, LO Peg, K2–33, and EPIC 211901114. The top panel of each figure shows the light variation with time, whereas the bottom panel shows the detrended light curve. We have detected 38, 20, 7, and 32 flares for KIC 6791060, LO Peg, K2–33, and EPIC 211901114.
The flare energy is computed using the area under the flare in light curve i.e. the integrated excess flux () released during the flare (from flare start-time to flare end-time ) as
| (1) |
Using the respective distances (d) mentioned in Table 1, we derived the flare energy () for KIC 6791060 in the order of 1031-33 ergs. For LO Peg, the flare energies are found to be in the range of 1030.9-34.2 ergs. There are very few detailed studies of optical flares on UFRs due to constraints in their detection limit, detection timing, and observational bias. Our estimates of energy yielded 1032.2-33.3 ergs for K2–33 and 1032.1-33.4 ergs for EPIC 211901114.
4 Discussion and conclusions
In this paper, we have presented the magnetic activities of four active solar-type stars with spectral type F, K, and M. We have constructed maps of temperature inhomogeneities on the surfaces of KIC 6791060, LO Peg, K2–33, and EPIC 211901114. As mentioned in Section 3.2, we have detected the flip-flop phenomena on LO Peg. The flip-flop has also been noticed by several authors such as Jetsu et al. (1991), Korhonen et al. (2002). This phenomenon is well explained by the dynamo based solution where a non-axisymmetric dynamo component with two permanent active longitudes (180∘ apart) is needed along with an oscillating axisymmetric magnetic field. Fluri & Berdyugina (2004) suggest another possibility with a combination of stationary axisymmetric and varying non-axisymmetric components.
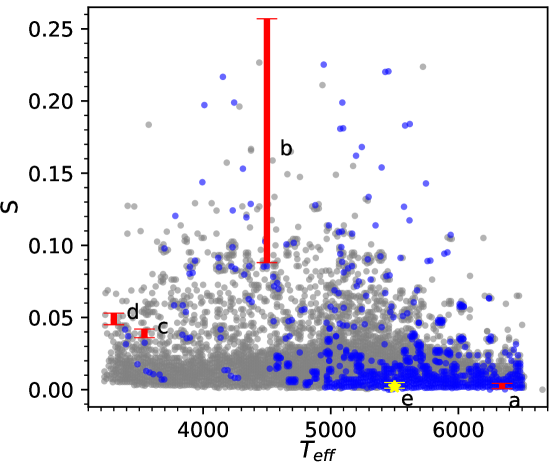
From the starspot imaging, we have also derived the spottedness of these four stars. In Fig 4 we have shown the spottedness of all the F–M type stars from McQuillan et al. (2014) along with the Sun and the stars were investigated in this paper. This shows that the F-type UFR shows low level of activity in terms of spottedness than K-type UFR LO Peg. However, LO Peg shows more activity than other two M-type stars in our sample that could be due to 15–20 times faster rotation rate of LO Peg than those M-type stars. Similar level of magnetic activity was also observed in other K-M type stars such as AB Dor (Collier Cameron & Donati 2002), BE Cet, DX Leo, and LQ Hya (Messina & Guinan 2003).
A total of 38 flares were detected in KIC 6791060 with a flare frequency of 1 flare per 40 days (or 1 flare per 116 rotations). In case of LO Peg, we have detected a total of 20 optical flares with a rate of 1 flare per two days (or 1 flare per 5 rotations). From K2–33 and EPIC 211901114, the number of total detected flares were 7 and 32, respectively. The flare frequency for K2–33 was derived to be 1 flare per 8 days (or 1.2 flares per rotation), whereas in case of EPIC 211901114, it was estimated to be 1 flare per 2 days (or 4.6 flares per rotation). Thus, we found an increasing rate in the flare occurrence per rotation with changing spectral type from F-type to M-type stars. In case of the Sun, the frequency of occurrence of solar flares varies from several flares per day when the Sun is particularly “active” to less than one flare every week when the Sun is “quiet”, following the 11-year solar cycle (Benz & Güdel 2010, Hathaway 2015).
In our comparative study, we noticed that the magnetic activities such as starspots and flaring frequency per rotation found to be increasingly high from F-type to M-type stars. Although having similar internal structure, this higher level of magnetic activities could be explained by their relatively larger thickness of the convection zone to the radiation zone and hence gives a stronger dynamo.
Acknowledgements
This research has been done under the Indo-Russian DST-RFBR project reference INT/RUS/RFBR/P-167, INT/RUS/RFBR/P-271 (for India) and Grant RFBR Ind_a 14-02-92694, 17-52-45048 (for Russia). This paper also includes data collected by the Kepler mission. Funding for the Kepler mission is provided by the NASA Science Mission directorate. We acknowledge NASA Exoplanet Archive, All Sky Automated Survey archive, Hipparcos archive, SuperWASP archive, and different telescope facilities we used to carry out our research.
References
Bailer-Jones C. A. L. et al. 2018, AJ, 156, 58B
Balona L. A. 2015, MNRAS, 447, 2714
Barnes J. R., Collier Cameron A., Lister T. A., Pointer G. R., Still M. D. 2005, MNRAS, 356, 1501
Benz A. O., Güdel M. 2010, ARA&A, 48, 241
Collier Cameron A., Donati J.-F. 2002, MNRAS, 329, L23
Csorvási R. 2006, Proc. 4th Workshop of Young Researchers in Astronomy & Astrophysics, 17, 95
Dal H. A., Taş G. 2003, IBVS, 5390, 1
David T. J. et al. 2016, Nature, 534, 658
Eibe M. T., Byrne P. B., Jeffries R. D., Gunn A. G. 1999, A&A, 341, 527
Favata F. et al. 2000, 353, 987
Fluri D. M., Berdyugina S. V. 2004, SoPh, 224, 153
Frasca A., Molenda-Zakowicz J., De Cat P. et al. 2016, A&A, 594, 39
Gaia Collaboration, Brown A. G. A et al. 2018, A&A, 616, A1
Hathway D. H. 2015, LRSP, 2015, 12, 4
Horne J. H., Baliunas S. L. 1986, ApJ, 302, 757
Jeffries R. D., Byrne P. B., Doyle J. G., Anders G. J., James D. J., Lanzafame A. C., 1994, MNRAS, 270, 153
Karmakar S. et al. 2016, MNRAS, 459, 3112
Karmakar S. et al. 2017, ApJ, 840, 102
Karmakar S. et al. 2018, Proc. IAU Symp., 340, 229
Korhonen H., Berdyugina S. V., Tuominen I. 2002, A&A, 390, 179
Kurucz R. L. 1992, in Barbuy B., Renzini A., Proc. IAU Symp., 149, 225
Lister T. A., Collier Cameron A., Bartus J. 1999, MNRAS, 307, 685
Luo et al. 2016, yCat, 5149, 0
Mann et al. 2016, AJ, 152, 61
Mann et al. 2017, AJ, 153, 64
McQuillan et al. 2014, ApJS, 211, 24
Messina S., Guinan E. F. 2003, A&A, 409, 1017
Pandey J. C., Singh K. P., Drake S. A., Sagar R. 2005, AJ, 130, 1231
Pecaut M. J. et al. 2012, ApJ, 746, 154
Piluso N., Lanza A. F., Pagano I., Lanzafame A. C., Donati J.-F. 2008, MNRAS, 387, 237
Press W. H., Rybicki G. B. 1989, ApJ, 338, 277
Rebull L. M. et al. 2017, ApJ, 839, 92R
Savanov I. S. et al. 2016, AcA, 66, 381
Savanov I. S. et al. 2018, ARep, 62, 532
Savanov I. S., Strassmeier K. G. 2008, AN, 329, 364
Scargle J. D. 1982, ApJ, 263, 835
Taş G. 2011, AN, 332, 57