10.1109/TVCG.2019.2934285 \onlineid1172 \vgtccategoryResearch \vgtcpapertypeDesign Study \authorfooter Katy Williams, Alex Bigelow, and Katherine Isaacs are with the University of Arizona. E-mails: {kawilliams,alexrbigelow,kisaacs}@email.arizona.edu. \shortauthortitleWilliams et al.: Visualizing a Moving Target
Visualizing a Moving Target: A Design Study on Task Parallel Programs in the Presence of Evolving Data and Concerns
Abstract
Common pitfalls in visualization projects include lack of data availability and the domain users’ needs and focus changing too rapidly for the design process to complete. While it is often prudent to avoid such projects, we argue it can be beneficial to engage them in some cases as the visualization process can help refine data collection, solving a “chicken and egg” problem of having the data and tools to analyze it. We found this to be the case in the domain of task parallel computing where such data and tooling is an open area of research. Despite these hurdles, we conducted a design study. Through a tightly-coupled iterative design process, we built Atria, a multi-view execution graph visualization to support performance analysis. Atria simplifies the initial representation of the execution graph by aggregating nodes as related to their line of code. We deployed Atria on multiple platforms, some requiring design alteration. We describe how we adapted the design study methodology to the “moving target” of both the data and the domain experts’ concerns and how this movement kept both the visualization and programming project healthy. We reflect on our process and discuss what factors allow the project to be successful in the presence of changing data and user needs.
keywords:
design studies, software visualization, parallel computing, graph visualizationK.6.1Management of Computing and Information SystemsProject and People ManagementLife Cycle;
\CCScatK.7.mThe Computing ProfessionMiscellaneousEthics
\teaser
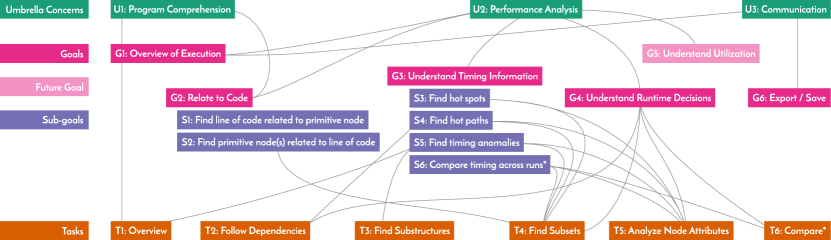
![[Uncaptioned image]](/html/1905.13135/assets/x1.png) Design Study timeline (log scale). The top contains a mark for each collected
artifact.
Connections to identified goals, sub-goals, and tasks are marked when direct evidence for them has been identified.
Artifacts from meetings presenting major design changes and notes
from the evaluation sessions of Section 7.2 are
indicated with color.
The bottom shows the timing of various deployments with users.
This rich collection of over 150 artifacts mitigated issues in designing around
shifting data and concerns.
\vgtcinsertpkg
Design Study timeline (log scale). The top contains a mark for each collected
artifact.
Connections to identified goals, sub-goals, and tasks are marked when direct evidence for them has been identified.
Artifacts from meetings presenting major design changes and notes
from the evaluation sessions of Section 7.2 are
indicated with color.
The bottom shows the timing of various deployments with users.
This rich collection of over 150 artifacts mitigated issues in designing around
shifting data and concerns.
\vgtcinsertpkg
1 Introduction
When choosing whether to move forward with a design study there are several questions a visualization expert should answer to ensure project viability [58]. Among those questions are: (1) whether real, non-synthetic, data is available, and (2) whether the tasks that domain experts will use the visualization for will persist long enough to complete the study. Ensuring these points can help avoid problems arising in designing for the wrong data assumptions or having the users lose interest before the system is completed and evaluated. While in most cases it is prudent to avoid these problems, we argue there are circumstances in which it is fruitful to accept them.
In particular, there are scenarios where precisely what data to collect is an open question. The answer would ideally be driven by what analysis needs to be performed. This “chicken and egg” situation can dissuade both domain and visualization experts from engaging. The domain expert does not want to collect data with no plan for analysis. The visualization expert cannot act without real data. Thus, an opportunity for visualization to inform the data collection process is lost and the greater problem remains unsolved.
We observed this scenario in the domain of task-parallel computing. Parallel systems are challenging to comprehend due to their complexity. Several factors affect performance and correctness including program source code; the parallel libraries used; the input to the program; and the architecture of the cluster on which it is run. Understanding the emergent behavior in these systems is necessary to optimize and debug them. While some areas of parallel computing have a long history of data collection for performance analysis, the data necessary to analyze a more recently prominent model—asynchronous many tasks—is a relatively open area.
Recognizing the pitfalls of changing data and concerns, but also the potential of using visualization to help drive the development of those data and concerns, we proceeded with the design study. Although the pitfalls could have derailed the project, we found other factors—such as the shared interest in the data collection problem and the identification of key recurring abstract structures—resulted in the creation of visualizations that were beneficial even as things changed. From these experiences, we demonstrated how the benefits of visualization are not only the design of the final solution, but the integration of the visualization team and its effects on the overall project development.
We describe our iterative design process and how we adapted the design study methodology [58] to the “moving targets” of our data and user tasks. Our task analysis and abstraction were developed through multiple rounds to account for evolving concerns.
Through this process, we developed our technology probe [27], Atria, a multi-view system for exploring execution graphs. Unlike other execution graph visualizations, we display the graph as an expression tree, evoking the main logical dependencies of the computation while preserving additional edges on demand. Atria provides the context of source code to the execution graph not only through linked highlighting, but also through a default aggregation and de-cluttering scheme based on line of code.
We further discuss how the changing concerns affected deployment with implications for design, particularly in the case of Jupyter notebooks [37]. We augment our assessment of our design with evaluation sessions and semi-structured interviews.
The major contributions of our study are as follows:
-
•
A task analysis for execution graphs (Section 5) and how we iterated on that analysis under changing conditions,
-
•
The design of Atria, a interactive visual tool for analyzing task execution graphs (Section 6),
-
•
A discussion of the design adaptations and the difficulties of incorporating visualization within the Jupyter notebook environment (Section 6.4), and
- •
2 Related Work
We discuss related work in design study methodology, task abstraction, visualization of execution graphs, and tree visualization techniques.
Design Studies. We report on the initial phases of an ongoing design study, including multiple deployments of our system, Atria, as a technology probe [27]. This process has enabled us to collect rich, qualitative data. While informing future iterations in our collaboration with domain experts, reflections [45] (Section 8) on these data already have meaningful implications for the visualization community.
In the context of the nine-stage framework for design study methodology [58], this work represents a full cycle, including many sub-cycles, of each of the nine stages. We build upon previous visualization and design study experience at the learn stage to inform careful, deliberate decisions at the winnow stage, that we discuss in Section 4.2.1. We observed refinements at the cast stage over time, where deployments and conversations with domain experts exposed deeper insights into the various roles that they play in practice. At the discover stage, our tool enabled insights for our collaborators and ourselves, particularly with respect to horizontal movements in the task-information space—Atria drove many discussions about what data needed to be collected that were unlikely to have occurred without our probe’s involvement. The simple nature of the tool enabled relatively simple design refinements, as well as rapid implement and deploy stages. Throughout we use the term iteratively to describe the repetition of design stages and iteration to mean each new version of Atria presented to our collaborators, as marked in green in Figure Visualizing a Moving Target: A Design Study on Task Parallel Programs in the Presence of Evolving Data and Concerns.
In framing our contributions in terms of the nine-stage framework, it is important to address considerations that it does not capture. We deployed Atria in very diverse technical and practical contexts, creating a parallel, multi-channel collaboration environment like that described in detail by Wood et al. [63]. We did not experience the constraints described by Crisan et al. [16], but our process also benefited from thorough artifact generation, frequent communication, and staged design. Our focus in this early phase of a long-term collaboration has been to elicit robust design requirements, rather than deploying prototypes too early [44]. Instead, we report on the use of a technology probe to build, intervene, and evaluate [43], with Sedlmair et al.’s [58] reflect and write stages applying continuously. As Hinrichs et al. [26] show in digital humanities, we demonstrate value in the visualization process. Finally, we contend that, in some cases, it may be beneficial to consider collaborations where a design study will have an opportunity to impact how data is collected and how the initial data abstraction is designed.
Task Abstraction. Several methods have been proposed for bridging low level visualization tasks to more complex goals [10, 55, 39, 64]. Brehmer and Munzner [10] propose composition of low level tasks. Zhang et al. [64] demonstrate combining hierarchical task analysis [3, 4, 56] with visualization task abstractions. As the data and concerns evolved, we did not observe stationary tasks at a low enough level to yet apply these detailed methods meaningfully. However, recognizing the importance of linking goals and tasks, we describe our task findings in terms of multiple levels. The lower level tasks of high level goals often overlapped, resulting in a lattice as described in Section 5.
Execution Graph Visualization. Node-link diagrams are prevalent in execution graph visualization [11, 19, 28, 54]. Dokulil and Katreniakova [19] remove edges that can be reached by other paths, plotting their results with dot [21, 22]. DAGViz [28] and Grain Graphs [54] use aggregation schemes to decrease the number of marks shown, taking advantage of nesting structures inherent to fork-join models of parallelism, but not present in general tasking models such as ours. Neither solution is interactive. In contrast, our interactive visualization abstracts execution graphs to a tree and aggregates based on the source code.
Trace data from tasking models has been visualized with Gantt charts. Ravel [29] shows the edges in Charm++ traces [35], but these are a subset of those in the full execution graph. Haugen et al. [25] show edges connected to a single task on demand. Pinto et al. [51] do not show edges. We do not have trace data and thus Gantt charts are inappropriate for our use.
Parallel calling context trees (CCTs) describe caller-callee relationships and are frequently visualized [2, 1, 42, 47, 6]. They differ from our execution graphs which are at a finer-grain task level and include dependencies not captured by CCTs. For a survey of visualizations across parallel computing models, see Isaacs et al. [31].
Tree Visualization. Visualizing a graph as a tree is an established practice [24, 20, 32, 50, 48] to reduce complexity and improve readability, especially when the tree has a semantic meaning. In our case, we visualize the edges relating to how the computation is expressed in code—its expression tree.
To reduce clutter, we collapse subtrees and encode them as triangles, like SpaceTree [52], but our collapsing strategy is based on meaning in the source code rather than screen space. Many techniques [40, 14, 52, 46, 61] exist for scalable hierarchy visualization. As part of the strategy of handling evolving data and tasks, we aim to “[satisfy] rather than optimize” [58] our depiction, but could apply these techniques once necessary. For a survey of tree techniques, see Schulz [57].
3 Task Parallel Programs and Execution Graphs
Parallel and distributed programs utilize vast computational resources to produce results that are often too time-consuming, if not infeasible, on a single processor. Achieving these time benefits often requires careful consideration of performance on the part of the programmers. Understanding observed performance is difficult because of the complexity of the emergent behavior stemming from the source code and the systems on which they run. The systems include not only the hardware, but the runtime which dictates the execution of the program and the environment in which it runs.
Performance is affected by several factors including adaptive scheduling policies that are difficult to predict. Intermediate structures may be created by the runtime that are not apparent to the programmers. Even known structures may be hard to reason about, given the dynamism in the system.
Asynchronous tasking runtimes (ATRs) are a class of parallel runtimes that have been gaining interest for their potential to increase resource utilization and overcome performance bottlenecks inherent to other paradigms. However, due to their more recent prominence, support for performance analysis of ATRs is still developing.
An Asynchronous Tasking Runtime supports an Asynchronous Many-Task (AMT) execution model. Typically, these models divide and encapsulate work (computation) into units known as tasks. The runtime then schedules the task for execution on one of its distributed resources. The flexibility to move tasks between resources allows ATRs to take advantage of parallelism other models may not.
3.1 Execution Graphs
Common to tasking models is the notion of an execution graph. In an execution graph, each task is a node. The edges are dependencies between tasks. A task cannot be executed until its dependencies are met. Tasks without dependencies between each other may run concurrently. Runtime developers are thus interested in these dependencies and their effect on scheduling decisions.
Execution graphs may be recorded during program execution. To reduce collection overhead, tasks of the same type (e.g., same function name) or with the same provenance (e.g., same function name and sequence of function names leading to the task) may be aggregated. We focus on the latter type of execution graph data in this project.
Attribute data is collected for each node in the execution graph. Typically for performance analysis, the number of times each task type was run (count) and the total time spent executing instances of that task are recorded. During our project, attribute data was augmented to also collect information about what mode the task was executed (see Section 4) and relation to line of source code.
3.2 Performance Data and Analysis in ATRs
There are many ATRs under active development [34, 35, 15, 5, 8, 17], but no standardized expectation for what performance-related data is collected. Existing parallel performance tools like TAU [59] and Score-P [38] can collect general performance data such as low-level profiles and traces, but often do not support ATR-specific data such as execution graphs. Existing execution graph work has often been specific to the ATR. Exactly what data could and should be collected when analyzing an ATR is an open area of research.
4 The Phylanx Project
We conducted this design study as part of a visualization initiative in the Phylanx Project. First, we provide technical background of the Phylanx [60] system necessary to understand our resulting visualization. We then discuss the organization of the project itself, how it led us to accept winnowing pitfalls, and the roles we cast in the design study.
4.1 Technical Overview of Phylanx
Phylanx is an actively-developed system for performing array computations in a distributed fashion. Its purpose is to provide the advantages of distributed resources (faster time-to-solution and the ability to scale beyond single-machine memory limitations) to data scientists while allowing them to use the tools with which they are familiar.
One such tool is Python. Phylanx has a front-end which allows data scientists to mark which of their Python functions they want run distributedly. Phylanx then translates the array operations in the Python code into HPX. HPX [34, 33] is a C++ standard library and asynchronous tasking runtime.
The average end users need not be concerned with how Phylanx transforms their code. However, power users interested in performance and the developers of the Phylanx system are.
Phylanx first translates the code into an intermediate representation in a domain-specific, functional language called PhySL. The function calls, control flow operations, data operations, and blocks found in the PhySL representation are referred to as primitives. These primitives are translated to tasks in the HPX runtime. The dependencies of each primitive are the arguments it needs to execute (which may be other primitives), data access operations, or any other constraints on variables the primitive uses. The dependencies and primitives form the execution graph which is run by HPX.
HPX can schedule any instance of a primitive in one of two modes: synchronous or asynchronous. A synchronous primitive is executed immediately from the primitive that initially spawned it. An asynchronous primitive is added to an internal work queue and may be executed on a different processor at some later time. Asynchronously scheduled primitives give the runtime more flexibility but incur more overhead, so it is beneficial to execute shorter primitives synchronously.
4.2 Phylanx Project Organization
The Phylanx project comprises three teams, each located at a different academic institution. The Runtime Team develops the HPX and Phylanx libraries. The Performance Analysis Team develops instrumentation to collect performance data and tools to improve performance. They also maintain the nightly regression tests and reporting. The Visualization Team develops visual tools to aid in performance analysis and debugging. Additionally, a program manager (PM) for the project seeks out further collaborations and develops data science applications using the Phylanx system. A list of team members involved in the design process and their roles is available in the supplemental material.
We discuss the inception and further organization of the project within the framework of the design study methodology of Seldmair et al. [58], specifically the winnow and cast phases. We note which pitfalls were accepted and what other aspects of the project helped mitigate the negative affects of those pitfalls.
4.2.1 Accepting Winnowing Pitfalls
Prior to the official project start, the Performance Analysis PI and the Visualization PI had several conversations regarding difficulties in analyzing ATRs. The Visualization PI had faced the issue of traditional data collection being insufficient to analyze ATRs [29]. The Performance Analysis PI expressed difficulty in making sense of the data that could be collected. He noted there was little point in spending development resources and overhead on data that could not be analyzed.
These two coupled issues, (1) no data to analyze and (2) no analysis with which to use to the data, present a “chicken and egg” barrier to improving understanding and performance of ATRs. The two PIs view determining what data to collect a research goal of the project.
The data being an evolving target of research, along with the development of Phylanx itself and its changing concerns, means the project runs afoul of two of Sedlmair et al.’s winnowing pitfalls:
PF-4: No Real Data Available (Yet). During the project, the structure of the data and the format of the data have been evolving. Other potential sources of data are not yet instrumented. It is difficult to arrive at a final visual solution without finalized data.
PF-10: No Real/Important/Recurring Task. The fact that the data is in flux means tasks involving that data are also in flux. Furthermore, as Phylanx is developing rapidly, the concerns of the team members change over time, affecting their higher-level goals.
The decision to proceed despite these pitfalls was motivated by the desire to solve the larger problem of performance optimization and analysis for ATRs. We view working with preliminary and in-flux data as a stepping stone to achieving the “data behind the data”—the data that can only be envisioned with knowledge gained from exploring what we already know.
There are several factors that help with the continuing success of the project, despite the pitfalls:
Identification and availability of meaningful preliminary data. Though the data collection is its own area of research, the PIs foresaw the importance of the execution graph based on prior work and could confidently predict it would continue to be useful to understand. We hypothesized that some tasks would therefore remain stable (see Section 5). Furthermore, design did not begin until a preliminary dataset could be generated.
Strong interpersonal relationships. The cohesion of the three groups facilitated adaptation to new data. Teams were quick to clarify or explain changes in format and to react to requests to change. The trust among the teams allowed the Visualization Team to plan for future functionality with relatively low risk.
Overarching goal of the project did not change. The high level goals of performance analysis and optimization, along with the goal of discovering what data to collect, remained the same, though strategies employed by the users changed. Thus, high-level goals that are aided by visualization, such as understanding the execution, remained fixed.
Visualization considered a deliverable by entire project. All project teams recognize the visualization component as an outcome. Progress on the visualization is reported at the weekly full-project teleconference and included in all reports. The success of the project includes the success of the visualizations.
The incorporation of visualization as a project-wide outcome underscores the continuing approval and enthusiasm communicated by project gatekeepers, placing them in the High Power-High Interest quadrant of the matrix proposed by Crisan et al. [16]. Team members were not only authorized to spend time on the visualization, but encouraged to do so. We further discuss project roles below.
4.2.2 Casting Roles: Gatekeepers, Analysts, Experts
The Runtime and Performance Analysis PIs, project manager, and program manager all serve in the gatekeeper role, with the Runtime PI and project manager being the most central in allocating time with front-line analysts. One student was identified as a front-line analyst early in the project. As the project evolved, several other students with differing concerns (See Section 7) were cast in the role.
The gatekeepers also acted as front-line analysts. The PIs had similar technical goals as the students. The project and program managers were more representative of a second goal—communicating the project to outsiders. All gave feedback regarding designs throughout the project.
An interesting facet of the project is that almost every person is a form of tool builder. Sedlmair et al. noted the pitfall of mistaking fellow tool builders for front-line analysts. Here they are both because a major goal of the visualization is to help the tool builders in building their tools. Their role as tool builders furhter helped them accept working with an in-development visualization (See Section 8).
Some studies have found success in blurring the boundaries between domain and visualization experts [63]. Our project naturally maintained them, further avoiding the pitfalls of working with fellow tool builders [7]. We found communicating with mock ups and screen shots was sufficient—users did not need to learn the language of visualization. Furthermore, as the other teams trusted in the visualization expertise of the designers, they accepted change in the design over time.
5 Task analyses
We had three objectives in designing our visualization. We wanted to (1) support the analysis needs of our collaborators, (2) refine data collection and analysis for tasking models, and (3) prepare for future needs given the refined data collection and the progress of the Phylanx project. Through our multi-year collaboration, we assessed needs through general project meetings, focused visualization and performance analysis meetings, and informal interviews. From these, we developed a goal-to-task lattice ( Fig. 1), which we updated as needs shifted. We elaborate on this process and present the lattice below.
The project had weekly status meetings where all teams gave updates on the progress of individual components. Emerging problems were briefly discussed, but scheduled for another meeting if necessary. There was an optional meeting slot to discuss performance analysis and visualization specifically when requested. We wrote notes from both these meetings, including subjects not directly related to the visualization. We also had face-to-face meetings twice a year, once at another team’s site and another at a conference in high performance computing.
Through the present, we created 152 note files with a mean 2800 characters per file. Some contractual information prevents us from releasing the complete audit trail [13] at this time, but anonymized summaries of our task analyses, with relationships between specific note files and the goal-to-task lattice are included as supplemental material. The project manager also compiled regular notes from the perspective of the Runtime team which augmented our understanding of the full project status and aided in our planning.
Tasks regarding the execution graph were derived from the note files by two authors independently who then developed a lattice spanning from high level goals to low level tasks using affinity diagramming. We classify these as umbrella concerns (U1 - U3), goals (G1 - G6), sub-goals (S1 - S6), and tasks (T1 - T6).
5.1 Umbrella Concerns
We use the term umbrella concerns to describe the major classes of goals we found our users had with respect to visual analysis. Some goals fell under multiple umbrella concerns.
U1. Program Comprehension. Our collaborators want to understand what happened when the program was executed. Many were working on a specific piece of the Phylanx pipeline and did not have a concrete mental model of how the translation from code to execution graph took place, nor a sense of the intermediate PhySL representation. Although previous work found that computing researchers may consult graphs to debug their mental model [18], we found some of our collaborators wanted to build their mental model. This is often a first step to devising new strategies, debugging, or performance analysis.
U2. Performance Analysis. An impetus for moving to tasking runtimes is the potential for high performance—decreasing the time to solutions and/or making previously infeasible computations feasible. Thus, understanding and improving the performance of a given Phylanx application or the system itself was a driving concern.
U3. Communication. Our collaborators wanted to create figures to help explain their own research in publications. The project and program managers were interested in explaining to potential users how the Phylanx system works. Such users often already have a background in parallel computing and thus can interpret the visualization when presented by someone from the team.
5.2 Goal-Task Lattice
We identified six goals relating to the execution graph and our umbrella concerns, some of which could be divided into smaller sub-goals. We discuss each goal and relate it to low-level tasks. We then summarize the tasks pulled from our goals.
G1. Overview of Execution. All three umbrella concerns wanted some sort of overview of what happened during the execution, in particular, the size and shape of the execution graph and how many times each node was executed. This goal can be divided into tasks of gaining a graph overview (T1), following dependencies (T2), and finding substructures (T3). For example, our collaborators explained that the visualization should allow them to understand if something was called recursively. This can be done by following a cycle of dependencies in the aggregated execution graph.
G2. Relate to Code. While the execution graph describes how the runtime executes the program, our collaborators cannot directly change the graph itself, only the associated source. Thus, they want to know the relationship between the code and the graph for both program comprehension and performance analysis concerns. We divide this into two sub-goals: (1) finding the line of code related to a node in the graph and (2) finding the nodes in the graph related to a line of code. The latter we categorize as a task of finding a subset of nodes (T4).
G3. Understanding Timing Information. Central to the Performance Analysis concern is data recorded about time spent executing each node. Of particular interest is finding parts of the execution that took a long time or behaved in an unexpected way, leading us to identify sub-goals of: (1) finding hot spots, (2) finding hot paths, and (3) finding timing anomalies. Hot spots are nodes that executed for a long time. Hot paths are sequences of such nodes.
Later in the project, as our collaborators progressed from the initial development of their applications to performance optimization, a fourth sub-goal, (4) comparing performance between runs, was discovered. We added it when we revisited our goal-task lattice.
All of these sub-goals require finding a subset of interesting nodes (T4) and analyzing attribute data of those nodes (T5). The hot paths sub-goal also requires following dependencies (T2). The timing anomalies sub-goal may further involve identifying substructures in the graph (T3) and understanding an overview (T1). The comparison sub-goal requires comparing attribute data (T6).
G4. Understand Runtime Decisions. A key feature of tasking runtimes is built-in support for adaptively altering execution based on runtime data to improve performance. Our collaborators want to know what choices were made and the effect on performance, making this a Performance concern. An example of this goal is the choice of execution mode as described in Section 4.1. Similar to G3, understanding runtime decisions is aided by finding a subset of interesting nodes (T4) and analyzing node attribute data (about runtime parameters) (T5). As decisions are related to dependencies, following dependencies (T2) is another task. Also like G3, we updated the tasks for this goal with comparison (T6) as the objectives of our collaborators shifted.
G5. Understand Utilization. The primitives represented by the execution graph as nodes must be scheduled to run on computing resources. Researchers are interested in maximizing the utilization of those resources—spending less time idling and more time doing useful work. Thus, this was another Performance concern. However, neither examining this data nor the capability to associate utilization data with the execution graph was a development priority for our collaborators over the other goals. We thus included it in our goal-task lattice as a possible future node, with references to notes on the matter so we may look back on them should utilization become a more pressing concern.
G6. Export/Save. Supporting the Communication concern, our collaborators requested a mechanism for exporting and saving the visualization.
From the goals, we collect six low-level tasks. We list them here followed by their relationship to the task taxonomy for graphs of Lee et al. [41].
-
T1.
Overview (4.4 Overview)
-
T2.
Follow Dependencies (4.1.1 Adjacency, 4.3.1 Follow Path)
-
T3.
Find Substructures (5 Higher Level Tasks)
-
T4.
Find Subsets (4.2.1 Node Attribute Tasks)
-
T5.
Analyze Node Attributes (4.2.1 Node Attribute Tasks)
-
T6.
Compare (4.2.1 Node Attribute Tasks, 5 Higher Level Tasks)
The presence of topology-based (finding adjacencies) and browsing (follow path) tasks when understanding dependencies motivates our use of visual representations that explicitly encode edges.
While there are several node attribute tasks, we note that we have relatively few attributes—timing data and mode of execution. This motivates our design decision to use on-node encoding, as it is easily understood by most users [49].
5.2.1 Evolution of the Goal-Task Lattice
We remark that our task analysis remained stable through multiple revisions. Later notes tended to reinforce goals and sub-goals already in the lattice. This may be due to the central need for comprehension of the execution as a starting point for any other goal. We hypothesize this relative stability over time contributed to the success of the visualization, despite the evolution of the data and the shift in focus towards comparison.
6 Visualization Design
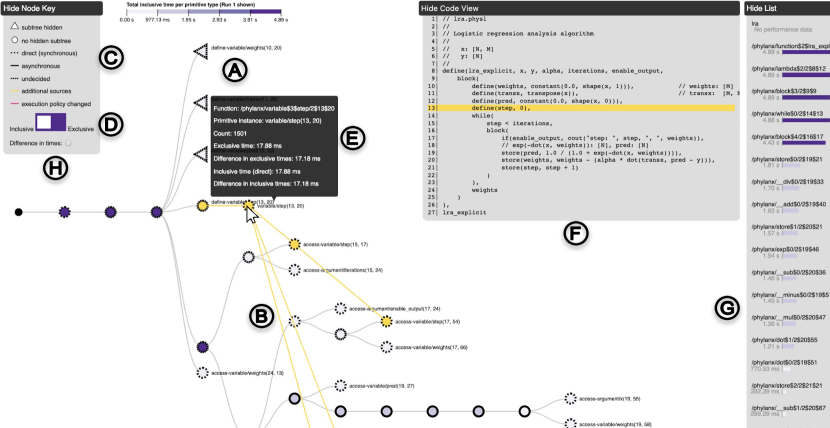
Atria (Fig. 2), was designed and developed iteratively as data became available. We describe our design choices and explain how the evolving data, tasks, and environment influenced our design decisions.
The central view of Atria is the execution graph, visualized as a node-link tree. We explain this choice along with the choice of attribute encodings. We then describe the auxiliary linked views.
Throughout its development, Atria has served several purposes: (1) an initial validity check on data generated, (2) a visual tool supporting our collaborators in their evolving tasks (Section 5), and (3) a platform for hypothesizing about what new data to collect to help with the analysis. In support of these concerns, deployment of a working version was a priority. Matching the evolution of project concerns, we strongly embraced the advice [58] of satisfying needs rather than optimizing them. We describe the effect of these deployments on design, including significant changes for Jupyter Notebooks (Section 6.4).
6.1 Execution Graph
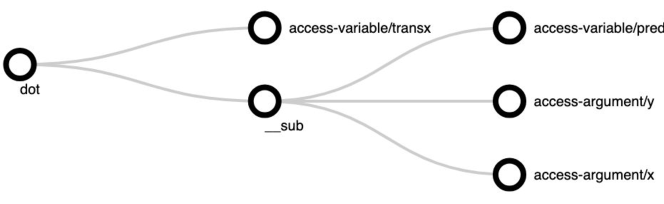
An execution graph is a directed acyclic graph of tasks describing the dependencies that must be met before any task (primitive) can be executed (Section 4). Rather than show all edges in the graph, we display a subset of the edges and lay out the graph as a tree. Specifically, we represent the execution graph as an expression tree.
In an expression tree, each node is an operation and its children are its operands. In Atria’s graph view, each node is a primitive, which may be a simple or complex operation, and each child is an operand to that primitive as described by the PhySL intermediate representation. Fig. 3 shows a small example. We chose to prioritize expression tree links because of their relation to the PhySL code and to descriptions of the Phylanx model we had gathered from discussions with collaborators and their presentations.
Our collaborators’ interest in the expression tree abstraction drove the evolution of the data collection. First, we collected only expression tree data. We created three interactive tree visualizations using icicle plots, node-link diagrams, and indented trees. Each allowed collapsing of sub-trees into single marks (triangles in our node-link tree). Within a few months, it became clear from viewing only the expression tree that there are cases where the execution graph is needed for analysis.
We created mock ups showing a full-graph node-link diagram as well as options for augmenting the tree visualizations with the extra edges. Our collaborators uniformly preferred the tree layout. We then decided to focus on the node-link representation (using D3’s [9] Reingold-Tilford [53] layout) for the tree because that early visualization received the most use; node-link diagrams are already prevalent in the computing space [30]; and studies have shown the utility of node-link representations for path following tasks [23, 36] i.e., T2.
Mindful to avoid premature design commitment, we revisited the choice of tree representation later with a collaborator not involved earlier. He strongly preferred the node-link tree, saying “Whenever we were learning algorithms or something like that, we would draw it like that. It’s more comfortable because we’re more used to it and we can more easily see what’s going on…Although the one in class might be drawn top down though.” We chose the horizontal aspect ratio because most displays have more horizontal space.
This familiarity with node-link diagrams can further help users in identifying substructures (T3). The trade off is that node-link diagrams are not compact. Users had to zoom or scroll to gain an overview (T1).
Elided Structure and Interaction. By showing only the expression tree as dictated by the PhySL, we have removed two classes of edges: (1) dependencies between multiple accesses of the same variable, and (2) dependencies between multiple uses of the same function call. These are not usually needed for our users’ goals. To support a more detailed analysis if necessary, we show them in a node-centric manner on demand. When a user hovers over a node, the edges are overlaid in yellow to be non-obtrusive.
Some sub-structures in the tree are common but rarely of interest to our collaborators. To de-clutter the visualization, we use two strategies. First, we automatically collapse sub-trees for a known set of “uninteresting” primitives. Second, for the on-demand links, we omit edges between library functions (e.g., add) as these do not communicate the structure of the application, but lower level information about the runtime that our collaborators do not expect to be of use.
Node Attribute Encodings. As timing and runtime decisions tie directly into our collaborators’ goals (G3, G4), in particular task (T5), we encode timing and execution mode on-node. Execution time is encoded in the node’s fill saturation , allowing users to find groups of nodes with similar timing in context (T3, T4). Execution mode is shown in the border’s line style. The exact time and name of execution mode, as well as other attributes such as the execution count, are provided in a tooltip on node hover further supporting T5.
Users can switch between two concepts of execution time. Inclusive time is the wall-clock time taken for the primitive to execute. Exclusive time subtracts from the primitive any time that can be attributed to waiting on its children. Our collaborators are interested in both.
6.2 Auxiliary Views
A collapsible linked view displayed the PhySL code to support G2, relating to code. Sub-goals S1 and S2 are implemented as linked highlighting. The code view auto-scrolls on node hover. We experimented with showing the related C++ or Python, but PhySL was preferred.
To support S3, finding hot spots, we have a collapsible list view which shows the tree primitives from most time-consuming to least with colored bars matching the on-node time encoding. The view is similar in design to that of Intel’s VTune, which is used by several of our collaborators. VTune works at a lower-level of abstraction and cannot list by primitive.
6.3 Designing for Comparison
During our design study, some of our collaborators began exploring the effect of adaptive policies that change execution modes at runtime. They make changes to these policies between runs and wish to compare the results. They reported opening multiple Atria instances. In response we added a comparison mode.
Discussions after we proposed a comparison view indicated that our collaborators only compare two runs at a time, allowing us to calculate a simple derived value. For timing comparison, we change the node fill from execution time to execution time difference using a diverging color scale. For execution mode comparison, we highlight (magenta) the borders of primitives that were executed differently between runs but keep the line-style encoding of the first dataset. These encoding changes support the discovery of interest subsets of nodes (T4) and their comparison (T6).
When only policies are changed, the structure of the tree does not change. However, when the application code or Phylanx changes, the tree structure will change. As Phylanx is under active development, we observed small topology changes every few weeks. When we observe nodes that are not present in both trees and thus cannot be compared, we draw them with lowered opacity, similar to the approach employed by Campello et al. [12]. So far topology comparison has not been a focus of our collaborators.
6.4 Design Changes for Deployment
Our primary Atria audience uses a web-based deployment. As the data collection, output, and use scenarios evolved, we created several design variants, resulting in multiple similar deployments, described in the supplemental material.
Output and collection changes, made by the Runtime team, were driven by visualization goals, specifically: (1) integration of Atria with automated nightly regression tests and (2) a full application-to-analysis demonstration in Jupyter, requested by team members with external communication goals (U3). We discuss changes for the latter below.
6.4.1 Atria in Jupyter
Jupyter Notebook is an interactive coding environment supporting literate programming. Users enter code into input cells that can be run (and re-run) to produce output cells. Variables persist through multiple input cells. Jupyter Notebooks are one of Phylanx’s front-ends, available through Docker containers. The front-end is important to the project due to the ease and portability of container installation combined with the prevalence of Jupyter in the data science community.
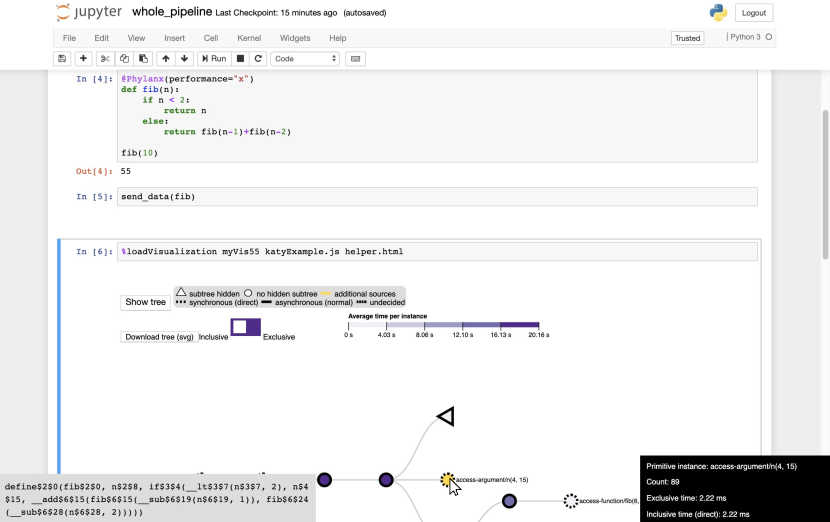
The project and program managers give Phylanx demonstrations through this front-end and thus wanted Atria integration to help explain the programming model. Once we had an initial Jupyter pipeline in place, we found additional users who wanted to test out small code snippets and see the effects. An example notebook is shown in Fig. 4. The export/save (G6) functionality was prioritized as users wanted to further share results.
The Jupyter Notebook interface imposed an additional space constraint on Atria, decreasing the width to of the browser. Normally our users can devote an entire display to the visualization. We modified Atria’s layout of auxiliary views to prioritize visibility of the graph. Tool tip data was moved to a fixed position in the bottom right so it did not obscure the graph or legend.
We decreased the size of the code view and placed it in a floating window in the bottom left. It shows three lines of code, which we determined was enough context for our users during formative evaluation. Users can output the full PhySL to a separate Jupyter cell, which was done during demonstration. The Jupyter interface itself thus acted as another (full) code view, available via scrolling.
Jupyter is hosted in a web environment with its own structure, styling, and handling of Javascript. This posed technical challenges in embedding our Javascript visualization in a cell in a maintainable manner. We view streamlining of this process as an avenue for future work.
7 Evaluation
We evaluate Atria and its inclusion in the Phylanx project through case studies gathered during deployment and evaluation sessions. Additional figures describing the evaluation and a video showing the case study of Section 7.1.1 are included as supplementary material.
7.1 Deployment Case Studies
As described in Section 6.4, we prioritized deploying versions to our collaborators, creating several variants during the project. Additionally, the program manager created a variant for his workflow at a secure facility. Data collection and design streamlining done for earlier deployments made this last deployment possible.
We polled our collaborators for their non-evaluative uses of Atria every few months. R3 consistently reported using Atria as described below. One other student reported using it actively when they were working on a particular algorithm, but has since changed objectives and does not presently use it. The program manager reported using it sporadically to explain the project to others. In the evaluation sessions (Section 7.2), four participants report using it minimally.
We describe two case studies. The first shows how Atria is used regularly in Phylanx development. The second describes how Atria was used in a reactive situation to aid in reasoning and how the Atria development process influenced the performance debugging process.
7.1.1 Atria in Regular Use
Our primary frontline analyst, R3, began using the deployed version of Atria within a few months of the start of design in January 2018. He reported using the visualization on average once a week, more frequently when actively debugging.
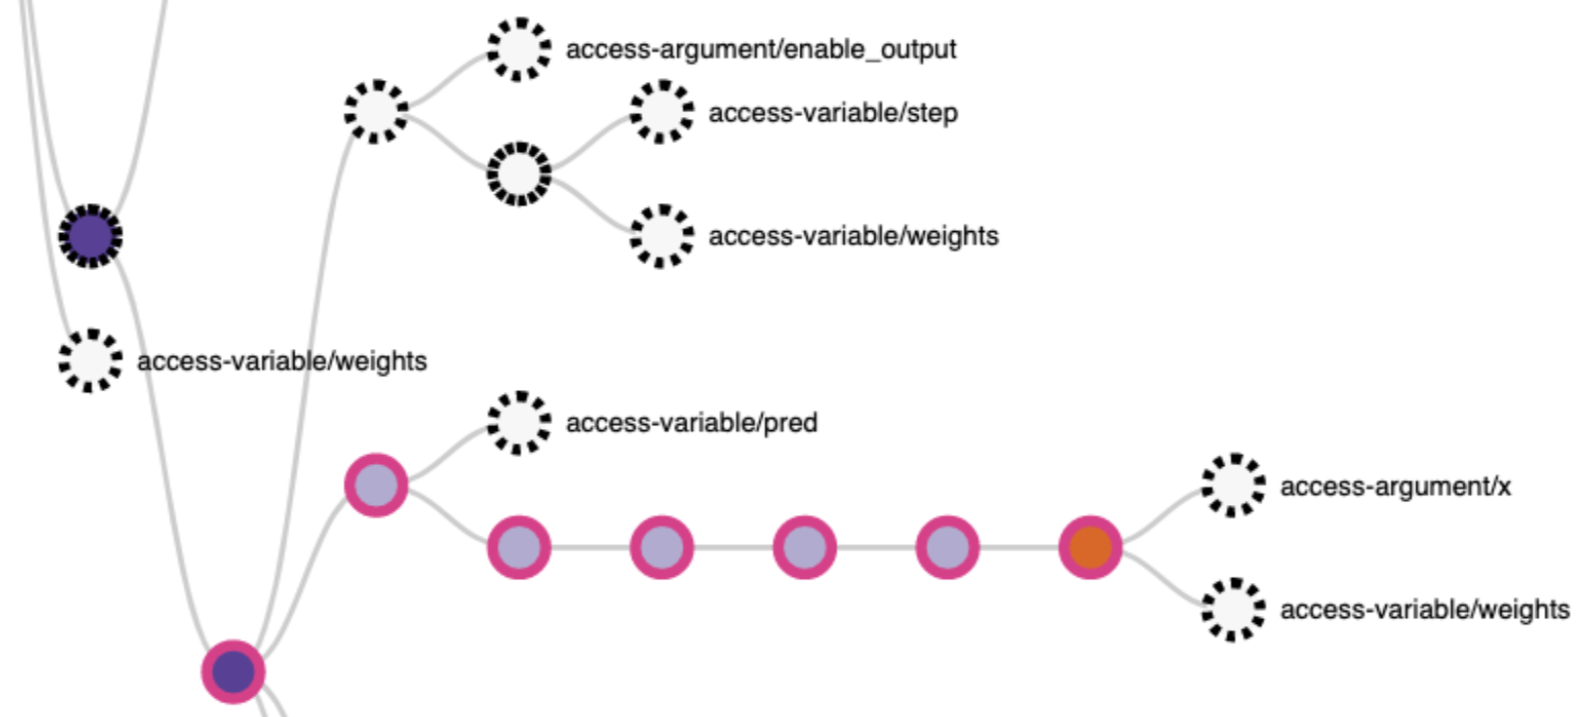
He first runs the application he wishes to examine, generating the data used by Atria. He copies the files to a local directory and opens Atria from the command line. He considers the overall shape of the tree, noting that nodes with similar depth may be candidates to run concurrently. Then, he considers a particular primitive and its children to examine how the timing and execution of the children may have affected the parent as shown in Fig. 5.
Using his gained intuition, R3 makes a change in the Phylanx policy. He changes the thresholds that determine whether a primitive will be run synchronously or asynchronously. He runs the program with the new policy and collects data. Using Atria, he compares the two runs to see which of the primitives changed their execution policies and whether that caused them to run faster or slower. As the policy change is global and timing changes may have non-local scheduling effects, he browses the entire tree. He uses his findings to inform the next iteration of policy development.
When explaining his workflow to us, R3 said “Also it’s that I want to be able to visualize it [the algorithm], just seeing it implants it in my mind.” He explained that he is a visual person and Atria makes it easier to think about the problem.
7.1.2 Investigation of Performance Regression
A significant slowdown in Phylanx’s alternating least squares (ALS) application was discovered through nightly regression tests. The project manager (R2) suggested using Atria to compare runs before and after the performance drop.
The regression tests ran with a large and a small dataset. Atria data was collected only for the small run and showed no odd behavior, indicating further examination of the larger run was required. As a test dataset, the visualization team collected data using the older (pre-slowdown) code on a different cluster. No performance difference was observed, indicating the behavior was machine-specific.
The Performance Analysis PI (P1) then collected the larger run data on the regression machine. He discovered the problem was due to a change at the HPX level. He suggested it would therefore not be visible in Atria. The Runtime PI (R1) hypothesized it would show up as a 10-30% increase in all primitives on average. We used Atria to compare the two versions (Fig. 6) and found R1’s hypothesis to be correct.
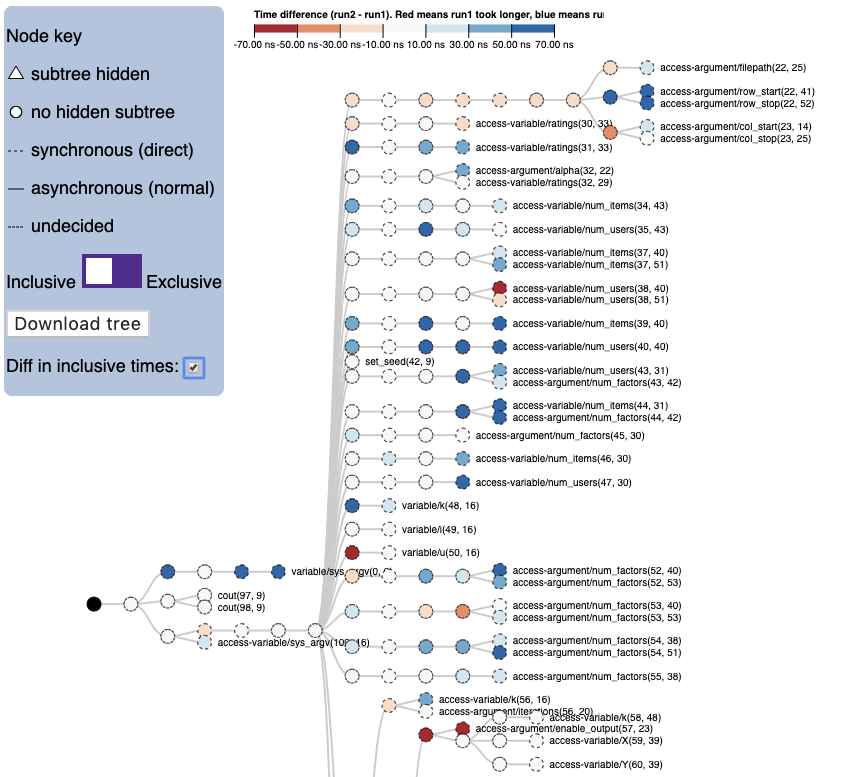
Atria did not pinpoint the source of the problem, but was used to narrow the space of possibilities and then confirm understanding of lower level effects on the application. Furthermore, the involvement of Atria motivated deeper examination of the problem and the data collection that led to discovery of the root cause which was then fixed.
7.2 Evaluation Sessions
We conducted evaluation sessions of Atria with seven members of the Runtime Team (R4–R10). R10 had no prior experience. Some had seen Atria briefly (R5, R6, R8, R9), though R8 only remembered after completing the tasks and R9 had only seen a picture. Two (R4, R7) had previous influence on design. Sessions were conducted at the participant’s workstation, with the exception of two (R6, R7) which were done in a nearby meeting area.
We began our evaluation sessions with a demonstration and feature overview using a small example. Participants could use Atria and ask questions. We then asked users to perform a series of tasks on a dataset generated from a Phylanx application with which they were not familiar. We followed up with a semi-structured interview and de-briefing.
7.2.1 Evaluation Sessions: Tasks
We asked the following evaluation tasks, each marked with its corresponding goal from Section 5. Tasks L1–L4 are for a lone run. Tasks C1–C2 are for comparative runs.
L1: Find a primitive that takes a lot of time. (G3)
How long does it take without its children? With? (G3)
L2: Find a primitive that is executed synchronously (G4)
L3: Find a primitive that is executed asynchronously (G4)
L4: Find a primitive that is repeated in the code (G1)
C1: Which run was slower? (G3),
*Why might it have been slower? (G1, G2, G3, G4)
C2: Find a primitive that changed execution mode. (G4)
Explain the change. (G4)
Five of the participants were able to complete the L1 tasks within seconds, doing a visual search for the most saturated nodes and then reading the exact numbers from the tool tip. R5 attempted to use the list view, but it wasn’t yet linked. They also required a reminder of the encoding before completion. R10 had difficulty and seemed to be still learning the visualization.
All participants were able to complete L2 within seconds. However, in L3, four the participants took tens of seconds. We believe this was because there was only one correct answer for L3 in the sample data. L4 was also completed by all participants, though two (R7, R10) asked for clarification.
In the comparison tasks, all participants answered which run took longer (C1), with many verbally reasoning about the colors. However, in two cases (R4, R5), the phrasing of the question accidentally included the follow-up hint. In finding the changed execution (C2), all participants with the exception of R8 completed the task, though two asked that the encoding be re-explained. While the other participants seemed to browse for a node, R8 flipped between the comparison and non-comparison mode, appearing to search for line style changes.
C1* was a higher level analysis task that required performance analysis background, thus we only asked it of participants who indicated they performed such analysis in their duties (R5–R7). Each pointed out highly saturated nodes of the slower run’s color as contributing to the slowness and noted in particular a store primitive was among them. R7 suggested that since the store took a lot of time, the program might be memory-intensive. R5 noted he had outside knowledge—that the store primitive had been modified recently—and concluded the data might represent the performance change due to that modification.
Throughout the tasks, we noticed a few common themes in the interaction. In most cases, participants appeared to use the encodings and interactions as intended. A few verbalized their rationale. Several participants consulted the legend in solving tasks (R6, R8, R10). Difficulties arose in discerning the line borders (R4, R10) and in evaluating the last hovered node which remained yellow (R4, R5, R7).
7.2.2 Evaluation Sessions: Interviews
We conducted semi-structured interviews with participants, asking if there were any features they found useful and what they would like the visualization do that it could not already. If participants indicated they had used the visualization before, we asked them how they used it.
Regarding utility, two participants said they didn’t know whether the features would be helpful or not (R6, R9). The remaining participants each listed several components of Atria, but there was little consensus among them. Repeated features included: access to timing data (P4, P5, P7), the linked code view (P4, P5, P8), the comparison view (P4, P5, P9), and links between dependencies (P5, P7, P8). Suggestions for improvement included differentiating primitive types (e.g., variables, functions, control-flow) (R6, R7) and more de-cluttering of the node-link tree (R6, R7).
7.2.3 Evaluation Sessions: Discussion
In general, participants performed well on the evaluation session tasks with indications that our encodings were used to complete them. Most evaluation tasks were short as they were constrained by session length, but we consider them necessary to establish basic usability and to engage participants for the interviews.
The least experienced participant, R10, struggled with several tasks. R10 had just begun learning how to code. Our goal-task lattice focused on expert analysis or communication led by an expert, which may explain these observations.
The participants who performed the high level task, hypothesizing why one run was slower, showed a combination of reasoning including identifying hot spots (G3) and relating knowledge about code (G2).
The sessions also revealed confusion in the execution mode encoding. It was a recent change to support the new undecided mode. We attempted to preserve the previous encoding of solid and dashed borders with undecided being in between to match semantics. We are now reconsidering this choice. The confusion reveals a design challenge due to the shift in what we could assume about the data and a trade off with consistency with prior encodings.
We attempted to keep the interview question regarding useful features unbiased. We first asked if there are any features that were useful, stating that no and I don’t know were helpful answers. Even still, we suspect participants were predisposed to answer positively. Though potentially biased, we were surprised by the variance in which features the participants found potentially useful.
We hypothesize this variance is due to the differing concerns of the participants. Some were starting to consider comparative performance analysis. Some were focused on development of specific Phylanx features or example applications. The two participants who answered they didn’t know are focused on developing interfaces between existing libraries and Phylanx. They are not working on the execution of the task graph itself or on applications that decompose into the graph. The other participants do but in different contexts, perhaps leading to their difference in feature preferences.
8 Reflection and Lessons Learned
We discussed earlier (Section 4.2.1) the importance of the respect the Phylanx teams have for each other and the positioning of the data collection and visualization as goals of the project as a whole. These themes carry through several of the other lessons we learned throughout the project thus far. We discuss these lessons below.
When designing for a moving target, seeking to satisfy rather than optimize is essential. Recognizing that we were managing Sedlmair et al. [58] pitfall PF-10, No Real/Important/Recurring Task, we focused strongly on satisfying needs and deploying. We took a “wait and see” approach with optimizing particular encoding choices and functionality, not wanting to expend effort on features that might not last. This mindset also helped avoid pitfall PF-20, Premature Design Commitment as we espoused the changing nature of the data and project.
Similarly, our rapid deployments often contained UI bugs. These primarily decreased usability but did not change the meaning of the data—again satisfying rather than optimizing. We believe these were accepted by our collaborators because of the nature of active development throughout the whole project. The Visualization team reported runtime bugs to the Runtime team (opening tickets on Github), so the Runtime team naturally reported bugs with the visualization.
Task analysis and long-term corpus of notes help clamp down on reactivity. The design of Atria was part anticipatory and part reactionary. Both have risks. Anticipatory design may miss the mark. Reactionary design may support too short-lived a target. By grounding ourselves in a long history, we were able to judge any major addition in the context of long-term concerns.
Jupyter notebooks impose additional design constraints, but open a wealth of interaction opportunities. Of our deployments, Jupyter has required the most design changes and we foresee more as its use increases. While the space constraints are greater, the cell-based interface could augment or change how we develop and integrate interactive visualizations for use in this data science space. Our current design depends on non-visualization cells and scrolling to match functionality with our web version. This has worked well so far, but further development of design guidelines for interactive notebook environments are needed.
Rapid changes combined with multiple deployment targets incur a maintenance burden. While multiple deployments gave us many potential users and their diverse viewpoints, they imposed a development burden on the Visualization team. Each deployment is in a separate git branch and requires some manual effort when applying changes. We plan to delve further into how we can organize our code and development practices to decrease this burden.
Both the visualization and the design study process aided our collaborators in accomplishing their goals and helped establish a culture of data review. It can be difficult to discern whether it was a particular visualization that led to an insight, or the fact that anyone was looking at the data at all, especially in studies where visualization was not already in the domain experts’ workflow.
The integration of the Visualization team and the design process made data collection and review a central priority. The dialogue between the teams and the rapid response to data exposed data collection bugs or mis-assumptions early. As seen in our regression case study (Section 7.1.2), the intervention of the design process worked in tandem with a specific analysis problem to reach a solution.
We recommend further examination of the benefits of visualization as an intervention, particularly with respect to developing best practices surrounding a culture of data review. Based on our experience, we attribute our success to the project organization from both sides. The rest of the project viewed the Visualization aspects as first class deliverables. In turn, as key members of the project, the Visualization team was also fully invested in other aspects of the project. Although this investment brings certain risks, its rewards include deep insights and impacts that are otherwise unavailable.
9 Conclusion
We presented a design study in the presence of the potential pitfalls regarding lack of data availability or task recurrence. The visualization outcome and the insights it supports have not been the only benefit to our domain collaborators. The design process itself and the integration with the visualization efforts have been beneficial, especially as an avenue for refining data collection and analysis practices. One of the goals of the collaboration is to research what data needs to be collected for asynchronous tasking runtimes. The evolution of the data has been in response to intuition gained in analysis. The process has also resulted in rapid verification of collected data and insights into current problems that we anticipate will form a strong foundation for the on-going, long-term design study.
Although we accepted some pitfalls as part of the project, several factors aided us in managing them. Project organization was a large factor—teams had respect for each others’ expertise, met regularly, valued each others’ time and deadlines, and viewed the contributions of all teams as project deliverables. The high level of participation resulted in a large corpus of design data collected both by the Visualization team and the Runtime team. This documentation was revisited frequently, both formally, through revising the task analysis, and informally, to guide design efforts, avoiding ephemeral needs. Acknowledging that the data and tasks were in flux, our technology probe, Atria, satisfied those needs while keeping the focus on learning what data and tasks supported analysis rather than finalizing a tool design.
Acknowledgements.
We thank the members of the Phylanx Team, APEX Group, and Stear groups. This work was supported by the United States Department of Defense through DTIC Contract FA8075-14-D-0002-0007 and by the National Science Foundation under NSF III-1656958.References
- [1] A. Adamoli and M. Hauswirth. Trevis: A context tree visualization & analysis framework and its use for classifying performance failure reports. In Proceedings of the 5th International Symposium on Software Visualization, SoftVis, pp. 73–82. ACM, New York, NY, USA, 2010. doi: 10 . 1145/1879211 . 1879224
- [2] D. H. Ahn, B. R. de Supinski, I. Laguna, G. L. Lee, B. Liblit, B. P. Miller, and M. Schulz. Scalable temporal order analysis for large scale debugging. In Proceedings of the Conference on High Performance Computing Networking, Storage and Analysis, SC, pp. 44:1–44:11. ACM, New York, NY, USA, 2009. doi: 10 . 1145/1654059 . 1654104
- [3] J. Annett, K. D. Duncan, R. B. Stammers, and M. J. Gray. Task analysis. Training Information Number 6. London: HMSO, 1971.
- [4] J. Annett and N. A. Stanton. Research and developments in task analysis, pp. 1–8. CRC Press, 2000.
- [5] M. Bauer, S. Treichler, E. Slaughter, and A. Aiken. Legion: Expressing Locality and Independence with Logical Regions. In Proceedings of the International Conference on High Performance Computing, Networking, Storage and Analysis, SC ’12, pp. 66:1–66:11. IEEE Computer Society Press, 2012.
- [6] A. Bergel, A. Bhatele, D. Boehme, P. Gralka, K. Griffin, M.-A. Hermanns, D. Okanović, O. Pearce, and T. Vierjahn. Visual analytics challenges in analyzing calling context trees. In A. Bhatele, D. Boehme, J. A. Levine, A. D. Malony, and M. Schulz, eds., Programming and Performance Visualization Tools, pp. 233–249. Springer International Publishing, Cham, 2019.
- [7] A. Bigelow. Reflections on Working With Fellow Tool Builders. In Proceedings of the IEEE Information Visualization Conference - Posters (InfoVis ’17), 2017.
- [8] G. Bosilca, A. Bouteiller, A. Danalis, M. Faverge, T. Herault, and J. J. Dongarra. PaRSEC: Exploiting Heterogeneity to Enhance Scalability. Computing in Science and Engg., 15(6):36–45, Nov. 2013. doi: 10 . 1109/MCSE . 2013 . 98
- [9] M. Bostock, V. Ogievetsky, and J. Heer. D3: Data-Driven Documents. IEEE Trans. on Vis. and Comp. Graphics, 17(12):2301–2309, Dec. 2011. doi: 10 . 1109/TVCG . 2011 . 185
- [10] M. Brehmer and T. Munzner. A multi-level typology of abstract visualization tasks. IEEE Trans. Visualization and Computer Graphics (TVCG) (Proc. InfoVis), 19(12):2376–2385, 2013.
- [11] S. Brinkmann, J. Gracia, and C. Niethammer. Task Debugging with Temanejo. In Tools for High Performance Computing 2012, pp. 13–21. Springer, 2013.
- [12] F. Campello, B. Pinto, G. Tessarolli, A. Oliveira, C. Oliveira, M. O. Junior, L. Murta, and V. Braganholo. A similarity-based approach to match elements across versions of XML documents. Brazilian Symposium on Databases (SBBD), p. 10, 2014.
- [13] M. Carcary. The Research Audit Trial–Enhancing Trustworthiness in Qualitative Inquiry. Electronic Journal of Business Research Methods, 7(1), 2009.
- [14] S. K. Card and D. Nation. Degree-of-interest trees: A component of an attention-reactive user interface. In AVI’02: Proceedings of the Working Conference on Advanced Visual Interfaces, pp. 231–245. ACM Press, 2002. doi: 10 . 1145/1556262 . 1556300
- [15] I. Corporation. Open Community Runtime. https://01.org/open-community-runtime, October Access March 2019.
- [16] A. Crisan, J. L. Gardy, and T. Munzner. On regulatory and organizational constraints in visualization design and evaluation. In Proc. ACM BELIV Workshop, pp. 1–9, 2016.
- [17] J. de St. Germain, J. McCorquodale, S. Parker, and C. Johnson. Uintah: A Massively Parallel Problem Solving Environment. In Ninth IEEE International Symposium on High Performance and Distributed Computing, pp. 33–41. IEEE, Piscataway, NJ, Nov. 2000.
- [18] S. Devkota and K. E. Isaacs. CFGExplorer: Designing a Visual Control Flow Analytics System around Basic Program Analysis Operations. Computer Graphics Forum (Proceedings of EuroVis 2018), 37(3), 2018. doi: 10 . 1111/cgf . 13433
- [19] J. Dokulil and J. Katreniakova. Visualization of Open Community Runtime Task Graphs. In Proceedings of the 2017 21st International Conference on Information Visualisation, IV, 2017.
- [20] P. Eklund, N. Roberts, and S. Green. OntoRama: Browsing RDF ontologies using a hyperbolic-style browser. In First International Symposium on Cyber Worlds, 2002. Proceedings., pp. 405–411, Nov. 2002. ISSN:. doi: 10 . 1109/CW . 2002 . 1180907
- [21] E. R. Gansner, E. Koutsofios, S. C. North, and K.-p. Vo. A Technique for Drawing Directed Graphs. IEEE Trans. on Soft. Eng., 19(3):214–230, 1993.
- [22] E. R. Gansner and S. C. North. An open graph visualization system and its applications to software engineering. Software – Prac. and Exp., 30(11):1203–1233, 2000.
- [23] M. Ghoniem, J.-D. Fekete, and P. Castagliola. A comparison of the readability of graphs using node-link and matrix-based representations. In Proc. IEEE Symp. on Info. Vis., pp. 17–24, 2004.
- [24] M. C. Hao, M. Hsu, U. Dayal, and A. Krug. Web-Based Visualization of Large Hierarchical Graphs Using Invisible Links in a Hyperbolic Space. In H. Arisawa and T. Catarci, eds., Advances in Visual Information Management: Visual Database Systems. IFIP TC2 WG2.6 Fifth Working Conference on Visual Database Systems May 10–12, 2000, Fukuoka, Japan, pp. 83–94. Springer US, Boston, MA, 2000. doi: 10 . 1007/978-0-387-35504-7_6
- [25] B. Haugen, S. Richmond, J. Kurzak, C. Steed, and J. Dongarra. Visualizing Execution Traces with Task Dependencies. In Proceedings of the 2nd Workshop on Visual Performance Analysis, VPA, Nov. 2015.
- [26] U. Hinrichs, S. Forlini, and B. Moynihan. Speculative Practices: Utilizing InfoVis to Explore Untapped Literary Collections. IEEE Transactions on Visualization and Computer Graphics, 22(1):429–438, Jan. 2016. doi: 10 . 1109/TVCG . 2015 . 2467452
- [27] H. Hutchinson, W. Mackay, B. Westerlund, B. B. Bederson, A. Druin, C. Plaisant, M. Beaudouin-Lafon, S. Conversy, H. Evans, H. Hansen, N. Roussel, and B. Eiderbäck. Technology Probes: Inspiring Design for and with Families. In Proceedings of the SIGCHI Conference on Human Factors in Computing Systems, CHI ’03, pp. 17–24. ACM, 2003. doi: 10 . 1145/642611 . 642616
- [28] A. Huynh, D. Thain, M. Pericas, and K. Taura. DAGViz: A DAG Visualization Tool for Analyzing Task-Parallel Program Traces. In Proceedings of the 2nd Workshop on Visual Performance Analysis, VPA, Nov. 2015.
- [29] K. E. Isaacs, A. Bhatele, J. Lifflander, D. Böhme, T. Gamblin, M. Schulz, B. Hamann, and P.-T. Bremer. Recovering Logical Structure from Charm++ Event Traces. In Proceedings of the ACM/IEEE International Conference for High Performance Computing, Networking, Storage and Analysis, SC ’15, Nov. 2015. LLNL-CONF-670046.
- [30] K. E. Isaacs and T. Gamblin. Preserving Command Line Workflow for a Package Management System using ASCII DAG Visualization. To appear in IEEE Transactions on Visualization and Computer Graphics. doi: 10 . 1109/TVCG . 2018 . 2859974
- [31] K. E. Isaacs, A. Giménez, I. Jusufi, T. Gamblin, A. Bhatele, M. Schulz, B. Hamann, and P.-T. Bremer. State of the Art of Performance Visualization. In Eurographics/IEEE Conference on Visualization State-of-the-Art Reports, EuroVis ’14, 2014.
- [32] T. J. Jankun-Kelly and K.-L. Ma. MoireGraphs: Radial Focus+Context Visualization and Interaction for Graphs with Visual Nodes. In Proceedings of the Ninth Annual IEEE Conference on Information Visualization, INFOVIS’03, pp. 59–66. IEEE Computer Society, 2003.
- [33] H. Kaiser, B. Adelstein-Lelbach, et al. HPX source code repository. 2007. Available under the Boost Software License (a BSD-style open source license).
- [34] H. Kaiser, T. Heller, B. Adelstein-Lelbach, A. Serio, and D. Fey. HPX: A Task Based Programming Model in a Global Address Space. In Proceedings of the 8th International Conference on Partitioned Global Address Space Programming Models, PGAS ’14, pp. 6:1–6:11. ACM, 2014. doi: 10 . 1145/2676870 . 2676883
- [35] L. V. Kale and S. Krishnan. CHARM++: A Portable Concurrent Object Oriented System Based on C++. In Proceedings of the Eighth Annual Conference on Object-Oriented Programming Systems, Languages, and Applications, OOPSLA ’93, pp. 91–108. ACM, 1993. doi: 10 . 1145/165854 . 165874
- [36] R. Keller, C. M. Eckert, and P. J. Clarkson. Matrices or node-link diagrams: Which visual representation is better for visualizing connectivity models? Information Visualization, 5:62–76, 2006.
- [37] T. Kluyver, B. Ragan-Kelley, F. Pérez, B. Granger, M. Bussonnier, J. Frederic, K. Kelley, J. Hamrick, J. Grout, S. Corlay, P. Ivanov, D. Avila, S. Abdalla, and C. Willing. Jupyter Notebooks – a publishing format for reproducible computational workflows. In F. Loizides and B. Schmidt, eds., Positioning and Power in Academic Publishing: Players, Agents and Agendas, pp. 87–90. IOS Press, 2016.
- [38] A. Knüpfer, C. Rössel, D. an Mey, S. Biersdorff, K. Diethelm, D. Eschweiler, M. Geimer, M. Gerndt, D. Lorenz, A. Malony, et al. Score-P: A joint performance measurement run-time infrastructure for Periscope, Scalasca, TAU, and Vampir. In Tools for High Performance Computing 2011, pp. 79–91. Springer, 2012.
- [39] H. Lam, M. Tory, and T. Munzner. Bridging From Goals to Tasks with Design Study Analysis Reports. IEEE Transactions on Visualization and Computer Graphics, 2017. doi: 10 . 1109/TVCG . 2017 . 2744319
- [40] J. Lamping, R. Rao, and P. Pirolli. A focus+context technique based on hyperbolic geometry for visualizing large hierarchies. In I. R. Katz, R. Mack, L. Marks, M. B. Rosson, and J. Nielsen, eds., CHI’95: Proceedings of the SIGCHI Conference on Human Factors in Computing Systems, pp. 401–408. ACM Press/Addison-Wesley Publishing Co., 1995. doi: 10 . 1145/223904 . 223956
- [41] B. Lee, C. Plaisant, C. S. Parr, J.-D. Fekete, and N. Henry. Task Taxonomy for Graph Visualization. In Proceedings of the 2006 AVI BELIV Workshop, BELIV ’06, pp. 1–5. ACM, 2006. doi: 10 . 1145/1168149 . 1168168
- [42] S. Lin, F. Taïani, T. C. Ormerod, and L. J. Ball. Towards anomaly comprehension: Using structural compression to navigate profiling call-trees. In Proceedings of the 5th International Symposium on Software Visualization, SOFTVIS, pp. 103–112. ACM, New York, NY, USA, 2010. doi: 10 . 1145/1879211 . 1879228
- [43] N. McCurdy, J. Dykes, and M. Meyer. Action Design Research and Visualization Design. In Proceedings of the Sixth Workshop on Beyond Time and Errors on Novel Evaluation Methods for Visualization, BELIV ’16, pp. 10–18. ACM, 2016. doi: 10 . 1145/2993901 . 2993916
- [44] S. McKenna. The Design Activity Framework: Investigating the Data Visualization Design Process. PhD thesis, University of Utah, June 2017.
- [45] M. Meyer and J. Dykes. Reflection on Reflection in Applied Visualization Research. IEEE Computer Graphics and Applications, 38(6):9–16, 2018. doi: 10 . 1109/MCG . 2018 . 2874523
- [46] T. Munzner, F. Guimbretiére, S. Tasiran, L. Zhang, and Y. Zhou. TreeJuxtaposer: Scalable tree comparison using Focus+Context with guaranteed visibility. ACM Transactions on Graphics, 22(3):453–462, 2003. doi: 10 . 1145/882262 . 882291
- [47] H. T. Nguyen, L. Wei, A. Bhatele, T. Gamblin, D. Boehme, M. Schulz, K.-L. Ma, and P.-T. Bremer. VIPACT: a visualization interface for analyzing calling context trees. In Proceedings of the Third International Workshop on Visual Performance Analysis, VPA, pp. 25–28, 2016. doi: 10 . 1109/VPA . 2016 . 9
- [48] C. Nobre, N. Gehlenborg, H. Coon, and A. Lex. Lineage: Visualizing Multivariate Clinical Data in Genealogy Graphs. IEEE Transactions on Visualization and Computer Graphics, 25(3):1543–1558, 2019. doi: 10 . 1109/TVCG . 2018 . 2811488
- [49] C. Nobre, M. Meyer, M. Streit, and A. Lex. The State of the Art in Visualizing Multivariate Networks. Computer Graphics Forum (Proceedings of EuroVis 2019), p. To appear, 2019.
- [50] C. Nobre, M. Streit, and A. Lex. Juniper: A Tree+Table Approach to Multivariate Graph Visualization. IEEE Transactions on Visualization and Computer Graphics (InfoVis ’18), 25(1):544–554, Jan. 2019. doi: 10 . 1109/TVCG . 2018 . 2865149
- [51] V. G. Pinto, L. Stanisic, A. Legrand, L. M. Schnorr, S. Thibault, and V. Danjean. Analyzing Dynamic Task-Based Applications on Hybrid Platforms: An Agile Scripting Approach. In Proceedings of the Third International Workshop on Visual Performance Analysis, VPA, 2016.
- [52] C. Plaisant, J. Grosjean, and B. B. Bederson. SpaceTree: Supporting Exploration in Large Node Link Tree, Design Evolution and Empirical Evaluation. In Proceedings of the IEEE Symposium on Information Visualization (InfoVis’02), INFOVIS ’02, pp. 57–. IEEE Computer Society, 2002.
- [53] E. M. Reingold and J. S. Tilford. Tidier Drawings of Trees. IEEE Trans. Softw. Eng., 7(2):223–228, Mar. 1981. doi: 10 . 1109/TSE . 1981 . 234519
- [54] N. Reissmann, M. Jahre, and A. Muddukrishna. Towards Aggregated Grain Graphs. In Proceedings of the Fourth International Workshop on Visual Performance Analysis, VPA, Nov. 2017.
- [55] A. Rind, W. Aigner, M. Wagner, S. Miksch, and T. Lammarsch. Task cube: A three-dimensional conceptual space of user tasks in visualization design and evaluation. Information Visualization, 15(4):288–300, 2016. doi: 10 . 1177/1473871615621602
- [56] P. Salmon, D. Jenkins, N. Stanton, and G. Walker. Hierarchical task analysis vs. cognitive work analysis: comparison of theory, methodology and contribution to system design. Theoretical Issues in Ergonomics Science, 11(6):504–531, 2010. doi: 10 . 1080/14639220903165169
- [57] H. Schulz. Treevis.net: A Tree Visualization Reference. IEEE Computer Graphics and Applications, 31(6):11–15, Nov. 2011. doi: 10 . 1109/MCG . 2011 . 103
- [58] M. Sedlmair, M. Meyer, and T. Munzner. Design Study Methodology: Reflections from the Trenches and the Stacks. IEEE Transactions on Visualization and Computer Graphics, 18(12):2431–2440, 2012.
- [59] S. Shende and A. Malony. The TAU Parallel Performance System. IJHPCA, 20(2, Summer):287–311, 2006. ACTS Collection Special Issue.
- [60] R. Tohid, B. Wagle, S. Shirzad, P. Diehl, A. Serio, A. Kheirkhahan, P. Amini, K. Williams, K. Isaacs, K. Huck, S. Brandt, and H. Kaiser. Asynchronous Execution of Python Code on Task Based Runtime Systems. In Proceedings of the Fourth International IEEE Workshop on Extreme Scale Programming Models and Middleware, Nov. 2018.
- [61] C. Tominski, J. Abello, F. van Ham, and H. Schumann. Fisheye Tree Views and Lenses for Graph Visualization. In E. Banissi, R. A. Burkhard, A. Ursyn, J. J. Zhang, M. Bannatyne, C. Maple, A. J. Cowell, G. Y. Tian, and M. Hou, eds., IV’06: Proceedings of the International Conference on Information Visualisation, pp. 17–24. IEEE Computer Society, 2006. doi: 10 . 1109/IV . 2006 . 54
- [62] B. Wagle, M. A. H. Monil, K. Huck, A. D. Malony, A. Serio, and H. Kaiser. Runtime Adaptive Task Inlining on Asynchronous Multitasking Runtime Systems. 48th International Conference on Parallel Processing (ICPP 2019), Aug. 2019. doi: 10 . 1145/3337821 . 3337915
- [63] J. Wood, R. Beecham, and J. Dykes. Moving beyond Sequential Design: Reflections on a Rich Multi-Channel Approach to Data Visualization. IEEE Transactions on Visualization and Computer Graphics, 20(12):2171–2180, Dec. 2014. doi: 10 . 1109/TVCG . 2014 . 2346323
- [64] Y. Zhang, K. Chanana, and C. Dunne. Idmvis: Temporal event sequence visualization for type 1 diabetes treatment decision support. IEEE Transactions on Visualization and Computer Graphics, 25(1):512–522, Jan 2019. doi: 10 . 1109/TVCG . 2018 . 2865076