Vol.0 (20xx) No.0, 000–000
22institutetext: Institute for Astronomy and History of Science and Technology, Dali University, Dali 671003,China; wen@mail.ustc.edu.cn
\vs\noReceived 20xx month day; accepted 20xx month day
The abundance of massive compact galaxies at in 3D-HST/CANDELS ∗ 00footnotetext: Supported by the National Natural Science Foundation of China.
Abstract
Based on a large sample of massive () compact galaxies at in five 3D-HST/CANDELS fields, we quantify the fractional abundance and comoving number density of massive compact galaxies as a function of redshift. The samples of compact quiescent galaxies (cQGs) and compact star-forming galaxies (cSFGs) are constructed by various selection criteria of compact galaxies in literatures, and the effect of compactness definition on abundance estimate is proved to be remarkable, particularly for the cQGs and cSFGs at high redshifts. Regardless of the compactness criteria adopted, their overall redshift evolutions of fractional abundance and number density are found to be rather similar. Large samples of the cQGs exhibit a sustaining increase in number density from to 2 and a plateau at . For massive cSFGs, a plateau in the number density at can be found, as well as a continuous drop from to 1. The evolutionary trends of the cQG and cSFG abundances support the scenario that the cSFGs at may have been rapidly quenched into quiescent phase via violent dissipational processes such as major merger and disk instabilities. Rarity of the cSFGs at lower redshifts () can be interpreted by the decrease of gas reservoirs in dark matter halos and the consequent low efficiency of gas-rich dissipation.
keywords:
galaxies: high-redshift-galaxies: massive-compact-galaxies: evolution-galaxies1 Introduction
It has been widely appreciated that there is a bimodality of galaxy populations, i.e., blue star-forming galaxies (SFGs) vs. red quiescent galaxies (QGs), since the universe was only 2.5 Gyr old (Strateva et al. 2001; Kauffmann et al. 2003a, b; Baldry et al. 2004; Blanton & Moustakas 2009; Brammer et al. 2011; Whitaker et al. 2011, 2012; Huertas-Companyal et al. 2015). It is believed that there should be an evolutionary connection between the two populations. A picture of star formation quenching has been proposed that the SFGs would truncate their star formation activities and transform into a quiescent status (Blanton et al. 2003; Brinchmann et al. 2004; Kauffmann et al. 2004; Faber et al. 2007; Peng et al. 2010; Fang et al. 2012; Barro et al. 2013, 2014; Gu et al. 2018a). A lot of large surveys (such as the SDSS, NMBS, UltraVISTA, zFOURGE, and CANDELS) have provided the probability to study the physical processes and mechanisms relevant to star formation quenching over a wide span of cosmic time.
Observational link between quenching and structure properties has caught more and more attention. In general, the SFGs are found to have an extended structure, with larger non circularized effective radii () than the QGs (e.g, Williams et al. 2009; Fang et al. 2012; van der Wel et al. 2012; Whitaker et al. 2012; Cassata et al. 2013; van der Wel et al. 2014; Huertas-Companyal et al. 2015). The quiescent galaxies in the early epoch are three to five times more compact than their local counterparts (Newman et al. 2010; Bruce et al. 2012; Ryan et al. 2012; Cassata et al. 2013). Moveover, van der Wel et al. (2014) report that early-type galaxies (ETGs) at the fixed stellar mass follow a faster size evolution, , while late-type galaxies (LTGs) follow a slower evolution of size, . Compact quiescent galaxies (cQGs, also called “red nuggets”) are found to be ubiquitous at (Damjanov et al. 2009). A similar population of compact star-forming galaxies (cSFGs, also called“blue nugget”) is confirmed to be presence at high redshifts (Barro et al. 2013, 2014; Fang et al. 2015; van Dokkum et al. 2015). However, in the local universe, massive compact galaxies are quite rare with the number density in the order of magnitude (Trujillo et al. 2009; Taylor et al. 2010; Trujillo et al. 2014; Graham et al. 2015; Saulder et al. 2015; Buitrago et al. 2018) but prefer to be found in galaxy clusters (Valentinuzzi et al. 2010a; Poggianti et al. 2013a, b; Peralta de Arriba et al. 2016).
It remains unsolved why the abundances of compact galaxies are discrepant at different redshifts and how these massive compact galaxies form and evolve. Some mechanisms are proposed to explain the formation and evolution of these compact galaxies. Star-forming galaxies with extended structures (called extended SFGs, eSFGs for short) are believed to be the progenitors of massive compact galaxies (Barro et al. 2013, 2014; Fang et al. 2015; van Dokkum et al. 2015). It suggests that the cSFGs are formed from the eSFGs by shrinking their sizes via the violent gas-rich dissipational processes (Dakel et al. 2013; Dakel & Burkert 2014; Zolotov et al. 2015). On account of the high luminosities of star formation or active galactic nucleus (AGN) activities triggered by gas-rich dissipational processes, the cSFGs would consume their cools gas rapidly, and evolve to the cQGs soon (Barro et al. 2013; Fang et al. 2015; Tadaki et al. 2015). Furthermore, these cQGs could evolve to the local massive quiescent galaxies or extend quiescent galaxies (eQGs) through minor mergers later (Hopkins et al. 2010; de la Rosa et al. 2016). All in all, the majority of these massive compact galaxies at end up in the central dense cores of the local galaxies (van Dokkum et al. 2014; Belli et al. 2014a).
Although the compact galaxy population covering a wide range of redshift has been studied by many investigators (e.g, : Trujillo et al. 2009, 2014; Saulder et al. 2015; Zahid et al. 2015; Charbonnier et al. 2017; : Barro et al. 2014; Cassata et al. 2013; Fang et al. 2015; van der Wel et al. 2014; van Dokkum et al. 2015), the statistical results of massive compact galaxies are rather diverse, which is mainly due to different observational data and different strategies in selection of compact galaxies. For example, Charbonnier et al. (2017) and Damjanov et al. (2019) applied same criteria of compact galaxies to the CFHT Stripe 82 (CS82) survey and the Subaru Hyper Suprime-Cam (HSC) high-resolution imaging survey, respectively. Their cosmic evolution of cQG number densities since is different from each other. Even with the same data, the statistics of massive compact galaxies (i.e., cQGs and cSFGs) will be severely biased when we adopt different thresholds of stellar mass, effective radius, and compactness in sampling. For instance, abundance of the cSFGs in the CANDELS fields at higher redshifts () has been estimated by Barro et al. (2014) and Fang et al. (2015) with different compactness criteria, and their results are different.
To untangle the effect of different compactness criteria, it is necessary to make a comprehensive comparison for the samples of cSFGs and cQGs at higher redshifts that are selected with different criteria. In this paper we will form a large sample of massive galaxies at in the five deep fields of the 3D-HST/ CANDELS programs (Grogin et al. 2011; Koekemoer et al. 2011; Skelton et al. 2014). All massive galaxies are separated into quiescent and star-forming populations using the rest-frame UVJ diagram (Williams et al. 2009). Then, eight different criteria of compact galaxies in the literatures (Carollo et al. 2013; Quilis & Trujillo 2013; Barro et al. 2014; van der Wel et al. 2014; Fang et al. 2015; van Dokkum et al. 2015) will be adopted to construct the samples of cQGs and cSFGs. For these various samples of cSFGs and cQGs, their fractional abundances and number densities can be computed, as a function of redshift. A detailed comparison between these results can tell us how the different criteria affect the conclusions about fractional abundance and number density of cQGs and cSFGs.
The paper is organized as follows. We give an overview of the 3D-HST/CANDELS data set and a description of our sample selection in Section 2, including various criteria of compact galaxies. In Section 3, we present the evolution of the fraction and number density of massive compact galaxies, and further discuss the evolutionary connection between cSFGs and cQGs. Finally, we give a summary in Section 4. Throughout the paper, we assume the cosmology model with , , and .
2 Data and Sample Selection
2.1 Data Description
On the basis of the high-quality WFC3 and ACS spectroscopy and multi-wavelength photometry in the five 3D-HST/CANDELS fields (i.e., AEGIS, COSMOS, GOODS-N, GOODS-S, and UDS) (Grogin et al. 2011; Koekemoer et al. 2011; Skelton et al. 2014), we set about selecting a large sample of massive galaxies. The data base is from the CANDELS and 3D-HST Treasury programs include the WFC3 F125W, F140W, F160W images (Skelton et al. 2014), which are observed with many other space- and ground-based telescopes. Total area of the five fragmented deep fields is 900 , which can mitigate the influence of cosmic variance to a certain extent.
The photometric redshifts and the rest-frame UVJ colors are derived by Skelton et al. (2014) with the EAZY code (Brammer et al. 2008). The derived photometric redshifts for the five CANDELS fields have higher precision, and their normalized median absolute deviations (), defined as , are within a range from 0.007 (COSMOS) to 0.026 (GOODS-N) (Skelton et al. 2014). In this paper, we preferentially adopt the spectroscopic redshifts () if available. The stellar masses are derived by Skelton et al. (2014), who fit the spectra energy distribution (SED) using the FAST code (Kriek et al. 2009) based on the Bruzual & Charlot (2003) stellar population synthesis (SPS) models with the Chabrier (2003) initial mass function (IMF) and solar metallicity. Additionally, van der Wel et al. (2012) have estimated the non circularized effective radius and axis ratio by using the GALFIT code (Peng et al. 2002). We adopt the GALFIT results of J band (F125W) images for the galaxies at , and H band (F160W) results for the galaxies at , for ensuring the structural feature observed with the same optical band in the rest frame. The axis ratio can be taken to calculate the non circularized effective radius, a key parameter in some definitions of compactness (see Section 2.3).
2.2 Sample of Massive QGs and SFGs
Firstly, based on the multiwavelength photometric data in five 3D-HST/CANDELS fields, we select a large sample of 7767 massive galaxies () with good photometry qualities (i.e., use_phot=1) and good morphological fits with GALFIT (i.e., GALFIT flag or) at to ensure high sample completeness and robust structural measurements.
The completeness above the mass threshold is around up to the highest redshift (Grogin et al. 2011; Wuyts et al. 2011; Newman et al. 2012; Barro et al. 2013; Pandya et al. 2017).
Figure 1 shows the scatter plot and the histograms of stellar mass and redshift.
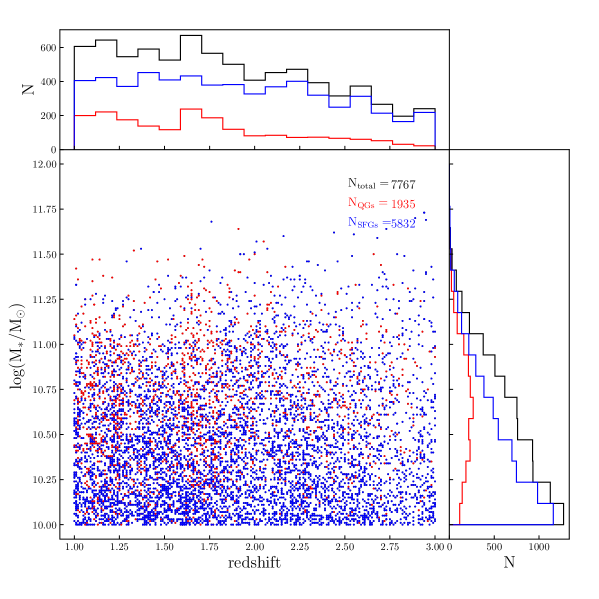
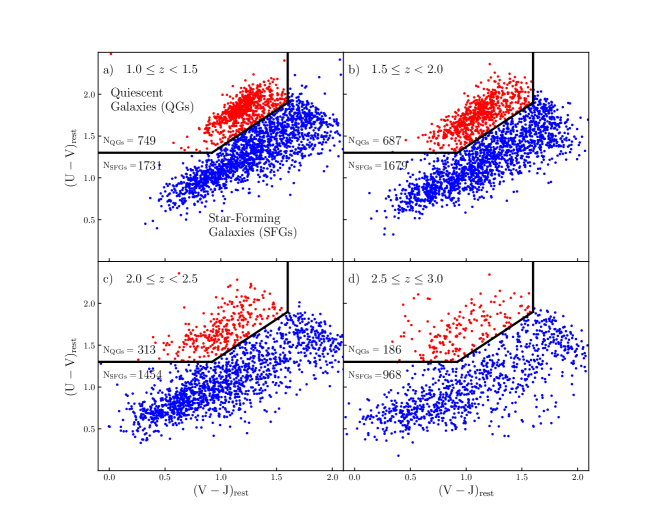
In order to investigate the evolution of number density of cSFGs and cQGs respectively, we divide our sample into quiescent and star-forming galaxies by using the rest-frame UVJ diagram. Many previous works have suggested that the UVJ diagram can distinguish the QGs from the dusty SFGs, even at higher redshifts (Wuyts et al. 2007; Williams et al. 2009; Brammer et al. 2011; Whitaker et al. 2011, 2012; Muzzin et al. 2013; van der Wel et al. 2014; Huertas-Companyal et al. 2015). The criteria of selecting QGs are shown below (Williams et al. 2009):
| (1) |
| (2) |
| (3) |
In Figure 2, the rest-frame UVJ diagrams (i.e., vs. ) are exhibited for four redshift bins with an interval of . As a result, 5832 SFGs and 1935 QGs with at are picked up for subsequent selection of compact galaxies.
2.3 Compactness Criteria
In recent literatures, final results about the abundance of compact galaxies depend heavily on the definition of compactness. There are many versions of compactness criteria which are dramatically different. One of our objectives is to untangle the effect of different compactness criteria on the abundance of massive compact galaxies. Various criteria of compact galaxies are addressed in this subsection.
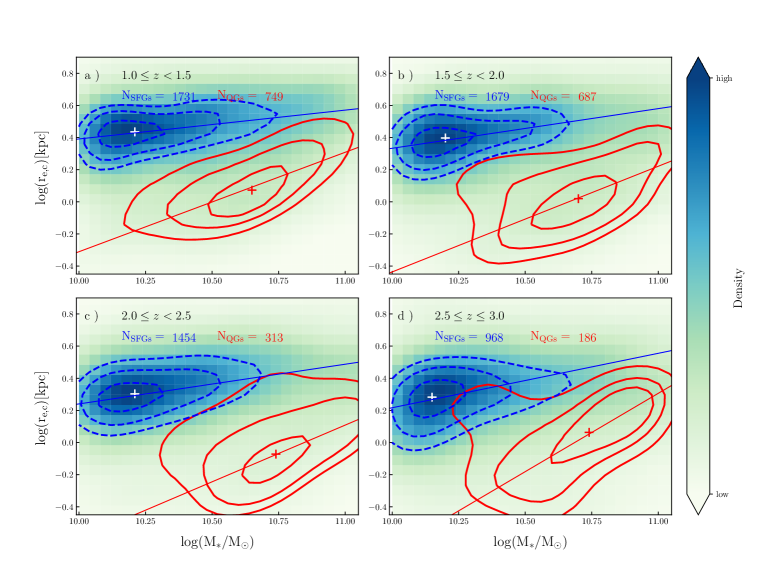
It is necessary to describe the structural parameters adopted in the definition of compactness. For quantifying the size of galaxies, the non circularized effective radius , defined as the semi-major axis in arcsec of the ellipse that contains half of the total light, can be estimated with the fitting with the Sérsic model (van der Wel et al. 2012). The circularized effective radius, , can be derived by following formula:
| (4) |
where means the axis ratio, i.e., . Both and are in units of kpc in this paper. The size-mass relations for our sample of massive galaxies in four redshift bins are presented in Figure 3. In general, the SFGs have lager sizes than the QGs in all redshift bins. Linear fittings are performed for massive SFGs and QGs, respectively. For both QGs and SFGs, their sizes tend to become larger over cosmic time (i.e., from high to low redshifts). Similar results have been shown in recent works (Daddi et al. 2005; Whitaker et al. 2012; Huertas-Companyal et al. 2015; Gu et al. 2018a; Damjanov et al. 2019). Compared with the SFGs, massive QGs at are found to have smaller sizes that are more dependent on the stellar mass. The slopes of the size-mass relation for early-type quiescent population are steeper than those for SFGs, which is in good agreement with van der Wel et al. (2014).
The Gini coefficient, as a nonparametric measuremnt, has been taken to exclude some cSFGs with visually extended structures by Fang et al. (2015). As described in Abraham et al. (2003) and Lotz et al. (2004), the Gini coeffiicent is defined to quantify the relative distribution of the pixel fluxes:
| (5) |
where is the pixel flux value sorted in ascending order, is the mean pixel flux, and is the total number of pixels belonging to a galaxy. The Gini coefficient can be regarded as a generalized measure of concentration. Moreover, it is able to describe the arbitrary shape of the galaxy without requiring a single well-defined nucleus (i.e, multiple cores). In this work, the Gini coefficients are measured by the developed version of Morpheus software (Abraham et al. 2007).
We collect all specific definitions of compact galaxies adopted in recent works. These definitions take different lower limits of stellar mass and different size cuts. The specific compactness criteria are listed in Table 1, as well as the number counts of our cQG and cSFG samples at for each compactness definition.
| No. | Mass | Compactness | Number | Number | Abbreviationsa |
|---|---|---|---|---|---|
| limit | criteria | of cQGs | of cSFGs | ||
| 1 | the “most” compact | C13 most | |||
| 2 | the “less” compact | C13 less | |||
| 3 | QT13 | ||||
| 4 | B14 | ||||
| 5 | the “most” compact | vdW14 most | |||
| 6 | the “less” compact | vdW14 less | |||
| 7 | and | F15 | |||
| 8 | vD15 |
-
The different criteria are expressed in abbreviations.( C13: Carollo et al. 2013; QT13: Quilis & Trujillo 2013; B14: Barro et al. 2014; vdW14: van der Wel et al. 2014; F15: Fang et al. 2015; vD15: van Dokkum et al. 2015). The ’most’ and ’less’ represent the most and less compact criteria as it applies.
-
The is a pseudo-stellar mass surface density, defined as (Barro et al. 2013).
3 The Abundance of massive compact galaxies
3.1 The Fractional Abundance
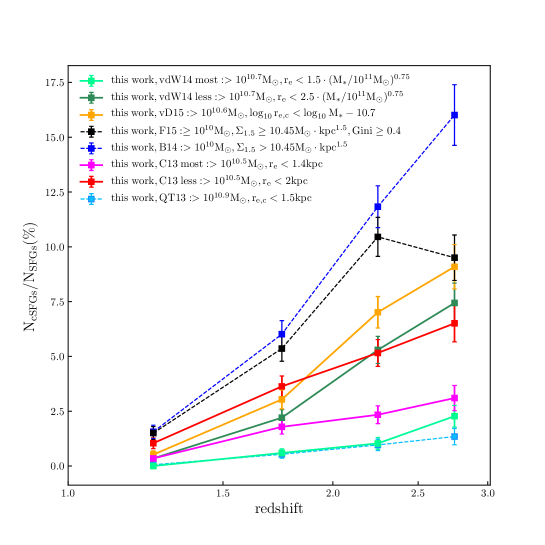
To show the effect of compactness definition on the cQG and cSFG abundance at high redshifts, we adopt eight different definitions of compact galaxies (see Table 1) to select the cQGs and cSFGs at in the 3D-HST/CANDELS fields. Fractional abundance of the cQGs (cSFGs) is defined as the ratio of the number of cQGs (cSFGs) to total number of QGs (SFGs).
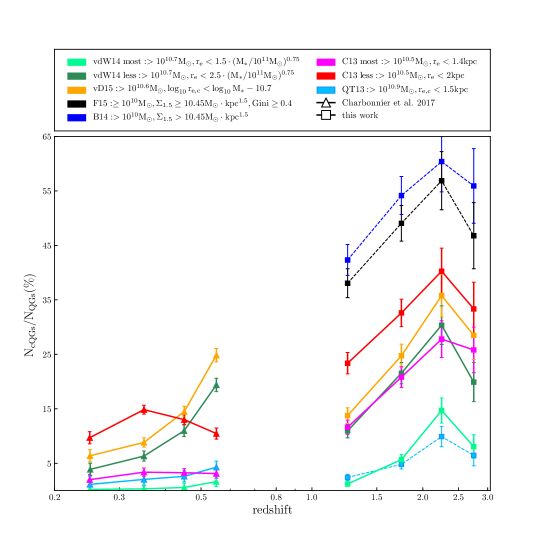
Compared with Charbonnier et al. (2017) and Damjanov et al. (2019), we adopt more criteria to select compact galaxies from massive QGs and SFGs, and the corresponding counts of cQGs and cSFGs are given in Table 1. Figure 4 shows the fractional abundances of eight cQG samples at high redshifts which are selected by different compactness criteria. Except for the compactness definition (QT13: dodgerblue lines) by Quilis & Trujillo (2013), it is found that the cQG fractions in the QG samples tend to increase with redshift at , then decrease rapidly at . Although the different compactness criteria are adopted, overall variations of the cQG fraction with redshift are similar.
In order to observe the cosmic evolution of the cQG fraction from to 0.2, the fractional abundances at which were derived by Charbonnier et al. (2017) are also presented in the same diagram. Compared with results from above two works, in which the used criteria are from Carollo et al. (2013) (C13 most: magenta lines and C13 less: red lines), the fractional abundances of the cQGs tend to be fewer from 1.0 to 0.6. The cQG fraction seems to increase when the sizes of compact galaxies are related to stellar masses (vdW14 less and most; vD15). By comparing the evolutionary trends between low and high redshifts, the influence by different compactness criteria on the cQG fraction can not be ignored over the blank range of redshift. Furthermore, for the criteria (QT13: dodgerblue lines) in Quilis & Trujillo (2013), the cQG fractions at low and high redshifts are rather small because of the strict selection of compact galaxies (i.e., the highest mass threshold of and a small upper limit of circularized effective radius ). It should be mentioned that the diversity of the cQG fraction due to different criteria adopted is found to be larger at (even up to ) than that at (Charbonnier et al. 2017). However, the overall redshift evolution of cQG fraction at are similar.
Compared with cQG fraction, the situation of redshift evolution of cSFG fractions is rather different, as shown in Figure 5. A simple rising trends along redshift can be found for cSFG fractional abundances at , except for the criterion (F15: black dashed line) from Fang et al. (2015). The trend is broken down at in Fang et al. (2015) when the Gini coefficient is adopted to get rid of some cSFGs with extended structure at high redshifts. The rising slopes in the diagram of fractional abundance vs. redshift are dependent upon the criteria of compactness.
Regardless of difference in compactness definition, the fractional abundance of cSFGs are found to be much higher at high redshifts () than that at lower redshifts (). According to some predictions by simulation, cSFGs are formed by gas-rich, dissipational processes, such as cold accretion from the IGM via violent disk instability (Dakel et al. 2009a, b), cold mode accretion (Birnboim & Dekel 2008; Johansson et al. 2012) and major mergers (Hopkins et al. 2009a, 2010; Wuyts et al. 2010). Star formation in the cSFGs is subsequently quenched by some feedbacks such as AGN feedback (Barro et al. 2013, 2014; Kocevski et al. 2017) and stellar winds driven by intense starbursts (Tremonti et al. 2007; Heckman et al. 2011). Kocevski et al. (2017) find that of massive cSFGs host an X-ray detected AGN, which is higher than the incidence of AGN in eSFGs, indicating that AGN feedback helps to decline in the number density of cSFGs. Therefore, these feedback mechanisms imprint evidence that extremely rare cSFGs are found at lower redshifts (Trujillo et al. 2009; Taylor et al. 2010; Barro et al. 2013; Trujillo et al. 2014). And compactness can be treated as a very sensitive predictor of passivity among massive galaxies, particularly at higher reshifts (Bell et al. 2012; Williams et al. 2014).
By synthesizing the cosmic evolution of fractional abundances of cQGs and cSFGs, the connection between cQGs and cSFGs can be discussed. If we adopt a simple evolutionary model (Barro et al. 2013) (see Section 3.2 and Figure 8), it can be found that the lifetimes of the cSFGs at high redshift selected by different compactness criteria are less than 0.8 Gyr, which are in agreement with Barro et al. (2013, 2014) and van Dokkum et al. (2015). Based on the number densities of green valley galaxies and quiescent galaxies at in the fields of CANDELS, Gu et al. (2018b) estimated the upper limit of the average transition/quenching time-scale as a function of redshift, and the average quenching time-scale at is less than 0.35 Gyr. The fractional abundance for the cQGs peaks at , which can be construed by the assumption that a certain percentage of the cSFGs at may have been quenched into the cQGs via rapid violent dissipational process (Barro et al. 2013; Fang et al. 2015; Williams et al. 2015). The average quenching time-scale become longer than 1.3 Gyr since , and the accumulative effects from the above-mentioned feedback mechanisms and minor mergers during longer passive evolution may result in a looser stellar distribution in the massive QGs (Gu et al. 2018b). This picture may help us to understand the declining trend in the cQG fractional abundance since .
3.2 Number Density Evolution
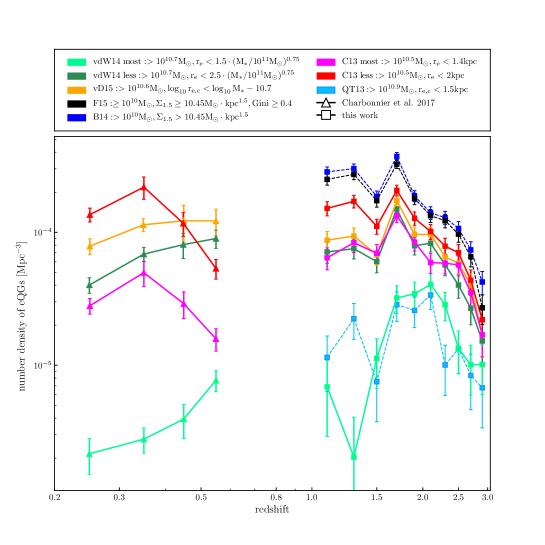
It has been widely appreciated that massive cSFGs will rapidly quench into the cQGs at high redshifts (Barro et al. 2013; Fang et al. 2015; van Dokkum et al. 2015). However, the opposite path of evolution that the cQGs begin their star formation activities via accreting new gas has also be proposed (so-called “rejuvenation”) (Graham et al. 2015; Zolotov et al. 2015). For investigating the evolution of massive compact galaxies at high redshifts, we further quantify the comoving number densities of the cQGs and cSFGs within a small interval of . The number density can be determined by dividing the number of massive compact galaxies by its comoving volume within the redshift interval. The correction to number density is not adopted in our work due to the high completeness at high redshift (see Section 2.2). On the opposite, if we follow the method adopted by Charbonnier et al. (2017), the real results will be blurred at higher redshit in terms of more obvious disadvantage of double Schechter function at the low mass end (Ilbert et al. 2013).
Figure 6 presents the number densities of the cQGs in five 3D-HST/CANDELS fields at , as well as the results compiled from the CS82 data at by Charbonnier et al. (2017), which are uncorrected by completeness factors. Except for two cQG samples (vdW14 most: springgreen and QT13: dodgerblue lines) selected with a higher mass threshold () and a small upper limit of size, the remaining six samples include at least 300 cQGs, and their number densities are more reliable statistically. For these large samples of the cQGs at , their redshift evolutions of the cQG number densities are quite similar, exhibiting a sustaining increase from to 2 and a maximum density at . This trend is consistent with the results in previous works (Cassata et al. 2011, 2013; Barro et al. 2013; van der Wel et al. 2014; van Dokkum et al. 2014, 2015). For the cQGs at , the cQG number density tend to be constant, with a typical number density of .
Compared to the cQG number densities by Charbonnier et al. (2017), we find that the number density of the less compact samples of van der Wel et al. (2014) and Carollo et al. (2013) are average 0.4 and 0.2 dex higher than their number density under most compactness criterion at , which are smaller than the deviation values of number density between less and most compact criterion from compiled Charbonnier et al. (2017). From the Figure 6, the difference of number density between less and most compact definition (e.g., vdW14 less and most) is obviously getting bigger with decreasing redshift (), which is likely due to the decrease of number of massive compact galaxies satisfied criteria with higher mass threshold. The bigger error bars with decreasing redsift may reflect more obvious influence of cosmic variance on lower redshift . Moreover, if we take a lower mass threshold (i.e., , Carollo et al. 2013), a declining trend over cosmic time within the blank redshift range (i.e., from to ) can be inferred, which is in agreement with Barro et al. (2013), van der Wel et al. (2014), van Dokkum et al. (2015) and Cassata et al. (2013) (for ultra-compact ETGs). However, for the other cQG definitions with higher mass thresholds (i.e.,, van der Wel et al. 2014; van Dokkum et al. 2015), a constant number densities can be expected at , which is consistent with Cassata et al. (2013) (for compact ETGs) and Gargiulo et al. (2016) (for ultramassive dense ETGs). Moderate decrease of the cQG number density since can be interpreted with the early-track described in Barro et al. (2013), where some cQGs transform into extended quiescent galaxies through minor merger as well mentioned by Gargiulo et al. (2016). Naab et al. (2009) have performed hydrodynamic cosmological simulations of the formation of massive galaxies to prove that minior merger may be the main driver for the evolution in sizes and densities of massive early-type galaxies, which is in agreement with Oser et al. (2012) where dry minior mergers come to be predominant since instead major mergers alone. The rarity of cSFGs since (see Figure 7) results in a very low consequent birth rate of the cQGs at lower redshifts.
The redshift evolution of cSFG number density is also presented in the Figure 7. Regardless of various cSFG selection criteria, the redshift evolution of the cSFG number density are very similar: keeping a constant number density at and a continuous declining from to 1. Our results are consistent with those in Barro et al. (2013) and van Dokkum et al. (2015). When taking the definition from Fang et al. (2015), a significant drum at can be found in Figure 7. Owing to taking Gini coefficient into consideration, a substantial fraction the cSFGs at with clear extended structures may have been excluded by this strict criterion (see Figure 5 in Fang et al. 2015).
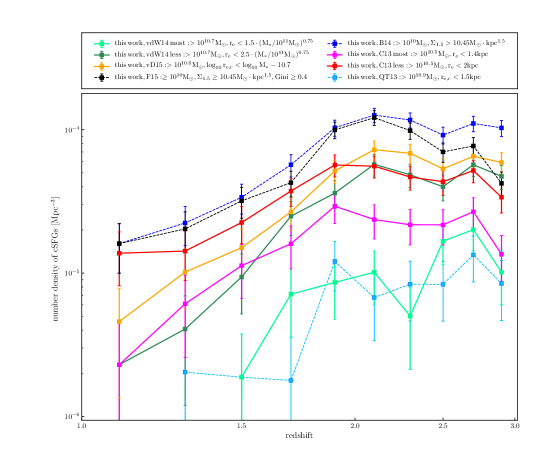
It’s worth considering whether the compact galaxy number density is sensitive to the stellar mass threshold (e.g., QT13: mass limit ). Damjanov et al. (2015) find that the compactness threshold or the stellar mass range has no significant impact on the compact galaxy number density over the redshift range . To check whether the mass limits have an influence on abundance of compact galaxies at higher redshifts (), two extreme cases of mass thresholds ( and ) are adopted in all compactness definitions. It is found that all evolutionary trends of compact galaxies (cQGs in Figure 4, 6 and cSFGs in Figure 5, 7 ) are not sensitive to the mass thresholds. Certainly, a higher mass threshold and a strict compactness criterion will lead to few number of compact galaxies selected.
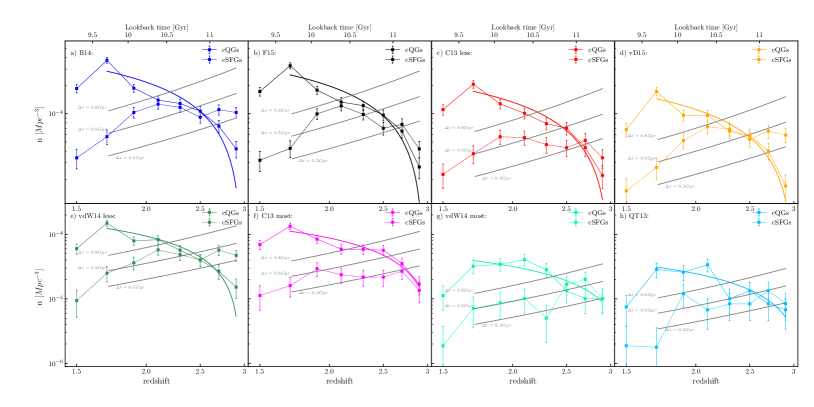
The evolutionary scenario between cQGs and cSFGs can be speculated based on both the redshift evolutions of number density. Figure 8 presents the difference in the number density evolution between the cQGs and cSFGs at . If we adopt a simple evolutionary model proposed by Barro et al. (2013) that all cSFGs will become quiescent after experiencing a short starburst phase, a crude explanation can be derived for the discrepancy of number density between cQGs and cSFGs. A plateau in the cSFG number density at can be explained by the balance of the birth rate of new cSFGs via rapid gas-rich dissipational process (such as major merger and disk instabilities) and the quenching rate of the cSFGs. The quenching of the cSFGs at will surely lead to a strong increasing in the number density of the cQGs from to 1.7. As shown in Figure 8, it is found that the corresponding lifetimes of cSFGs are approximately Gyr. Barro et al. (2013) and van Dokkum et al. (2015) compared the redshift evolution between the cSFGs and cQGs as well, and estimated the time-scale of quenching via central starburst feedback. They referred an average quenching time-scale below 1 Gyr as the lifetime of cSFGs, which is consistent with our time-scale estimate, ( Gyr), for different compactness criteria in this work. By using semianalytic models of galaxy formation, Barro et al. (2014) suggest that cSFGs would have to end their lives with an abrupt decline of the star formation rate (SFR) on a short timescales ( Myr), and then reproduce the emergence of the quiescent population. Moreover, for the cSFGs with higher compactness, Figure 8 shows that the time-scale of current burst of star formation tends to be shorter. The drop of the cSFG number density since will lead to a plateau in the cQG number density at since no new cQGs are added to the sample. Due to the lower SFR toward decreasing redshift as predicted by some simulations (Finlator et al. 2007; Tonini et al. 2012; Barro et al. 2014), cSFGs are not formed in large numbers at in the late-track described by Barro et al. (2013), and some quiescent galaxies are supplied by the quenching of the eSFGs. The abundances of cSFGs rapidly drop from to 1, which can be interpreted by the decrease of gas reservoirs in dark matter halos (Croton 2009; Geach et al. 2011) and the consequent low efficiency of gas-rich dissipation (Barro et al. 2013). The decline of the abundances of cSFGs in this work corresponds to the decrease of gas-rich major merger rate of massive SFGs since derived by López-Sanjuan et al. (2013).
4 Summary
In this paper, a large sample of massive galaxies with at in five 3D-HST/CANDELS fields has been separated into quiescent and star-forming populations by the rest-frame UVJ diagram. We further select the cQGs and cSFGs using eight different definitions of compactness in literatures (Carollo et al. 2013; Quilis & Trujillo 2013; Barro et al. 2014; van der Wel et al. 2014; Fang et al. 2015; van Dokkum et al. 2015). To explore the evolutionary connection between the cQGs and cSFGs, fractional abundance and number density are quantified as a function of redshift. Main conclusions are summarized as below:
-
1.
We confirm that massive QGs are on average smaller than massive SFGs in size at . for a specified redshift range, the slope of the size-mass relation is steeper for massive QGs. The sizes of massive QGs are much more dependent on stellar mass than those of massive SFGs.
-
2.
We adopt eight different definitions of compact galaxies to select cQGs and cSFGs at . The effect of compactness definition on the values of fractional abundance and comoving number density is remarkable for the cQG and cSFG samples. However, except for the compactness definition by Quilis & Trujillo (2013), their evolutionary trends in the abundance of compact galaxies are found to be rather similar regardless of the adopted mass thresholds and specific compactness criteria.
-
3.
For compact quiescent galaxies (cQGs), both the fractional abundance and the number density of cQGs peak at . For the large samples of cQGs, their number densities exhibit a sustaining increase from to 2 and a plateau at . Comparing with the results at from Charbonnier et al. (2017), a declining tend of number density over cosmic time is expected within the reshift gap (i.e, from to 0.6) for the cQG samples with a lower mass threshold of . A constant cQG number density at can be inferred for the more massive cQGs with .
-
4.
For compact star-forming galaxies (cSFGs), a rising trend along redshift is found for fractional abundance at , except for the compactness criterion with the Gini coefficient by Fang et al. (2015). A plateau in the number density at can be found in the cSFG samples, as well as a continuous declining from to 1.
-
5.
Taking the abundances of both the cSFGs and cQGs at into consideration, their behaviors in redshift evolution favor the scenario that a certain fraction of the cSFGs at may have been quenched into the cQGs via rapid violent dissipational processes such as major merger or disk instabilities, which leads to a remarkable increasing in the cQG number density from to 2. Rarity of the cSFGs at lower redshifts () is due to the decrease of available gas in dark matter halos. A small fractional abundance for local cQGs () may be due to the effect of size enlargement via minor mergers.
Acknowledgements.
This work is based on observations taken by the 3D-HST Treasury Program (GO 12177 and 12328) with the NASA/ESA HST, which is operated by the Association of Universities for Research in Astronomy, Inc., under NASA contract NAS5-26555. This work is supported by the National Natural Science Foundation of China (Nos. 11673004, 11873032, 11433005) and by the Research Fund for the Doctoral Program of Higher Education of China (No. 20133207110006).References
- Abraham et al. (2007) Abraham, R. G., Nair, P., McCarthy, P. J., et al. 2007, ApJ, 669, 184
- Abraham et al. (2003) Abraham, R. G., van den Bergh, S., & Nair, P. 2003, ApJ, 588, 218
- Baldry et al. (2004) Baldry, I. K., Glazebrook, K., Brinkmann, J., et al. 2004, ApJ, 600, 681
- Barro et al. (2013) Barro, G., Faber, S. M., Perez-Gonzalez, P. G., et al. 2013, ApJ, 765, 104
- Barro et al. (2014) Barro, G., Faber, S. M., Péez-González, P. G., et al. 2014, ApJ, 791, 52
- Bell et al. (2012) Bell, E. F., van der Wel, A., Papovich, C., et al. 2012, ApJ, 753, 167
- Belli et al. (2014a) Belli, S., Newman, A. B., & Ellis, R. S. 2014a, ApJ, 783, 117
- Blanton et al. (2003) Blanton, M. R., Hogg, D. W., Bahcall, N. A., et al. 2003, ApJ, 594, 186
- Blanton & Moustakas (2009) Blanton, M. R., & Moustakas, J. 2009, ARA&A, 47, 159
- Brammer et al. (2011) Brammer, G. B., Whitaker, K. E., van Dokkum, P. G., et al. 2009, ApJ, 706, L173
- Brammer et al. (2008) Brammer, G. B., van Dokkum, P. G., & Coppi, P. 2008, ApJ, 686, 1503
- Birnboim & Dekel (2008) Birnboim, Y., & Dekel, A. 2003, MNRAS, 345, 349
- Brinchmann et al. (2004) Brinchmann, J., Charlot, S., White, S. D. M., et al. 2004, MNRAS, 351, 1151
- Bruce et al. (2012) Bruce V. A., Dunlop, J. S., Cirasuolo, M., et al. 2012, MNRAS, 427, 1666
- Bruzual & Charlot (2003) Bruzual, G., & Charlot, S. 2003, MNRAS, 344, 1000
- Buitrago et al. (2018) Buitrago, F., Ferreras, I., Kelvin, L. S., et al. 2018, ArXiv: 1807.02534
- Carollo et al. (2013) Carollo, C. M., Bschorr, T. J., Renzini, A., et al. 2013, ApJ, 773, 112
- Cassata et al. (2011) Cassata P., Giavalisco, M., Guo, Y., et al. 2011, ApJ, 743, 96
- Cassata et al. (2013) Cassata P., Giavalisco, M., Williams, C. C., et al. 2013, ApJ, 775, 106
- Chabrier (2003) Chabrier, G. 2003, PASP, 115, 763
- Charbonnier et al. (2017) Charbonnier, A., Huertas-Company, M., Gonçalves, T. S., et al. 2017, MNRAS, 469, 4523
- Croton (2009) Croton, D. J. 2009, MNRAS, 394, 1109
- Daddi et al. (2005) Daddi, E., Renzini, A., Pirzkal, N., et al. 2005, ApJ, 626, 680
- Damjanov et al. (2015) Damjanov, I., Geller, M. J., Zahid, H. J., et al. 2015, ApJ, 806, 158
- Damjanov et al. (2009) Damjanov, I., McCarthy, P. J., Abraham, R. G., et al. 2009, ApJ, 695, 101
- Damjanov et al. (2019) Damjanov, I., Zahid, H. J., Geller, M. J., et al. 2019, ApJ, 872, 91
- de la Rosa et al. (2016) de la Rosa, I. G., La Barbera, F., Ferreras, I., et al. 2016, MNRAS, 457, 1916
- Dakel et al. (2009a) Dekel, A., Birnboim, Y., Engel, G., et al. 2009a,Nature, 457, 451
- Dakel et al. (2009b) Dekel, A., Sari, R., & Ceverino, D. 2009b, ApJ, 703, 785
- Dakel et al. (2013) Dekel, A., Zolotov, A., Tweed, D., et al. 2013, MNRAS, 435, 999
- Dakel & Burkert (2014) Dekel, A., & Burkert, A. 2014, MNRAS, 438, 1870
- Faber et al. (2007) Faber, S. M., Willmer, C. N. A., Wolf, C., et al. 2007, ApJ, 665, 265
- Fang et al. (2012) Fang, G. W., Kong, X., Chen, Y., & Lin, X. B. 2012, ApJ, 751, 109
- Fang et al. (2015) Fang, G. W., Ma, Z. Y., Kong, X., & Fan, L. L. 2015, ApJ, 807, 139
- Finlator et al. (2007) Finlator, K., Davé, R., & Oppenheimer, B. D. 2007, MNRAS, 376, 1861
- Gargiulo et al. (2016) Gargiulo, A., Saracco, P., Tamburri, S., et al. 2016, A&A, 592, A132
- Geach et al. (2011) Geach, J. E., Smail, I., Moran, S. M., et al. 2011, ApJ, 730, L19
- Graham et al. (2015) Graham, A. W., Dullo, B. T., & Savorgnan, G. A. D. 2015, ApJ, 804, 32
- Grogin et al. (2011) Grogin, N. A., Kocevski, D. D., Faber, S. M., et al. 2011, ApJS, 197, 35
- Gu et al. (2018a) Gu, Y. Z., Fang, G. W., Yuan, Q. R., et at. 2018, ApJ, 855, 10
- Gu et al. (2018b) Gu, Y. Z., Fang, G. W., Yuan, Q. R., et at. 2018, ApJ, submitted
- Heckman et al. (2011) Heckman, T. M., Borthakur, S., Overzier, R., et al. 2011, ApJ, 730, 5
- Hopkins et al. (2010) Hopkins, P. F., Bundy, K., Croton, D., et al. 2010, ApJ, 715, 202
- Hopkins et al. (2009a) Hopkins, P. F., Cox, T. J., Younger, J. D., & Hernquist, L. 2009a, ApJ, 691, 1168
- Huertas-Companyal et al. (2015) Huertas-Company M., Pérez-González, P. G., Mei, S., et al. 2015, ApJ, 809, 95
- Ilbert et al. (2013) Ilbert, Q., McCracken, H. J., Le Fèvre, O., et al. 2013, A&A, 556, A55
- Johansson et al. (2012) Johansson, P. H., Naab, T., & Ostriker, J. P. 2012, ApJ, 754, 115
- Kauffmann et al. (2003b) Kauffmann, G., Heckman, T. M., Tremonti, C., et al. 2003b, MNRAS, 346, 1055
- Kauffmann et al. (2003a) Kauffmann, G., Heckman, T. M., White, S. D. M., et al. 2003a, MNRAS, 341, 33
- Kauffmann et al. (2004) Kauffmann, G., White, S. D. M., Heckman, T. M., et al. 2004, MNRAS, 353, 713
- Kocevski et al. (2017) Kocevski, D. D., Barro, G., Faber, S. M., et al. 2017, ApJ, 846, 112
- Koekemoer et al. (2011) Koekemoer, A. M., Faber, S. M., Ferguson, H. C., et al. 2011, ApJS, 197, 36
- Kriek et al. (2009) Kriek, M., van Dokkum, P. G., Labbé, I., et al. 2009, ApJ, 700, 221
- López-Sanjuan et al. (2013) López-Sanjuan, C., Fèvre, O. Le., Tasca, L. A. M., et al. 2013, A&A, 553, A78
- Lotz et al. (2004) Lotz, J. M., Primack, J., & Madau, P. 2004, AJ, 128, 163
- Muzzin et al. (2013) Muzzin A., Marchesini, D., Stefanon, M., et al. 2013, ApJS, 206, 8
- Naab et al. (2009) Naab, T., Johansson, P. H., & Ostriker, J. P. 2009, ApJ, 699, L178
- Newman et al. (2012) Newman A. B., Ellis R. S., Bundy, K., & Treu, T. 2012, ApJ, 746, 162
- Newman et al. (2010) Newman A. B., Ellis R. S., Treu T., & Bundy K. 2010, ApJ, 717, L103
- Oser et al. (2012) Oser, L., Naab, T., Ostriker, J. P., et al. 2012, ApJ, 744, 63
- Pandya et al. (2017) Pandya, V., Brennan, R., Somerville, R. S., et al. 2017, MNRAS, 472, 2054
- Peng et al. (2002) Peng, C. Y., Ho, L. C., Impey, C.D., & Rix, H-W. 2002, AJ, 124, 266
- Peng et al. (2010) Peng, Y. J., Lilly, S. J., Kovač, K., et al. 2010, ApJ, 721, 193
- Peralta de Arriba et al. (2016) Peralta de Arriba, L., Quilis, V., Trujillo, I., et al. 2016, MNRAS, 461, 156
- Poggianti et al. (2013a) Poggianti, B. M., Calvi, R., Bindoni, D., et al. 2013a, ApJ, 762, 77
- Poggianti et al. (2013b) Poggianti, B. M., Moretti, A., Calvi, R., et al. 2013b, ApJ, 777, 125
- Quilis & Trujillo (2013) Quilis V., & Trujillo I. 2013, ApJ, 773, L8
- Ryan et al. (2012) Ryan Jr. R. E., McCarthy, P. J., Cohen, S. H., et al. 2012, ApJ, 749, 53
- Saulder et al. (2015) Saulder, C., van den Bosch, R. C. E., & Mieske, S. 2015, A&A, 578, A134
- Skelton et al. (2014) Skelton, R. E., Whitaker, K. E., Momcheva, I. G., et al. 2014, ApJS, 214, 24
- Strateva et al. (2001) Strateva, I.V., Ivezić, Ž., Knapp, G. R., et al. 2001, AJ, 122, 1861
- Tadaki et al. (2015) Tadaki, K.-i., Kohno, K., Kodama, T., et al. 2015, ApJ, 811, L3
- Tonini et al. (2012) Tonini, C., Bernyk, M., Croton, D., Maraston, C., & Thomas, D. 2012, ApJ, 759, 43
- Taylor et al. (2010) Taylor, E. N., Franx, M., Glazebrook, K., et al. 2010, ApJ, 720, 723
- Tremonti et al. (2007) Tremonti, C. A., Moustakas, J., & Diamono-Stanic, A. M. 2007, ApJ, 663, L77
- Trujillo et al. (2009) Trujillo, I., Cenarro, A. J., Lorenzo-Cáceres, A. D., et al. 2009, ApJ, 692, L118
- Trujillo et al. (2014) Trujillo, I., Ferré-Mateu, A., Balcells, M., et al. 2014, ApJ, 780, L20
- Valentinuzzi et al. (2010a) Valentinuzzi, T., Fritz, J., Poggianti, B. M., et al. 2010a, ApJ, 712, 226
- van der Wel et al. (2012) van der Wel, A., Bell, E. F., Hussler, B., et al. 2012, ApJS, 203, 24
- van der Wel et al. (2014) van der Wel, A., Franx, M., van Dokkum, P. G., et al. 2014, ApJ, 788, 28
- van Dokkum et al. (2014) van Dokkum, P. G., Bezanson, R., van der Wel, A., et al. 2014, ApJ, 791, 45
- van Dokkum et al. (2015) van Dokkum, P. G., Nelson, E. J., Franx, M., et al. 2015, ApJ, 813, 23
- Whitaker et al. (2011) Whitaker, K. E., Labbé, I., van Dokkum, P. G.,et al. 2011, ApJ, 735, 86
- Whitaker et al. (2012) Whitaker, K. E., Kriek M., van Dokkum P. G., et al. 2012, ApJ, 745, 179
- Williams et al. (2009) Williams, R. J., Quadri R. F., Franx M., et al. 2009, ApJ, 691, 1879
- Williams et al. (2014) Williams, C. C., Giavalisco, M., Cassata, P., et al. 2014, ApJ, 780, 1
- Williams et al. (2015) Williams, C. C., Giavalisco, M., Lee, B., et al. 2015, ApJ, 800, 21
- Wuyts et al. (2010) Wuyts, S., Cox, T. J., Hayward, C. C., et al. 2010, ApJ, 722, 1666
- Wuyts et al. (2011) Wuyts, S., Förster Schreiber, N. M., van der Wel, A., et al. 2011, ApJ, 742, 96
- Wuyts et al. (2007) Wuyts, S., Labbé, I., Franx, M., et al. 2007, ApJ, 655, 51
- Zahid et al. (2015) Zahid, H. J., Damjanov, I., Geller, M. J., & Chilingarian, I. 2015, ApJ, 806, 122
- Zolotov et al. (2015) Zolotov, A., Dekel, A., Mandelker, N., et al. 2015, MNRAS, 450, 2327