Study of cosmogenic radionuclides in the COSINE-100 NaI(Tl) detectors
Abstract
COSINE-100 is a direct detection dark matter search experiment that uses a 106 kg array of eight NaI(Tl) crystals that are kept underground at the Yangyang Underground Laboratory to avoid cosmogenic activation of radioisotopes by cosmic rays. Even though the cosmogenic activity is declining with time, there are still significant background rates from the remnant nuclides. In this paper, we report measurements of cosmogenic isotope contaminations with less than one year half-lives that are based on extrapolations of the time dependent activities of their characteristic energy peaks to activity rates at the time the crystals were deployed underground. For longer-lived 109Cd ( y) and 22Na ( y), we investigate time correlations and coincidence events due to several emissions. The inferred sea-level production rates are compared with calculations based on the ACTIVIA and MENDL-2 model calculations and experimental data. The results from different approaches are in reasonable agreement with each other. For 3H, which has a long, 12.3 year half-life, we evaluated the activity levels and the exposure times that are in reasonable agreement with the time period estimated for each crystal’s exposure.
keywords:
Cosmogenic radionuclide, activity, production rate, COSINE-1001 Introduction
 |
 |
| (a) | (b) |
There are a number of experiments that search for direct evidence for dark matter particles in the halo of our Galaxy by looking for nuclei recoiling from dark matter–nucleus scattering [1, 2] and report null results. One notable exception is the DAMA/LIBRA experiment that has consistently reported the observation of an annual event-rate modulation, that could be interpreted as dark-matter signal, in an array of NaI(Tl) crystal detectors with a statistical significance that is now more than 12.9 [3, 4]. Although this signal has persisted for over two decades and for three different configurations of the detector, it remains controversial because it is in conflict with the bounds from other direct detection experiments using different target materials [5, 6, 7, 8, 9, 10] and indirect searches [11]. However, since these conflicts depend on the details of the models for dark matter-nucleus scattering [12] and the properties of the galactic dark matter halo [13, 14, 15], a conclusive statement about the DAMA/LIBRA signal can only be made by conducting an independent experiment using the same NaI(Tl) target material. This is the prime motivation of COSINE-100 and a number of other NaI(Tl)-crystal-based experiments [16, 17, 18, 19, 20]
COSINE-100 is a dark matter direct detection experiment [21, 22] that uses a 106 kg array of eight low-background NaI(Tl) crystals situated in a 2000 liter liquid scintillator veto counter. The experiment is located 700 m underground at the Yangyang Underground Laboratory (Y2L), where it has been operating since September 2016. The search for an annual modulation signal requires a complete understanding of background sources and their time dependence. To accomplish this, a complete simulation that accurately models the background energy spectra measured in the detector is required [23]. In addition to backgrounds from long-lived radioactive contaminations in the crystal bulk and surfaces, we have to deal with time-dependent backgrounds from short-lived cosmogenically activated radionuclides. These are isotopes that are created by interactions of cosmic rays with stable nuclides in the detector material. In COSINE-100, almost all of the cosmogenic isotopes come from cosmic ray interactions with either Na or I nuclei.
This paper is organized as follows. The COSINE-100 detector is described in section 2. In section 3, the cosmogenic isotopes that are produced in NaI(Tl) are listed and the determination of the activity levels at the time of their initial deployment underground at Y2L is described. The use of these initial activity levels to infer production rates for cosmogenic isotopes at sea level and their comparison with ACTIVIA and MENDL-2 calculations [24, 25] and with experimental data are discussed in section 4. The fitted activities of 3H and 129I from the background modeling are evaluated in section 5 and conclusions are provided in section 6.
2 The COSINE-100 experimental setup
| Crystal | Mass | Size | Powder type | Exposure time | Radioactivity |
|---|---|---|---|---|---|
| (kg) | (diameterlength) | (years) | cooling time at Y2L | ||
| (inches) | (years) | ||||
| Crystal-1 | 8.3 | 5.07.0 | AS-B | 2.17 | 3 |
| Crystal-2 | 9.2 | 4.211.0 | AS-C | 0.92 | 2.75 |
| Crystal-3 | 9.2 | 4.211.0 | AS-WSII | 0.92 | 1.2 |
| Crystal-4 | 18.0 | 5.015.3 | AS-WSII | 1.83 | 0.5 |
| Crystal-6 | 12.5 | 4.811.8 | AS-WSIII | 0.5 | 0.6 |
| Crystal-7 | 12.5 | 4.811.8 | AS-WSIII | 0.5 | 0.6 |
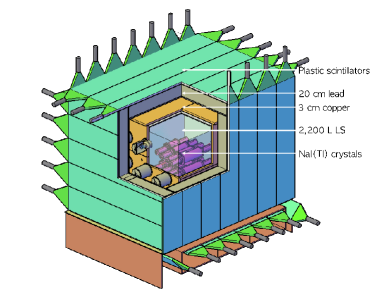
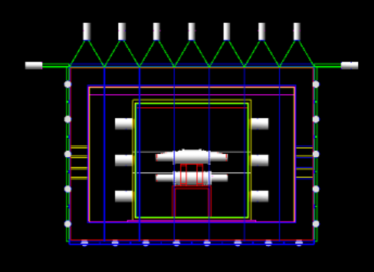
The experimental setup of COSINE-100, shown in Fig. 1(a), is described in detail in Ref. [21]. Eight NaI(Tl) crystals, arranged in two layers, are located in the middle of a four-layer shielding structure. From outside inward, this comprises plastic scintillator panels, a lead-brick castle, a copper box, and a tank of scintillating liquid. The eight encapsulated NaI(Tl) crystal assemblies and their support table are immersed in the scintillating liquid that serves both as an active veto and a passive shield. The eight NaI(Tl) crystals were grown from powder provided by Alpha Spectra (AS). Two crystals (Crystal-5 and Crystal-8) are not considered in this paper because their low light yields result in poorer energy resolution and because of their relatively high background contamination levels, especially at low energies.
Since the detailed cosmic ray exposure history of each crystal is unknown, we estimated the time period for each crystal’s exposure, listed in Table 1, from the time between the powder production by Alpha Spectra at Grand Junction, Colorado, to the date delivered to Y2L. We considered that the preparation of the NaI powder precedes the crystal growth date by 2 months. It includes 30 days as the duration of transportation to Y2L. Since Crystal-3 has a complicated exposure history, having been repaired once before deployment at Y2L, we can only be certain that the corresponding period is more than 9 months. The radioactivity cooling time for each crystal between delivery to Y2L and the start of data-taking is also listed in Table 1.
The six crystals that are considered in this analysis have light yields of about 15 photoelectrons/keV; the energy threshold for an accepted signal from a crystal is 2 keV. Selection criteria that are used to isolate scintillation-light generated signals from photomultiplier tube noise are described in detail in Ref. [21]. Events that have above-threshold signals in only one of the crystals and none in any of the other crystals or the liquid scintillator are classified as single-hit events. Those with above-threshold signals in more than one crystal and/or the liquid scintillator are classified as multiple-hit events.
3 Cosmogenic radionuclides and initial activities
| Cosmogenic | Half-life [27, 28, 29] | Decay type |
| isotopes | (days) | & Emissions energy |
| 125I | 59.4 | EC, 35.5+31.7=67.2 keV |
| 121Te | 19.17 | EC, 4.1–4.7 and 30.5 keV |
| 121mTe | 164.2 | EC, 4.1–4.7 and 30.5 keV |
| 123mTe | 119.3 | IT, 247 keV |
| 125mTe | 57.4 | IT, 145 keV |
| 127mTe | 106.1 | IT, 88 keV |
| 113Sn | 115.1 | EC, 3.7–4.2 and 28 keV |
| 109Cd | 462 | EC, 25.5 and 88 keV |
| 22Na | 950 | , 511 and 1274.6 keV |
| 3H | 4494 | |
| 129I | 1.57107 yr |
Although the eight NaI(Tl) crystals had underground radioactivity cooling times that range from several months to three years, there are still backgrounds from the long-lived cosmogenic isotopes that were activated by cosmic rays while they were on the surface.
To understand these backgrounds, we first considered the list of cosmogenic radioactive isotopes that are produced in NaI(Tl) reported in Ref. [30, 31, 32, 33]. In Table 2, we list the contributing cosmogenic isotopes with their half lives and decay modes; short-lived isotopes, for which half lives are less than a year, are 125I, 121Te, 121mTe, 123mTe, 125mTe, 127mTe, and 113Sn and long-lived isotopes are 109Cd, 22Na, 3H, and 129I. Since there are no characteristic peaks from the decay of 123mTe/125mTe in the low energy below 100 keV their contributions are negligible in all crystals in Table 1 and, thus, they are not further considered in the analysis.
The short-lived ( y) isotopes are not expected to contribute significantly to either Crystal-1 or Crystal-2 because their cooling times are long enough to reduce these activities to a negligible level. However, we expect some backgrounds from the short-lived isotopes in other crystals because their production rates at sea level, as estimated in [30, 31, 32, 33], are high and their cooling times are less than or equal to a year.
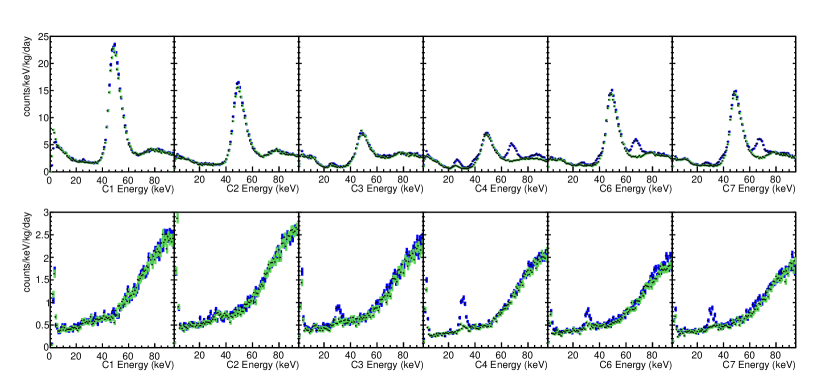
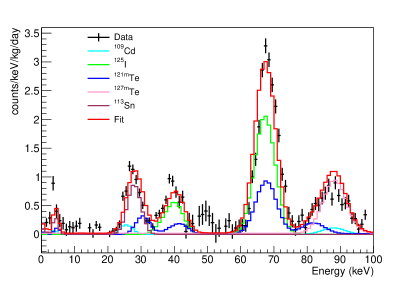
Data points in Fig. 2 show the energy spectra for the six considered NaI(Tl) crystals during the first (blue) and last (green) 25 day segments of the dataset taken between October 21, 2016 and July 18, 2018. A significant reduction of peaks from short-lived cosmogenic isotopes in Crystals 4, 6, and 7 for both single- and multiple-hit events is evident, while the differences for Crystals 1 and 2 are small, as expected. To associate the specific peaks with its cosmogenic nuclide, we simulated each isotope in Table 2 as a radioactive contaminant randomly distributed inside the NaI(Tl) crystal bulk. Fig. 3 shows the differences between the initial and final data segments for Crystal-4. The subtracted spectrum is well fitted by the simulated cosmogenic components that are treated as parameters floating in the fit, thereby validating our selection of the main cosmogenic contributors to the low-energy single-hit distribution. However, the derived weight of each isotope from the fit are not further considered in the analysis. Those two structures at about 12 and 48 keV in Fig. 3 are characteristic of 210Pb. It decays over time with the half-life of 22.3 yr and there is a little difference between the first and last 25 day spectra of the 1.7 years data.
Four long-lived nuclides, 109Cd, 22Na, 3H, and 129I have low energy deposits and are, therefore, potentially troublesome. It is essential to understand their background contributions to the low energy spectra regions, especially in the (2–6) keV dark matter signal region of interest (ROI). The beta-decay spectrum of tritium has an endpoint energy of 18 keV and the electron capture decay of 22Na produces 0.87 keV emissions. The beta decay of 129I to 129Xe∗ is followed by 129Xe∗ transitioning to the stable 129Xe isotope via the emission of a 39.6 keV -ray. Its spectral feature from this process has a distribution with a peak around 45 keV. The electron capture decay of 109Cd contribute peaks at 25.5 and around 3.5 keV.
Because it is impossible to compute the initial activities of the cosmogenic radioisotopes from the production rates without knowing their detailed cosmic ray exposure conditions: i.e., time, location, altitude, etc. [30], we, when possible, extrapolated the time-dependent reduction of characteristic peaks from their decays to determine their activity levels at the time of their initial deployment at Y2L. For the activities of the long-lived 22Na and 109Cd isotopes we investigated temporal and spatial correlations of characteristic /X-rays peaks produced in their decays. The details of these technique are discussed in the following sections.
3.1 Measurement of decay rates
| Crystal-1 | Crystal-2 | Crystal-3 | Crystal-4 | Crystal-6 | Crystal-7 | |
|---|---|---|---|---|---|---|
| 125I | - | - | 9.00.9 | 3.40.1 | 5.10.2 | 5.40.2 |
One way to measure the activities of the cosmogenic isotopes is through their decay rates. This measurement requires a selection of events of the specific decays studied, which can be identified by investigating the main contributions of the decay to our data spectra. Therefore, we first simulate each of the cosmogenically activated isotopes with the COSINE-100 GEANT4 package, studying their generated spectra and selecting the energy regions where they can have a significant contribution in comparison to the flat background.
 |
 |
 |
| (a) | (b) | (c) |
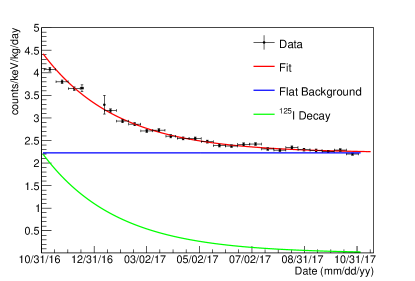
Once the regions where the main contributions from each cosmogenically activated isotope are identified, we look into the decay rates for each of them, integrating the rates over the specific energy ranges. We fit the decay rate over time for each component. Depending on the energy region selected for each cosmogenic, the decay rate can be fitted by a constant and one or more exponential functions, as following:
| (1) |
where is the initial time, is the expected flat background rate, B is the rate in , and is the half-life, a constant of the fit. Fig. 4 shows an example of decay rate modeling with the units given in dru (counts/day/kg/keV).
The amplitude of the exponential () can be used to calculate the activity (in Bq/kg) of the cosmogenic isotope at the indicated initial time:
| (2) |
where is the fraction of the events from that cosmogenic depositing energy in the specified integration region, which can be calculated from the simulated spectra. s for each isotope are 60–70 keV in single hit for 125I, 20–40 keV in multiple hit for 121mTe, 80–94 keV in single hit for 127mTe, and 20–30 keV in single hit for 113Sn.
3.1.1 Iodine 125I
Since iodine is one of the main components in the crystal, a significant amount of 125I is activated. However, the half-life of this isotope is short with = 59.4 days. We define the integration region for this isotope as and keV of the single-hit spectrum, as shown in Fig. 4; it decays to an isomeric state of 125mTe by electron capture, producing 31.7 keV emissions for K-shell electrons, which is followed by the emission of an 35.5 keV gamma ray from the isomer transition of 125mTe. Although there is a contribution from 121mTe in this region, it is very small due to the low activity of this isotope and more importantly, due to the very small fraction of total 121mTe events that actually deposit energy in this region. Therefore, the contribution of 121mTe in the to keV region is insignificant, and the amounts of activated 125I in the crystals during their deployment at Y2L can be found in Table 3.
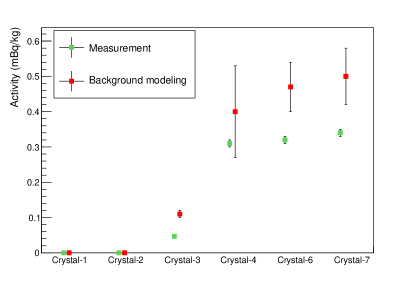
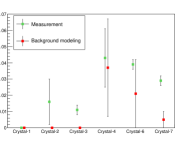
Fig. 5 shows the difference between the measured activities of 125I for the six crystals analyzed. The different amounts of 125I are related to the cooling time of the crystals before the start of data taking. We also compare the activities calculated in the background fit [23] to those measured through this method.
3.1.2 Tellurium 121mTe, 127mTe and Tin 113Sn
| Crystal-1 | Crystal-2 | Crystal-3 | Crystal-4 | Crystal-6 | Crystal-7 | |
|---|---|---|---|---|---|---|
| 121mTe | - | - | 0.900.16 | 0.890.06 | 0.440.07 | 0.410.07 |
| 127mTe | - | - | 0.870.16 | 0.480.03 | 0.380.04 | 0.350.04 |
| 113Sn | - | - | 0.160.05 | 0.150.06 | 0.160.01 | 0.120.01 |
 |
 |
| (a) | (b) |
-
The line chosen to investigate 121mTe is the one between to keV in the multiple-hit spectrum, contributed by 30 keV emissions from the 121mTe decay via electron capture. This line is dominant in that region, unlike the 121mTe lines in the single-hit spectra. The method used is the same as described above.
-
As we can see from the simulated spectra, 127mTe has only one peak at 88.3 keV in the single-hit spectrum, contributed by the de-excitation of 127mTe. However, there are other components that can have significant contributions in that energy region as well, such as 109Cd and 121mTe: a 88 keV emission from the isomer transition of 109mAg and another one at 81.8 keV from the de-excitation of 121mTe. The contribution coming from 121mTe can be calculated based on the measurement from the multiple-hit spectrum, as described above. The contribution from 109Cd, however, is calculated based on another study, which will be described in section 3.2.2. Both of these are added to the fitting function, allowing the measurement of 127mTe, activity.
-
The electron capture decay of 113Sn produces 28 keV emissions. The method used is the same as described above. The peaks at 25.5 keV and 30 keV contributed by 109Cd and 121mTe can be calculated, as described above, and added to the fitting function, allowing the measurement of 113Sn.
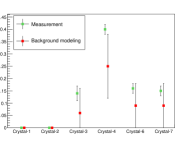
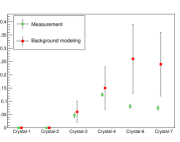
Fig. 6(a), (b) show the differences between the measured activities of 121mTe and 127mTe for the six crystals analyzed. We also compare the activities calculated in the background fit to those measured through this method. As listed in Tables 3 and 4, the initial activities when crystals were deployed at Y2L were derived for 125I, 121mTe, 127mTe, and 113Sn in each crystal.
3.2 Long-lived isotopes
3.2.1 Sodium 22Na
 |
| Crystal-1 | Crystal-2 | Crystal-3 | Crystal-4 | Crystal-6 | Crystal-7 | |
|---|---|---|---|---|---|---|
| double coincidence | 2.590.27 | 1.460.27 | 0.990.07 | 1.200.09 | 0.730.09 | 0.930.08 |
| triple coincidence | 2.00.4 | 1.520.37 | 0.840.18 | 1.170.19 | 0.650.14 | 0.870.23 |
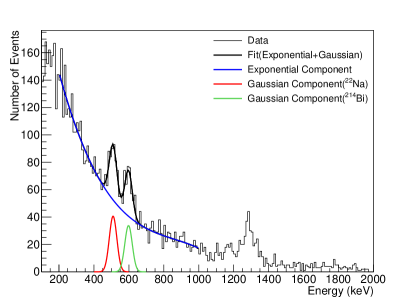
The decays of 22Na (Q-value = 2.84 MeV) to 22Ne∗ proceed via emission (90.3%) or electron capture (9.6%) with 3.75 yr mean lifetime, followed by 22Ne∗ transitioning to the stable 22Ne isotope via the emission of a 1274.6 keV -ray with a 5.3 ps mean lifetime. The electron capture of 22Na from K-shell produces 0.87 keV emissions. As a result, 10% of the 22Na decay will simultaneously produce a 1274.6 keV -ray and 0.9 keV emissions. In the case of decay, the final-state positron immediately annihilates to two 511 keV -rays. If one of the two 511 -rays escapes the crystal, the remaining energy deposited in the crystal will be substantially greater than 650 keV. Figure 7(a) shows the energy spectrum in another crystal in coincidence with a signal in the (650–1000) keV energy interval in Crystal-3, which are called double coincidence events. The 22Na decay events show up as the peak at 511 keV (red color).
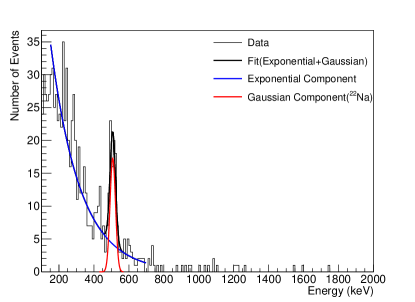
Since the eight NaI(Tl) crystal assemblies are immersed in the scintillating liquid (LS), as described in section 2, we can also identify 22Na decay events in which the 1274.6 keV gamma-ray converts in the LS in coincidence with two 511 keV signals in two crystals. These are referred to as triple coincidence events. Figure 7(b) shows the peak at 511 keV (red color) in another crystal, contributed by triple coincidence events, while a signal is in the (650–1000) keV energy interval in Crystal-3.
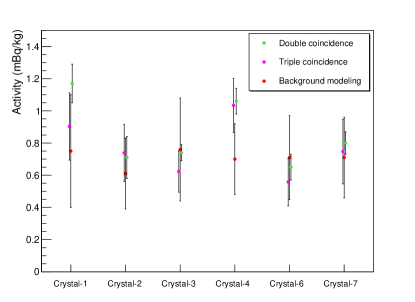
We used the time-dependent reduction of the peak at 511 keV, contributed by the double/triple coincidences of the 1.7 year data divided in bins of 60 days, to extrapolate the activity at the indicated initial time with the relation:
| (3) |
where is the number of events, is the detection efficiency obtained from a Monte Carlo simulation, is the mass of the NaI(Tl) crystal, and is the time of the measurement.
3.2.2 Cadmium 109Cd
 |
 |
| Crystal-1 | Crystal-2 | Crystal-3 | Crystal-4 | Crystal-6 | Crystal-7 | |
|---|---|---|---|---|---|---|
| 109Cd (10-2) | 4.63.0 | 0.91.8 | 7.50.9 | 9.20.7 | 1.50.7 | 1.50.5 |
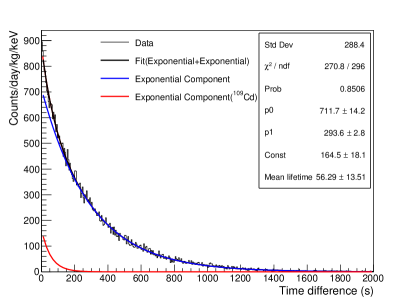
The cosmogenic isotope 109Cd decays via electron capture to an isomeric state of 109mAg, with a prompt energy deposit of 25.5 keV, the binding energy of the Ag K-shell electron. This is followed by an emission of 88 keV from the isomer transition of 109mAg that has a mean lifetime of 57.4 s. From the time interval distribution between 25.5 keV and 88 keV signals, selected within three Gaussian width of the peaks in the same crystal, we extract the level of 109Cd from a fit with two exponential decay functions. As discussed in section 3.1.2 there are significant contributions from 127mTe and 121mTe around 88 keV and 113Sn and 121mTe around 25 keV, which dominate the blue curve in Figure 9. The fitted mean lifetime, 5614 s, from the exponential curve in red, as can be seen in Figure 9, is consistent with the mean lifetime of 57.4 s from the isomer transition of 109mAg.
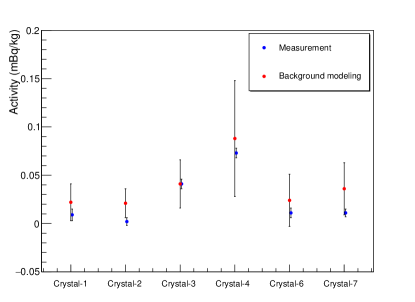
We determined the 109Cd activity rates in mBq/kg from these measurements: Fig. 10 shows the measured activity levels for the six crystals analyzed through this method, compared with the activities determined from the global background fit. The crystal activity levels when they were first deployed at Y2L are listed in Table 6.
4 Results and comparisons for production rates
In section 3 we describe the determination of the crystals’ cosmogenic isotope activities at the time they were first deployed underground at Y2L. However, since we do not know the details of their previous exposure conditions, such as times, locations, and altitudes, these cannot be directly related to production rates or saturation activity levels. But an attempt to extract sea level production rates has been made from a simplified mathematical model for production and decay of radionuclides.
| 22Na | 109Cd | 125I | 121mTe | 127mTe | 113Sn | |
| Crystal-1 | 132.024.0 | 1.71.1 | ||||
| Crystal-2 | 148.544.9 | 0.61.2 | ||||
| Crystal-3 | 114.519.7 | 4.70.6 | 280.129.3 | 31.15.5 | 26.94.8 | 5.11.6 |
| Crystal-4 | 81.012.7 | 3.70.3 | 104.23.7 | 24.91.6 | 13.50.7 | 4.11.6 |
| Crystal-6 | 144.031.2 | 1.80.8 | 184.76.3 | 23.53.5 | 16.31.5 | 7.10.5 |
| Crystal-7 | 151.052.1 | 1.8 0.6 | 194.06.3 | 22.33.5 | 15.01.5 | 5.30.5 |
| ACTIVIA | 66 | 4.8 | 221 | 93 | 93 | 9 |
| MENDL-2 | 4.8 | 208 | 102 | |||
| ANAIS measurement [31, 32, 34] | 45.11.9 | 2.380.20 | 22010 | 23.50.8 | 10.20.4 | 4.530.40 |
| DM-Ice17 measurement [30] | 230 | 25 | 9 | 16 |
The production rate for activation of an isotope can be expressed as
| (4) |
where is the neutron capture cross section and is the cosmic-ray neutron flux. Since cosmic-ray neutron flux depends on altitude, location, and time the production rate at any arbitrary location can be calculated by scaling the reference production rate Rs at sea level,
| (5) |
The produced nuclide then decays according to the standard decay law, and the net rate of change for the number of existing radioactive nuclei is by the differential equation
| (6) |
where is the decay constant: = ( is the decay half-life). The solution of Eq. 6 is
| (7) |
and the activity is related to the number of existing nuclei by
| (8) | ||||
| (9) |
When the time is sufficiently large, then a saturation activity is reached at a given place,
| (10) |
The ANAIS experiment [31] realized that the cosmic-ray neutron flux can be scaled from its sea level reference flux, as reported in Ref. [30], to the NaI(Tl) crystal production point in Grand Junction, Colorado (altitude=1400 m), by a factor of . Using the measured activity levels reported here and the exposure times listed in Table 1, we compute a production rate Rs at sea level from the relation,
| (11) |
where the exposure time , listed in Table 1, is . The crystals are exposed at Alpha Spectra for a time and exposed at sea level for a time . We considered = 30 days as transportation duration to Y2L. Table 7 shows the production rate of cosmogenic isotopes in each NaI(Tl) crystal used for the COSINE-100 experiment compared with measurements from ANAIS [31, 32, 34] and DM-Ice17 [30], and calculations using ACTIVIA and MENDL-2; we used v1.3 of ACTIVIA that follows the parameterization of Gordon [35], valid from 1 MeV to 10 GeV, for the neutron flux spectrum and MENDL-2 that contains neutron reaction data up to 100 MeV. The results obtained with the six NaI(Tl) crystals are in reasonable agreement with each other, except for Crystal-3 that has a complicated exposure history; we considered 1 year exposure time for Crystal-3 for calculation of the production rates listed in Table 7. The production rates of 22Na in the six crystals are compatible with each other although they are larger than other measurement and calulation. For Crystal-4, since we do not know clearly the month and day of the powder production and the crystal delivery to Y2L it is possible to have about 60 days uncertainty for the exposure and the cooling times respectivley.
5 Discussion on Tritium 3H and Iodine 129I
| Crystal-1 | Crystal-2 | Crystal-3 | Crystal-4 | Crystal-6 | Crystal-7 | |
|---|---|---|---|---|---|---|
| A0 [mBq/kg] | 0.380.04 | 0.200.04 | 0.250.04 | 0.260.04 | 0.110.04 | 0.090.04 |
| Exposure time [year] | 2.19 | 1.11 | 1.37 | 1.44 | 0.66 | 0.52 |
It is generally difficult to measure activity levels of long-lived cosmogenic isotopes, directly from the data due to their long half-lives. This is especially the case for 3H, which has no distinguishing /X-ray peak that can be exploited. Therefore, we simulated background spectra from 3H in the six NaI(Tl) crystals and used the extracted spectral shapes in the data fitting, while floating their unknown fractions [23]. We determine the initial activity A0 of 3H by using the average activity during the first 60 days of data, obtained from the global background fitting model [23] described above, with results shown in Table 8. From these we computed exposures time from Eq. (11). We assumed that the production rate of 3H at sea level is Rs = (8327) kg-1d-1, which was reported by ANAIS [33]. The resultant exposure times, listed in Table 8, are in good agreement with the time period during which they were being produced at Alpha Spectra and undergoing delivery to Y2L, as shown in Table 1.
The presence of cosmogenic 129I was introduced by DAMA/LIBRA with the estimated concentration of 129I natI = (1.70.1)10-13 [36]. It is used as a floating parameter in the global background fitting modeling for the COSINE-100 NaI(Tl) crystals, with resulting values of 1.01, 1.08, 0.75, 0.72, 0.91, and 0.94 mBq/kg for Crystal-1, 2, 3, 4, 6, and 7, respectively. These values agree well with the ANAIS result: 0.960.06 mBq/kg [37].
6 Conclusion
We have studied background contributions from cosmogenic isotopes activated by cosmic rays in the COSINE-100 detectors. To understand their time-dependent energy spectra we simulated responses to decays of the most abundantly produced cosmogenic isotopes in NaI(Tl) crystals and identified the energy regions where they make strong contributions to the crystals’ background spectra. Based on these simulation studies we measured decay rates of the cosmogenic isotopes using the time-dependent decrease of peaks from characteristic decays of these isotopes. We also exploited the correlations of characteristic emissions in terms of time differences between sequential decays of 109Cd and double- and triple-coincidences for 22Na-decay-induced multi-gamma final states. From these measurements, we extrapolated the various isotopes’ activity levels to the times that they were first deployed underground at Y2L.
With these data we estimated production rates (at sea level) for the cosmogenic isotopes that are relevant for COSINE-100 and compared them with other experimental data and ACTIVIA/MENDL-2 calculations. As listed in Table 7, the results from different approaches are in reasonable agreement with each other. We extracted exposure times using initial 3H activities determined from the COSINE-100 global background fitting model and found results that are in reasonable agreement with the times reported in Table 2(b). We also quantified the unknown 129I activity level by including it as a free-floating parameter in the the global background fit model and found consistency with an ANAIS result.
This study has given us a quantitative understanding of the cosmogenic isotopes in the NaI(Tl) crystals used for the COSINE-100 experiment. It provides important constraints on time-dependent backgrounds in our search for a time-dependent modulation that would be a characteristic signal for dark matter interactions [38, 39].
Acknowledgments
We thank the Korea Hydro and Nuclear Power (KHNP) Company for providing underground laboratory space at Yangyang. This work is supported by: the Institute for Basic Science (IBS) under project code IBS-R016-A1 and NRF-2016R1A2B3008343, Republic of Korea; UIUC campus research board, the Alfred P. Sloan Foundation Fellowship, NSF Grants No. PHY-1151795, PHY-1457995, DGE-1122492, WIPAC, the Wisconsin Alumni Research Foundation, United States; STFC Grant ST/N000277/1 and ST/K001337/1, United Kingdom; and Grant No. 2017/02952-0 FAPESP, CAPES Finance Code 001, Brazil.
References
- [1] G. Jungman, A. Kamionkowski, G. Griest, Phys. Rep. 267 (1996) 195.
- [2] R. Gaitskell, Annu. Rev. Nucl. Part. Sci. 54 (2004) 315.
- [3] R. Bernabei, et al., Final model independent result of DAMA/LIBRA-phase1, Eur. Phys. J. C 73 (2013) 2648. doi:10.1140/epjc/s10052-013-2648-7.
- [4] R. Bernabei, et al., First model independent results from DAMA/LIBRA–Phase2, Nucl. Phys. At. Energy 19 (2018) 307, arXiv:1805.10486 [astro-ph.IM].
- [5] S. C. Kim, et al., New limits on interactions between weakly interacting massive particles and nucleons obtained with CsI(Tl) crystal detectors, Phys. Rev. Lett. 108 (2012) 181301. doi:10.1103/PhysRevLett.108.181301.
-
[6]
D. S. Akerib, et al.,
Results from
a search for dark matter in the complete LUX exposure, Phys. Rev. Lett. 118
(2017) 021303.
doi:10.1103/PhysRevLett.118.021303.
URL https://link.aps.org/doi/10.1103/PhysRevLett.118.021303 - [7] Xiangyi Cui, et al., (PandaX-II Collaboration) Dark matter results from 54-ton-day exposure of PandaX-II experiment, Phys. Rev. Lett. 119, 181302 (2017).
- [8] E. Aprile, et al., Dark matter search results from a one ton-year exposure of XENON1T, Phys. Rev. Lett. 121 (11) (2018) 111302.
- [9] P. Agnes et al., (DarkSide Collaboration) Low-mass dark matter search with the DarkSide-50 experiment, Phys. Rev. Lett. 121, 081307 (2018)
- [10] R. Agnese, et al., (SuperCDMS Collaboration) Results from the super cryogenic dark matter search experiment at Soudan, Phys. Rev. Lett. 120, 061802 (2018)
- [11] K. Choi, et al., Search for neutrinos from annihilation of captured low-mass dark matter particles in the Sun by Super-Kamiokande, Phys. Rev. Lett. 114 (14) (2015) 141301. doi:10.1103/PhysRevLett.114.141301.
- [12] S. Baum, K. Freese, C. Kelso, Dark matter implications of DAMA/LIBRA-phase2 results, Phys. Lett. B789 (2019) 262-269.
-
[13]
A. K. Drukier, K. Freese, D. N. Spergel,
Detecting cold
dark-matter candidates, Phys. Rev. D 33 (1986) 3495–3508.
doi:10.1103/PhysRevD.33.3495.
URL https://link.aps.org/doi/10.1103/PhysRevD.33.3495 - [14] C. Savage, K. Freese, P. Gondolo, Annual modulation of dark matter in the presence of streams, Phys. Rev. D74 (2006) 043531. doi:10.1103/PhysRevD.74.043531.
- [15] K. Freese, M. Lisanti, C. Savage, Colloquium: Annual modulation of dark matter, Rev. Mod. Phys. 85 (2013) 1561. doi:10.1103/RevModPhys.85.1561.
- [16] E. Barbosa de Souza, et al., First search for a dark matter annual modulation signal with NaI(Tl) in the Southern Hemisphere by DM-Ice17, Phys. Rev. D 95 (3) (2017) 032006. doi:10.1103/PhysRevD.95.032006.
- [17] I. Coarasa et al., ANAIS-112 sensitivity in the search for dark matter annual modulation, Eur. Phys. J. C. 79 (2019) 233.
- [18] M. Antonello et al., The SABRE project and the SABRE Proof-of-Principle, Eur. Phys. J. C 79 (2019) 363.
- [19] K. Fushimi, et al., Dark matter search project PICO-LON, J. Phys. Conf. Ser. 718 (4) (2016) 042022. doi:10.1088/1742-6596/718/4/042022.
- [20] G. Angloher et. al., The COSINUS project: perspectives of a NaI scintillating calorimeter for dark matter search, Eur. Phys. J. C 76 (2016) 441
- [21] G. Adhikari, et al., Initial performance of the COSINE-100 Experiment, Eur. Phys. J. C 78 (2018) 107. doi:10.1140/epjc/s10052-018-5590-x.
- [22] G. Adhikari, et al., An experiment to search for dark-matter interactions using sodium iodide detectors, Nature 564 (7734) (2018) 83–86. doi:10.1038/s41586-018-0739-1.
- [23] P. Adhikari, et al., Background model for the NaI(Tl) crystals in COSINE-100, Eur. Phys. J. C 78 (2018) 490. doi:10.1140/epjc/s10052-018-5970-2.
- [24] Y. R. J.J. Back, Activia: Calculation of isotopes production cross-sections and yields, Nucl. Instrum. Meth. A 586 (2008) 286–294.
-
[25]
Y. N. Shubin, V. P. Lunev, A. Y. Konobeyev, A. I. Kitjuk,
Cross-section data library MENDL-2 to study activation as transmutation of materials irradiated by nucleons of intermediate energies,
International Atomic Energy Agency (1995).
URL http://www-nds.iaea.org/publications/iaea-nds/iaea-nds-0136.htm - [26] S. Agostinelli, et al., GEANT4: A Simulation toolkit, Nucl. Instrum. Meth. A 506 (2003) 250. doi:10.1016/S0168-9002(03)01368-8.
-
[27]
Decay Data Evaluation Project,
URL http://www.nucleide.org/DDEP_WG/DDEPdata.htm - [28] S. Ohya, Nucl. Data Sheets 111, 1619 (2010)
-
[29]
WWW Table of Radioactive Isotopes,
URL http://nucleardata.nuclear.lu.se/toi/ - [30] W. C. Pettus, Cosmogenic activation in NaI detectors for dark matter searches, Ph.D. thesis, University of Wisconsin-Madison (2015).
- [31] J. Amare, et al., Cosmogenic radionuclide production in NaI(Tl) crystals, JCAP 02 (2015) 046.
- [32] P. Villar, et al., Study of the cosmogenic activation in NaI(Tl) crystals within the ANAIS experiment, Int. J. Mod. Phys. A 33 (9) (2018) 1843006.
- [33] J. Amare, et al., Cosmogenic production of tritium in dark matter detectors, Astropart. Phys. 97 (2018) 96.
- [34] J. Amare, et al., Analysis of backgrounds for the ANAIS-112 dark matter experiment, Eur. Phys. J. C 79 (2019) 412.
- [35] M. S. Gordon, et al., Measurement of the Flux and Energy Spectrum of Cosmic-Ray Induced Neutrons on the Ground, IEEE Transactions on Nuclear Science 51 (2004) 3427–3434. M. S. Gordon, et al., Correction to “Measurement of the flux and energy spectrum of cosmic-ray induced neutrons on the ground”, IEEE Transactions on Nuclear Science 52 (2005) 2703–2703.
- [36] R. Bernabei, et al., The DAMA/LIBRA apparatus, Nucl. Instrum. Meth. A592 (2008) 297–315. doi:10.1016/j.nima.2008.04.082.
- [37] S. Cebrian, et al., Background model for a NaI(Tl) detector devoted to dark matter searches, Astropart. Phys. 37 (2012) 60–69.
- [38] J.Amare, et al., First results on dark matter annual modulation from ANAIS-112 experiment, Phys. Rev. Lett. 123, 031301.
- [39] G. Adhikari, et al., (COSINE-100 Collaboration) Search for a dark matter-induced annual modulation signal in NaI(Tl) with the COSINE-100 experiment, Phys. Rev. Lett. 123, 031302.