∎
22email: salvatore.corrente@unict.it 33institutetext: Ana Garcia-Bernabeu 44institutetext: Universitat Politècnica de València, Spain
44email: angarber@upv.es 55institutetext: Salvatore Greco 66institutetext: University of Catania, Italy,
Univertisty of Portsmouth, UK,
66email: salgreco@unict.it 77institutetext: Teemu Makkonen 88institutetext: University of Eastern Finland, Finland
88email: teemu.makkonen@uef.fi
Robust measurement of innovation performances in Europe with a hierarchy of interacting composite indicators
Abstract
For long time the measurement of innovation has been in the forefront of policy makers’ and researchers’ agenda worldwide. Therefore, there is an ongoing debate about which indicators should be used to measure innovation. Recent approaches have favoured the use of composite innovation indicators. However, there is no consensus about the appropriate methodology to aggregate the varying dimensions of innovation into a single summary indicator. One of the best known examples of composite innovation indicators is the European Innovation Scoreboard (EIS). It is a relevant tool for benchmarking innovation in Europe. Still, the EIS lacks a proper scheme for weighting the included indicators according to their relative importance. In this context, we propose an appraisal methodology permitting to take into consideration the interaction of criteria and robustness concerns related to the elicitation of the weights assigned to the elementary indicators. With this aim, we apply the hierarchical-SMAA-Choquet integral approach. This integrated multicriteria decision making (MCDM) method helps the users to rank and benchmark countries’ innovation performance taking into account the importance and interaction of criteria assigned by themselves, rather than equal weights or weights exogenously fixed by external experts.
Keywords:
Composite innovation indicators Innovation performance Multiple criteria hierarchy process Stochastic Multicriteria Acceptability Analysis Triple Helix1 Introduction
According to recent scholarly debate, innovation is among, if not the main driver(s) of sustainable economic growth carayannis2018composite . This has also been recognised by policy makers such as, for example, the European Commission (EC) that advocates policies for innovation-driven growth. The highlighted importance of innovation has induced a need for monitoring innovation performance across countries to understand and benchmark the success of policy measures in facilitating innovation and further economic growth. Some prime examples of these monitoring efforts are the Global Innovation Index (GII), which provides data and insights gathered from tracking innovation around the globe dutta2017 , and the European Innovation Scoreboard (EIS) HollandersEsSadki2017 of which the latter is used here as an empirical case. Each year the EC publishes the annual EIS providing a comparative assessment of the research and innovation performance of the EU Member States and the relative strengths and weaknesses of their research and innovation systems. This indicator helps policy and decision makers to monitor, measure and benchmark the innovation performance of the EU, individual Member States, as well as associated countries and selected global competitors. It is a powerful tool for identifying areas in which the countries need to concentrate their efforts to boost their innovation performance foray2015assessment .
Since innovation activities are very complex, they are consequently challenging to measure holgersson2018towards . There is no consensus about which indicators should be used to measure innovation. Initially, the use of individual indicators from national statistics such as the number of patents schmookler1950interpretation or research and development (R&D) expenditures griliches2007r were the most commonly applied measures. However, starting from the 1990s, after pioneering works as hollenstein1996composite who introduced the use of composite innovation indicators (CII’s), scholars have started to favour and develop aggregate measures for innovation at the firm and geographical levels. As such, the EIS also provides a composite indicator, the Summary Innovation Index (SII), in which the innovation performance is obtained by aggregating the indicators for each country into one single index. SII is composed of 27 indicators covering ten dimensions structured in four main blocks/pillars (Framework Conditions, Investments, Innovation Activities and Impacts).
However, the application of such CII’s for measuring (national) innovation performance and their utility in directing innovation policy has also been questioned (grupp2004indicators ; schibany2008european ; grupp2010review ; adam2014measuring ; edquist2015innovation ; kozlowski2015innovation ; hauser2017measuring ) mainly due to the problems related to the varying statistical and mathematical methods utilised for determining weights when aggregating the indicators into a CII carayannis2018composite . Also, the latest EIS methodological report HollandersEsSadki2017b claims the need for a new methodology in constructing the EIS: “it may be advisable for future refinements of the EIS to make use of a hierarchical structure in which indicators are first aggregated in dimension composites and subsequently, into group or overall averages”.
When constructing composite indicators, several critical concerns should be taken into account, specifically: weighting, aggregation of indicators, robustness, and the participation of experts in the construction of the composite indicators angilella2018robust . Therefore, there is a broad consensus on the appropriateness of multiple criteria decision making (MCDM) methodologies to construct composite indicators saisana2002state ; jacobs2004measuring ; Nardo_2005 as they are highly suitable in multidimensional frameworks. Our approach is based on combining the recently proposed methodology called Multiple Criteria Hierarchy Process (MCHP) corrente2012multiple with Stochastic Multicriteria Acceptability Analysis (SMAA) lahdelma1998smaa . This approach has been previously applied to evaluation problems concerning rankings of universities angilella2016robust and assessment of sustainable rural development angilella2018robust .
The aim of this paper is to propose a CII based on the MCHP-Ch-SMAA methodology to fulfill the need for a hierarchical structure of the EIS and to overcome the criticism regarding weighting, aggregation and robustness in constructing composite indicators. Concerning the weighting problem and the aggregation of indicators, the proposed MCHP-Ch-SMAA approach employs an extension of the weighted sum based on the Choquet integral preference model choquet1953theory ; grabisch1996application , which takes into account the potential interactions between indicators. The CII is based on the judgements (or preferences) of experts representing the three helices of the Triple Helix model, that are, university, government and industry leydesdorff1998triple ; etzkowitz2000dynamics . To facilitate the case of responding and the “readability” of the results for decision makers, university, industry and government preferences with regards to the dimensions of innovation are elicited from pairwise comparisons of indicators. Finally, with respect to robustness, a probabilistic ranking is represented in terms of Rank Acceptability Indices (RAIs) for each country and Pairwise Winning Indices (PWIs) for each pair of countries.
As a main contribution of the research, we propose the application of MCHP-Ch-SMAA to construct CII’s overcoming the limitations of interaction of criteria and robustness concerns related to the elicitation of weights and their aggregation methodology. Trough the EIS application we also overcome the need of a proper scheme for weighting based on a hierarchical structure of dimensions and criteria, thus providing a measurement framework in which the preference information is not required at all the levels of the hierarchy reducing the cognitive effort of the decision maker. As to the challenge of estimating stakeholder’s preferences of innovation this approach provides a more in-depth analysis of the country’s innovation performance at the comprehensive level and for the specific macro-criterion incorporating the Triple Helix framework perspective. This approach is a useful tool to design and deploy policies and practices oriented towards specific Triple Helix agents as it permits to identify strengths and weaknesses for national innovation systems.
The remainder of the paper is organized as follows. In Section 2, the methodological basis regarding the issues of weighting, aggregation and robustness when constructing CII’s are reviewed. Section 3 deals with the proposed methodology combining MCHP and SMAA. In Section 4, a case study related to the ranking of EU countries according to their innovation performance based on EIS criteria and incorporating Triple Helix agents point of view is presented. Conclusions and future lines of research are provided in Section 5.
2 Weighting, aggregation and robustness in Composite Innovation Indicators (CII’s)
During the past twenty years there has been an increasing interest from the research community in the methodological framework of constructing composite indicators, as they have gained increasing popularity as a benchmarking tool for national performances in a wide variety of fields ranging from socio-economic aspects to governance and environmental issues. However, and regardless of the decades of work on the topic, there still is no clear consensus on the best weighting and aggregation system as each method has its own strengths and limitations greco2018methodological . Consequently, particularly problematic has been the assignment of appropriate weights for constructing the CIIs.
Basically, when addressing the weighting problem there are two main groups of approaches in which the weights can be obtained:
-
1.
Objectively, based on statistical methods. Most composite indicators rely on equal weighting (EW) approaches in which all the variables are given the same weight. As such, applying equal weights is a simple but methodologically less robust approach to employing statistical tools to guide the weight calculations. Therefore an alternative is to utilize multivariate statistical approaches, such as, principal component analysis (PCA) AbdiWilliams2010 , in which the weights reflect the contribution of each indicator to the overall composite indicator.
-
2.
Subjectively, by means of participatory methods gathering stakeholders preferences to define the weighting scheme. In this group, the budget allocation approach (BAP), in which a panel of experts are given a fixed budget to be distributed over a number of dimensions, and multi-attribute decision making methods such as the Analytic Hierarchy Process (AHP) saaty1977scaling and conjoint analysis (CA) are among the most commonly applied methodologies for defining weights. In AHP, a complex decision problem is decomposed in a hierarchy of goal, criteria and alternatives generating the weights according to the decision maker’s pairwise comparisons of the criteria. Contrary, in the conjoint analysis the criteria weights are derived from the marginal rates of substitution of the overall utility function induced from preference information supplied by the user.
Another point of major concern is the aggregation methodology. While linear or additive aggregation prevails and it is the most widely used method compatible with all the previous weighting approaches, sometimes geometric aggregation is better suited for the purpose of constructing composite indicators. However, in both cases “compensability” appears paruolo2013ratings , that is, the possibility of offsetting the shortfall in some dimension with a superior performance in another dimension. In multidimensional frameworks, when highly different dimensions should be aggregated, multicriteria decision making methodologies have been claimed as highly suitable alternatives for constructing composite indicators el2019building . For example, giannetti2009reliability and arbolino2018towards utilise elementary multicriteria methods such as simple additive weighting (SAW), to construct composite environmental indexes. Moreover, value and utility based methods keeney1976decision , which include the Multi-Attribute Utility Theory (MAUT) and the Multi-Attribute Value Theory, have been utilized to construct a composite indicator, for example, by cracolici2009attractiveness in their assessment on the attractiveness of tourism destinations, dantsis2010methodological in their effort to measure the sustainability of agricultural plants and carayannis2016multilevel who propose to evaluate the efficiency of national and regional innovation systems based on Data Envelopment Analysis (DEA) developed by charnes1978measuring . The Benefit of the Doubt (BOD) methodology, rooted in DEA has been utilized to construct technology creation composite indicators cherchye2008creating . The MACBETH (Measuring Attractiveness by a Categorical Based Evaluation Technique) approach introduced by e1994macbeth has also been widely used for aggregating performance measurements (see e.g. cliville2007quantitative ). Concerning outranking methods based on comparisons between pairs of options, the most commonly used methods include ELECTRE (Eliminating and Choice Expressing Reality) FigueiraEtAl2013 and PROMETHEE (Preference Ranking Optimization Method for Enrichment Evaluation) BransVincke1985 . For example, by using ELECTRE III, attardi2018non develop a composite indicator for assessing the environmental and social performances of urban and regional planning policies. petrovic2014electre utilize the same methodology for benchmarking the performance of EU Member countries in achieving the key targets of EU’s Digital Agenda, while antanasijevic2017differential apply PROMETHEE II for assessing the sustainability performance of European countries. Additionally, the BOD methodology has been utilized to construct technology creation composite indicators cherchye2008creating .
As shown above, the use of MCDM methodologies in constructing composite indicators has gained increasing popularity in recent years. However, there are only a few MCDM applications focusing on innovation and most of them are related to innovation planning and technological roadmapping, except for the papers by paredes2014ranking where they apply the Interactive and Multicriteria Decision Making (TODIM) (introduced by gomes1992todim ) to rank the performance of national innovation systems in the Iberian Peninsula and Latin America and, more recently, by carayannis2018composite , who combine the AHP framework for setting priorities and the Technique for Order Preference by Similarity to Ideal Solution (TOPSIS) method hwang1981methods for constructing CII.
3 Multiple criteria hierarchy process (MCHP), Choquet integral preference model and Stochastic Multicriteria Acceptability Analysis (SMAA)
The Multiple Criteria Hierarchy Process (MCHP) corrente2012multiple is a methodology recently introduced in Multiple Criteria Decision Aiding (MCDA) greco2016multiple to deal with decision making problems in which the evaluation criteria are not at the same level but they are structured in a hierarchical way. This means that it is possible to define a root node , being the objective of the problem, macro-criteria descending from it, and so on, until the elementary criteria being the criteria placed at the bottom of the hierarchy and on which the alternatives at hand are evaluated. See Figure 1 for an example of the hierarchy of criteria.
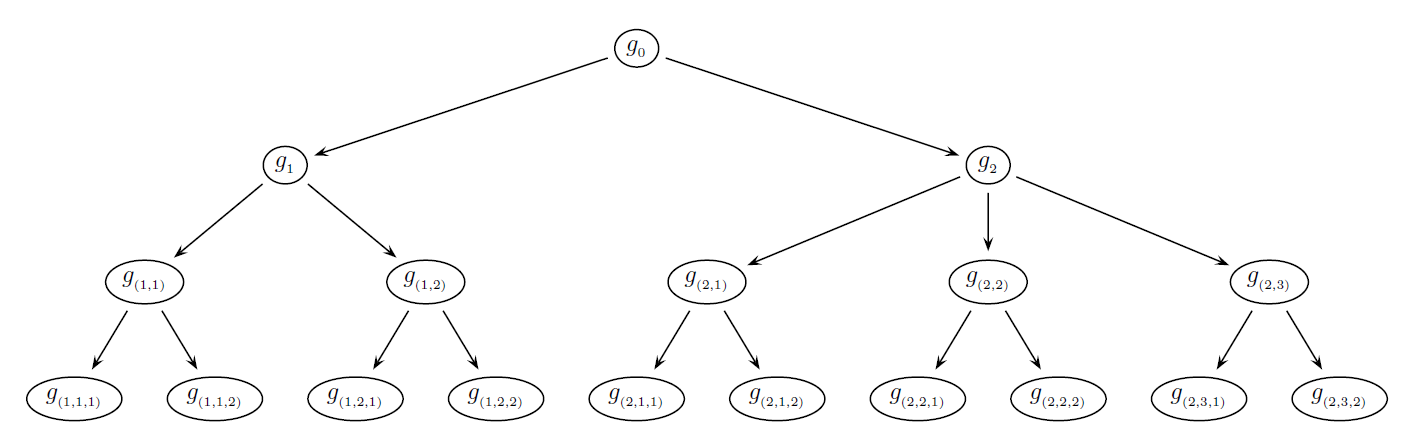
The advantage of taking into account the MCHP is two-fold: (i) it permits the Decision Maker (DM) to provide information on the alternatives not only at the comprehensive level (that is at the level), but also considering a particular criterion in the hierarchy; (ii) it gives deeper information to the DM by defining a preference relation at each node of the hierarchy as well as at the comprehensive level. In this way, the DM can compare the alternatives not only globally, taking therefore into account all aspects simultaneously, but also focusing on the aspects which are relevant for him or her.
In the following, we shall briefly recall the terminology that will be useful for the description of the methodology as well as for the discussion on the results of the considered application:
-
•
denotes the set of alternatives at hand,
-
•
denotes the number of levels in the hierarchy,
-
•
is the root criterion; it represents the main objective of the considered problem,
-
•
is a generic criterion in the hierarchy,
-
•
is the set of subcriteria of at the level ,
-
•
are the elementary criteria, that are the criteria at the lowest level of the hierarchy, while is the set of their indices,
-
•
is the set of the indices of the elementary criteria descending from .
To deal with any decision making problem, the evaluations of the alternatives on the considered criteria need to be aggregated by using one of the following aggregation methodologies that are the Multiple Attribute Value Theory (MAVT) keeney1976decision , the outranking methods roy1996multicriteria and the Dominance-Based Rough Set Approach (DRSA) greco2001rough . In MAVT, one assigns a value to each alternative being representative of its goodness w.r.t. the problem at hand; outranking methods are based on the construction of a binary relation , where means that “ is at least as good as ” for all ; finally, the DRSA build some “if …., then….” decision rules expressed in a easily comprehensible language for the DM linking the alternatives’ evaluations with the final recommendation.
The Choquet integral preference model can be included under the MAVT choquet1953theory ; grabisch1996application . Indeed, it can be considered as a generalization of the weighted sum:
| (1) |
where are the weights of criteria such that for all and ; moreover, is the evaluation of on .
Differently from the weighted sum, the use of the Choquet integral is based on a capacity , being a set function that assigns a weight not only to each single criterion, but to all subsets of criteria such that the monotonicity constraints ( for all and the normalization constraints ( and ) are satisfied.
The main point of the Choquet integral preference model is that it is able to take into account the possible positive or negative interaction existing between criteria. Given , on one hand, we say that , are positively interacting if the importance assigned to them together () is greater than the sum of their importance when considered separately (), while, on the other hand, we say that and are negatively interacting if the importance assigned to them together is lower than the sum of their importance when considered separately. Of course, the same type of interactions can be defined for non-elementary criteria placed at the same level of the hierarchy of criteria.
To make things easier, a Möbius transform of rota1964foundations and -additive capacities grabisch1996application are used in practical applications:
-
•
a Möbius transform of the capacity is a set function such that for all ,
-
•
is called -additive iff its Möbius transform is such that for all such that and there exists at least one , , such that . In general, it is known that 2-additive capacities are able to perfectly represent all preferences provided by the DM mayag2011representation . For this reason, in the following, we shall consider 2-additive capacities only and we shall briefly describe the 2-additive Choquet integral preference model.
Considering 2-additive capacities, the monotonicity and normalization constraints above can be rewritten in the following way:
| (2) |
Therefore, for each and for each criterion in the hierarchy, the Choquet integral of on is computed as
| (3) |
As already mentioned above, in applying the Choquet integral, a single value is assigned to each criterion as well as to all subsets of criteria. Therefore, the importance of a criterion is not dependent on itself only but also on its contribution to all coalitions of criteria. To take into account this aspect, the Shapley index shapley1953value and the Murofushi index murofushi1993techniques are defined:
-
•
the Shapley index , measures the importance of criterion , that is considered as a subcriterion of at the level . Formally, it is computed as follows:
(4) assuming that, of course, ;
-
•
the Murofushi and Soneda index , that measures the importance of the pair of criteria when considered as subcriteria of at the level . Formally, it is computed as follows:
(5)
A complete description of the extension of the Choquet integral to the MCHP can be found in angilella2016robust where it has been introduced at first.
As it is evident from above, the application of the 2-additive Choquet integral preference model involves the knowledge of several parameters: considering the Möbius decomposition , one value for each elementary criterion and one for each pair of elementary criteria. This is much less than the parameters to be elicited in case of a generic capacity not being 2-additive. Anyway, asking the DM to provide directly all these parameters is meaningless both for their huge number as well as for the difficult interpretation of their meaning. For this reason, to fix their values, an indirect elicitation procedure can be used. The DM is asked to provide information in terms of comparison between alternatives (for example, is preferred to ), comparison between criteria ( is more important than , with ) or in terms of interactions between criteria ( and are positively or negatively interacting). This preference information is therefore translated into inequality constraints (for example, the eventual preference of over on is translated into the constraint , while the positive interaction between and is translated into the constraint ; in both cases, is an auxiliary variable used to transform the strict inequality constraints into weak inequality ones). Denoting by the set of constraints translating the preferences provided by the DM, to check if there exists at least one instance of the preference model, that is one vector for which all the technical constraints as well as all constraints translating the preferences provided by the DM () are satisfied, one has to solve the following LP problem:
| (6) | |||
If is feasible and , then there exists at least one instance of the preference model compatible with the preferences provided by the DM (briefly, a compatible model). In the opposite case, there does not exist any compatible model and the reason can be investigated by using one of the methods proposed in MousseauEtAl2003 . In general, if there exists at least one compatible model, there exist many of them. Therefore, providing recommendations w.r.t. the problem at hand using only one of them can be considered arbitrary to some extent. Consequently, in the following, we shall describe the Stochastic Multicriteria Acceptability Analysis (SMAA) lahdelma1998smaa ; tervonen2008survey , methodology applied to the Choquet integral preference model that we have used in our application (for a recent extension of the SMAA methodology see greco2018stochastic ; angilella2018robust ; corrente2018evaluating ).
SMAA provides the DM robust recommendations by considering not just one but the whole set of models compatible with the preferences given by the DM. Since the constraints in define a set composed by an infinite number of vectors, the application of SMAA begins with the sampling of several of them. We shall denote by the set composed of all sampled vectors. To each of these compatible vectors corresponds an alternatives’ ranking, where the rank position of the alternative w.r.t. criterion obtained considering the vector of parameters is computed as
| (7) |
where and . Pay attention to the fact that in the definition of the rank function we used instead of as previously defined, just to underline that the computation of the Choquet integral is made by considering the parameters in the vector .
For each , for each criterion and for each rank position , is therefore possible to consider the set composed of the sampled compatible vectors giving to the position w.r.t. :
| (8) |
Analogously, for each pair of alternatives and for each , it is possible to consider the set composed of all sampled compatible vectors for which is preferred to on :
| (9) |
The recommendations of SMAA are therefore given in statistical terms by computing the following indices:
-
•
Rank Acceptability Index, : gives the frequency with which takes the position on criterion . It is obtained as
(10) -
•
Pairwise Winning Index, : gives the frequency with which is preferred to on . It is computed as
(11)
On the basis of the Rank Acceptability Indices, for each alternative and for each criterion it is possible to compute the best and the worst positions got by on as well as the most frequent ones angilella2018robust .
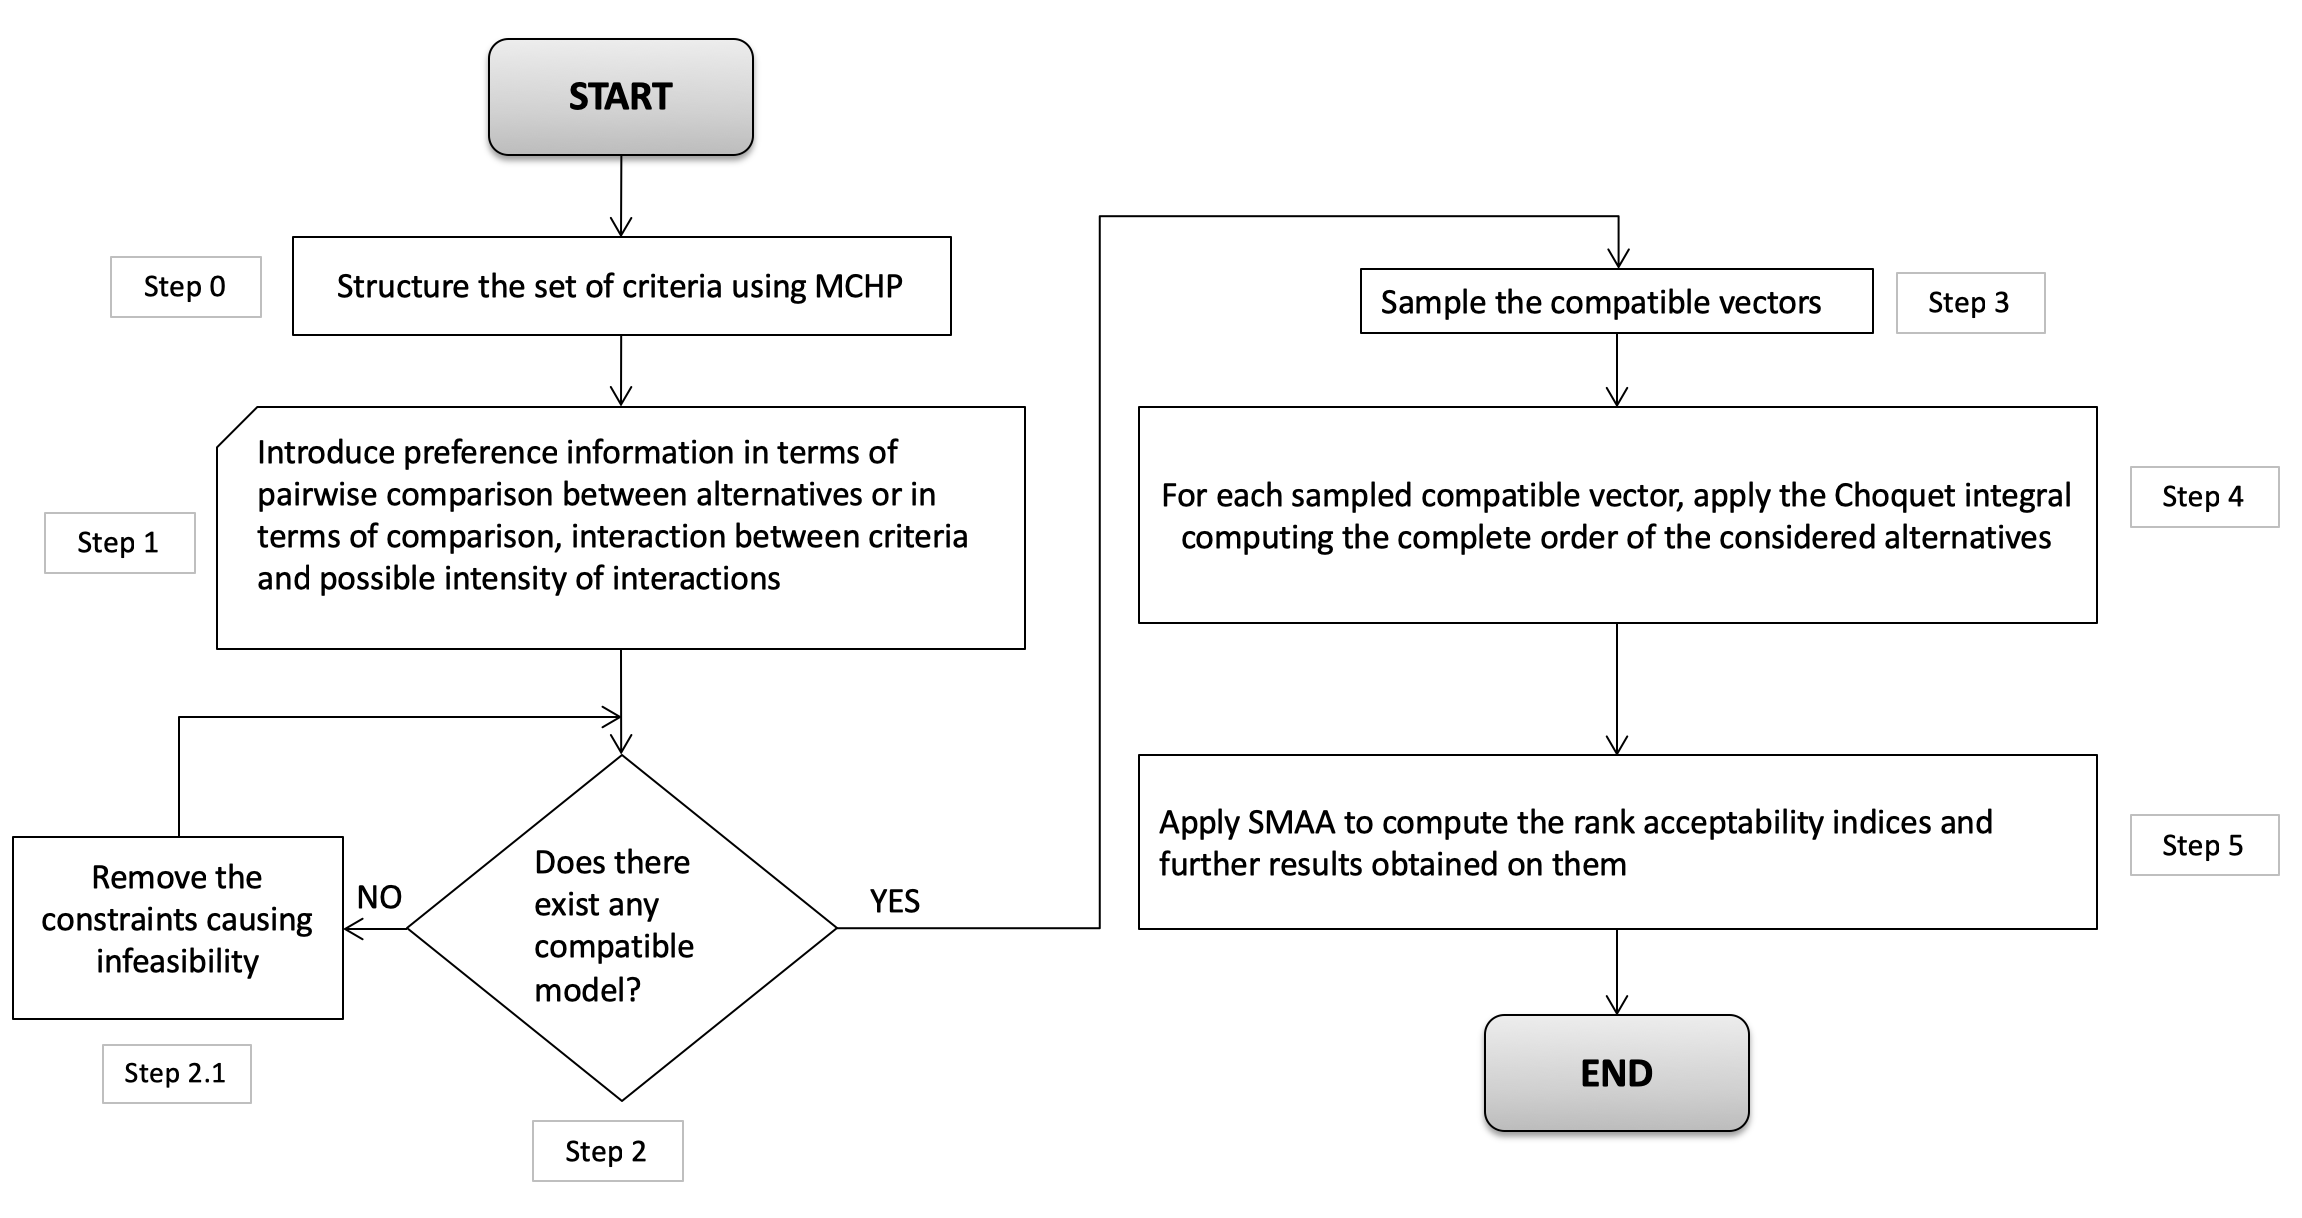
To conclude this section, we shall briefly summarize by means of the flow chart in 2. the main steps of the methodology that has been described and that will be applied to the Triple Helix innovation performance indicator:
- •
-
Step 0: The criteria at hand are structured in a hierarchical way starting from the root until the elementary criteria;
- •
-
Step 1: Each DM is asked to provide his preference information that can be expressed in terms of comparison between alternatives, preferences between criteria, interaction between criteria, or intensity of interaction between criteria;
- •
-
Step 2: Check if there exists at least one model compatible with the preferences provided by the DM by solving the LP (6). If this is not the case, check for the cause of the inconsistency and remove constraints causing the feasibility (Step 2.1). If there is at least one compatible model, pass to step 3;
- •
-
Step 3: Sample several models (capacities in our case) compatible with the preferences provided by the DM in Step 1;
- •
-
Step 4: For each compatible model sampled in Step 3, compute the Choquet integral of each alternative and, therefore, the consequent alternatives’ ranking;
- •
-
Step 5: Apply the SMAA methodology computing for each alternative and for each position in the ranking, the rank acceptability index. On the basis of the obtained rank acceptability indices, compute, for each alternative:
-
1.
Best and worst reachable positions,
-
2.
The ranking positions presenting the highest rank acceptability indices that are, consequently, the most plausible positions for that alternative,
-
3.
The expected ranking obtained by aggregating the different rank acceptability indices as shown in the next section.
-
1.
4 Application and results
To show how the proposed methodology works, we develop a real world application in order to evaluate the innovation performance of 28 countries of the EU with respect to the SII criteria structured in a hierarchical way as shown in Figure 3. The four macro-criteria are Framework Conditions (FC), Investments (IN), Innovation Activities (IA) and Impacts (IMP). They are further decomposed into more detailed criteria as follows:
- •
-
Macro-criterion (FC) is decomposed into:
-
–
Human resources (HR)
-
–
Attractive research systems (ARS)
-
–
Innovation-friendly environment (IFE)
-
–
- •
-
Macro-criterion (IN) is decomposed into:
-
–
Finance and support (FS)
-
–
Firm investments (FI)
-
–
- •
-
Macro-criterion (IA) is decomposed into:
-
–
Innovators (IT)
-
–
Linkages (LIN)
-
–
Intellectual assets (IAS)
-
–
- •
-
Macro-criterion (IMP) is decomposed into:
-
–
Employment impacts (EI)
-
–
Sales effects (SE).
-
–
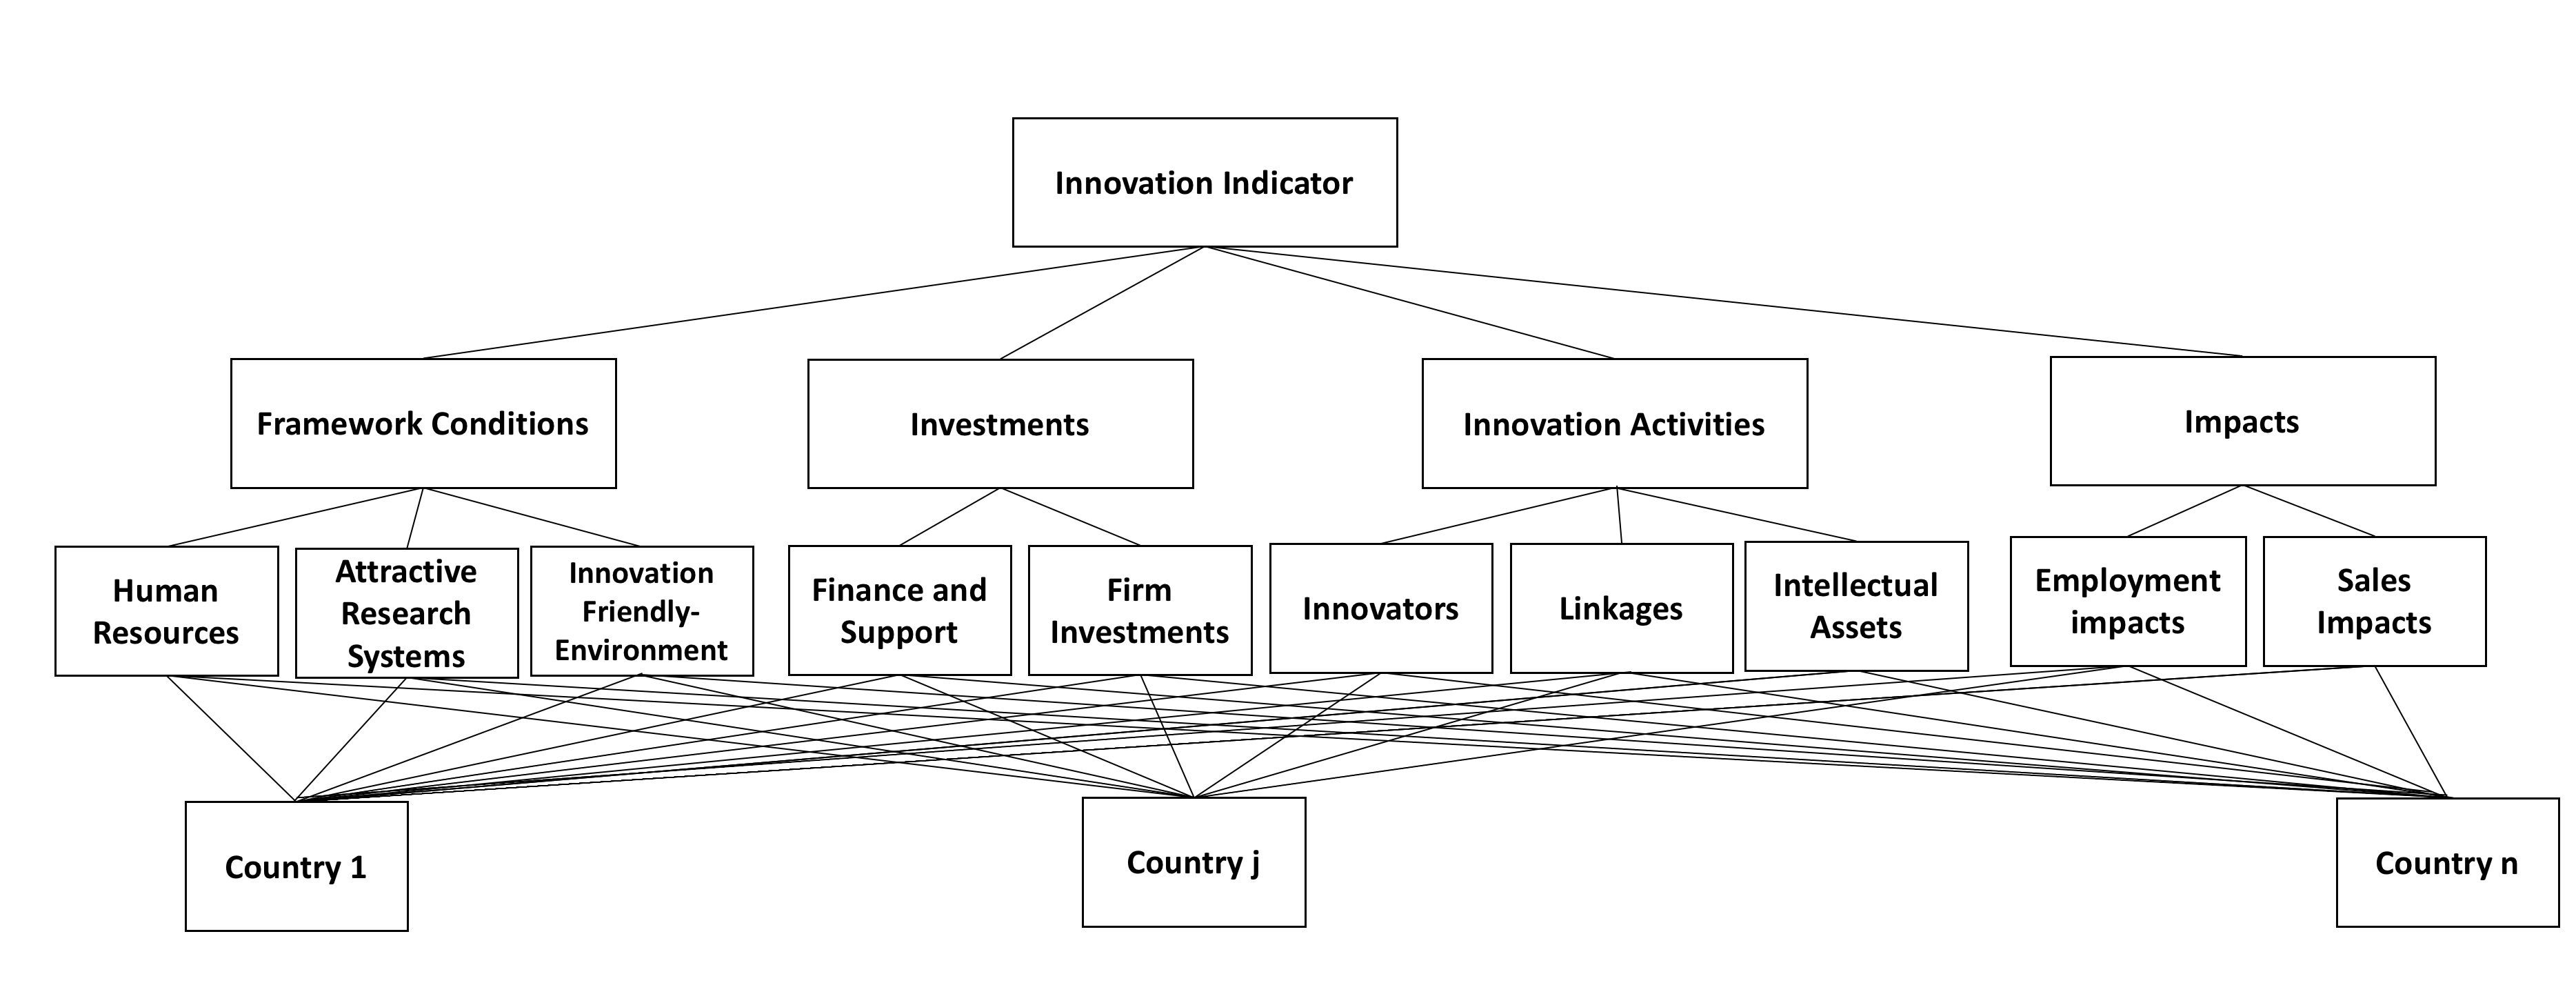
The description of each elementary criterion is given in Table 1, while the evaluations of the 28 countries on these criteria are shown in Table 7 in the appendix.
| Description of the elementary criteria descending from the macrocriteria HR, ARS, IFE, etc… | ||||
| FC () | HR () | New doctorate graduates per 1000 population aged 25-34 () | ||
| Percentage population aged 25-34 having completed tertiary education () | ||||
| Percentage population aged 25-64 participating in lifelong learning () | ||||
| ARS () | International scientific co-publications per million population () | |||
| Scientific publications among the top-10% most cited publications worldwide as percentage | ||||
| of total scientific publications of the country () | ||||
| Foreign doctorate students as a percentage of all doctorate students () | ||||
| IFE () | Broadband penetration: Percentage of enterprises with a maximum contracted download | |||
| speed of the fastest fixed internet connection of at least 100 Mb/s () | ||||
| Opportunity-driven entrepreneurship: ratio between the share of persons | ||||
| involved in improvement-driven entrepreneurship and the share of | ||||
| persons involved in necessity-driven entrepreneurship () | ||||
| IN () | FS () | R&D expenditure in the public sector (percentage of GDP) () | ||
| Venture capital investments (percentage of GDP) | ||||
| FI () | R&D expenditure in the business sector (percentage of GDP) | |||
| Non-R&D innovation expenditure (percentage of turnover) | ||||
| Enterprises providing training to develop or upgrade ICT skills of their personnel | ||||
| IA () | IT () | SMEs with product or process innovations () | ||
| SMEs with marketing or organisational innovations () | ||||
| SMEs innovating in-house () | ||||
| LIN () | Innovative SMEs collaborating with others () | |||
| Public-private co-publications () | ||||
| Private co-funding of public R&D expenditures () | ||||
| IAS () | PCT patent applications () | |||
| Trademark applications () | ||||
| Design applications () | ||||
| IMP | EI | Employment in knowledge-intensive activities | ||
| Employment fast-growing firms innovative sectors | ||||
| Medium & high-tech product exports | ||||
| SE | Knowledge-intensive services exports | |||
| Sales of new-to-market and new-to-firm innovations |
This research focuses on the perception of Triple Helix agents (University, Industry and Government) about the significance of criteria involved in the SII. These agents have different profiles to determine the degree of relative importance of criteria in order to obtain a composite indicator for innovation. To show the potential of our proposed methodology we have simulated the decision making process in order to obtain the information about preferences from a sample of Triple Helix agents. Through a consensus-driven decision-making process, three decision makers per each group agreed the preference information in the form of pairwise comparisons related to importance and interaction of the four macro criteria as well as for the elementary criteria. A pool of experts from different European countries with solid background in knowledge and professional experience concerning innovation has been consulted aiming at reflecting different views of the relative importance of criteria:
-
•
University Experts (DMU): academics expert in the field of innovation from the United Kingdom, technical staff of a University Technology Transfer Office from Spain, and academic expert in the field of EU innovation policies from Spain.
-
•
Industry Experts (DMI): business manager in the field of international business from Belgium, chief innovation officer from Spain, and project manager from Italy.
-
•
Government Experts (DMG): R&D program manager from Germany, the director of a Technological Institute from Spain, and deputy director of a patent and trademark office from Poland.
The DMU group specified the following preference information on the considered macro-criteria as follows.
-
•
FC and IN are more important than IA and IMP; in turn FC is equally important than IN, and IA is more important than IMP.
-
•
With respect to FC, HR and ARS are more important than IFE.
-
•
With respect to IN, FS is more important than FI.
-
•
With respect to IA, LIN is more important than IT and IAS.
-
•
With respect to IMP, EI is more important than SE.
-
•
FC and IN are positively interacting.
-
•
IN and IA are positively interacting.
-
•
IA and IMP are positively interacting.
-
•
The interaction between IN and IA is greater than the interaction between FC and IN, and between IA and IMP.
-
•
The interaction between IA and IMP is greater than the interaction between FC and IN.
-
•
With respect to FC, HR and ARS are positively interacting.
-
•
With respect to IA, IAS and LIN are positively interacting.
-
•
IAS and IT are negatively interacting.
For DMI group, the preference information on the considered macro-criteria was:
-
•
IN is more important than IA, that in turn is more important than IMP, that in turn, is more important than FC.
-
•
With respect to FC, ARS is more important than IFE, which is more important than HR.
-
•
With respect to IN, FS is more important than FI.
-
•
With respect to IA, LIN is more important than IT, that in turn, is more important than IAS.
-
•
With respect to IMP, SE is more important than EI.
-
•
FC and IN are positively interacting.
-
•
IN and IA are positively interacting.
-
•
IA and IMP are positively interacting.
-
•
The interaction between IN and IA is greater than the interaction between FC and IN, and between IA and IMP.
-
•
The interaction between IA and IMP is greater than the interaction between FC and IN.
-
•
With respect to FC, HR and ARS are positively interacting.
-
•
With respect to IA, IAS and LIN are positively interacting.
-
•
IAS and IT are negatively interacting.
Finally, for the DMG group the preference information on the considered macro-criteria was:
-
•
IMP is more important than FC, that in turn, is more important than IN, that in turn, is more important than IA.
-
•
With respect to FC, ARS is more important than IFE, that in turn, is more important than HR.
-
•
With respect to IN, FS is more important than FI.
-
•
With respect to IA, LIN is more important than IAS, that in turn, is more important than IT.
-
•
With respect to IMP, SE is more important than EI.
-
•
FC and IN are positively interacting.
-
•
IN and IMP are positively interacting.
-
•
IA and IMP are positively interacting.
-
•
The interaction between IN and IMP is greater than the interaction between FC and IN, and IA and IMP.
-
•
The interaction between IA and IMP is greater than the interaction between FC and IN.
-
•
With respect to FC, HR and ARS are positively interacting.
-
•
With respect to IA, IAS and LIN are positively interacting.
-
•
IAS and IT are negatively interacting.
The use of the Choquet integral preference model implies that all evaluations are expressed on the same scale. For this reason, before applying it, we performed a normalization of the countries performances proposed in GrecoEtAl2018 and composed of the following steps:
-
1.
First step: for each elementary criterion , compute the mean and the standard deviation of the countries performances on that criterion:
where denotes the set of countries and is the performance of country on ;
-
2.
Second step: for each and for each , the -score is computed: ;
-
3.
Third step: for each and for each , the normalized evaluation is therefore obtained as
if has an increasing direction of preference and
if, instead, has a decreasing direction of preference111On one hand, a criterion has an increasing direction of preference if the more , the better is on , while, on the other hand, a criterion has a decreasing direction of preference if the less , the better is on ..
The normalized evaluations on which the methodology is applied are shown in Table 8 in the appendix.
By applying the MCHP-Ch-SMAA approach to the Triple Helix agents at the comprehensive level and for the four macro-criteria, the rank acceptability indices (RAI) for the best and worst performers as well as the three highest rank acceptability (most frequent positions) indices showing which are the most likely position for a country based on the appreciation of each actor’s capabilities and needs are calculated. Tables 2-4 presents the results concerning the top five and to the bottom three countries. The following observations can be made based on the results:
-
•
With respect to DMU, the top five innovative countries are Sweden, Denmark, Finland, Netherlands and Germany and the last three positions are for Croatia, Bulgaria and Romania. At the macro-criterion level, it is important to note that the rank position for Denmark and Finland significantly varies for the Impact (IMP) dimension. Denmark reached as best position the 7th even if the rank acceptability index is basically zero (0.70%); moreover it reaches most frequently the 12th position with 45.04%. Finland ranks the 10th position with a frequency of 4.11% for the best and 20.69% for the first most frequent position, being the 13th. At the same time, Germany also gets worse positions at the Framework Conditions (FC) being in the 12th position presenting a rank acceptability index of 10.19%. Concerning the last three countries the case of Croatia is worth pointing out, in which its position with respect to macro-criterion investments (IN) moved up to 16th position, even if its frequency is negligible (0.25%) for the best position.
-
•
With respect to DMI, Sweden, Finland, Netherlands, United Kingdom and Denmark can be considered the most innovative countries whereas, Poland, Bulgaria and Romania are in the worst positions. In particular, Finland appears to be quite unstable with respect to macro-criterion Impacts (IMP), although its highest rank acceptability index for the 10th position has a marginal frequency and the most frequent positions range between 17th (24.52%) and 18th position (21.07%). From the industry perspective, in Denmark the dimension corresponding to framework conditions (FC) is highlighted with a rank acceptability index of 98.29%. Among the last three countries, quite stable results are presented at all levels.
-
•
With respect to DMG, the top five countries are Sweden, United Kingdom, Denmark, Netherlands, and Ireland. Croatia, Bulgaria and Romania are placed at the bottom of the ranking. One can observe that Ireland improves its position with respect to DMI and DMG, and moreover, its rank acceptability index for the first position in the macro-criterion impacts (IMP) is quite good (86.33%). Regarding the last positions, while Bulgaria and Romania present the highest rank acceptability indices for the 27th and 28th position (100%), respectively, Croatia has a frequency of 22.04% of being in the 25th position. Furthermore, Croatia has risen to the 7th place in the Investments (IN) with a frequency of 0.11% and to 15th first most frequent position with 52.91%.
| (a) Comprehensive level | Best () | Worst () | () | () | () |
|---|---|---|---|---|---|
| Sweden (SE) | 1 (73.93%) | 2 (26.07%) | 1 (73.93%) | 2 (26.07%) | 28 (0.00%) |
| Denmark (DK) | 1 (26.07%) | 2 (73.93%) | 2 (73.93%) | 1 (26.07%) | 28 (0.00%) |
| Finland (FI) | 3 (64.61%) | 5 (0.13%) | 3 (64.61%) | 4 (35.26%) | 5 (0.13%) |
| Netherlands (NL) | 3 (35.39%) | 5 (1.69%) | 4 (62.92%) | 3 (35.39%) | 5 (1.69%) |
| Germany (DE) | 4 (0.12%) | 10 (0.71%) | 5 (36.17%) | 6 (22.68%) | 7 (19.66%) |
| … | … | … | … | … | … |
| Croatia (HR) | 23 (0.37%) | 26 (82.37%) | 26 (82.37%) | 25 (9.48%) | 24 (7.79%) |
| Bulgaria (BG) | 27 (100.00%) | 27 (100.00%) | 27 (100.00%) | 28 (0.00%) | 26 (0.00%) |
| Romania (RO) | 28 (100.00%) | 28 (100.00%) | 28 (100.00%) | 27 (0.00%) | 26 (0.00%) |
| (b) Framework Conditions (FC) | Best () | Worst () | () | () | () |
| Sweden (SE) | 1 (0.01%) | 2 (99.99%) | 2 (99.99%) | 1 (0.01%) | 28 (0.00%) |
| Denmark (DK) | 1 (99.99%) | 2 (0.01%) | 1 (99.99%) | 2 (0.01%) | 28 (0.00%) |
| Finland (FI) | 3 (36.70%) | 7 (2.92%) | 3 (36.70%) | 4 (24.17%) | 5 (22.71%) |
| Netherlands (NL) | 3 (12.13%) | 6 (0.00%) | 4 (48.60%) | 5 (39.27%) | 3 (12.13%) |
| Germany (DE) | 12 (10.19%) | 18 (0.59%) | 16 (32.91%) | 15 (23.30%) | 14 (19.07%) |
| … | … | … | … | … | … |
| Croatia (HR) | 25 (17.43%) | 28 (4.89%) | 26 (71.16%) | 25 (17.43%) | 27 (6.51%) |
| Bulgaria (BG) | 26 (6.37%) | 28 (15.75%) | 27 (77.88%) | 28 (15.75%) | 26 (6.37%) |
| Romania (RO) | 25 (0.23%) | 28 (78.97%) | 28 (78.97%) | 27 (14.51%) | 26 (6.29%) |
| (c) Investments (IN) | Best () | Worst () | () | () | () |
| Sweden (SE) | 1 (10.81%) | 5 (2.03%) | 2 (48.00%) | 3 (22.44%) | 4 (16.73%) |
| Denmark (DK) | 1 (80.26%) | 4 (0.25%) | 1 (80.26%) | 2 (16.51%) | 3 (2.99%) |
| Finland (FI) | 1 (8.92%) | 5 (0.13%) | 3 (43.75%) | 2 (31.91%) | 4 (15.29%) |
| Netherlands (NL) | 5 (3.15%) | 10 (0.07%) | 6 (57.84%) | 7 (25.69%) | 8 (10.76%) |
| Germany (DE) | 1 (0.01%) | 5 (36.30%) | 4 (48.00%) | 5 (36.30%) | 3 (12.58%) |
| … | … | … | … | … | … |
| Croatia (HR) | 16 (0.25%) | 23 (3.41%) | 19 (29.25%) | 20 (21.81%) | 21 (19.70%) |
| Bulgaria (BG) | 26 (0.20%) | 27 (99.80%) | 27 (99.80%) | 26 (0.20%) | 28 (0.00%) |
| Romania (RO) | 28 (100.00%) | 28 (100.00%) | 28 (100.00%) | 27 (0.00%) | 26 (0.00%) |
| (d) Innovation Activities (IA) | Best () | Worst () | () | () | () |
| Sweden (SE) | 1 (2.76%) | 9 (0.21%) | 6 (37.67%) | 5 (19.75%) | 7 (12.85%) |
| Denmark (DK) | 1 (2.86%) | 9 (5.31%) | 7 (42.14%) | 8 (18.56%) | 6 (12.72%) |
| Finland (FI) | 2 (6.73%) | 7 (0.39%) | 4 (35.35%) | 5 (28.39%) | 3 (22.27%) |
| Netherlands (NL) | 1 (0.57%) | 8 (0.20%) | 3 (37.36%) | 4 (22.97%) | 5 (18.04%) |
| Germany (DE) | 1 (23.84%) | 9 (0.92%) | 1 (23.84%) | 2 (18.78%) | 5 (13.07%) |
| … | … | … | … | … | … |
| Croatia (HR) | 20 (4.85%) | 23 (0.52%) | 22 (62.20%) | 21 (32.43%) | 20 (4.85%) |
| Bulgaria (BG) | 22 (0.32%) | 26 (30.91%) | 25 (47.49%) | 26 (30.91%) | 24 (13.14%) |
| Romania (RO) | 28 (100.00%) | 28 (100.00%) | 28 (100.00%) | 27 (0.00%) | 26 (0.00%) |
| (e) Impacts (IMP) | Best () | Worst () | () | () | () |
| Sweden (SE) | 3 (1.01%) | 9 (0.02%) | 4 (58.67%) | 5 (22.78%) | 6 (14.29%) |
| Denmark (DK) | 7 (0.70%) | 15 (0.31%) | 12 (45.04%) | 11 (14.91%) | 9 (12.46%) |
| Finland (FI) | 10 (4.11%) | 21 (0.24%) | 13 (20.69%) | 14 (18.92%) | 15 (10.01%) |
| Netherlands (NL) | 4 (4.99%) | 9 (5.20%) | 5 (40.53%) | 6 (20.22%) | 7 (14.79%) |
| Germany (DE) | 4 (0.45%) | 9 (10.35%) | 6 (31.79%) | 7 (31.01%) | 8 (18.63%) |
| … | … | … | … | … | … |
| Croatia (HR) | 25 (1.50%) | 28 (39.30%) | 28 (39.30%) | 27 (31.56%) | 26 (27.64%) |
| Bulgaria (BG) | 12 (0.00%) | 27 (0.15%) | 24 (25.01%) | 14 (17.80%) | 25 (16.79%) |
| Romania (RO) | 22 (0.05%) | 28 (40.02%) | 28 (40.02%) | 26 (34.47%) | 27 (15.27%) |
| (a) Comprehensive level | Best () | Worst () | () | () | () |
|---|---|---|---|---|---|
| Sweden (SE) | 1 (100.00%) | 1 (100.00%) | 1 (100.00%) | 28 (0.00%) | 27 (0.00%) |
| Finland (FI) | 2 (59.50%) | 5 (0.56%) | 2 (59.50%) | 3 (36.33%) | 4 (3.61%) |
| Netherlands (NL) | 2 (1.02%) | 7 (4.47%) | 4 (53.21%) | 5 (26.09%) | 3 (10.12%) |
| United Kingdom (UK) | 2 (11.85%) | 8 (0.32%) | 5 (22.07%) | 6 (21.82%) | 3 (17.52%) |
| Denmark (DK) | 2 (8.74%) | 7 (13.02%) | 5 (27.38%) | 3 (21.84%) | 6 (17.69%) |
| … | … | … | … | … | … |
| Poland (PL) | 25 (31.15%) | 26 (68.85%) | 26 (68.85%) | 25 (31.15%) | 28 (0.00%) |
| Bulgaria (BG) | 27 (98.94%) | 28 (1.06%) | 27 (98.94%) | 28 (1.06%) | 26 (0.00%) |
| Romania (RO) | 27 (1.06%) | 28 (98.94%) | 28 (98.94%) | 27 (1.06%) | 26 (0.00%) |
| (b) Framework Conditions (FC) | Best () | Worst () | () | () | () |
| Sweden (SE) | 2 (93.76%) | 3 (6.24%) | 2 (93.76%) | 3 (6.24%) | 28 (0.00%) |
| Finland (FI) | 3 (22.12%) | 7 (0.56%) | 4 (38.03%) | 5 (33.71%) | 3 (22.12%) |
| Netherlands (NL) | 3 (7.33%) | 6 (0.16%) | 4 (50.80%) | 5 (41.71%) | 3 (7.33%) |
| United Kingdom (UK) | 4 (0.16%) | 8 (0.42%) | 6 (69.30%) | 7 (24.99%) | 5 (5.12%) |
| Denmark (DK) | 1 (98.29%) | 2 (1.71%) | 1 (98.29%) | 2 (1.71%) | 28 (0.00%) |
| … | … | … | … | … | … |
| Poland (PL) | 21 (0.80%) | 27 (0.33%) | 25 (90.92%) | 26 (4.11%) | 24 (2.96%) |
| Bulgaria (BG) | 25 (0.75%) | 28 (40.08%) | 28 (40.08%) | 27 (33.06%) | 26 (26.11%) |
| Romania (RO) | 25 (0.82%) | 28 (33.98%) | 26 (38.17%) | 28 (33.98%) | 27 (27.03%) |
| (c) Investments (IN) | Best () | Worst () | () | () | () |
| Sweden (SE) | 1 (12.89%) | 5 (0.64%) | 2 (46.28%) | 3 (27.77%) | 1 (12.89%) |
| Finland (FI) | 1 (59.91%) | 5 (0.07%) | 1 (59.91%) | 2 (26.76%) | 4 (7.07%) |
| Netherlands (NL) | 4 (0.62%) | 12 (0.17%) | 9 (26.05%) | 10 (18.77%) | 5 (17.59%) |
| United Kingdom (UK) | 3 (12.75%) | 10 (0.04%) | 4 (43.47%) | 5 (21.65%) | 6 (13.92%) |
| Denmark (DK) | 3 (0.17%) | 15 (5.52%) | 8 (18.82%) | 12 (14.76%) | 10 (13.55%) |
| … | … | … | … | … | … |
| Poland (PL) | 16 (0.50%) | 23 (3.23%) | 22 (55.99%) | 20 (10.79%) | 18 (9.56%) |
| Bulgaria (BG) | 24 (18.06%) | 27 (12.92%) | 25 (47.41%) | 26 (21.61%) | 24 (18.06%) |
| Romania (RO) | 27 (1.67%) | 28 (98.33%) | 28 (98.33%) | 27 (1.67%) | 26 (0.00%) |
| (d) Innovation Activities (IA) | Best () | Worst () | () | () | () |
| Sweden (SE) | 1 (0.37%) | 9 (0.01%) | 6 (45.63%) | 5 (31.10%) | 4 (9.58%) |
| Finland (FI) | 2 (12.52%) | 7 (0.88%) | 4 (47.23%) | 3 (20.25%) | 5 (16.57%) |
| Netherlands (NL) | 2 (2.78%) | 8 (0.06%) | 3 (52.34%) | 4 (19.57%) | 5 (11.84%) |
| United Kingdom (UK) | 5 (0.04%) | 15 (0.74%) | 8 (35.68%) | 9 (26.49%) | 10 (11.65%) |
| Denmark (DK) | 1 (3.20%) | 10 (1.47%) | 7 (62.57%) | 6 (10.63%) | 8 (8.73%) |
| … | … | … | … | … | … |
| Poland (PL) | 26 (16.33%) | 27 (83.67%) | 27 (83.67%) | 26 (16.33%) | 28 (0.00%) |
| Bulgaria (BG) | 24 (1.04%) | 26 (55.27%) | 26 (55.27%) | 25 (43.69%) | 24 (1.04%) |
| Romania (RO) | 28 (100.00%) | 28 (100.00%) | 28 (100.00%) | 27 (0.00%) | 26 (0.00%) |
| (e) Impacts (IMP) | Best () | Worst () | () | () | () |
| Sweden (SE) | 4 (17.80%) | 9 (11.71%) | 5 (31.69%) | 6 (18.39%) | 4 (17.80%) |
| Finland (FI) | 10 (0.00%) | 20 (0.60%) | 17 (24.52%) | 15 (22.34%) | 18 (21.07%) |
| Netherlands (NL) | 5 (1.98%) | 13 (1.29%) | 6 (26.26%) | 11 (23.41%) | 7 (13.11%) |
| United Kingdom (UK) | 1 (1.93%) | 6 (0.00%) | 2 (52.43%) | 3 (36.50%) | 4 (5.75%) |
| Denmark (DK) | 7 (0.06%) | 16 (2.27%) | 13 (24.64%) | 14 (20.41%) | 12 (18.12%) |
| … | … | … | … | … | … |
| Poland (PL) | 14 (0.04%) | 23 (0.44%) | 21 (46.06%) | 19 (23.53%) | 20 (21.05%) |
| Bulgaria (BG) | 21 (0.29%) | 28 (5.94%) | 27 (34.62%) | 26 (29.00%) | 25 (20.58%) |
| Romania (RO) | 18 (0.01%) | 27 (0.58%) | 22 (49.53%) | 23 (14.05%) | 25 (8.22%) |
| (a) Comprehensive level | Best () | Worst () | () | () | () |
|---|---|---|---|---|---|
| Sweden (SE) | 1 (71.99%) | 3 (1.44%) | 1 (71.99%) | 2 (26.58%) | 3 (1.44%) |
| United Kingdom (UK) | 1 (28.01%) | 6 (0.34%) | 2 (48.51%) | 1 (28.01%) | 4 (10.52%) |
| Denmark (DK) | 2 (22.77%) | 6 (0.29%) | 3 (29.89%) | 5 (29.08%) | 2 (22.77%) |
| Netherlands (NL) | 2 (0.71%) | 6 (3.55%) | 4 (45.68%) | 3 (29.81%) | 5 (20.26%) |
| Ireland (IE) | 2 (1.44%) | 8 (0.71%) | 3 (27.34%) | 5 (21.85%) | 4 (20.74%) |
| … | … | … | … | … | … |
| Croatia (HR) | 25 (22.04%) | 26 (77.96%) | 26 (77.96%) | 25 (22.04%) | 28 (0.00%) |
| Bulgaria (BG) | 27 (100.00%) | 27 (100.00%) | 27 (100.00%) | 28 (0.00%) | 26 (0.00%) |
| Romania (RO) | 28 (100.00%) | 28 (100.00%) | 28 (100.00%) | 27 (0.00%) | 26 (0.00%) |
| (b) Framework Conditions (FC) | Best () | Worst () | () | () | () |
| Sweden (SE) | 2 (86.00%) | 3 (14.00%) | 2 (86.00%) | 3 (14.00%) | 28 (0.00%) |
| United Kingdom (UK) | 4 (1.94%) | 7 (11.19%) | 6 (71.88%) | 5 (15.00%) | 7 (11.19%) |
| Denmark (DK) | 1 (96.03%) | 2 (3.97%) | 1 (96.03%) | 2 (3.97%) | 28 (0.00%) |
| Netherlands (NL) | 3 (0.13%) | 6 (0.19%) | 5 (56.09%) | 4 (43.59%) | 6 (0.19%) |
| Ireland (IE) | 7 (0.56%) | 11 (0.54%) | 10 (46.75%) | 9 (38.22%) | 8 (13.93%) |
| … | … | … | … | … | … |
| Croatia (HR) | 25 (3.13%) | 28 (26.34%) | 26 (51.66%) | 28 (26.34%) | 27 (18.86%) |
| Bulgaria (BG) | 25 (0.01%) | 28 (20.42%) | 27 (59.88%) | 28 (20.42%) | 26 (19.68%) |
| Romania (RO) | 25 (1.26%) | 28 (52.84%) | 28 (52.84%) | 26 (25.10%) | 27 (20.80%) |
| (c) Investments (IN) | Best () | Worst () | () | () | () |
| Sweden (SE) | 1 (5.45%) | 5 (0.85%) | 3 (47.25%) | 2 (31.45%) | 4 (15.01%) |
| United Kingdom (UK) | 2 (4.47%) | 10 (0.54%) | 4 (54.20%) | 3 (15.36%) | 5 (11.42%) |
| Denmark (DK) | 3 (0.35%) | 15 (0.57%) | 12 (15.82%) | 10 (15.80%) | 8 (15.56%) |
| Netherlands (NL) | 3 (0.11%) | 12 (0.13%) | 5 (35.37%) | 9 (19.51%) | 8 (14.68%) |
| Ireland (IE) | 6 (1.13%) | 16 (0.01%) | 10 (23.77%) | 11 (17.28%) | 12 (17.11%) |
| … | … | … | … | … | … |
| Croatia (HR) | 7 (0.11%) | 20 (0.03%) | 15 (52.91%) | 16 (34.59%) | 17 (4.15%) |
| Bulgaria (BG) | 24 (1.37%) | 27 (25.74%) | 25 (49.44%) | 27 (25.74%) | 26 (23.45%) |
| Romania (RO) | 27 (3.16%) | 28 (96.84%) | 28 (96.84%) | 27 (3.16%) | 26 (0.00%) |
| (d) Innovation Activities (IA) | Best () | Worst () | () | () | () |
| Sweden (SE) | 1 (3.39%) | 8 (1.95%) | 6 (42.44%) | 7 (19.02%) | 5 (17.85%) |
| United Kingdom (UK) | 5 (0.38%) | 15 (0.30%) | 9 (35.67%) | 8 (18.60%) | 10 (18.19%) |
| Denmark (DK) | 1 (4.32%) | 11 (0.06%) | 7 (41.66%) | 8 (17.47%) | 6 (9.59%) |
| Netherlands (NL) | 2 (6.37%) | 8 (0.52%) | 3 (41.54%) | 4 (20.72%) | 5 (15.22%) |
| Ireland (IE) | 9 (1.86%) | 16 (3.94%) | 11 (25.36%) | 12 (18.96%) | 10 (14.96%) |
| … | … | … | … | … | … |
| Croatia (HR) | 21 (1.31%) | 23 (3.59%) | 22 (95.10%) | 23 (3.59%) | 21 (1.31%) |
| Bulgaria (BG) | 23 (2.37%) | 26 (44.19%) | 26 (44.19%) | 25 (38.63%) | 24 (14.80%) |
| Romania (RO) | 28 (100.00%) | 28 (100.00%) | 28 (100.00%) | 27 (0.00%) | 26 (0.00%) |
| (e) Impacts (IMP) | Best () | Worst () | () | () | () |
| Sweden (SE) | 4 (0.80%) | 14 (0.36%) | 9 (37.61%) | 10 (18.47%) | 6 (14.26%) |
| United Kingdom (UK) | 1 (13.67%) | 3 (2.80%) | 2 (83.53%) | 1 (13.67%) | 3 (2.80%) |
| Denmark (DK) | 7 (4.70%) | 19 (2.78%) | 15 (20.86%) | 16 (15.60%) | 17 (12.43%) |
| Netherlands (NL) | 4 (12.56%) | 11 (0.21%) | 8 (51.78%) | 5 (14.36%) | 4 (12.56%) |
| Ireland (IE) | 1 (86.33%) | 2 (13.67%) | 1 (86.33%) | 2 (13.67%) | 28 (0.00%) |
| … | … | … | … | … | … |
| Croatia (HR) | 27 (28.98%) | 28 (71.02%) | 28 (71.02%) | 27 (28.98%) | 26 (0.00%) |
| Bulgaria (BG) | 17 (0.14%) | 27 (2.00%) | 22 (18.71%) | 25 (17.70%) | 26 (16.59%) |
| Romania (RO) | 20 (0.01%) | 27 (9.18%) | 26 (53.40%) | 25 (13.72%) | 27 (9.18%) |
As explained in KadzinskiMichalski2016 , the expected ranking is computed as a summary of the rank acceptability indices of each country. Analogously, the expected ranking of each country at comprehensive level is computed and results are shown in Table 5. For each , and for each criterion in the hierarchy, the expected ranking of on is computed as follows:
On the basis of the values , the countries are therefore ordered from the best to the worst on each criterion .
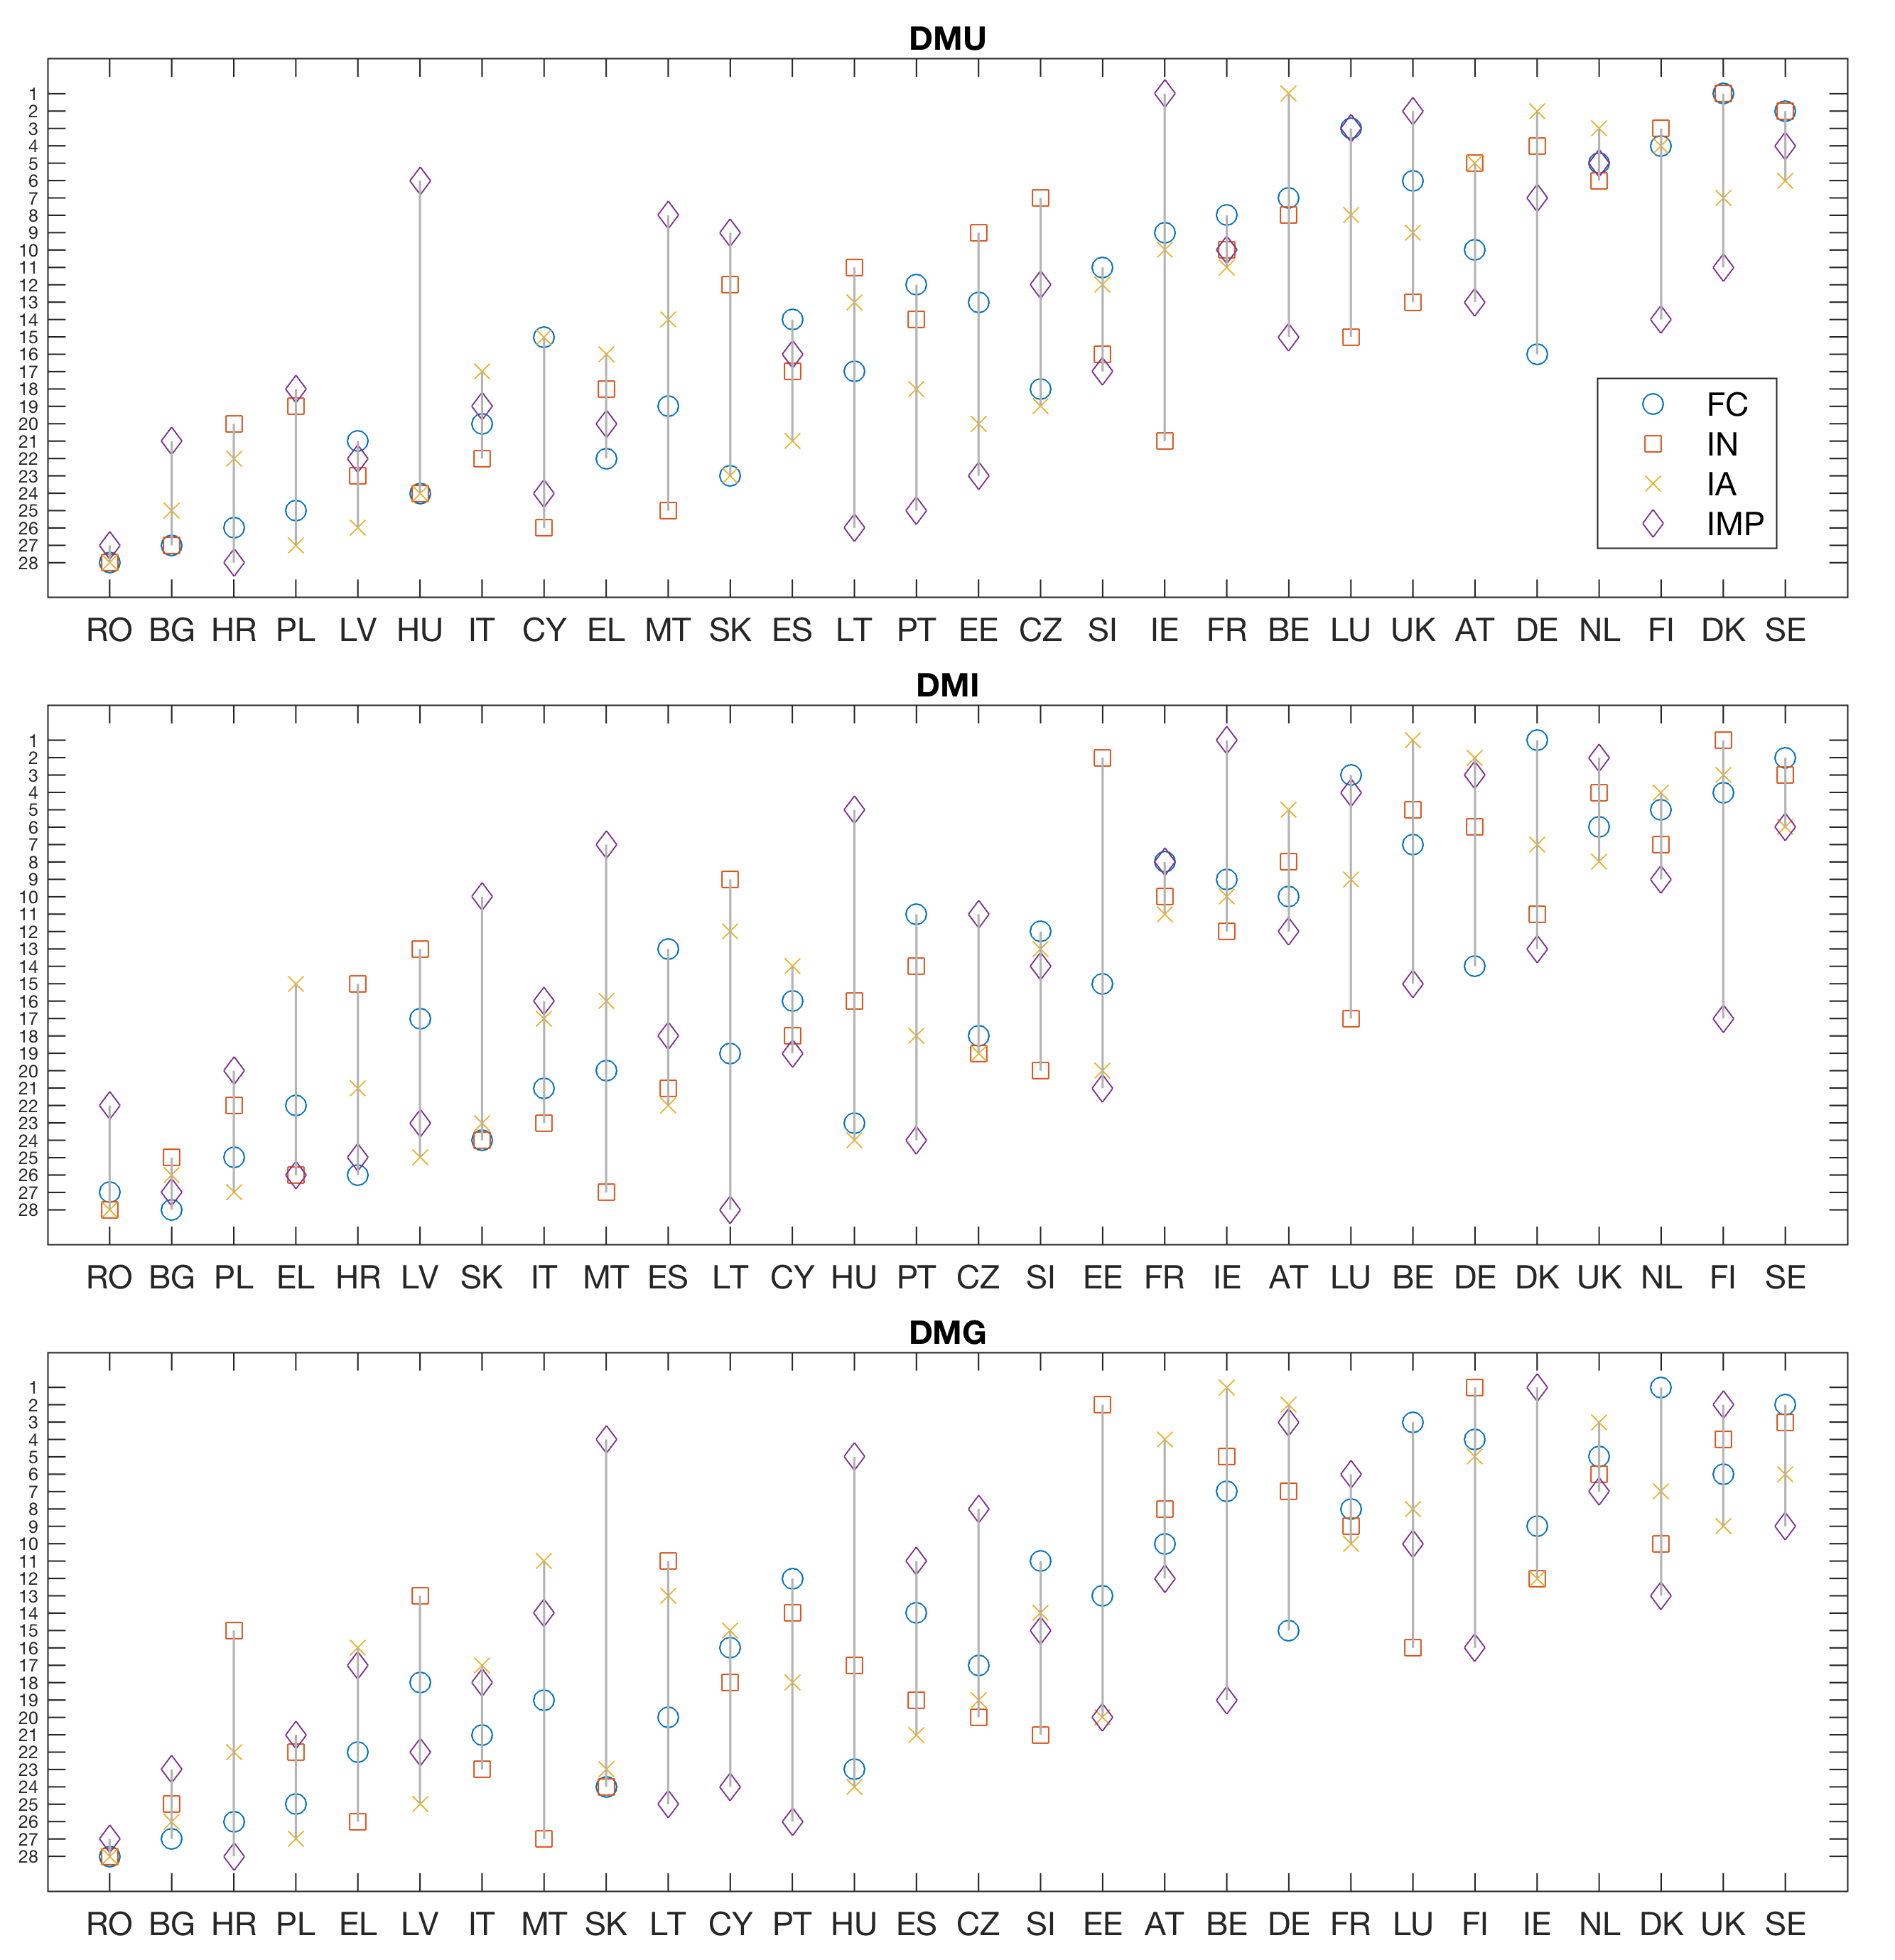
Figure 4 plots the expected rankings of the countries at the comprehensive level in the X-axis as well as the expected rankings at the macro-criteria level in the Y-axis per each Triple Helix actor. In this figure, top tier countries appear on the top right-hand corner for each Triple Helix agent and also maintain leading positions at the macro-criteria level. When analysing Figure 4 we should draw attention to some countries. Looking at the comprehensive level (X-axis), Finland (FI), one of the nations in the top five, lies in the third position according to university decision makers (DMU), the second from the industry (DMI) perspective but only sixth from the governments ranking (DMG). When looking at the macro-criteria level (Y-axis), we can observe that the macro-criterion investments (IN) are the best valued and impacts (IMP) has the worst position for all the actors.
Another example is Ireland (IE) which has significant positive discrepancies in the government (DMG) ranking (fifth position) while it has a worse position (eleventh and tenth) according to university (DMU) and industry (DMI) preferences (X-axis). Attending at the macro-criteria level (Y-axis) we can observe some similarities across all the Triple Helix actors: impacts (IMP) were considered the most and investments (IN) the least valued dimension by all the groups of experts but mainly by university point of view.
To better understand the potentialities of our approach, in Table 5 we reported also the global country ranking provided by the EIS. Looking at the results, it seems there is a consensus among the Triple Helix agents that Sweden is the most innovative country while Bulgaria and Romania get the worst positions in all rankings. There is a small difference in the positions of Croatia, Czech Republic, Italy, Latvia, Luxembourg, Netherlands, Poland, Portugal and Slovenia. However, there is a significant deviation of at least three ranking positions in Belgium, Denmark, Germany, Estonia, Ireland, Greece, Spain, France, Cyprus, Lithuania, Hungary, Malta, Austria, Slovakia, Finland, and United Kingdom (see Table 6).
| Country | University | Industry | Government | EIS |
|---|---|---|---|---|
| Belgium (BE) | 9 | 7 | 10 | 9 |
| Bulgaria (BG) | 27 | 27 | 27 | 27 |
| Czech Republic (CZ) | 13 | 14 | 14 | 13 |
| Denmark (DK) | 2 | 5 | 3 | 2 |
| Germany (DE) | 5 | 6 | 9 | 6 |
| Estonia (EE) | 14 | 12 | 12 | 15 |
| Ireland (IE) | 11 | 10 | 5 | 10 |
| Grece (EL) | 20 | 25 | 24 | 22 |
| Spain (ES) | 17 | 19 | 15 | 17 |
| France (FR) | 10 | 11 | 8 | 11 |
| Croatia (HR) | 26 | 24 | 26 | 26 |
| Italy (IT) | 22 | 21 | 22 | 19 |
| Cyprus (CY) | 21 | 17 | 18 | 20 |
| Latvia (LV) | 24 | 23 | 23 | 24 |
| Lithuania (LT) | 16 | 18 | 19 | 16 |
| Luxembourg (LU) | 8 | 8 | 7 | 8 |
| Hungary (HU) | 23 | 16 | 16 | 23 |
| Malta (MT) | 19 | 20 | 21 | 18 |
| Netherland (NL) | 4 | 3 | 4 | 4 |
| Austria (AT) | 6 | 9 | 11 | 7 |
| Poland (PL) | 25 | 26 | 25 | 25 |
| Portugal (PT) | 15 | 15 | 17 | 14 |
| Romania (RO) | 28 | 28 | 28 | 28 |
| Slovenia (SI) | 12 | 13 | 13 | 12 |
| Slovakia (SK) | 18 | 22 | 20 | 21 |
| Finland (FI) | 3 | 2 | 6 | 3 |
| Sweden (SE) | 1 | 1 | 1 | 1 |
| United Kingdom (UK) | 7 | 4 | 2 | 5 |
| Country | University | Industry | Government |
|---|---|---|---|
| Belgium (BE) | |||
| Denmark (DK) | |||
| Germany (DE) | |||
| Estonia (EE) | |||
| Ireland (IE) | |||
| Greece (EL) | |||
| Spain (ES) | |||
| France (FR) | |||
| Cyprus (CY) | |||
| Lithuania (LT) | |||
| Hungary (HU) | |||
| Malta (MT) | |||
| Austria (AT) | |||
| Slovakia (SK) | |||
| Finland (FI) | |||
| United Kingdom (UK) |
The complete results of the application of MCHP-Ch-SMAA methodology to the 28 countries at the comprehensive level and to the four macro-criteria are provided for the interested reader by downloading the following folder:
www.antoniocorrente.it/wwwsn/images/allegati_articoli/Supplementary%20Material.zip.
5 Concluding remarks and future research
Promoting innovation is considered a key policy instrument to enhance competitiveness. To this end, it is also important to monitor national innovation performances. Recent approaches for assessing the innovation of countries have adopted composite indicators. In this paper, we firstly reviewed the state of the art and outlined recent development on CIIs. One of the main criticism made in the construction of composite indicators concerns the issues of weighting and aggregation as well as the necessity to take into account a hierarchical structure of criteria. In the weighting stage, objective approaches such as “equal weighting” are one of the most widely used methods to avoid inconsistencies or subjectivity. However equal weighting is often considered as unrealistic. Therefore, to overcome the limitations of the existing EIS approach based on “equal weighting” we propose a methodology that incorporates different preferences of the Triple Helix agents (university, industry and government) by utilizing a multicriteria decision framework combining the Multiple Criteria Hierarchy Process (MCHP) with the Stochastic Multicriteria Acceptability Analysis (SMAA) and the Choquet integral preference model. As a result, the CII constructed here takes into account: (i) the hierarchical organization of the EIS; (ii) the interaction of elementary indicators; (iii) the involvement of the Triple Helix agents preferences (University, Industry and Government) in the construction of the CII and; (iv) the consideration of robustness issues related to the stability of the results regarding the variability of the weights assigned to the dimensions of EIS.
This approach provides a more in-depth analysis of the countries innovation performance at the comprehensive level and for the specific macro-criterion incorporating the Triple Helix framework perspective. This proposal can be a valuable tool for innovation policy makers and practitioners to first, identify the strengths and weaknesses of their respective national innovation systems and, thus, second to design, deploy and develop specific policies and practices accordingly.
Finally as in our research we are assuming that a group of experts for each group of the Triple Helix agree on the preference information that we are listing, a further direction of research could be to investigate how integrate the preferences of several experts in the decision making process. Moreover, while we are confident that the proposed methodology can also be applied to other domains (besides the measurement of innovation performance) where composite indicators are used, we acknowledge that further systematical comparisons between the EIS methodology discussed in this paper and other frameworks (such as the GII) are still needed to validate the feasibility of our approach beyond the case presented here. Further research would also benefit from testing the applicability of the outranking approach in the aggregation stage of composite indicators by adopting ELECTRE and PROMETHEE methods to overcome the limitations related to the “compensability” between criteria.
References
- (1) Abdi, H., Williams, L.: Principal component analysis. Wiley Interdisciplinary Reviews: Computational Statistics 2(4), 433–459 (2010)
- (2) Adam, F.: Measuring national innovation performance: the innovation union scoreboard revisited. Berlin: Springer (2014)
- (3) Angilella, S., Catalfo, P., Corrente, S., Giarlotta, G., Greco, S., Rizzo, M.: Robust sustainable development assessment with composite indices aggregating interacting dimensions: the hierarchical-SMAA-Choquet integral approach. Knowledge Based Systems 158, 136–153 (2018)
- (4) Angilella, S., Corrente, S., Greco, S., Słowiński, R.: Robust Ordinal Regression and Stochastic Multiobjective Acceptability Analysis in multiple criteria hierarchy process for the Choquet integral preference model. Omega 63, 154–169 (2016)
- (5) Antanasijević, D., Pocajt, V., Ristić, M., Perić-Grujić, A.: A differential multi-criteria analysis for the assessment of sustainability performance of European countries: beyond country ranking. Journal of Cleaner Production 165, 213–220 (2017)
- (6) Arbolino, R., De Simone, L., Carlucci, F., Yigitcanlar, T., Ioppolo, G.: Towards a sustainable industrial ecology: implementation of a novel approach in the performance evaluation of Italian regions. Journal of Cleaner Production 178, 220–236 (2018)
- (7) Attardi, R., Cerreta, M., Sannicandro, V., Torre, C.M.: Non-compensatory composite indicators for the evaluation of urban planning policy: the land-use policy efficiency index (LUPEI). European Journal of Operational Research 264(2), 491–507 (2018)
- (8) Brans, J., Vincke, P.: A preference ranking organisation method: The PROMETHEE method for MCDM. Management Science 31(6), 647–656 (1985)
- (9) Carayannis, E.G., Goletsis, Y., Grigoroudis, E.: Composite innovation metrics: MCDA and the quadruple innovation helix framework. Technological Forecasting and Social Change 131, 4–17 (2018)
- (10) Carayannis, E.G., Grigoroudis, E., Goletsis, Y.: A multilevel and multistage efficiency evaluation of innovation systems: a multiobjective DEA approach. Expert Systems with Applications 62, 63–80 (2016)
- (11) Charnes, A., Cooper, W.W., Rhodes, E.: Measuring the efficiency of decision making units. European Journal of Operational Research 2(6), 429–444 (1978)
- (12) Cherchye, L., Moesen, W., Rogge, N., Van Puyenbroeck, T., Saisana, M., Saltelli, A., Liska, R., Tarantola, S.: Creating composite indicators with dea and robustness analysis: the case of the technology achievement index. Journal of the Operational Research Society 59(2), 239–251 (2008)
- (13) Choquet, G.: Theory of capacities. Annales de l’institut Fourier 5, 131–295 (1953)
- (14) Cliville, V., Berrah, L., Mauris, G.: Quantitative expression and aggregation of performance measurements based on the MACBETH multi-criteria method. International Journal of Production Economics 105(1), 171–189 (2007)
- (15) Corrente, S., Greco, S., Nicotra, M., Romano, M., Schillaci, C.E.: Evaluating and comparing entrepreneurial ecosystems using smaa and smaa-s. The Journal of Technology Transfer pp. 1–35 (2018)
- (16) Corrente, S., Greco, S., Słowiński, R.: Multiple criteria hierarchy process in robust ordinal regression. Decision Support Systems 53(3), 660–674 (2012)
- (17) Bana e Costa, C., Vansnick, J.C.: MACBETH - An interactive path towards the construction of cardinal value functions. International Transactions in Operational Research 1(4), 489–500 (1994)
- (18) Cracolici, M.F., Nijkamp, P.: The attractiveness and competitiveness of tourist destinations: A study of southern Italian regions. Tourism Management 30(3), 336–344 (2009)
- (19) Dantsis, T., Douma, C., Giourga, C., Loumou, A., Polychronaki, E.A.: A methodological approach to assess and compare the sustainability level of agricultural plant production systems. Ecological Indicators 10(2), 256–263 (2010)
- (20) Dutta, S., Lanvin, B., Wunsch-Vincen, S.E.: The Global Innovation Index 2017. Geneve: WICO ((2017))
- (21) Edquist, C., Zabala, J.M.: The Innovation Union Scoreboard is flawed: the case of Sweden–not being the innovation leader of the EU. Lund: CIRCLE ((2015))
- (22) El Gibari, S., Gómez, T., Ruiz, F.: Building composite indicators using multicriteria methods: a review. Journal of Business Economics 89(1), 1–24 (2019)
- (23) Etzkowitz, H., Leydesdorff, L.: The dynamics of innovation: from National Systems and “Mode 2” to a Triple Helix of university–industry–government relations. Research policy 29(2), 109–123 (2000)
- (24) Figueira, J., Greco, S., Roy, B., Słowiński, R.: An overview of ELECTRE methods and their recent extensions. Journal of Multicriteria Decision Analysis 20, 61–85 (2013)
- (25) Foray, D., Hollanders, H.: An assessment of the Innovation Union Scoreboard as a tool to analyse national innovation capacities: the case of Switzerland. Research Evaluation 24(2), 213–228 (2015)
- (26) Giannetti, B., Bonilla, S., Silva, C., Almeida, C.: The reliability of experts’ opinions in constructing a composite environmental index: the case of ESI 2005. Journal of Environmental Management 90(8), 2448–2459 (2009)
- (27) Gomes, L., Lima, M.: TODIM: Basics and application to multicriteria ranking of projects with environmental impacts. Foundations of Computing and Decision Sciences 16(4), 113–127 (1992)
- (28) Grabisch, M.: The application of fuzzy integrals in multicriteria decision making. European Journal of Operational Research 89(3), 445–456 (1996)
- (29) Greco, S., Ehrgott, M., Figueira, J.: Multiple Criteria Decision Analysis: State of the Art Surveys. Springer, Berlin (2016)
- (30) Greco, S., Ishizaka, A., Matarazzo, B., Torrisi, G.: Stochastic multi-attribute acceptability analysis (smaa): an application to the ranking of italian regions. Regional Studies 52(4), 585–600 (2018)
- (31) Greco, S., Ishizaka, A., Matarazzo, B., Torrisi, G.: Stochastic multi-attribute acceptability analysis (SMAA): an application to the ranking of Italian regions. Regional Studies 52(4), 585–600 (2018)
- (32) Greco, S., Ishizaka, A., Tasiou, M., Torrisi, G.: On the methodological framework of composite indices: A review of the issues of weighting, aggregation, and robustness. Social Indicators Research pp. 1–34 (2018)
- (33) Greco, S., Matarazzo, B., Slowinski, R.: Rough sets theory for multicriteria decision analysis. European Journal of Operational Research 129(1), 1–47 (2001)
- (34) Griliches, Z.: R&D, patents and productivity. University of Chicago Press ((1984))
- (35) Grupp, H., Mogee, M.E.: Indicators for national science and technology policy: how robust are composite indicators? Research Policy 33(9), 1373–1384 (2004)
- (36) Grupp, H., Schubert, T.: Review and new evidence on composite innovation indicators for evaluating national performance. Research Policy 39(1), 67–78 (2010)
- (37) Hauser, C., Siller, M., Schatzer, T., Walde, J., Tappeiner, G.: Measuring regional innovation: A critical inspection of the ability of single indicators to shape technological change. Technological Forecasting and Social Change 129, 43–55 (2018)
- (38) Holgersson, T., Kekezi, O.: Towards a multivariate innovation index. Economics of Innovation and New Technology 27(3), 254–272 (2018)
- (39) Hollanders, H., Es-Sadki, N.: European Innovation Scoreboard 2017. Brussels: European Commission ((2017))
- (40) Hollanders, H., Es-Sadki, N.: European Innovation Scoreboard 2017: methodology report. Brussels: European Commission ((2017))
- (41) Hollanders, H., Es-Sadki, N., Kanerva, M.: European Innovation Scoreboard 2016. Brussels: European Commission ((2016))
- (42) Hollenstein, H.: A composite indicator of a firm’s innovativeness: an empirical analysis based on survey data for Swiss manufacturing. Research Policy 25(4), 633–645 (1996)
- (43) Hwang, C.L., Yoon, K.: Methods for multiple attribute decision making. In: Multiple attribute decision making, pp. 58–191. Berlin: Springer ((1981))
- (44) Jacobs, R., Smith, P.C., Goddard, M.K.: Measuring performance: an examination of composite performance indicators. York: Centre of Health Economics, University of York ((2004))
- (45) Kadziński, M., Michalski, M.: Scoring procedures for multiple criteria decision aiding with robust and stochastic ordinal regression. Computers & Operations Research 71, 54–70 (2016)
- (46) Keeney, R., Raiffa, H.: Decisions with multiple objectives: Preferences and value tradeoffs. New York: Wiley & Sons (1976)
- (47) Kozłowski, J.: Innovation indices: the need for positioning them where they properly belong. Scientometrics 104(3), 609–628 (2015)
- (48) Lahdelma, R., Hokkanen, J., Salminen, P.: SMAA-stochastic multiobjective acceptability analysis. European Journal of Operational Research 106(1), 137–143 (1998)
- (49) Leydesdorff, L., Etzkowitz, H.: The triple helix as a model for innovation studies. Science and Public Policy 25(3), 195–203 (1998)
- (50) Mayag, B., Grabisch, M., Labreuche, C.: A representation of preferences by the Choquet integral with respect to a 2-additive capacity. Theory and Decision 71(3), 297–324 (2011)
- (51) Mousseau, V., Figueira, J., Dias, L., Gomes da Silva, C., Climaco, J.: Resolving inconsistencies among constraints on the parameters of an MCDA model. European Journal of Operational Research 147(1), 72–93 (2003)
- (52) Munda, G., Nardo, M.: Constructing consistent composite indicators: the issue of weights. Brussels: European Commission ((2005))
- (53) Murofushi, T., Soneda, S.: Techniques for reading fuzzy measures (iii): interaction index. In: 9th fuzzy system symposium, pp. 693–696 (1993)
- (54) Paredes-Frigolett, H., Pyka, A., Pereira, J., Gomes, L.F.A.M.: Ranking the performance of national innovation systems in the Iberian Peninsula and Latin America from a neo-Schumpeterian economics perspective. Hohenheim: FZID ((2014))
- (55) Paruolo, P., Saisana, M., Saltelli, A.: Ratings and rankings: voodoo or science? Journal of the Royal Statistical Society: Series A 176(3), 609–634 (2013)
- (56) Petrović, M., Bojković, N., Anić, I., Stamenković, M., Tarle, S.P.: An ELECTRE-based decision aid tool for stepwise benchmarking: an application over EU Digital Agenda targets. Decision Support Systems 59, 230–241 (2014)
- (57) Rota, G.C.: On the foundations of combinatorial theory I. theory of Möbius functions. Zeitschrift für Wahrscheinlichkeitstheorie und Verwandte Gebiete 2(4), 340–368 (1964)
- (58) Roy, B.: Multicriteria methodology for decision aiding. Dordrecht: Kluwer Academic (1996)
- (59) Saaty, T.L.: A scaling method for priorities in hierarchical structures. Journal of Mathematical Psychology 15(3), 234–281 (1977)
- (60) Saisana, M., Tarantola, S.: State-of-the-art report on current methodologies and practices for composite indicator development. Ispra: Joint Research Centre ((2002))
- (61) Schibany, A., Streicher, G.: The European innovation scoreboard: drowning by numbers? Science and Public Policy 35(10), 717–732 (2008)
- (62) Schmookler, J.: The interpretation of patent statistics. Journal of the Patent Office Society 32(2), 123–146 (1950)
- (63) Shapley, L.S.: A value for n-person games. Contributions to the Theory of Games 2, 307–317 (1953)
- (64) Tervonen, T., Figueira, J.R.: A survey on stochastic multicriteria acceptability analysis methods. Journal of Multi–Criteria Decision Analysis 15(1-2), 1–14 (2008)
6 Appendix - Supplementary material
| FC | IN | IA | IMP | ||||||||||||||||||||||||
|---|---|---|---|---|---|---|---|---|---|---|---|---|---|---|---|---|---|---|---|---|---|---|---|---|---|---|---|
| HR | ARS | IFE | FS | FI | FS | LIN | IAS | EI | FS | ||||||||||||||||||
| Belgium (BE) | 1.79 | 44.30 | 7.00 | 1408.08 | 12.63 | 42.31 | 23.00 | 1.51 | 0.68 | 0.072 | 1.77 | 0.56 | 34 | 48.26 | 45.14 | 39.75 | 28.59 | 61.05 | 0.07 | 3.35 | 7.75 | 2.75 | 15.20 | 2.46 | 48.53 | 67.86 | 7.60 |
| Bulgaria (BG) | 1.48 | 32.80 | 2.20 | 202.41 | 4.04 | 5.14 | 10.00 | 0.99 | 0.25 | 0.015 | 0.7 | 0.74 | 8 | 14.04 | 14.75 | 11.19 | 3.11 | 1.11 | 0.01 | 0.65 | 9.49 | 7.02 | 10.40 | 6.14 | 31.04 | 41.38 | 4.80 |
| Czech Republic (CZ) | 1.68 | 32.60 | 8.80 | 688.47 | 7.05 | 14.76 | 10.00 | 2.65 | 0.88 | 0.013 | 1.06 | 0.94 | 22 | 30.83 | 25.74 | 27.98 | 10.03 | 10.25 | 0.03 | 1.08 | 5.14 | 2.62 | 12.80 | 4.95 | 64.08 | 41.96 | 14.57 |
| Denmark (DK) | 3.24 | 45.30 | 27.70 | 2228.92 | 13.44 | 32.06 | 31.00 | 11.09 | 1.15 | 0.059 | 1.87 | 0.29 | 28 | 34.65 | 39.98 | 28.22 | 13.23 | 131.99 | 0.02 | 6.14 | 11.60 | 7.93 | 15.80 | 4.31 | 47.84 | 74.79 | 6.96 |
| Germany (DE) | 2.85 | 30.50 | 8.50 | 778.17 | 11.40 | 9.12 | 12.00 | 2.92 | 0.93 | 0.049 | 1.95 | 1.26 | 29 | 41.56 | 49.09 | 37.90 | 10.10 | 45.30 | 0.12 | 6.35 | 9.34 | 6.18 | 14.80 | 4.52 | 67.65 | 74.69 | 13.34 |
| Estonia (EE) | 1.08 | 41.20 | 15.70 | 1029.68 | 8.04 | 8.30 | 12.00 | 3.40 | 0.78 | 0.136 | 0.69 | 0.85 | 13 | 17.36 | 15.03 | 15.80 | 10.76 | 1.52 | 0.04 | 1.36 | 14.97 | 3.74 | 12.70 | 3.03 | 42.72 | 45.35 | 10.49 |
| Ireland (IE) | 2.51 | 51.80 | 6.40 | 1196.68 | 12.14 | 23.10 | 15.00 | 2.28 | 0.33 | 0.086 | 1.09 | 0.47 | 30 | 45.72 | 52.52 | 41.33 | 13.95 | 23.55 | 0.01 | 2.49 | 5.40 | 1.02 | 19.80 | 8.76 | 52.52 | 93.98 | 18.07 |
| Grece (EL) | 1.13 | 41.00 | 4.00 | 590.80 | 8.90 | 19.85 | 2.00 | 1.17 | 0.63 | 0.001 | 0.32 | 0.76 | 15 | 34.61 | 40.14 | 31.40 | 14.76 | 7.92 | 0.04 | 0.55 | 4.58 | 1.30 | 12.20 | 4.55 | 22.69 | 44.44 | 12.75 |
| Spain (ES) | 1.91 | 41.00 | 9.40 | 701.40 | 9.67 | 11.92 | 20.00 | 1.61 | 0.57 | 0.043 | 0.64 | 0.36 | 23 | 18.60 | 25.52 | 14.47 | 6.68 | 11.37 | 0.03 | 1.57 | 9.13 | 3.08 | 12.30 | 3.52 | 47.79 | 43.30 | 15.94 |
| France (FR) | 1.70 | 44.00 | 18.80 | 700.18 | 11.24 | 40.05 | 9.00 | 5.31 | 0.74 | 0.083 | 1.45 | 0.50 | 20 | 35.47 | 41.62 | 31.55 | 13.21 | 32.20 | 0.04 | 4.17 | 5.85 | 2.88 | 14.20 | 4.26 | 58.61 | 67.05 | 15.02 |
| Croatia (HR) | 1.57 | 33.00 | 3.00 | 465.56 | 4.55 | 3.16 | 6.00 | 0.98 | 0.42 | 0.054 | 0.44 | 1.20 | 22 | 25.43 | 30.84 | 21.13 | 6.78 | 5.68 | 0.03 | 0.63 | 4.22 | 0.86 | 11.70 | 2.84 | 37.98 | 19.05 | 4.91 |
| Italy (IT) | 1.53 | 25.60 | 8.30 | 596.45 | 10.19 | 13.16 | 5.00 | 2.72 | 0.56 | 0.022 | 0.74 | 0.57 | 12 | 32.67 | 34.60 | 30.52 | 6.72 | 15.20 | 0.01 | 2.17 | 8.14 | 6.41 | 13.90 | 2.65 | 52.07 | 50.36 | 10.06 |
| Cyprus (CY) | 0.55 | 56.30 | 6.90 | 1139.90 | 10.23 | 11.36 | 3.00 | 2.00 | 0.3 | 0.071 | 0.08 | 0.21 | 22 | 32.84 | 31.11 | 30.48 | 11.67 | 7.08 | 0.00 | 0.80 | 41.39 | 3.34 | 16.30 | 0.77 | 43.18 | 68.40 | 4.49 |
| Latvia (LV) | 0.91 | 42.10 | 7.30 | 264.10 | 4.14 | 8.82 | 22.00 | 3.51 | 0.47 | 0.098 | 0.15 | 0.58 | 12 | 11.89 | 18.97 | 10.18 | 2.78 | 0.49 | 0.05 | 0.31 | 7.01 | 1.75 | 11.10 | 4.82 | 34.66 | 52.98 | 5.31 |
| Lithuania (LT) | 1.12 | 54.90 | 6.00 | 392.93 | 3.96 | 3.91 | 21.00 | 2.23 | 0.76 | 0.082 | 0.28 | 2.01 | 10 | 33.69 | 24.00 | 30.38 | 15.19 | 0.68 | 0.09 | 0.80 | 6.24 | 1.42 | 9.70 | 4.02 | 34.45 | 21.00 | 8.57 |
| Luxembourg (LU) | 1.01 | 51.50 | 16.80 | 1714.54 | 11.61 | 86.99 | 21.00 | 5.15 | 0.64 | 0.047 | 0.67 | 0.13 | 29 | 36.95 | 54.35 | 32.24 | 9.18 | 8.88 | 0.01 | 1.91 | 38.51 | 12.40 | 22.70 | 4.24 | 52.17 | 91.18 | 6.54 |
| Hungary (HU) | 0.96 | 30.40 | 6.30 | 445.25 | 6.23 | 7.17 | 12.00 | 1.96 | 0.35 | 0.055 | 1.01 | 0.75 | 16 | 15.07 | 15.22 | 11.74 | 6.19 | 23.24 | 0.03 | 1.32 | 3.91 | 0.93 | 12.20 | 7.60 | 69.62 | 47.27 | 12.47 |
| Malta (MT) | 0.48 | 34.00 | 7.50 | 554.78 | 9.48 | 12.39 | 12.00 | 3.14 | 0.39 | 0.000 | 0.37 | 0.36 | 23 | 26.71 | 30.78 | 23.87 | 4.18 | 4.66 | 0.00 | 1.38 | 40.00 | 21.00 | 18.40 | 7.31 | 56.68 | 28.80 | 4.12 |
| Netherland (NL) | 2.26 | 45.20 | 18.80 | 1568.99 | 14.35 | 36.62 | 22.00 | 3.89 | 0.9 | 0.096 | 1.12 | 0.16 | 22 | 42.93 | 32.51 | 35.05 | 17.46 | 72.66 | 0.08 | 5.91 | 9.58 | 3.65 | 17.50 | 5.48 | 48.47 | 76.92 | 10.81 |
| Austria (AT) | 1.90 | 39.70 | 14.90 | 1335.89 | 11.70 | 27.03 | 12.00 | 3.21 | 0.89 | 0.051 | 2.18 | 0.47 | 37 | 40.71 | 46.06 | 34.97 | 20.48 | 57.60 | 0.04 | 4.95 | 12.91 | 7.10 | 14.60 | 2.90 | 57.56 | 44.41 | 11.98 |
| Poland (PL) | 0.63 | 43.50 | 3.70 | 276.71 | 5.04 | 1.92 | 11.00 | 1.64 | 0.54 | 0.029 | 0.47 | 1.24 | 12 | 13.27 | 11.39 | 8.34 | 3.50 | 3.68 | 0.02 | 0.58 | 5.25 | 5.90 | 10.00 | 5.54 | 49.44 | 39.59 | 6.45 |
| Portugal (PT) | 1.90 | 35.00 | 9.60 | 873.39 | 9.02 | 21.23 | 25.00 | 1.99 | 0.66 | 0.069 | 0.6 | 0.64 | 23 | 42.08 | 37.81 | 25.59 | 7.75 | 6.65 | 0.01 | 0.70 | 7.21 | 4.47 | 10.90 | 3.74 | 36.70 | 44.40 | 6.27 |
| Romania (RO) | 1.45 | 24.80 | 1.20 | 182.49 | 5.12 | 2.29 | 13.00 | 1.47 | 0.28 | 0.013 | 0.21 | 0.23 | 5 | 4.92 | 8.84 | 4.54 | 1.78 | 2.26 | 0.03 | 0.26 | 2.37 | 0.81 | 7.20 | 2.79 | 52.78 | 44.67 | 6.51 |
| Slovenia (SI) | 3.55 | 43.00 | 11.60 | 1128.29 | 8.61 | 8.51 | 16.00 | 2.12 | 0.53 | 0.007 | 1.69 | 0.81 | 27 | 28.67 | 33.19 | 26.07 | 13.15 | 41.20 | 0.05 | 3.00 | 10.21 | 2.97 | 13.70 | 2.95 | 56.00 | 34.77 | 12.44 |
| Slovakia (SK) | 2.25 | 33.40 | 2.90 | 407.83 | 5.50 | 9.13 | 9.00 | 1.41 | 0.85 | 0.008 | 0.33 | 0.58 | 20 | 16.72 | 22.44 | 13.94 | 8.41 | 9.96 | 0.04 | 0.45 | 4.30 | 1.06 | 10.00 | 7.37 | 66.48 | 34.80 | 19.12 |
| Finland (FI) | 2.88 | 40.70 | 26.40 | 1576.00 | 10.82 | 19.88 | 26.00 | 5.98 | 0.95 | 0.107 | 1.94 | 0.32 | 34 | 44.10 | 37.26 | 38.32 | 16.77 | 63.05 | 0.05 | 8.29 | 11.44 | 4.50 | 15.70 | 2.84 | 44.64 | 62.40 | 9.27 |
| Sweden (SE) | 2.91 | 47.30 | 29.60 | 1938.78 | 11.73 | 32.69 | 32.00 | 8.20 | 0.99 | 0.081 | 2.27 | 1.12 | 25 | 40.41 | 35.10 | 35.08 | 13.51 | 88.74 | 0.04 | 9.58 | 10.75 | 4.71 | 18.40 | 5.98 | 54.72 | 75.16 | 6.89 |
| United Kingdom (UK) | 3.03 | 47.20 | 14.40 | 1151.26 | 14.49 | 42.95 | 10.00 | 3.34 | 0.56 | 0.103 | 1.12 | 0.67 | 28 | 32.58 | 45.45 | 19.03 | 24.70 | 43.19 | 0.03 | 3.25 | 7.32 | 3.03 | 18.40 | 6.94 | 54.75 | 82.90 | 20.81 |
| FC | IN | IA | IMP | ||||||||||||||||||||||||
|---|---|---|---|---|---|---|---|---|---|---|---|---|---|---|---|---|---|---|---|---|---|---|---|---|---|---|---|
| HR | ARS | IFE | FS | FI | FS | LIN | IAS | EI | FS | ||||||||||||||||||
| Belgium (BE) | 0.50 | 0.58 | 0.42 | 0.65 | 0.68 | 0.71 | 0.67 | 0.38 | 0.53 | 0.58 | 0.70 | 0.45 | 0.76 | 0.76 | 0.68 | 0.73 | 0.95 | 0.67 | 0.72 | 0.55 | 0.44 | 0.43 | 0.56 | 0.31 | 0.49 | 0.62 | 0.41 |
| Bulgaria (BG) | 0.44 | 0.34 | 0.31 | 0.28 | 0.24 | 0.36 | 0.39 | 0.34 | 0.23 | 0.31 | 0.43 | 0.53 | 0.23 | 0.27 | 0.27 | 0.27 | 0.29 | 0.36 | 0.36 | 0.37 | 0.47 | 0.60 | 0.33 | 0.64 | 0.22 | 0.39 | 0.30 |
| Czech Republic (CZ) | 0.48 | 0.34 | 0.46 | 0.43 | 0.39 | 0.45 | 0.39 | 0.46 | 0.67 | 0.30 | 0.52 | 0.61 | 0.51 | 0.51 | 0.41 | 0.54 | 0.47 | 0.41 | 0.46 | 0.40 | 0.40 | 0.43 | 0.44 | 0.54 | 0.72 | 0.40 | 0.66 |
| Denmark (DK) | 0.79 | 0.60 | 0.87 | 0.90 | 0.72 | 0.61 | 0.84 | 1.00 | 0.85 | 0.52 | 0.73 | 0.34 | 0.63 | 0.57 | 0.61 | 0.55 | 0.55 | 1.00 | 0.40 | 0.73 | 0.51 | 0.64 | 0.59 | 0.48 | 0.48 | 0.67 | 0.38 |
| Germany (DE) | 0.71 | 0.30 | 0.45 | 0.46 | 0.62 | 0.40 | 0.43 | 0.48 | 0.70 | 0.47 | 0.75 | 0.74 | 0.65 | 0.66 | 0.73 | 0.70 | 0.47 | 0.59 | 1.00 | 0.75 | 0.47 | 0.57 | 0.54 | 0.50 | 0.77 | 0.67 | 0.61 |
| Estonia (EE) | 0.36 | 0.52 | 0.61 | 0.54 | 0.44 | 0.39 | 0.43 | 0.52 | 0.60 | 0.87 | 0.43 | 0.57 | 0.33 | 0.32 | 0.27 | 0.35 | 0.49 | 0.36 | 0.49 | 0.42 | 0.56 | 0.47 | 0.44 | 0.36 | 0.40 | 0.43 | 0.51 |
| Ireland (IE) | 0.64 | 0.73 | 0.40 | 0.59 | 0.66 | 0.53 | 0.50 | 0.44 | 0.28 | 0.64 | 0.53 | 0.42 | 0.67 | 0.72 | 0.77 | 0.76 | 0.57 | 0.48 | 0.32 | 0.49 | 0.41 | 0.36 | 0.78 | 0.88 | 0.55 | 0.83 | 0.78 |
| Grece (EL) | 0.37 | 0.51 | 0.35 | 0.40 | 0.49 | 0.50 | 0.22 | 0.35 | 0.49 | 0.25 | 0.33 | 0.54 | 0.37 | 0.56 | 0.61 | 0.60 | 0.59 | 0.40 | 0.52 | 0.36 | 0.39 | 0.37 | 0.41 | 0.50 | 0.10 | 0.42 | 0.59 |
| Spain (ES) | 0.52 | 0.51 | 0.47 | 0.44 | 0.53 | 0.43 | 0.60 | 0.39 | 0.45 | 0.44 | 0.42 | 0.37 | 0.53 | 0.34 | 0.41 | 0.32 | 0.38 | 0.41 | 0.48 | 0.43 | 0.47 | 0.44 | 0.42 | 0.41 | 0.47 | 0.41 | 0.71 |
| France (FR) | 0.48 | 0.57 | 0.67 | 0.44 | 0.61 | 0.69 | 0.37 | 0.66 | 0.57 | 0.63 | 0.62 | 0.43 | 0.47 | 0.58 | 0.63 | 0.60 | 0.55 | 0.52 | 0.49 | 0.60 | 0.41 | 0.44 | 0.51 | 0.47 | 0.64 | 0.61 | 0.67 |
| Croatia (HR) | 0.46 | 0.35 | 0.33 | 0.36 | 0.26 | 0.35 | 0.31 | 0.34 | 0.35 | 0.49 | 0.37 | 0.72 | 0.51 | 0.43 | 0.48 | 0.43 | 0.38 | 0.38 | 0.48 | 0.37 | 0.39 | 0.35 | 0.39 | 0.35 | 0.33 | 0.21 | 0.31 |
| Italy (IT) | 0.45 | 0.20 | 0.44 | 0.40 | 0.56 | 0.44 | 0.29 | 0.47 | 0.44 | 0.35 | 0.44 | 0.46 | 0.31 | 0.54 | 0.53 | 0.58 | 0.38 | 0.43 | 0.35 | 0.47 | 0.45 | 0.58 | 0.49 | 0.33 | 0.54 | 0.47 | 0.49 |
| Cyprus (CY) | 0.25 | 0.82 | 0.41 | 0.57 | 0.56 | 0.42 | 0.24 | 0.42 | 0.26 | 0.57 | 0.27 | 0.31 | 0.51 | 0.54 | 0.49 | 0.58 | 0.51 | 0.39 | 0.28 | 0.38 | 0.98 | 0.45 | 0.61 | 0.16 | 0.41 | 0.62 | 0.29 |
| Latvia (LV) | 0.32 | 0.53 | 0.42 | 0.30 | 0.24 | 0.40 | 0.65 | 0.53 | 0.38 | 0.70 | 0.29 | 0.46 | 0.31 | 0.24 | 0.32 | 0.26 | 0.28 | 0.36 | 0.59 | 0.35 | 0.43 | 0.39 | 0.36 | 0.52 | 0.28 | 0.49 | 0.32 |
| Lithuania (LT) | 0.37 | 0.80 | 0.39 | 0.34 | 0.23 | 0.35 | 0.63 | 0.43 | 0.58 | 0.62 | 0.32 | 1.00 | 0.27 | 0.55 | 0.39 | 0.58 | 0.60 | 0.36 | 0.83 | 0.38 | 0.42 | 0.38 | 0.29 | 0.45 | 0.28 | 0.22 | 0.44 |
| Luxembourg (LU) | 0.34 | 0.73 | 0.63 | 0.75 | 0.63 | 1.00 | 0.63 | 0.65 | 0.50 | 0.46 | 0.42 | 0.28 | 0.65 | 0.60 | 0.80 | 0.61 | 0.45 | 0.40 | 0.33 | 0.45 | 0.94 | 0.82 | 0.92 | 0.47 | 0.54 | 0.81 | 0.37 |
| Hungary (HU) | 0.33 | 0.29 | 0.40 | 0.36 | 0.35 | 0.38 | 0.43 | 0.41 | 0.30 | 0.50 | 0.51 | 0.53 | 0.39 | 0.29 | 0.27 | 0.28 | 0.37 | 0.48 | 0.45 | 0.41 | 0.38 | 0.36 | 0.41 | 0.77 | 0.80 | 0.44 | 0.58 |
| Malta (MT) | 0.24 | 0.37 | 0.43 | 0.39 | 0.52 | 0.43 | 0.43 | 0.50 | 0.32 | 0.24 | 0.35 | 0.37 | 0.53 | 0.45 | 0.48 | 0.48 | 0.32 | 0.38 | 0.29 | 0.42 | 0.96 | 1.00 | 0.71 | 0.75 | 0.61 | 0.29 | 0.28 |
| Netherland (NL) | 0.59 | 0.60 | 0.67 | 0.70 | 0.77 | 0.66 | 0.65 | 0.56 | 0.68 | 0.69 | 0.54 | 0.29 | 0.51 | 0.68 | 0.51 | 0.65 | 0.66 | 0.73 | 0.79 | 0.72 | 0.47 | 0.47 | 0.67 | 0.58 | 0.48 | 0.69 | 0.52 |
| Austria (AT) | 0.52 | 0.49 | 0.59 | 0.63 | 0.63 | 0.57 | 0.43 | 0.51 | 0.67 | 0.48 | 0.81 | 0.42 | 0.82 | 0.65 | 0.69 | 0.65 | 0.74 | 0.66 | 0.53 | 0.65 | 0.53 | 0.61 | 0.53 | 0.35 | 0.62 | 0.42 | 0.56 |
| Poland (PL) | 0.27 | 0.56 | 0.34 | 0.31 | 0.29 | 0.33 | 0.41 | 0.39 | 0.43 | 0.38 | 0.37 | 0.73 | 0.31 | 0.26 | 0.22 | 0.23 | 0.30 | 0.37 | 0.39 | 0.36 | 0.40 | 0.56 | 0.31 | 0.59 | 0.50 | 0.38 | 0.36 |
| Portugal (PT) | 0.52 | 0.39 | 0.47 | 0.49 | 0.49 | 0.51 | 0.71 | 0.41 | 0.51 | 0.56 | 0.41 | 0.49 | 0.53 | 0.67 | 0.58 | 0.50 | 0.41 | 0.39 | 0.34 | 0.37 | 0.44 | 0.50 | 0.35 | 0.43 | 0.31 | 0.42 | 0.36 |
| Romania (RO) | 0.43 | 0.18 | 0.29 | 0.28 | 0.29 | 0.34 | 0.46 | 0.38 | 0.25 | 0.30 | 0.31 | 0.32 | 0.17 | 0.14 | 0.19 | 0.17 | 0.25 | 0.37 | 0.47 | 0.34 | 0.36 | 0.35 | 0.17 | 0.34 | 0.55 | 0.42 | 0.37 |
| Slovenia (SI) | 0.85 | 0.55 | 0.52 | 0.57 | 0.47 | 0.39 | 0.52 | 0.42 | 0.42 | 0.28 | 0.68 | 0.56 | 0.61 | 0.48 | 0.51 | 0.51 | 0.55 | 0.57 | 0.58 | 0.52 | 0.48 | 0.44 | 0.48 | 0.36 | 0.60 | 0.34 | 0.58 |
| Slovakia (SK) | 0.59 | 0.36 | 0.33 | 0.35 | 0.31 | 0.40 | 0.37 | 0.37 | 0.65 | 0.28 | 0.34 | 0.46 | 0.47 | 0.31 | 0.37 | 0.32 | 0.43 | 0.41 | 0.50 | 0.36 | 0.39 | 0.36 | 0.31 | 0.75 | 0.75 | 0.34 | 0.82 |
| Finland (FI) | 0.72 | 0.51 | 0.84 | 0.70 | 0.59 | 0.50 | 0.73 | 0.71 | 0.71 | 0.74 | 0.75 | 0.36 | 0.76 | 0.70 | 0.57 | 0.71 | 0.64 | 0.68 | 0.56 | 0.87 | 0.50 | 0.50 | 0.58 | 0.35 | 0.43 | 0.57 | 0.47 |
| Sweden (SE) | 0.72 | 0.64 | 0.91 | 0.81 | 0.64 | 0.62 | 0.86 | 0.88 | 0.74 | 0.62 | 0.83 | 0.68 | 0.57 | 0.65 | 0.54 | 0.66 | 0.56 | 0.82 | 0.51 | 0.96 | 0.49 | 0.51 | 0.71 | 0.63 | 0.58 | 0.68 | 0.38 |
| United Kingdom (UK) | 0.75 | 0.64 | 0.58 | 0.57 | 0.78 | 0.71 | 0.39 | 0.52 | 0.44 | 0.72 | 0.54 | 0.50 | 0.63 | 0.54 | 0.68 | 0.40 | 0.85 | 0.58 | 0.47 | 0.54 | 0.44 | 0.44 | 0.71 | 0.72 | 0.58 | 0.74 | 0.88 |