An [O III] search for extended emission around AGN with H I mapping: a distant cloud ionized by Mkn 1
Abstract
Motivated by the discovery of large-scale ionized clouds around AGN host galaxies, and particularly the large fraction of those which are consistent with photoionized gaseous tidal debris, we have searched for [O III] emission over wide fields around a set of Seyfert galaxies previously mapped in H I, many of which show extended gas features. The detection threshold was designed to reach mean emission-line surface brightness 10 times fainter than seen in such AGN-ionized clouds as Hanny’s Voorwerp, so that similar structures at larger distances (and ages) could be detected. Of 24 Seyfert galaxies, we find one extended emission feature, a discrete cloud projected kpc from the center of Mkn 1 and spanning a transverse extent of 8 kpc. In addition, we identify several potential “emission-line dots” (ELdots), compact objects which may be outlying, relatively isolated star-forming regions. Optical spectroscopy of the Mkn 1 cloud confirms its redshift association with the Mkn 1 - NGC 451 galaxy pair, shows it to closely match the kinematics of nearby H I, and reveals emission-line ratios requiring photoionization by the AGN at roughly the direct observed luminosity of the nucleus.. Given the small fraction of H I features with detected [O III] emission, we constrain the typical opening angle of ionization cones in Seyfert galaxies to be of order , on the assumption that active episodes are long compared to the light-travel times involved. An appendix presents a derivation of an analytical expression for the probability of intersection of a cone with randomly oriented arcs, approximating the geometry of H I clouds and tails exposed to ionization cones. For the entire sample, the full opening angle of bicones must be if the AGN are continuously bright for scales longer than the light-travel times across the H I structures. Since many ionization cones are observed to be much broader than this, our low detection fraction may add to evidence for the ubiquity of strong variations in AGN luminosity on scales years.
keywords:
galaxies: Seyfert — galaxies: ISM — galaxies: active1 Introduction
A subset of active galactic nuclei (AGN) has been known to be accompanied by extended emission-line regions (EELRs) since pioneering discoveries in the 1980s. As reviewed by, for example, Wilson (1996) and Stockton et al. (2006), these often take the form of ionization cones, and in some cases extend tens of kpc outside the AGN host galaxy itself. EELRs allow us to trace the pattern of emerging radiation, characterize AGN which are strongly obscured along our line of sight, or have undergone dramatic luminosity changes over millennia. These applications have seen new use with recent discoveries of EELRs around AGN which appear too faint to account for their ionization level, requiring either strong obscuration or strong variability (over the light-travel times between nucleus and EELR) to explain this mismatch. In particular, Hanny’s Voorwerp (Lintott et al. 2009, Keel et al. 2012b, Schawinski et al. 2010) is a galaxy-scale highly-ionized cloud for which the nearby AGN in IC 2497 fails to be able to account for its ionization by factors 20-100 even when its spectral energy distribution up to hard X-rays is modeled (Sartori et al., 2016). Following the discovery of this object by Galaxy Zoo participant Hanny van Arkel, a dedicated search by additional Galaxy Zoo participants found another 19 AGN with similar ionized clouds projected kpc from the nuclei (Keel et al., 2012a), of which 8 have a substantial energy deficit from the AGN as observed (Keel et al., 2017b). Additional studies have identified analogous objects at both lower and higher AGN luminosity (Schirmer et al. 2013, Schweizer et al. 2013).
These findings have allowed the beginnings of a picture of AGN changes over time spans years, which can connect to longer time spans inferred from simulations and statistics of AGN in interacting hosts, and with the shorter timescales known from direct observation (reverberation studies and the growing number of “changing-look” AGN). If the AGN surrounded by EELRs are typical, their radiative output is characterized by luminous phases years long with low-luminosity interludes, possibly associated with transitions between the accretion output being mostly radiative or mostly kinetic (Keel et al. 2012a, Keel et al. 2017b, Schawinski et al. 2015). The “changing-look” AGN (e.g., LaMassa et al. 2015, Runnoe et al. 2016, Ruan et al. 2016), which change their nuclear luminosity significantly within only a few years, show that such rapid changes in the AGN luminosity occur. Changes traced by light-travel time to clouds tens of kpc from the AGN, in contrast, must represent millennium-scale durations when the average luminosity stays high or low.
Since almost all EELRs have been found around galaxies with extant (if sometimes low-luminosity) AGN, and surrounding gas is a prerequisite to their occurrence, we have carried out a series of imaging surveys in the strongest optical emission line from EELRs, [O III] . The sample described here consists of Seyfert galaxies mapped in H I by Kuo et al. (2008), so we know which ones have extended H I discs or tails, and roughly what fraction of each AGN host is surrounded by such gas. This lets us use the detection fraction to estimate the covering factor of escaping gas (opening angle of ionization cones) combined with the fraction of the time the typical AGN is in a luminous state over the scales spanned by light-travel times to the outermost gas. We also consider in detail the properties of the sole EELR discovered, near Mkn 1.
In quoting luminosities and sizes, we adopt km s-1 Mpc-1 and flat cosmological geometry.
2 Sample selection and observations
2.1 Sample construction
Our sample consists of the Seyfert galaxies observed by Kuo et al. (2008) in their study of H I structures around active galaxies, including data on the four objects presented earlier by Greene et al. (2004). We also observed the H II-region nuclei Mkn 1158 and 1510 included in Kuo et al. (2008), but do not analyze their fields here. This leaves 26 Seyfert galaxies in our sample (Table 1). They lie at redshifts ; for guidance, we include Hubble types from Kuo et al. (2008) and AGN classifications from NED111The NASA Extragalactic Database, http://ned.ipac.caltech.edu.. As our further work has progressed, this is now the first phase of a multipart program we call TELPERION222The name is mostly intended for readers of Tolkien’s work on the First Age of Middle-Earth, to connote long-vanished brilliance, but also stands for Tracing Emission Lines to Probe Extended Regions Ionized by Once-active Nuclei. Further phases now in progress encompass merging galaxies in the Toomre sequence, luminosity-selected AGN, luminous galaxies independent of AGN, and a larger merging sample from the Galaxy Zoo (Lintott et al., 2008) analysis by Darg et al. (2010).
| Name | z | MB | AGN type | Hubble Type | Inclination | FNUC(5007) | |
|---|---|---|---|---|---|---|---|
| Class | Type | ( ) | (erg cm-2 s-1) | ||||
| Mkn 341 | 0.0153 | -21.9 | S | S0-a | 70.5 | ||
| NGC 266 | 0.0155 | -20.6 | S3b | Sab | 14.5 | ||
| Mkn 352 | 0.0149 | -19.5 | S1.0 | S0 | 33.9 | ||
| Mkn 1 | 0.0159 | -19.0 | S2 | Sb | 58.7 | ||
| NGC 513 | 0.0195 | -21.5 | S1h | Sc | 61.9 | ||
| Mkn 993 | 0.0155 | -20.0 | S1.5 | Sa | 90.0 | ||
| Mkn 359 | 0.0174 | -20.2 | NLS1 | Sb | 39.1 | ||
| Mkn 1157 | 0.0152 | -20.1 | S1h | S0-a | 40.2 | ||
| Mkn 573 | 0.0172 | -20.1 | S1h | S0-a | 28.0 | ||
| UGC 1395 | 0.0174 | -20.5 | S1.9 | Sb | 54.8 | ||
| NGC 841 | 0.0151 | -21.4 | S3b | Sab | 64.8 | ||
| Mkn 1040 | 0.0167 | -19.2 | S1.0 | Sbc | 81.1 | ||
| NGC 1167 | 0.0165 | -21.1 | Sy 2 | S0 | 49.0 | ||
| UCG 3157 | 0.0154 | -19.9 | S2 | Sbc | 35.2 | ||
| MS 04595+0327 | 0.0160 | -19.5 | S1 | E | 50.2 | ||
| IRAS 05078+1626 | 0.0179 | -19.4 | S1.5 | E? | 39.7 | ||
| UGC 3995 | 0.0158 | -21.5 | S2 | Sb | 67.6 | ||
| Mkn 1419 | 0.0165 | -19.8 | S3 | Sa | 41.9 | ||
| Mkn 461 | 0.0162 | -20.4 | S2 | Sab | 43.6 | ||
| IRAS 14082+1347 | 0.0162 | -19.5 | S3 | S? | 53.5 | ||
| NGC 5548 | 0.0172 | -20.7 | S1.5 | S0-a | 41.0 | ||
| ARK 539 | 0.0169 | -19.9 | S2 | S? | 31.9 | ||
| NGC 7469 | 0.0163 | -21.6 | S1.5 | Sa | 30.2 | ||
| NGC 7591 | 0.0171 | -21.6 | S | SBb | 67.1 | ||
| NGC 7679 | 0.0171 | -21.4 | S2 | S0-a | 59.1 | ||
| NGC 7682 | 0.0171 | -20.7 | S1h | Sab | 22.7 |
2.2 Observations: narrowband imaging
The survey observations were carried out between October 2010 and July 2012 using the remotely-operated telescopes of the SARA Observatory (Keel et al., 2017). The narrowband images, and most of the broadband continuum imaging, used the 1m instrument on Kitt Peak, Arizona (SARA-KP). During this period it was equipped with a -pixel E2V CCD in an Apogee U42 camera. The pixel scale was 0382 pixel-1, giving a field 13.04′ square. For a centered galaxy, this meant the images covered (inscribed) projected radii 118-153 kpc over the redshift range of our sample. The -band continuum images for five galaxies (MS 04595+0327, UGC 1395, NGC 7591, NGC 7679 and NGC 7682) were obtained using the SARA 0.6m telescope on Cerro Tololo, Chile. The Apogee Alta E6 camera in use then gave a field 10.34 ′ square at 0606 pixel-1, covering radial regions out to kpc from each targeted galaxy.
A narrowband filter centered at 5100 Å with half-transmission points at 5047 Å and 5132 Å captured [O III] emission at the redshifts of sample members. The filter is circular with a 50mm diameter, and was fabricated by Custom Scientific333http://customscientific.com. Corners of the CCD images are slightly vignetted, an effect well corrected using twilight-sky flat fields. A standard passband, which has its center of transmission close to the narrowband filter’s peak transmission, was used for comparison images in the broadband continuum.
In the converging f/8 beam of this telescope, we expect the peak response of the [O III] to be shifted blueward by about 10 Å, which we correct in deriving emission-line fluxes. Our exposures were designed to reach mean emission-line surface brightness at least 10 times fainter than Hanny’s Voorwerp, allowing detection of similar objects farther from the ionizing AGN, as well as objects ionized by less powerful AGN. Exposure sequences were stacked for a 5400 s total exposure in [O III] and an 1800 s total exposure. Calibration frames were observed at the beginning of each run and standard reduction procedures were carried out using NOAO’s package in IRAF444IRAF is distributed by the National Optical Astronomy Observatory, which is operated by the Association of Universities for Research in Astronomy (AURA) under a cooperative agreement with the National Science Foundation. (Tody, 1986). This CCD suffered from residual bulk image (e.g. Crisp 2009), producing image persistence from bright objects which decayed with an -folding time typically 40 minutes. This effect was mitigated by taking a shorter dark exposure before each new object, subtracting a smoothed and scaled version of this, as well as offsetting the telescope between the 3 individual 30-minute exposures with the narrowband filter. Stacking these multiple exposures also substantially rejected cosmic-ray events and residual flat-field imperfections. The individual narrowband exposures were sky-noise limited, so breaking the total observation into 3 exposures imposed little penalty in signal-to-noise ratio (SNR).
Continuum-subtracted (emission-line) images were produced by scaling and subtracting the combined continuum image from the combined narrow-band image. Scaling factors were determined from flux ratios of stars with known color.
To detect spatially extended emission regions of low surface brightness, we applied several smoothing algorithms to the emission-line images. Median filtering (box size ″ ) and Gaussian smoothing () over the images improved the detectability of structures in these scales. Detection limits in [O III] emission for structures much larger than these smoothing windows are typically erg cm-2 s-1 arcsec-2.
To estimate the [O III] flux (or surface brightness) of detected objects, we establish a calibration using Landolt (1992) standard stars observed on photometric nights, along with count-rate ratios of stars between broad and narrow filters. Following Fukugita et al. (1995), we converted magnitude zero points to total flux corresponding to one count/second within both broad- and narrow-band filters. The ratio of stellar count rates between filters, and the filters’ effective widths, let us determine the flux represent by on ADU per unit time in redshifted emission. This calibration factor, and the fidelity of continuum subtraction, depend on the color of any associated continuum; extreme colors work less well since we used only a single continuum filter, centered slightly to the red of the narrowband filter. The emission-line flux is corrected for the wavelength-dependent filter transmission, using a correction factor equal to the peak transmission divided by the transmission (at that ) of the 5100-Å filter. [O III] fluxes for the AGN were measured from the emission-line images using imexam from the IRAF images package, within a 5″aperture with automatic centering turned on. Three iterations were allowed to adjust the fitting radius. Flux counts for all other detected compact emission-line sources were calculated with automatic centering turned off and no allowed adjustments to the fitting radius, while for diffuse sources we used larger box apertures as appropriate.
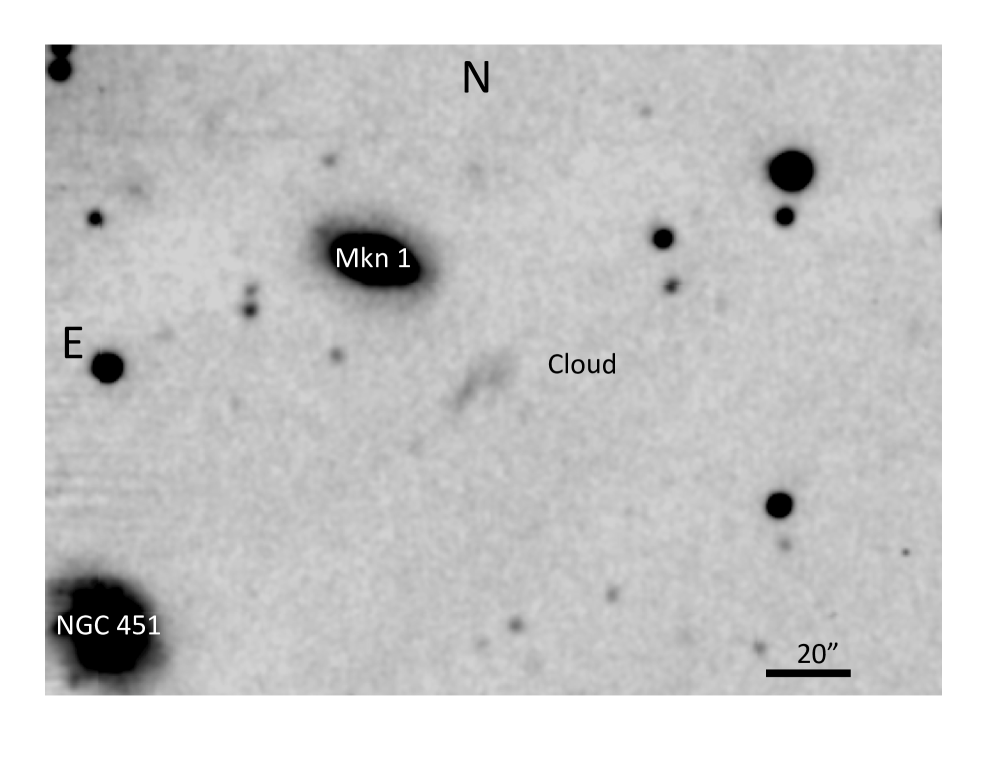
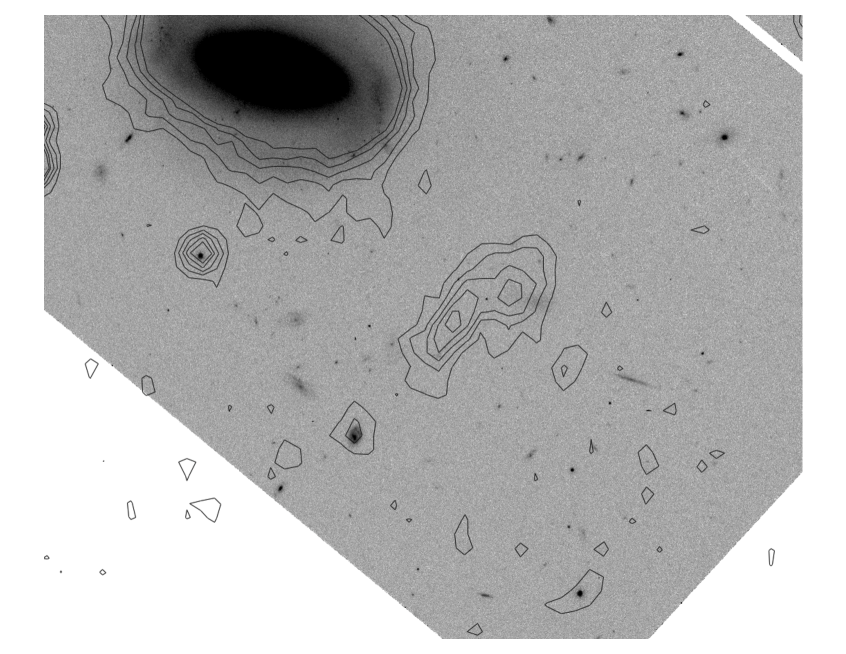
To improve our knowledge of the diffuse cloud found in our survey data, we obtained new images of Mkn 1 with SARA-KP in late 2012 and late 2016, after installation of a new imager using a nominally identical chip, operating at much lower temperature. The new camera from ARC555http://www.astro-cam.com essentially eliminated the thermal noise which had been important in our earlier narrowband images, and eliminated the bulk-charge afterimages. A 3.5-hour exposure stack in the same filter goes significantly deeper, revealing structure in the cloud (Fig. 1). The image does show residuals from removal of the scattered light produced by the 6th-magnitude star HD 7578 just outside the field to the NE, which were largely reduced along with charge bleeding from other field stars by subtracting a version of the image median-filtered using a -pixel box parallel to the detector -axis. Similar data were obtained for NGC 7591 and UGC 3995, allowing us to reject marginal candidate detections in those field from the original survey images.
Coordinate mapping and alignment of the images, including a small rotation of the camera between sessions, used astrometric solutions with the astrometry.net web interface (Lang et al., 2010). The two components of the [O III] cloud are centered at 2000 coordinates 01 16 05.32, +33∘ 04′500 and and 01 16 04.79, +33∘ 04′534.
The estimated total flux in [O III] is erg cm-2 s-1 arcsec-2, with a characteristic surface brightness within the detected area of erg cm-2 s-1 arcsec-2.
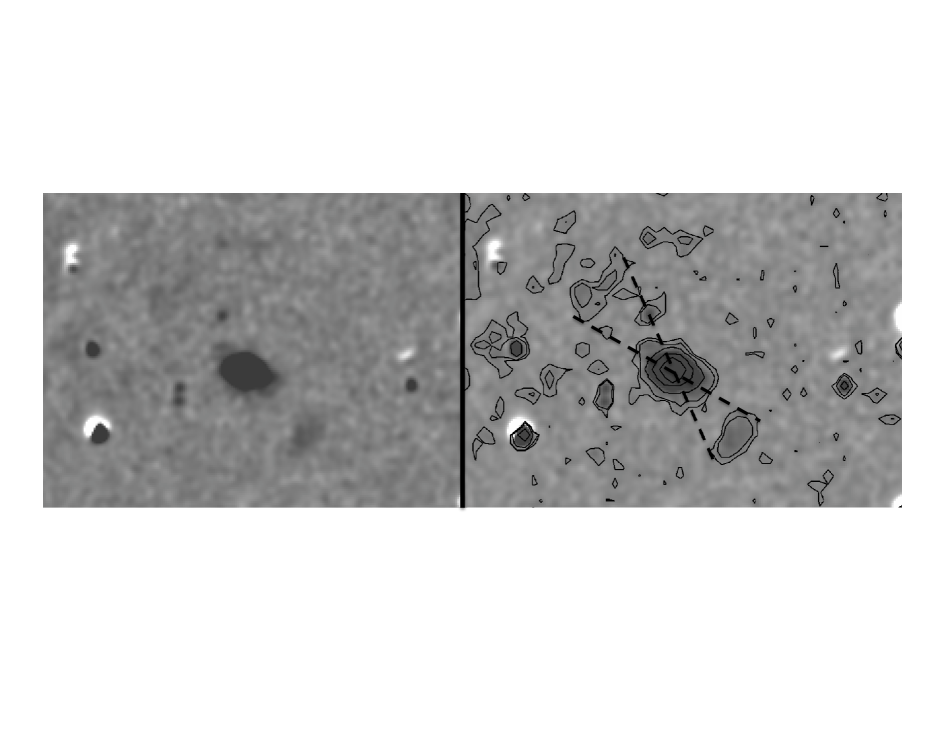
Supplementary imaging of the Mkn 1 field was obtained in redshifted H (including the adjacent [N II] and [S II] lines), via a filter centered at 675 nm with FWHM 25 nm (6000-s exposure), and the continuum bands (3000 seconds each), using the recently commissioned CCD imager on the 1-meter Schmidt telescope of the Byurakan Astrophysical Observatory (Dodonov et al, 2017). After trials involving both and for continuum subtraction, use of the band alone was found to give the smallest residuals near Mkn 1 and NGC 451. The subtraction has the main advantage, even for pure emission clouds, of dramatically reducing the scattered light from the bright foreground star. This image gives evidence of a fainter cloud opposite the SW one we examined spectroscopically (Fig. 2). We do not yet have additional confirmation of its existence; structure in the extended PSF of the star includes pieces of tangent arcs which would share its orientation.
2.3 Lick spectroscopy
To investigate the ionization source of the cloud detected near Mkn 1, we obtained a long-slit spectrum using the Kast double spectrograph (Miller & Stone, 1992) at the 3-m Shane telescope of Lick Observatory, on 14 January 2013. The slit was oriented along position angle , so that when the companion galaxy NGC 451 was centered near one end of the 2″-wide slit, the cloud would be near the other end and sampled nearly along its longest axis. Four 30-minute exposures were combined. The red channel covered the wavelength range 4640–7400 Å at Å resolution, while the blue channel spanned 3350–4580 Å at Å resolution. Subtraction of night-sky emission lines was compromised by having objects of interest at each end of the slit, a particular problem for H.
2.4 BTA spectroscopy
We obtained a deeper long-slit spectrum covering the companion galaxy to Mkn 1 (NGC 451) and the ionized cloud, using the SCORPIO multimode instrument (Afanasiev & Moiseev, 2005) at the 6-meter telescope (BTA) of the Russian Academy of Sciences. A 2-hour exposure on 17 August 2017 was set with the slit at PA , so acquisition of the companion nucleus would also put the slit nearly along the major axis of the cloud. The slit width was 10, and the spectral coverage including the [O II] and [S II] features. The redder feature of [S II] is compromised by overlap with the atmospheric B band at this redshift, and a night-sky emission line. We corrected the data for B-band absorption using the spectrum of a hot star along the slit, and explored several fitting routines to correct for residual night-sky variations along the slit. The uncertainty range on the ratio is still , allowing only values close to the low-density limit. We adopt a limit cm-3, using the temden task from Shaw & Dufour (1995) and assumed temperature K. The [O II] doublet is in a region where the system sensitivity is low, giving a signal-to-noise ratio too low for an independent density estimate. The spectral scale was 2 Å pixel-1, strongly oversampling the spectral resolution of 12 Å FWHM, with the binned pixels spanning 0357 along the slit. The signal-to-noise ratio of these data is sufficient to measure He II emission and (marginally) detect [O III] .
Fig. 3 shows the cloud spectrum summed along 65 spatial pixels (23″ ).

3 Survey results
Our narrowband images show extended emission-line features interpretable as EELRs in only the case of Mkn 1, as noted above.
We identified a number of potential compact emission-line sources in the fields of the target galaxies, many in the range of size and luminosity associated with emission-line dots (ELdots), similar to those seen as outlying star-forming regions by Ryan-Weber et al. (2004) and Werk et al. (2010). They are listed in Table 2, with an indication of whether they are projected inside or outside the lowest-density H I contours shown by Kuo et al. (2008). Detection limits for emission-line point sources are typically erg cm-2 s-1.
| Field-ID | (Possible) Name | z | H I Loc. | P.A. | ||
|---|---|---|---|---|---|---|
| or Coordinates | (arcsec) | ( ) | (erg cm-2 s-1) | |||
| Mkn 341-II | 2MASX J00364502+2405313 | … | outside | 389 | 42.8 | |
| Mkn 341-III | SDSS J003706.15+235529.8 | … | outside | 282 | 138 | |
| Mkn 341-VII | 2MASX J00365081+2355293 | … | outside | 212 | 185 | |
| Mkn 341-VIII | SDSS J003706.42+235450.5 | … | outside | 318 | 142 | |
| Mkn 341-X | SDSS J003632.35+240229.4 | … | outside | 334 | 307 | |
| Mkn 341-XI | SDSS J003631.95+240405.1 | … | outside | 405 | 317 | |
| Mkn 1-III | near 2XMM J011601.3+330821 | … | outside | 204 | 345 | |
| NGC 513-I | 2XMM J012437.0+335004 | … | outside | 134 | 41 | |
| NGC 513-VIII | 2XMM J012434.2+334732 | … | outside | 105 | 134 | |
| Mkn 1158-I | NCS: 01:35:15.7 +34:56:55 | … | outside | 376 | 148 | |
| Mkn 1158-II | NCS: 01:34:53.9 +34:57:27 | … | outside | 306 | 191 | |
| UGC 3157-I | … | … | outside | 179 | 246 | |
| UGC 3157-II | knot in arms | … | inside | 19.7 | 278 | |
| MS 04595+0327-II | NCS: 05:02:16.6 +3:33:46.7 | … | outside | 160 | 46.0 | |
| MS 04595+0327-III | NCS: 05:01:58.1 +3:29:06.9 | … | outside | 215 | 223 | |
| MS 04595+0327-IV | NCS: 05:02:01.8 +3:29:15.1 | … | outside | 187 | 213 | |
| UGC 3995-I | SDSS J074409.03+291228.5 | … | outside | 320 | 165 | |
| Mkn 1419-I | 145.213571 +3.51826 | … | outside | 299 | 131 | |
| Mkn 1419-II | SDSS J094107.46+033559.8 | … | outside | 493 | 81.8 | |
| Mkn 1419-III | SDSS J094053.84+033903.6 | … | outside | 368 | 44.5 | |
| Mkn 461-III | NCS: 206.83377, +34.18102 | … | edge | 104 | 14.5 | |
| Mkn 461-IV | NCS: 206.8468, 34.18784 | … | edge | 186 | 21.0 | |
| NGC 5548-I | SDSS J141818.19+250612.6 | … | edge(c1) | 281 | 114 | |
| NGC 5548-II | SDSS J141805.94+250416.3 | … | edge(w) | 258 | 155 | |
| NGC 5548-III | SDSS J141743.50+250400.1 | … | outside | 320 | 220 | |
| NGC 5548-IV | SDSS J141742.11+250411.4 | … | outside | 344 | 227 | |
| NGC 5548-VI | 2XMM J141746.9+250725 | … | outside | 172 | 257 | |
| NGC 5548-VII | SDSS J141745.92+250838.6 | … | outside | 173 | 275 | |
| NGC 5548-VIII | SDSS J141802.14+251030.4 | … | outside | 135 | 12.0 | |
| NGC 5548-IX | SDSS J141801.79+251108.3 | … | outside | 160 | 7.0 | |
| NGC 5548-X | SDSS J141819.78+250913.7 | … | edge | 348 | 103 | |
| Ark 539-III | 18:29:01.58 +50:23:50.2 | … | outside | 151 | 54.8 | |
| Ark 539-IV | 18:29:07.51 +50:20:35.4 | … | inside | 216 | 121 | |
| Ark 539-V | 18:29:07.89 +50:21:33.9 | … | inside | 194 | 102 | |
| Ark 539-VI | 18:28:57.85 +50:25:37.8 | … | outside | 223 | 25.3 |
4 Mkn 1 and its distant ionized cloud
4.1 Ionization
Our initial Lick spectrum showed the cloud to have high ionization, but left the ionizing mechanism ambiguous. The deeper BTA data show He II emission at a level requiring an AGN continuum if photoionized, and also show that the electron temperature and line widths are low enough to strongly disfavor shock ionization. This object is an instance of low-metallicity gas which can masquerade as being ionized by hot stars in the single strong-line BPT (Baldwin et al., 1981) diagram (Groves et al., 2006). For this reason, detection of He II emission has been important in establishing the ionizing source of extended clouds seen near galaxies, showing in some cases the presence of either obscured or fading AGN (Lintott et al. 2009, Keel et al. 2012a, Schweizer et al. 2013, Keel et al. 2019).
Table 3 shows emission-line ratios integrated along the slit for the entire cloud, and for the two subregions seen in the direct image. Modest differences in ionization properties are found between the NW and SE regions, with the SW part of the cloud more highly ionized, as seen in [O III]/H and He II/H. Good agreement is seen between integrated line ratios from our two sets of spectral data.
The [O III] line is marginally detected (formally at the 2 level) in the cloud integrated spectrum (Fig. 3). This lets us place a lower limit on the electron temperature via its ratio with the line. Using the temden task in the nebular package within IRAF (Shaw & Dufour, 1995), we place a bound K for low electron density ( as is typical for such distant AGN clouds). This temperature, and the ionization level found from [O III]/H and He II/H, clearly point to AGN radiation as the ionizing agent for this cloud. The line ratios are very similar to those observed in the EELRs studied in the Galaxy Zoo sample, as listed in Table 4 of Keel et al. (2012a) with the mean values shown in Table 3 here.
| Ratio | Lick | BTA Integrated | SE | NW | Mean EELR | |
|---|---|---|---|---|---|---|
| [O II] /[O III] | 0.42 | 0.39 | 0.43 | 0.50 | 0.51 | |
| [O III]/H | – | 9.34 | 10.9 | 7.20 | 8.38 | |
| [O III]/H | 2.40 | 2.22 | 2.83 | 1.47 | 2.74 | |
| H/H | – | 4.20 | 3.85 | 4.90 | – | |
| [N II]/H | 0.185 | 0.16 | 0.20 | 0.127 | 0.43 | |
| [O I]/H | – | 0.085 | 0.093 | 0.076 | 0.071 | |
| He II/H | – | 0.30 | ||||
| [Ne III] / O II] | – | 0.39 | 0.40 | 0.48 | 0.33 |
4.2 Relation to circumnuclear gas and H I
Stoklasová et al. (2009) present integral-field spectroscopy of the central regions of Mkn 1, showing resolved emission lines across a region spanning about 20″along the projected major axis of the inner disc of Mkn 1. Using the [O III]/H ratio to identify potential ionization cones shows narrow high-ionization regions to NE and SW. Outside the nuclear emission extending to about ″ , the possible ionization cones are seen between position angles 50–85∘ with the highest ionization along PA 65∘, slightly misaligned with the stellar distribution.
Archival Hubble Space Telescope images (Pjanka et al., 2017) show the inner disc to be elongated along PA 72∘, with numerous star-forming regions most prominent on its south and western sides (contributing strongly to the Balmer H and H flux maps from Stoklasová et al. 2009).
The distant cloud we have found is projected at radii 33–45″ and spans PA 207–236∘, while the inner possible ionization cone on this side spans 230–265∘, barely overlapping. If both structures are ionized by radiation in a fixed conical pattern, neither structure samples most of the cone width. This might mean that the inner disk gas and the outer H I structure are misaligned with each other and thus intercept different portions of the ionizing radiation pattern. Alternately, precession of the ionizing pattern on time scales years could produce this offset.
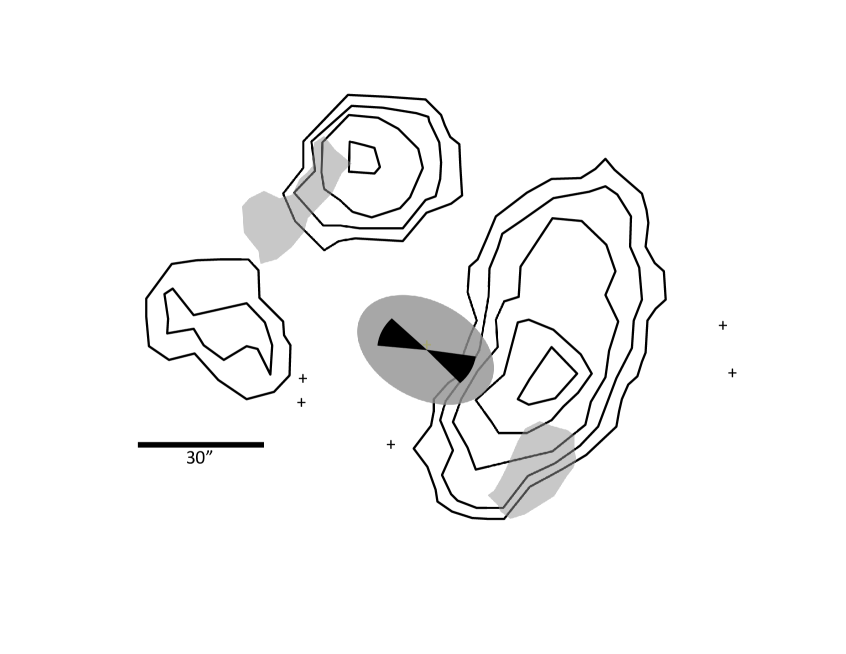
The highest-resolution available H I data are the GMRT results from Omar et al. (2002), with beam size ″FWHM. Fig. 4 schematically shows the locations of the southwest and possible northeast emission clouds compared to their H I contours. The confirmed SW cloud falls right at the outer edge of the H I structure, possible associated with an inflection of declining surface density, while the possible NE cloud falls largely in the gap between the two H I features in that side. We might speculate that this is similar to the location of Hanny’s Voorwerp in a gap in the H I tail of IC 2497, where ionization of most of the gas creates a gap in the H I structure. Fig. 4 also illustrates how the outer clouds and inner ionization cones overlap only partially in orientation around the nucleus.
4.3 Related dwarf galaxy?
A diffuse continuum object appears projected near the edge of the northwestern component of the emission-line cloud. As revealed by the HST WF3 F814W image (Pjanka et al., 2017), there is only one other similar bright and diffuse object in the Mkn 1 field, a nucleated object of comparably low surface brightness on the opposite side of Mkn 1 itself. This raises at least the possibility that this is a dwarf companion to Mkn 1, and the AGN is ionizing gas associated with this companion rather than purely diffuse H I in its surroundings (which would be an instance of cross-ionization, in the terminology of Keel et al. 2019). The relation between the emission cloud and continuum objects is shown in Fig. 5. The ionized gas component is not centered on the galaxy, leaving the possible association ambiguous.
4.4 Kinematics
We examine the velocity structure of the cloud by using wavelength peaks as retrieved from Gaussian fitting of the strongest lines, constraining both [O III] lines to have the same width. The results show a gradient of about 60 km s-1 along the detected extent of the cloud, with both the radial velocity and gradient in good agreement with the H I as measured by Kuo et al. (2008) and Omar et al. (2002). The velocity gradient in both H I data set is shallower, but subject to beam smoothing.. The gradient is subtle enough, in view of our typical uncertainty of order 30 km s-1, that it is unclear whether what two apparently distinct structural components in the cloud are also kinematically distinct (Fig. 6). The velocity data weakly suggest that the NW component has constant velocity while the SE one shows a gradient, but a single linear gradient is almost as good a fit.

4.5 Energy budget and AGN history
In principle, the ionization level of outlying EELR gas samples the past luminosity of the AGN. We follow the approach of Keel et al. (2012a) to estimate the minimum AGN luminosity needed to power the distant cloud, and compare with the obscured AGN luminosity (since Mkn 1 is a Type 2 Seyfert, this is appropriate). The cloud’s H surface rightness and projected distance from the nucleus require an ionizing luminosity ergs s-1, by a factor depending on the clumpiness of the gas (and through this, ultimately connected to its optical depth at the Lyman limit). The upper limit to the electron density from the [S II] lines cm-3 can give a complementary upper limit to the ionizing luminosity. Following Komossa & Schulz (1997), the ionization parameter derived from the [O II]/[O III] line ratio (Table 3) and a typical AGN continuum shape is . The emission rate of ionizing photons is , so for kpc and , photons s-1. For a generic AGN continuum, the mean energy of ionizing photons is roughly 2 Rydbergs, so this becomes erg s-1. These two approaches give bounds on the ionizing luminosity seen by the cloud at the epoch of the emitted photons erg s-1.
The far-infrared luminosity, predominantly from reprocessed UV radiation, is ergs s-1. A more complete accounting, adding the escaping ionizing radiation as traced by [O III] emission from the AGN itself, gives ergs s-1. This is sufficiently greater than the ionizing requirements for the cloud to make it plausible (although not required) that the AGN has maintained a roughly constant output over the light-travel time to the clouds ( years).
5 Sample implications for AGN cone angles and episode durations
We give a simple calculation of the typical width of ionization cones, under some simplifying assumptions. These are (1) that all the AGN are powerful enough to ionize observable clouds in the H I structures, and (2) that these structures are reasonably approximated as great-circle arcs viewed from each AGN. Estimates of the ionizing luminosity of each AGN, constructed from the far-IR luminosities and nuclear [O III] luminosities, lie with a factor of the value for Mkn 1 except for Akn 539, Mkn 461, UGC 3157, NGC 1167, and NGC 841 at lower luminosity. We used the published H I column-density maps from Kuo et al. (2008) to estimate the angle spanned by H I features around each AGN, approximated as tangential arcs (Table 4, along with the estimated AGN ionizing luminosity). Details of calculating the chances of randomly distributed arcs and (bi)cones intersecting are given in the Appendix.
Most of the nearby H I structures are associated with companion galaxies, and the H I data give redshifts making physical association very likely (so this is a search for cross-ionization as defined by Keel et al. 2019). Projection factors in these cases are poorly constrained, with no necessary connection to the AGN host inclination. In view of this, we considered examination of projection effects based on the inclinations of the remaining hosts, but as this would affect only 15% of the entries in Table 4, the outcome would still be dominated by the behavior of gas around companion galaxies.
| Field | A | |||
|---|---|---|---|---|
| (kpc) | (°) | (erg s-1) | (°) | |
| NGC 7469 | 24.7 | 120 | 31.9 | |
| NGC 5548-1 | 54.5 | 23 | 53.0 | |
| NGC 5548-2 | 80.5 | 15 | 55.3 | |
| NGC 5548-3 | 20.9 | 79 | 39.1 | |
| Ark 539 | 54.1 | 77 | 39.5 | |
| NGC 7679 | 62.3 | 72 | 40.5 | |
| NGC 7682 | 62.3 | 52 | 45.1 | |
| Mkn 461 | 58.9 | 26 | 52.0 | |
| MS 04595+0327 | 47.4 | 36 | 49.4 | |
| UGC 3157 | 68.5 | 26 | 52.0 | |
| Mkn 993 | 82.2 | 16 | 55.2 | |
| NGC 513 | 47.4 | 57 | 44.0 | |
| Mkn 1 | 62.3 | 74 | 40.1 | |
| NGC 1167 | 82.2 | 8.2 | 57.5 | |
| UGC 1395 | 52.1 | 31 | 50.7 | |
| Mkn 573 | 75.4 | 10 | 56.9 | |
| Mkn 1157 | 41.9 | 20 | 53.9 | |
| NGC 7591 | 50.0 | 26 | 52.0 | |
| NGC 841 | 109 | 24 | 52.8 | |
| Mkn 341 | 76.0 | 12 | 56.2 |
Notes: is the angle where as derived in the Appendix; with the observed angle (col. 3) measured on H I map
For the entire sample, the number of detections for the observed arc angles would suggest narrow cones of escaping ionizing radiation, typically width. This is so much narrower than most observed cone angles that it may suggest intermittent luminous episodes.
This conceptually clean formulation runs into several complications in actual data, so our results also provide an outline of ways to improve this approach. Projection effects can increase or decrease measured arc lengths, and could render an arc of gas more like a radial spur or blend it with the host galaxy disc. The limited angular resolution of the current H I data often blend external structures, to some extent, with the host disc gas. Finally, shadowing of some of the H I by material in the inner disc or AGN torus will often prevent ionizing radiation from escaping in both the planes (broadened if either one is warped or twisted; Lawrence & Elvis 2010). Our primary interest is in ionized gas outside the normal disc interstellar medium of the host galaxy; a sufficiently warped disc could escape the self-shielding of the inner regions. Lacking a prescription for a fuller treatment, we present the results as is with these cautionary notes.
6 Conclusions
We have surveyed the environments of a set of Seyfert galaxies with known H I structures, using a narrowband [O III] filter, in search of distant nebulosities photoionized by the AGN (EELRs). Among the 26 Seyfert galaxies with H I observations by Kuo et al. (2008), we find an EELR in one case. Mkn 1 is accompanied by a large emission-line region projected 12 pc from the AGN, for which spectroscopy confirms that it is photoionized by the AGN itself. Radial velocities support an association between this material and the larger extended H I disc. The location of this ionized region does not match the ionization cone inferred from circumnuclear gas, suggesting either that neither emission region fully crosses the escaping cone of radiation or that the cone of radiation moves on timescales years. A fainter emission-line cloud may appear on the opposite side of the galaxy, but interference from a very bright foreground star leaves this detection tentative.
Finding one EELR out of 20 extended H I structures in 18 galaxies suggests either that typical ionization cones are quite narrow (opening angle ) or that bright AGN phases are episodic compared to light-travel times 20,000-50,000 years. If the AGN in our sample are luminous enough to ionize gas at these distances, as seen from the example of Mkn 1 and nuclear luminosities in Tale 4, this conclusion follows from the expected number of cases in which randomly directed bicones intercept gaseous arcs of the lengths inferred from the H I data.
Acknowledgements
The observations at the SAO RAS 6 m telescope were
carried out with the financial support support of the Ministry of Science and Higher Education of the Russian Federation VNB acknowledges assistance from National Science Foundation (NSF) Research at Undergraduate Institutions (RUI) grant AST-1312296. GK acknowledges support from NSF grants DMS-1363239 and DMS-1900816. Findings and conclusions do not necessarily represent views of the NSF. AM, SD and AG thank the grant of Russian Science Foundation project 17-12-01335 “Ionized gas in galaxy discs and beyond the optical radius”.
Funding for the creation and distribution of the SDSS Archive has been provided by the Alfred P. Sloan Foundation, the Participating Institutions, the National Aeronautics and Space Administration, the National Science Foundation, the U.S. Department of Energy, the Japanese Monbukagakusho, and the Max Planck Society. The SDSS Web site is http://www.sdss.org/. The SDSS is managed by the Astrophysical Research Consortium (ARC) for the Participating Institutions. The Participating Institutions are The University of Chicago, Fermilab, the Institute for Advanced Study, the Japan Participation Group, The Johns Hopkins University, Los Alamos National Laboratory, the Max-Planck-Institute for Astronomy (MPIA), the Max-Planck-Institute for Astrophysics (MPA), New Mexico State University, Princeton University, the United States Naval Observatory, and the University of Washington.
This research has made use of the NASA/IPAC Extragalactic Database (NED), which is operated by the Jet Propulsion Laboratory, Caltech, under contract with the National Aeronautics and Space Administration. IRAF is distributed by the National Optical Astronomy Observatory, which is operated by the Association of Universities for Research in Astronomy (AURA) under a cooperative agreement with the National Science Foundation. The authors are honored to be permitted to conduct astronomical research on Iolkam Du’ag (Kitt Peak), a mountain with particular significance to the Tohono O’odham Nation.
References
- Afanasiev & Moiseev (2005) Afanasiev, V. L., & Moiseev, A. V. 2005, Astronomy Letters, 31, 194
- Baldwin et al. (1981) Baldwin, J. A., Phillips, M. M., & Terlevich, R. 1981, PASP 93, 5
- Crisp (2009) Crisp, R. D. 2009, Proc. SPIE, 7249
- Darg et al. (2010) Darg, D. W., Kaviraj, S., Lintott, C. J., et al. 2010, MNRAS, 401, 1043
- Dodonov et al (2017) Dodonov, S. N., Kotov, S. S., Movsesyan, T. A., & Gevorkyan, M. 2017, Astrophysical Bulletin, 72, 473
- Fukugita et al. (1995) Fukugita, M., Shimasaku, K., & Ichikawa, T. 1995, PASP, 107, 945
- Greene et al. (2004) Greene, J., Lim, J., & Ho, P. T. P. 2004, ApJS, 153, 93
- Groves et al. (2006) Groves, B. A., Heckman, T. M., & Kauffmann, G. 2006, MNRAS, 371, 1559
- Keel et al. (2012a) Keel, W. C., Chojnowski, S. D., Bennert, V. N., et al. 2012, MNRAS 420, 878
- Keel et al. (2012b) Keel, W. C., Lintott, C. J., Schawinski, K., et al. 2012, AJ, 144, 66
- Keel et al. (2017) Keel, W. C., Oswalt, T., Mack, P., et al. 2017, PASP, 129, 015002
- Keel et al. (2017b) Keel, W. C., Lintott, C. J., Maksym, W. P., et al. 2017, ApJ, 835, 256
- Keel et al. (2019) Keel W. C., et al., 2019, MNRAS, 483, 4847
- Komossa & Schulz (1997) Komossa, S., & Schulz, H. 1997, A&A, 323, 31
- Kuo et al. (2008) Kuo, C.-Y., Lim, J., Tang, Y.-W., & Ho, P. T. P. 2008, ApJ, 679, 1047
- LaMassa et al. (2015) LaMassa, S. M., Cales, S., Moran, E. C., et al. 2015, ApJ, 800, 144
- Landolt (1992) Landolt, A. U. 1992, AJ, 104, 340
- Lang et al. (2010) Lang, D., Hogg, D. W., Mierle, K., Blanton, M., & Roweis, S. 2010, AJ, 139, 1782
- Lawrence & Elvis (2010) Lawrence, A., & Elvis, M. 2010, ApJ, 714, 561
- Lintott et al. (2008) Lintott, C. J., et al. 2008, MNRAS, 389, 1179
- Lintott et al. (2009) Lintott, C. J., et al. 2009, MNRAS, 399, 129
- Miller & Stone (1992) Miller, J.S. & Stone, R.P.S., Lick Obs. Technical Report 66 (Santa Cruz, CA: Lick Observatory)
- Omar et al. (2002) Omar, A., Dwarakanath, K. S., Rupen, M., & Anantharamaiah, K. R. 2002, A&A, 394, 405
- Pjanka et al. (2017) Pjanka, P., Greene, J. E., Seth, A. C., et al. 2017, AJ, 844, 165
- Ruan et al. (2016) Ruan, J. J., Anderson, S. F., Cales, S. L., et al. 2016, ApJ, 826, 188
- Runnoe et al. (2016) Runnoe, J. C., Cales, S., Ruan, J. J., et al. 2016, MNRAS, 455, 1691
- Ryan-Weber et al. (2004) Ryan-Weber, E. V., Meurer, G. R., Freeman, K. C., et al. 2004, AJ, 127, 1431
- Sartori et al. (2016) Sartori, L. F., Schawinski, K., Koss, M., et al. 2016, MNRAS, 457, 3629
- Schawinski et al. (2010) Schawinski, K., Evans, D. A., Virani, S., et al. 2010, ApJL 724, L30
- Schawinski et al. (2015) Schawinski, K., Koss, M., Berney, S., & Sartori, L. F. 2015, MNRAS, 451, 2517
- Schirmer et al. (2013) Schirmer, M., Diaz, R., Holhjem, K., Levenson, N. A., & Winge, C. 2013, AJ, 763, 60
- Schweizer et al. (2013) Schweizer, F., Seitzer, P., Kelson, D. D., Villanueva, E. V., & Walth, G. L. 2013, AJ, 773, 148
- Shaw & Dufour (1995) Shaw, R. A., & Dufour, R. J. 1995, PASP, 107, 896
- Stockton et al. (2006) Stockton, A., Fu, H., & Canalizo, G. 2006, NewARv 50, 694
- Stoklasová et al. (2009) Stoklasová I., Ferruit P., Emsellem E., Jungwiert B., Pécontal E., Sánchez S. F., 2009, A&A, 500, 1287
- Tayal & Zatsarinny (2017) Tayal, S. S., & Zatsarinny, O. 2017, ApJ, 850, 147
- Tody (1986) Tody, D. 1986, Proc. SPIE, 627, 733
- Werk et al. (2010) Werk, J. K., Putman, M. E., Meurer, G. R., et al. 2010, AJ, 139, 279
- Wilson (1996) Wilson, A. S. 1996, Vistas in Astronomy, 40, 63
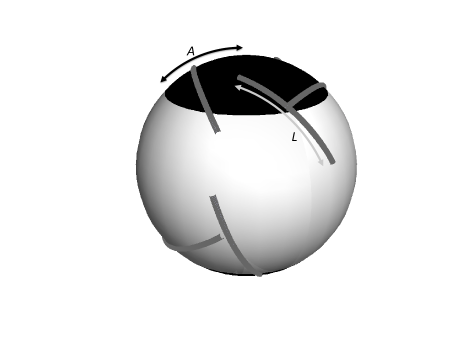
Appendix A Probability of an arc intersecting a double cap
Given a (double) cone of opening angle intersecting the unit sphere at two caps, we wish to find the probability that a random geodesic arc of length intersects one or both of the caps. In spherical coordinates, the caps are the regions and . Here we use spherical coordinates so that , and , , .
We shall compute the probability using conditional probabilities. Let denote the center of the random geodesic arc and the corresponding spherical coordinates. Let denote the probability that the arc intersects a cap given that . Then,
| (1) |
where is just the probability density for . Namely, the probability that is obtained by integrating which is the proportion of the sphere in the range .
The expression on the right in Eqn. 1 reflects the symmetry that the probabilities are the same for and . So, we only need to consider
Some simple cases are recorded below
The first case corresponds to values of where the arc cannot reach a cap no matter which way it points, the second case corresponds to when the center of the arc lands in a cap. The third case will now be determined.
To begin, there is no harm in assuming since the problem is rotationally symmetric. Then, . The vectors , , are pairwise perpendicular and can be used to form a local coordinate system at (they are a rotated version of ). The arc centered at can be parametrized via
This is derived by treating as we would usually treat in spherical coordinates. Here and will now be used to represent the angle the arc makes with . By symmetry we may assume .
It helps to recall the inequality
| (2) |
Equality occurs exactly when
| (3) |
The great circle containing our geodesic arc intersects a cap if there is a value of such that the -coordinate of is ; i.e.
| (4) |
Setting and in (2), equation (4) has a solution exactly when . This is equivalent to , and the maximal possible angle such that the great circle intersects a cap is . The corresponding values of satisfy
| (5) |
Since are all in the range , and have opposite signs which means is in quadrants IV and II. Therefore, the closest point of intersection occurs when and this means the great circle intersects both caps or no caps. In particular, if , then the arc intersects the cap for in the range .
This shows that for
which does not depend on .
For , the arc intersects the cap in the full sweep as long as the intersection point at the maximal angle occurs for , or equivalently . By (5), at the maximal angle, and when the arc intersects the cap for . Namely, for each with , we get .
If the arc does not intersect the cap in the full range , then . Assuming also , so that the arc can actually intersect the cap, the maximal angle at which the arc intersects the top cap occurs when . From (4), when
making the range of given by . So, for .
We can now compute according to two cases.
For
For