Environmental Effects on the UV Upturn in Local Clusters of Galaxies
Abstract
We explore the dependence of UV upturn colours in early type cluster galaxies on the properties of their parent clusters (such as velocity dispersion and X-ray luminosity) and on the positions and kinematics of galaxies within them. We use a sample of 24 nearby clusters with highly complete spectroscopy and optical/infrared data to select a suitable sample of red sequence galaxies, whose FUV and NUV magnitudes we measure from archival GALEX data. Our results show that the UV upturn colour has no dependence on cluster properties and has the same range in all clusters. There is also no dependence on the projected position within clusters or on line-of-sight velocity. Therefore, our conclusion is that the UV upturn phenomenon is an intrinsic feature of cluster early type galaxies, irrespective of their cluster environment.
keywords:
galaxies: formation and evolution – stars: horizontal branch1 Introduction
| Cluster | RA (2000) | (2000) | Optical photometry | GALEX images | |||
|---|---|---|---|---|---|---|---|
| hh:mm:ss | dd:mm:ss | 0.1–2.4 KeV | km s-1 | ||||
| Abell 930 | 10 06 54.6 | 37 40 | 0.0549 | 35.78 | 907 | SDSS, PS1 | AIS 315 |
| Abell 954 | 10 13 44.8 | 06 31 | 0.0932 | 37.91 | 832 | SDSS, PS1 | MIS DR1 |
| Abell 957 | 10 13 40.3 | 54 52 | 0.0436 | 36.60 | 640 | SDSS, PS1 | MIS DR1, DR2 |
| Abell 1139 | 10 54 04.3 | +01 29 56 | 0.0398 | 37.33 | 503 | SDSS, PS1 | MIS DR2 |
| Abell 1189 | 11 11 04.0 | +01 07 42 | 0.0962 | 36.19 | 814 | SDSS, PS1 | MIS DR1 |
| Abell 1236 | 11 22 44.9 | +00 27 44 | 0.102 | 36.42 | 589 | SDSS, PS1 | MIS DR1 |
| Abell 1238 | 11 22 58.0 | +01 05 32 | 0.0733 | 36.49 | 586 | SDSS, PS1 | MIS WZN11 |
| Abell 1364 | 11 43 39.6 | 45 39 | 0.106 | 35.85 | 600 | SDSS, PS1 | GI5–GAMA12, MISGCSN |
| Abell 1620 | 12 49 46.1 | 35 20 | 0.0821 | 34.48 | 1095 | SDSS, PS1 | MIS DR1 |
| Abell 1663 | 13 02 50.7 | 30 22 | 0.0843 | 37.00 | 884 | SDSS, PS1 | MIS DR1 |
| Abell 1692 | 13 12 16.0 | 55 55 | 0.0842 | 36.75 | 686 | SDSS, PS1 | GI4 |
| Abell 1750 | 13 30 49.9 | 52 22 | 0.0852 | 37.50 | 981 | SDSS, PS1 | MISGCSN |
| Abell 2660 | 23 45 18.0 | 58 20 | 0.0525 | 35.70 | 845 | PS1 | AIS 279 |
| Abell 2734 | 00 11 20.7 | 51 18 | 0.0618 | 37.41 | 780 | PS1 | GI1 |
| Abell 2780 | 00 29 17.1 | 23 25 | 0.0988 | … | 782 | PS1 | AIS 280 |
| Abell 3094 | 03 11 25.0 | 53 59 | 0.0677 | 36.76 | 774 | PS1 | AIS 405 |
| Abell 3880 | 22 27 52.4 | 34 12 | 0.0548 | 37.27 | 855 | PS1 | MIS2DFSGP |
| Abell 4013 | 23 31 51.8 | 16 26 | 0.0500 | … | 904 | SuperCosmos | AIS 394 |
| Abell 4053 | 23 54 46.7 | 40 18 | 0.0720 | … | 994 | PS1 | AIS 280 |
| Abell S0003 | 00 03 09.5 | 53 18 | 0.0644 | … | 833 | PS1 | AIS 280 |
| Abell S0084 | 00 09 24.0 | 31 28 | 0.108 | 37.41 | 807 | PS1 | MIS2DFSGP |
| Abell S0166 | 01 34 23.4 | 35 39 | 0.0697 | … | 511 | SuperCosmos | AIS 407 |
| Abell S1043 | 22 36 26.8 | 20 26 | 0.0340 | … | 1345 | PS1 | MIS2DFSGP |
The Ultraviolet Upturn or Excess is an unexpected rise in flux in the spectral energy distributions of early-type galaxies shortwards of 2500 Å. It appears to be a nearly ubiquitous property of spheroids and bulge-dominated galaxies (see, e.g., Yi 2008, 2010 for a recent review) although their generally old, metal-rich and quiescent stellar populations (e.g., Thomas et al. 2005, 2010) should contain no sources capable of providing significant flux below the 4000 Å break. While many candidates have been proposed, the source population is generally agreed to consist of hot horizontal branch (HB) stars (Greggio & Renzini, 1990; Brown et al., 1998a) and it now appears most likely that this population is helium-rich and formed in situ at high redshift (Ali et al., 2018a, b, c). While such stars are now known to exist in globular clusters in our Galaxy (e.g., see Norris 2004; Piotto et al. 2005, 2007) and likely elsewhere (Kaviraj et al., 2007b; Mieske et al., 2008; Peacock et al., 2017), the origin of such high helium abundances is unclear111It must be noted that this hypothesis was originally presented by Hartwick (1968) and Faulkner (1972), who also commented on the ‘unpalatability’ of the proposed solution.. It has been suggested that the effect may depend on the environment: stratification of helium in the centres of clusters might create populations of galaxies with high helium abundances (Peng & Nagai, 2009). On the other hand, it is also possible that the helium enrichment depends on the details of early star formation, as in globular clusters. Differences in the originating mechanisms or timescales may be reflected in different evolutionary histories for galaxies in clusters and the field. Atlee et al. (2009) finds a slow decrease in the strength of the upturn for a sample of bright field elliptical galaxies at compared to the nearly constant colour for very bright ellipticals in the works of Brown et al. (1998b, 2000, 2003) and brightest cluster galaxies (Loubser & Sánchez-Blázquez, 2011; Boissier et al., 2018). In our work on much larger samples of cluster early types with luminosities down to , we also see no evolution at (Ali et al., 2018a, b, c) but then detect a rapid reddening in the UV colour at ; this may be consistent with the last data point in Atlee et al. (2009), despite the large errors and small number statistics. Le Cras et al. (2016) also find evidence for evolution in the UV upturn at , albeit from stacked spectra and using spectroscopic indices sensitive to the HB population, for a sample of very luminous BOSS galaxies (as opposed to the UV photometry used by other studies).
Ali et al. (2018a) compared the UV upturn colours for galaxies in the Coma, Fornax and Perseus clusters, and found no evidence that the UV upturn was affected by the environment, a conclusion also reached by Smith et al. (2012b) when comparing galaxies in the Coma and Virgo clusters. Similarly, the UV upturn colour of brightest cluster galaxies in the samples of Loubser & Sánchez-Blázquez (2011) and Boissier et al. (2018) did not appear to depend strongly on cluster properties. However, it would be interesting to extend this to several cluster environments and consider the eventual dependence on position within the cluster and on kinematics. For example, if residual star formation contributes to the UV flux, as argued by Rich et al. (2005); Yi et al. (2005); Salim & Rich (2010) then one would expect to observe a dependence on cluster properties (e.g., X-ray luminosity if ram stripping is important) and/or on position within the cluster or kinematics (as a proxy for orbits that avoid or pass through the cluster core for instance). Although the effect may be stochastic, it should emerge at some level in the ensemble of several clusters studied here.
Furthermore, the Helium sedimentation model of Peng & Nagai (2009) predicted that the strength of the UV upturn should be stronger in a) larger mass clusters; b) clusters with cooling flows and; c) in dynamically relaxed clusters. The model also predicts that UV upturn galaxies should be more prevalent in cluster cores. However, these key environmental dependencies of the upturn strength were proven to not hold true by the studies of Donahue et al. (2010) and Loubser & Sánchez-Blázquez (2011), who found no correlation between the colour (a measure of the upturn strength) in low redshift cluster galaxies and the aforementioned parameters (see also Yi et al. 2011).
In this paper we exploit a highly complete sample of galaxies in 24 nearby clusters to derive the dependence of the UV upturn color on cluster properties and on the local cluster environment. We describe the sample and photometry in the next section and present the results in section 3. Discussion of our findings and conclusions are shown in section 4. We assume the conventional cosmological parameters from the latest Planck datasets.
2 Database
The sample we studied here consists of galaxies in 24 clusters from the sample of De Propris (2017). These clusters span a wide range of properties in terms of velocity dispersion, X-ray luminosity and Bautz-Morgan type and therefore allow us to consider how the UV upturn colour is affected by cluster properties over a large range in environmental density, hot gas content and dynamical indicators (e.g., relaxed vs. merging clusters). In particular, we can explore the regime between massive systems, such as Coma or Perseus, and poor clusters and rich groups (similar, in some respect to Virgo or Fornax).
Each cluster was observed with the CTIO 4m telescope in the band, to produce a deep (300s exposure) image of the entire cluster across its Abell radius.The luminosity is found, empirically, to be an excellent proxy for stellar mass (Gavazzi et al., 1996; Bell & de Jong, 2001; Kettlety et al., 2018) and this therefore provides a stellar mass selected sample of galaxies in nearby clusters (mean redshift of 0.075). Galaxies in these clusters down to at least the level of the measured were identified as spectroscopic members (with typical completeness of about 80% even in the faintest luminosity bin considered) from existing spectroscopic data. This also provides information on the kinematics of these galaxies within each cluster.
For all galaxies we derived optical colours ( or ) from data in the PanStarrs1 survey (Chambers et al., 2016; Flewelling et al., 2016; Magnier et al., 2016) or (for objects below –30∘) in the SuperCosmos survey (Hambly et al., 2001a, b).
We then matched all confirmed spectroscopic members to FUV and NUV data in the GALEX database (Morrissey et al., 2007). We used a matching radius and only selected objects with S/N of at least 5 in the GALEX NUV photometry. These come from a combination of AIS and MIS imaging. Exposure times range from a few ks in MIS data to a few hundred seconds in AIS. For blue cloud galaxies in our clusters, 93% have a NUV detection and 76% have a FUV detection, whereas 72% of red sequence galaxies have a NUV detection and 40% have a FUV detection. We can assume that objects with no NUV detection have red colours, given the high detection fraction for blue cloud galaxies.
In Table 1 we show the main properties of each cluster used and the relevant information on the sources of photometry (see also De Propris et al. 2018). All data were corrected for Galactic extinction using the latest values from Schlafly & Finkbeiner (2011) and extrapolating to the FUV and NUV bands with a Milky Way extinction law (e.g., Calzetti et al. 1994). Optical and infrared data were corrected for extinction with the same procedures. Colours were also -corrected using the derived UV spectral energy distribution (SED) from Ali et al. (2018a). This uses a standard model from Conroy et al. (2009) for the optical and a 16000K blackbody for the contribution due to the vacuum UV light, a combination that fits the observed spectral energy distributions of Coma cluster galaxies across the whole range from 1000 to 10000 Å.
3 Results
3.1 Identification of quiescent galaxies
In our previous papers (De Propris, 2017; De Propris et al., 2018) we have identified galaxies on the red sequence and blue cloud by fitting a straight line to the colour-magnitude relation (in each cluster, separately) using a minimum absolute deviation method that discriminates against outliers (see De Propris 2017; De Propris et al. 2018 for details). The 1 scatter in for red sequence galaxies was measured to be 0.05 mag. and we therefore selected galaxies as belonging to the red sequence if they lie within mag. of the best-fitting straight line to the colour-magnitude relation. Bluer cluster members are assigned to the blue cloud.
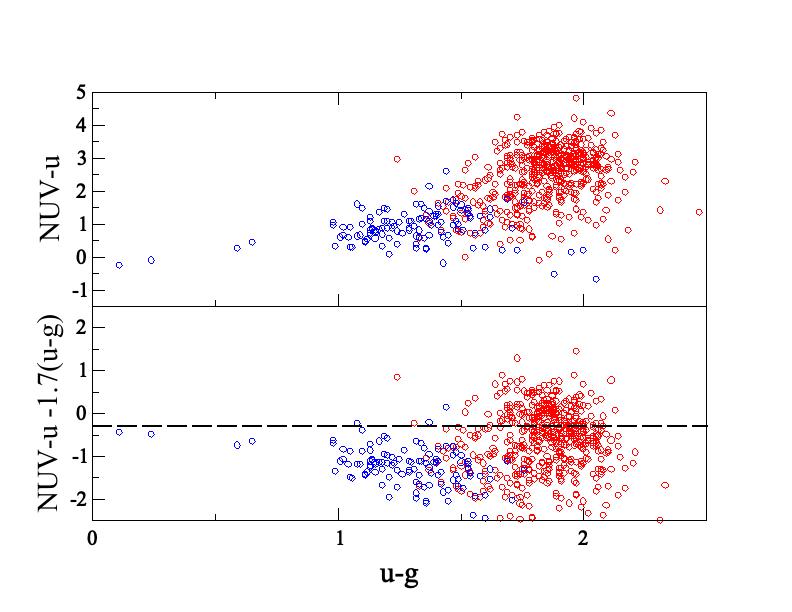
Red sequence galaxies (selected in the optical) consist of truly quiescent objects (whose UV light is produced by the UV upturn) and galaxies with residual star formation (sometimes called the ‘green valley’ – e.g., Rich et al. 2005; Salim & Rich 2010). Several studies have adopted cuts in colours to separate quiescent galaxies from those with residual star formation. Kaviraj et al. (2007a) place their selection at , while Crossett et al. (2014) adopt a somewhat more stringent limit to their sample of clusters. Here we choose this latter definition.
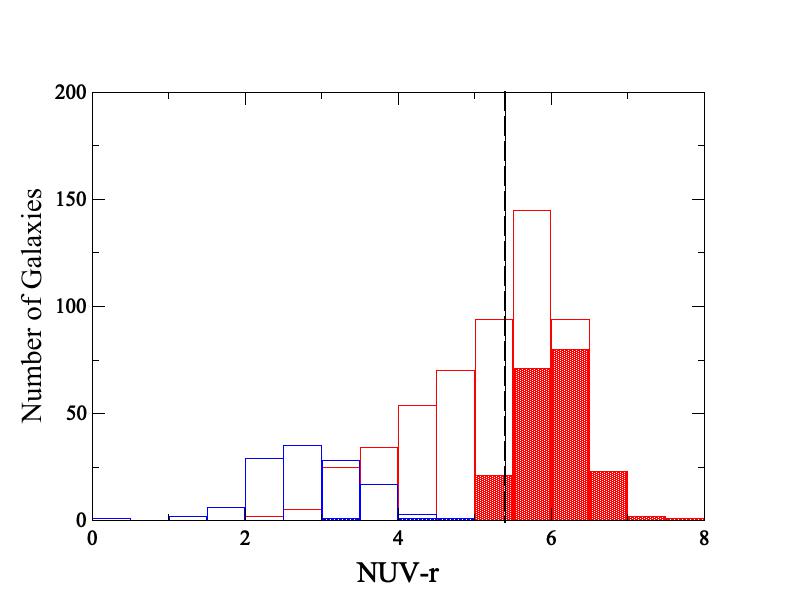
Below, we show how this selection is justified from our data. We plot vs. for all galaxies (this is only possible for those with SDSS data, as indicated in Table 1) in Fig. 1 (top panel). Here red dots are red sequence galaxies and blue dots are galaxies in the blue cloud (as defined above). These latter objects follow an approximate straight line in this colour-colour plane (i.e. the so-called star-forming main sequence – e.g., Speagle et al. 2014). We fit this with a straight line and remove this trend from all objects, resulting in the middle panel of Fig. 1. By choosing a limit we can exclude the vast majority of objects with star formation from the sample. However, note that we cannot apply this selection to all our clusters, as those in the South have no data (this is not provided by PanStarrs1). In the bottom panel of this figure we plot the number counts of galaxies as a function of color before and after the above selection. Almost all star-forming galaxies have and our criterion appears to isolate a nearly pure sample of quiescent systems (see also Phillipps et al. 2019, in preparation for a detailed discussion).
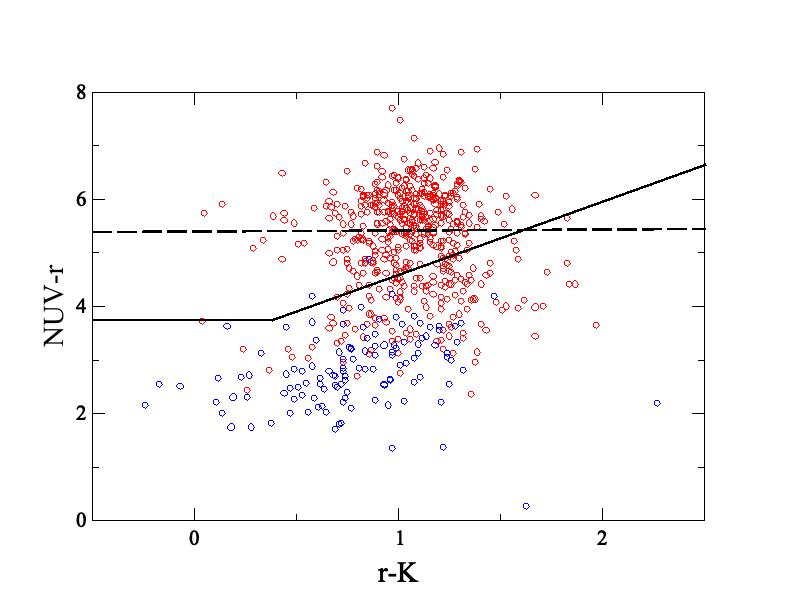
Arnouts et al. (2013) estimate the star formation rate in galaxies by fitting the full spectral energy distributions and then derive a vector in the vs. plane that separates star-forming and quiescent galaxies (cf. Phillipps et al. 2019, where we use MAGPHYS derived star formation rates to the same purpose). They confirm this approach from a morphologically selected sample in Moutard et al. (2016a, b). We plot this colour-colour plot in Fig. 2 with the same colour scheme as in Fig. 1. As we see a colour cut at lies well above their NRK vector. We therefore conclude that selecting galaxies with produces a sample consisting largely of passive galaxies whose UV light is dominated by upturn sources, whereas the original cut by Kaviraj et al. (2007a) may still include a small fraction of objects with residual star formation.
3.2 UV colors of quiescent galaxies
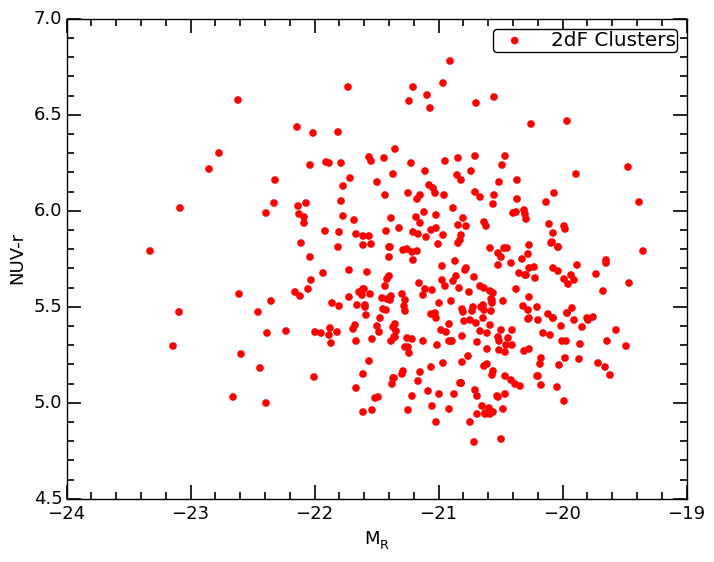
Fig. 3 shows the derived and colours for cluster red sequence galaxies plotted against . The colours mostly range between 5.5 and 7.5 mag. This observed magnitude range in colour is similar to that of Coma (Smith et al., 2012b) and Perseus (Ali et al., 2018a), as well as that observed in Virgo red sequence galaxies (Boselli et al., 2005). The colour varies between 5 and 6.5 mag., and once again, the magnitude range observed is typical of the aforementioned low redshift cluster galaxies. This can be compared with the well-known small scatter of optical-infrared colour-magnitude relations for red sequences in clusters (e.g., Valentinuzzi et al. 2011). In our sample, the intrinsic scatter is for red sequence galaxies is 0.05 mag. (De Propris, 2017), i.e., nearly two orders of magnitudes smaller than in or . This consistent range in and observed between all low redshift cluster galaxies indicates that the upturn is a universal feature among all such old, passively evolving systems and also that the environment must not have any significant influence on this phenomenon, since the clusters studied here have a wide variety of properties.
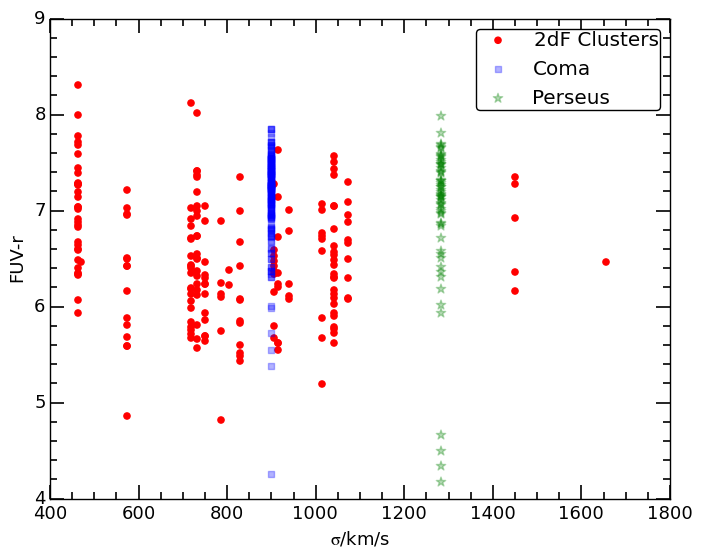
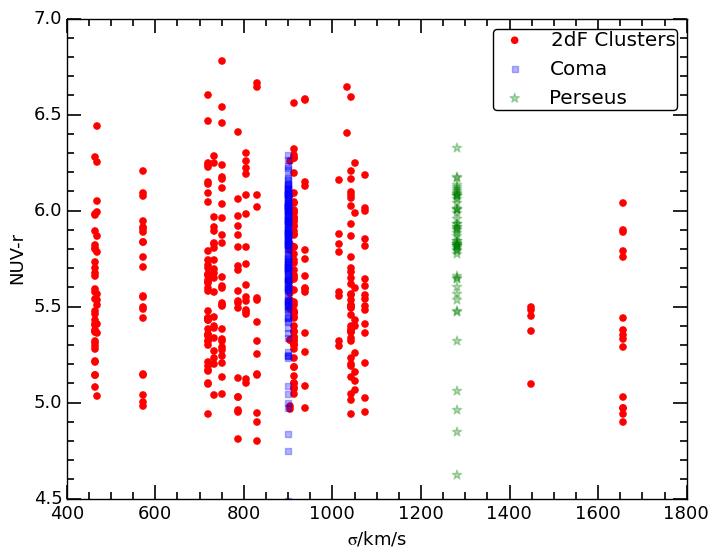
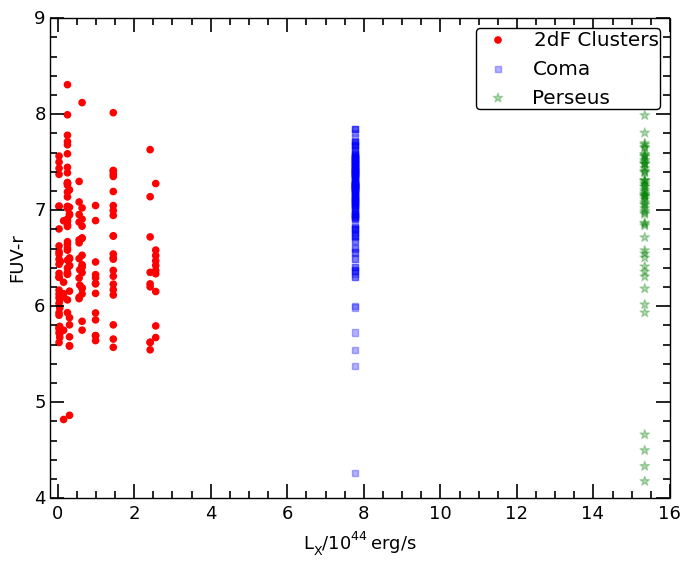
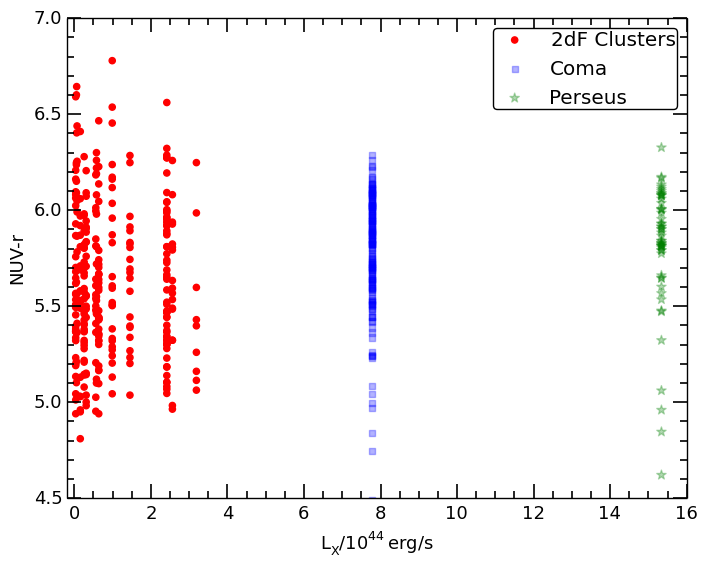
We further explore this by plotting and colours for galaxies in clusters vs. the cluster velocity dispersion (a broad proxy of the cluster mass) and vs. the X-ray luminosity in the ROSAT soft band (Truemper 1993; taken from the BAX catalogue - Sadat et al. 2004), which is a measure of the gas density in each cluster, in Fig. 4. We also plot data for Coma and Perseus for comparison. It is clear that there is no obvious trend in these colours with cluster properties, across a wide range of cluster masses. As we expect that velocity dispersion and X-ray luminosity would affect any residual star formation, the lack of correlation with these parameters further argues that the UV upturn properties were established at early times, prior to the epochs at which galaxies first felt the effects of the cluster environment.
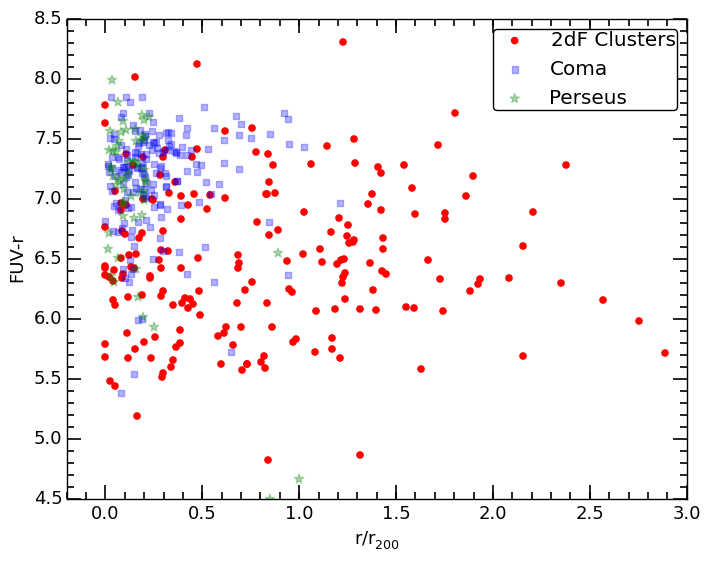
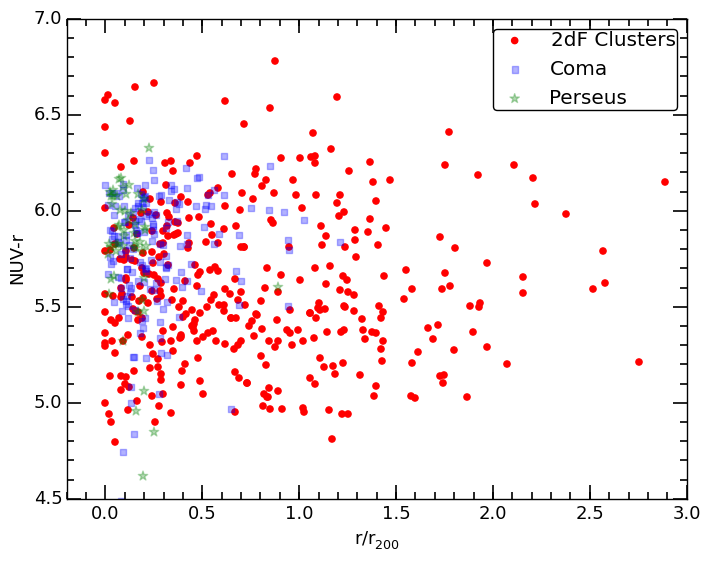
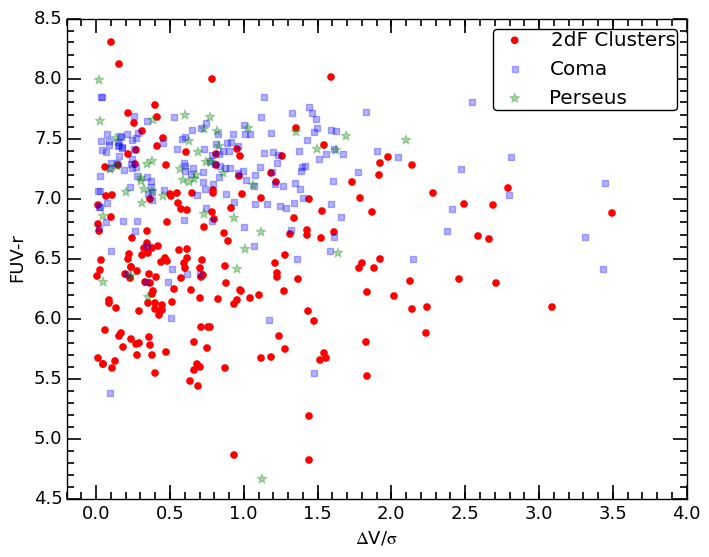
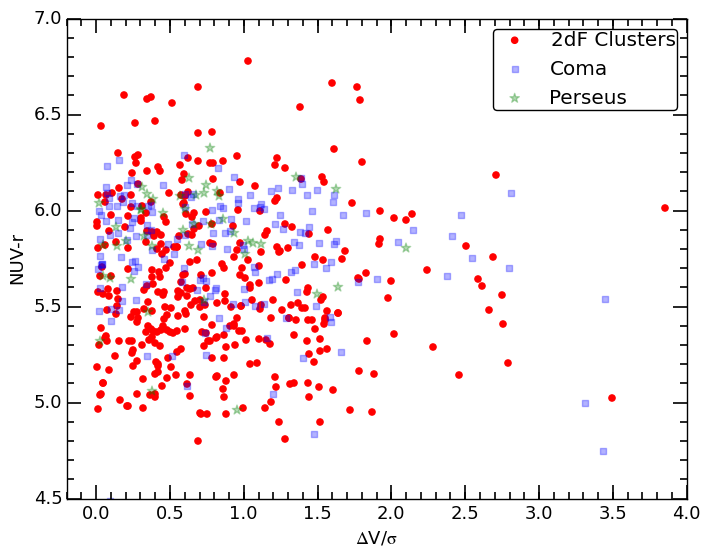
We next consider whether the UV upturn colour is affected by position within the cluster or by kinematics. In Fig. 5 we plot and vs , where is calculated from Carlberg et al. (1997) using data from De Propris (2017). Objects projected closer to the centre are likely to have been in the cluster core longer (Smith et al., 2012a): these are mainly classical ellipticals in the inner 0.3 . The colours appear identical irrespective of projected position. Neither do we see any dependence of these colours on (Fig. 5), where is the difference between the velocity of each galaxy and the mean velocity of its parent cluster and is the cluster velocity dispersion (thus objects with higher are likely to be less virialised and to move on more radial orbits, and therefore to be relative newcomers to the cluster environment and to be more affected by tidal and ram stripping processes). Therefore, these provide further evidence against the existence of strong environmental effects, especially those that would affect continuing star formation.
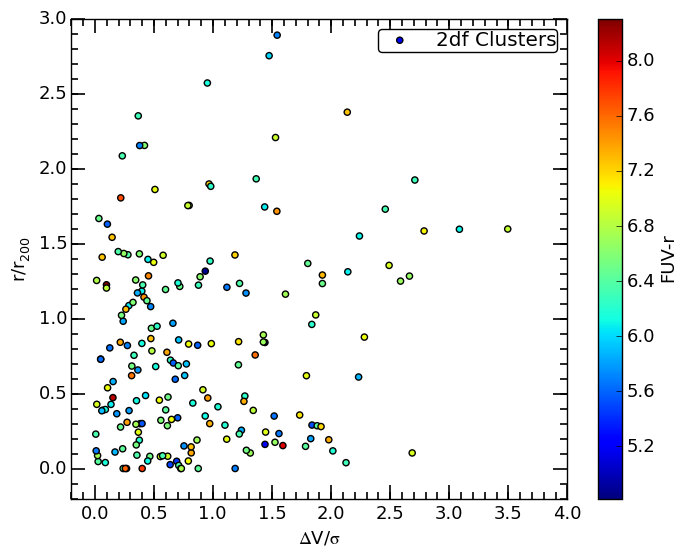
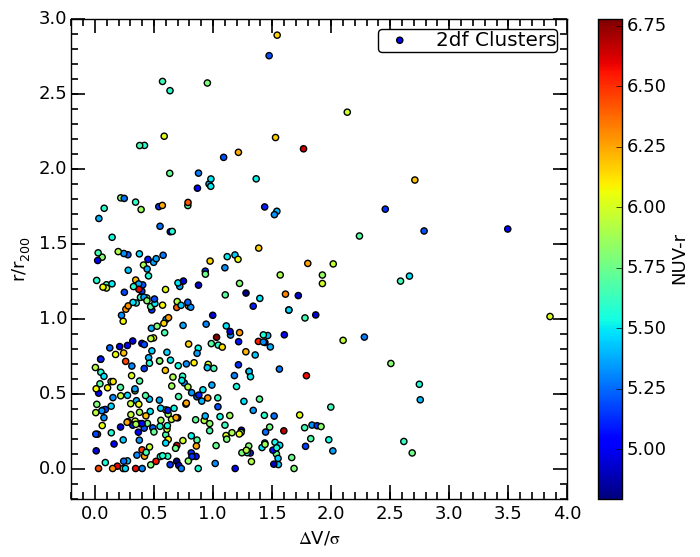
Finally we plot vs. for galaxies colour-coded according to their and colours, in Fig. 6. These caustic plots are related to the orbits of galaxies within clusters and we observe no significant dependence on UV upturn colour. This again suggests that the UV upturn is unrelated to the cluster environment.
4 Discussion
As with Coma and Perseus in our previous paper (Ali et al., 2018a), the results obtained here can be best interpreted with the presence of a He-enhanced sub-population of hot HB stars giving rise to the upturn, superimposed on top of the majority ‘red and dead’ population that makes up ETGs. The range in colours can then be explained by varying amounts of He-enhancement. Using the YEPS Stellar Population Synthesis models of Chung et al. (2017) that incorporate He-enhancement, is predicted (assuming solar metallicity and ) to account for the full range in and colours seen in all of these clusters below (note that metallicity, unless highly subsolar, which is not the case for these galaxies, does not strongly affect the HB morphology and therefore the UV colours for passive galaxies, so the observed range in colours cannot be accounted for my metal abundance). Consistent with the observations of Ali et al. (2018c), these models predict that the UV upturn colour is nearly constant to (depending on and the epoch at which the stars were formed) and then evolves rapidly to the red. This is indeed observed in a cluster (Ali et al., 2018c). It is also interesting that the bluest UV upturn colours tend to occur among the most massive galaxies, which also tend to be older and more metal rich (Smith et al., 2012b). These galaxies also have resided in the cluster core for longer times (Smith et al., 2012a). Similarly, Ali et al. (2018a) find that the more massive galaxies have a hotter and more populated HB as well. This may be due to a greater degree of helium enrichment but also to the effect of larger ages in thinning the remaining stellar atmosphere.
Under dynamical equilibrium the velocity dispersion and X-ray luminosity of a cluster directly correlate with its mass. Fig. 4 demonstrates that the upturn strength has no correlation with either velocity dispersion or X-ray luminosity, and by proxy the mass of the cluster. As such, clusters of all sizes can have a component of upturn in their early-type population.
Within galaxy clusters, star-formation is quenched very strongly in the centre due to processes such as ram-pressure stripping, harassment and strangulation. The rate of star-formation in cluster galaxies thus tends to increase with increasing cluster-centric distance (e.g., Dressler et al., 1997). If star-formation was the sole driving mechanism behind the UV emission in the galaxies in this sample, as argued by Yi et al. (2005), one would expect to see the and colours become bluer with increasing radius, at least in an ensemble. However as seen in Fig. 5 the UV-optical colours show no correlation with cluster-centric distance. This reinforces the idea that the UV emission in these galaxies is indeed from an old, hot HB subpopulation and not from any residual star-formation. Similarly, there appears to be no correlation between the line-of-sight velocity of galaxies and the upturn strength, in Fig. 5. Therefore, the influence of the cluster’s gravitational potential - the main driving force behind the velocities - does not affect the strength of the upturn. We can see from Fig. 6 that the majority of cluster members are centred around the core of the cluster (, ), yet these central galaxies show the full range of and colours as seen from the entire population of galaxies. This suggests that there is no gradient in UV upturn colour with either cluster-centric distance or line-of-sight velocity.
These results are more in line with a He-enhanced HB origin for the UV upturn, in which case the cluster environment should have little effect on the emergence and prevalence of the upturn. The observed lack of environmental dependence with position within the cluster implies that the extra helium cannot come from stratification as in the model of Peng & Nagai (2009). In a hierarchical model of structure formation, galaxies form first at and the star formation in ETGs rapidly comes to an end by (Jørgensen et al., 2017) . Galaxies then accrete in highly over-dense regions of the universe to form clusters at (e.g. Wen & Han, 2011). Studies have shown that cluster red sequences are already established between (Newman et al., 2014). This indicates that the majority of star-formation in ETGs was completed and a mostly passively evolving stellar population, that is observed at present, was already established before these galaxies became part of clusters, or shortly thereafter. While some field ETGs show evidence of residual star formation where at least part of their stellar populations is formed more recently (e.g., Jeong et al. 2007; Davis et al. 2013), this is unlikely to be the case for cluster ETGs: our UV SEDs for ETGs in Coma (Ali et al., 2018a) and Abell 1689 (Ali et al., 2018b), for instance, are inconsistent with a contribution from star formation to the UV light.
This is particularly important as the oldest stars in ETGs, ones that formed at , before the galaxies became part of clusters (Guarnieri et al., 2018) are the ones that would have the necessary time required to evolve from the main sequence on to the red giant branch, and then eventually to the horizontal branch, where they become UV-bright given sufficient He-enhancement. Since the cluster environment particularly works to quench the star-formation within galaxies, the main sequence population in ETGs, which is already red and passively evolving, is largely unaffected. Hence, the upturn develops intrinsically within these galaxies irrespective of the cluster environment. This also indicates that the large He-enhancement that leads to the eventual UV upturn in a sub-population of the main sequence in ETGs must also occur intrinsically within the galaxies and at very early times.
Acknowledgements
The Pan-STARRS1 Surveys (PS1) and the PS1 public science archive have been made possible through contributions by the Institute for Astronomy, the University of Hawaii, the Pan-STARRS Project Office, the Max-Planck Society and its participating institutes, the Max Planck Institute for Astronomy, Heidelberg and the Max Planck Institute for Extraterrestrial Physics, Garching, The Johns Hopkins University, Durham University, the University of Edinburgh, the Queen’s University Belfast, the Harvard-Smithsonian Center for Astrophysics, the Las Cumbres Observatory Global Telescope Network Incorporated, the National Central University of Taiwan, the Space Telescope Science Institute, the National Aeronautics and Space Administration under Grant No. NNX08AR22G issued through the Planetary Science Division of the NASA Science Mission Directorate, the National Science Foundation Grant No. AST-1238877, the University of Maryland, Eotvos Lorand University (ELTE), the Los Alamos National Laboratory, and the Gordon and Betty Moore Foundation.
This work is based in part on observations made with the Galaxy Evolution Explorer (GALEX). GALEX is a NASA Small Explorer, whose mission was developed in cooperation with the Centre National d’Etudes Spatiales (CNES) of France and the Korean Ministry of Science and Technology. GALEX is operated for NASA by the California Institute of Technology under NASA contract NAS5-98034.
This research has made use of the NASA/IPAC Extragalactic Database (NED) which is operated by the Jet Propulsion Laboratory, California Institute of Technology, under contract with the National Aeronautics and Space Administration.
References
- Ali et al. (2018a) Ali S. S., Bremer M. N., Phillipps S., De Propris R., 2018a, MNRAS, 476, 1010
- Ali et al. (2018b) Ali S. S., Bremer M. N., Phillipps S., De Propris R., 2018b, MNRAS, 478, 541
- Ali et al. (2018c) Ali S. S., Bremer M. N., Phillipps S., De Propris R., 2018c, MNRAS, 480, 2236
- Arnouts et al. (2013) Arnouts S., et al., 2013, A&A, 558, A67
- Atlee et al. (2009) Atlee D. W., Assef R. J., Kochanek C. S., 2009, ApJ, 694, 1539
- Bell & de Jong (2001) Bell E. F., de Jong R. S., 2001, ApJ, 550, 212
- Boissier et al. (2018) Boissier S., Cucciati O., Boselli A., Mei S., Ferrarese L., 2018, A&A, 611, A42
- Boselli et al. (2005) Boselli A., et al., 2005, ApJ, 629, L29
- Brown et al. (1998a) Brown T. M., Ferguson H. C., Stanford S. A., Deharveng J.-M., 1998a, ApJ, 504, 113
- Brown et al. (1998b) Brown T. M., Ferguson H. C., Deharveng J.-M., Jedrzejewski R. I., 1998b, ApJ, 508, L139
- Brown et al. (2000) Brown T. M., Bowers C. W., Kimble R. A., Ferguson H. C., 2000, ApJ, 529, L89
- Brown et al. (2003) Brown T. M., Ferguson H. C., Smith E., Bowers C. W., Kimble R. A., Renzini A., Rich R. M., 2003, ApJ, 584, L69
- Calzetti et al. (1994) Calzetti D., Kinney A. L., Storchi-Bergmann T., 1994, ApJ, 429, 582
- Carlberg et al. (1997) Carlberg R. G., et al., 1997, ApJ, 485, L13
- Chambers et al. (2016) Chambers K. C., et al., 2016, arXiv e-prints, 1612.05560
- Chung et al. (2017) Chung C., Yoon S.-J., Lee Y.-W., 2017, ApJ, 842, 91
- Conroy et al. (2009) Conroy C., Gunn J. E., White M., 2009, ApJ, 699, 486
- Crossett et al. (2014) Crossett J. P., Pimbblet K. A., Stott J. P., Jones D. H., 2014, MNRAS, 437, 2521
- Davis et al. (2013) Davis T. A., et al., 2013, MNRAS, 429, 534
- De Propris (2017) De Propris R., 2017, MNRAS, 465, 4035
- De Propris et al. (2018) De Propris R., Bremer M. N., Phillipps S., 2018, A&A, 618, A180
- Donahue et al. (2010) Donahue M., et al., 2010, ApJ, 715, 881
- Dressler et al. (1997) Dressler A., et al., 1997, ApJ, 490, 577
- Faulkner (1972) Faulkner J., 1972, Nature Physical Science, 235, 27
- Flewelling et al. (2016) Flewelling H. A., et al., 2016, arXiv e-prints, 1612.05243
- Gavazzi et al. (1996) Gavazzi G., Pierini D., Boselli A., 1996, A&A, 312, 397
- Greggio & Renzini (1990) Greggio L., Renzini A., 1990, ApJ, 364, 35
- Guarnieri et al. (2018) Guarnieri P., et al., 2018, arXiv e-prints, 1811.12422
- Hambly et al. (2001a) Hambly N. C., et al., 2001a, MNRAS, 326, 1279
- Hambly et al. (2001b) Hambly N. C., Irwin M. J., MacGillivray H. T., 2001b, MNRAS, 326, 1295
- Hartwick (1968) Hartwick F. D. A., 1968, ApJ, 154, 475
- Jeong et al. (2007) Jeong H., Bureau M., Yi S. K., Krajnović D., Davies R. L., 2007, MNRAS, 376, 1021
- Jørgensen et al. (2017) Jørgensen I., Chiboucas K., Berkson E., Smith O., Takamiya M., Villaume A., 2017, AJ, 154, 251
- Kaviraj et al. (2007a) Kaviraj S., et al., 2007a, ApJS, 173, 619
- Kaviraj et al. (2007b) Kaviraj S., Sohn S. T., O’Connell R. W., Yoon S.-J., Lee Y. W., Yi S. K., 2007b, MNRAS, 377, 987
- Kettlety et al. (2018) Kettlety T., et al., 2018, MNRAS, 473, 776
- Le Cras et al. (2016) Le Cras C., Maraston C., Thomas D., York D. G., 2016, MNRAS, 461, 766
- Loubser & Sánchez-Blázquez (2011) Loubser S. I., Sánchez-Blázquez P., 2011, MNRAS, 410, 2679
- Magnier et al. (2016) Magnier E. A., et al., 2016, arXiv e-prints, 1612.05242
- Mieske et al. (2008) Mieske S., Hilker M., Bomans D. J., Rey S.-C., Kim S., Yoon S.-J., Chung C., 2008, A&A, 489, 1023
- Morrissey et al. (2007) Morrissey P., et al., 2007, ApJS, 173, 682
- Moutard et al. (2016a) Moutard T., et al., 2016a, A&A, 590, A102
- Moutard et al. (2016b) Moutard T., et al., 2016b, A&A, 590, A103
- Newman et al. (2014) Newman A. B., Ellis R. S., Andreon S., Treu T., Raichoor A., Trinchieri G., 2014, ApJ, 788, 51
- Norris (2004) Norris J. E., 2004, ApJ, 612, L25
- Peacock et al. (2017) Peacock M. B., Zepf S. E., Kundu A., Chael J., 2017, MNRAS, 464, 713
- Peng & Nagai (2009) Peng F., Nagai D., 2009, ApJ, 705, L58
- Piotto et al. (2005) Piotto G., et al., 2005, ApJ, 621, 777
- Piotto et al. (2007) Piotto G., et al., 2007, ApJ, 661, L53
- Rich et al. (2005) Rich R. M., et al., 2005, ApJ, 619, L107
- Sadat et al. (2004) Sadat R., Blanchard A., Kneib J.-P., Mathez G., Madore B., Mazzarella J. M., 2004, A&A, 424, 1097
- Salim & Rich (2010) Salim S., Rich R. M., 2010, ApJ, 714, L290
- Schlafly & Finkbeiner (2011) Schlafly E. F., Finkbeiner D. P., 2011, ApJ, 737, 103
- Smith et al. (2012a) Smith R. J., Lucey J. R., Price J., Hudson M. J., Phillipps S., 2012a, MNRAS, 419, 3167
- Smith et al. (2012b) Smith R. J., Lucey J. R., Carter D., 2012b, MNRAS, 421, 2982
- Speagle et al. (2014) Speagle J. S., Steinhardt C. L., Capak P. L., Silverman J. D., 2014, ApJS, 214, 15
- Thomas et al. (2005) Thomas D., Maraston C., Bender R., Mendes de Oliveira C., 2005, ApJ, 621, 673
- Thomas et al. (2010) Thomas D., Maraston C., Schawinski K., Sarzi M., Silk J., 2010, MNRAS, 404, 1775
- Truemper (1993) Truemper J., 1993, Science, 260, 1769
- Valentinuzzi et al. (2011) Valentinuzzi T., et al., 2011, A&A, 536, A34
- Wen & Han (2011) Wen Z. L., Han J. L., 2011, ApJ, 734, 68
- Yi (2008) Yi S. K., 2008, in Heber U., Jeffery C. S., Napiwotzki R., eds, Astronomical Society of the Pacific Conference Series Vol. 392, Hot Subdwarf Stars and Related Objects. p. 3 (arXiv:0808.0254)
- Yi (2010) Yi S. K., 2010, in Bruzual G. R., Charlot S., eds, IAU Symposium Vol. 262, Stellar Populations - Planning for the Next Decade. pp 147–149, doi:10.1017/S1743921310002693
- Yi et al. (2005) Yi S. K., et al., 2005, ApJ, 619, L111
- Yi et al. (2011) Yi S. K., Lee J., Sheen Y.-K., Jeong H., Suh H., Oh K., 2011, ApJS, 195, 22