A study of the composite supernova remnant MSH 1556 with Suzaku
Abstract
The Galactic supernova remnant (SNR) MSH 1556 is a member of the class of composite SNRs that consists of the remnant shell and a displaced pulsar wind nebula (PWN). The earlier X-ray observations reported the comet-like morphology of the PWN and the ejecta distribution of the SNR. In this work, we present a study of MSH 1556 using archival Suzaku data. We investigate the nature of the emission and spectral parameters of the remnant. The X-ray spectra are well fitted with a combination of a thermal and non-thermal model with temperature 0.6 keV and photon index 2.0. The slightly enhanced abundances of Ne, Mg, S and enhanced abundance of Si confirm the presence of ejected material.
keywords:
ISM: individual objects: MSH 1556 (G326.31.8) ISM: supernova remnants X-rays: ISM1 Introduction
Composite supernova remnants (SNRs) are characterized by a system containing an expanding shell into a surrounding medium and a pulsar wind nebula (PWN). The X-ray studies of composite SNRs provide detailed information about of these systems (e.g., MSH 1162: Slane et al. 2012; Kes 75: Reynolds et al. 2018).
MSH 1556 (G326.31.8, Kes 25) is a member of the class of composite SNRs and has a PWN in a cometary morphology. The bow shock of the PWN runs supersonically through the interstellar medium (ISM). The SNR shell and the displaced plerionic component were found using high-resolution radio observations (Green et al., 1997; Dickel et al., 2000). The compact hard X-ray nebula at the Southwest (SW) rim of the SNR was discovered by Plucinsky et al. (1998). The SNR has a circular shell structure in the radio band with a radius of 19′ (Green et al., 2014). Its distance was assumed to be 4.1 kpc by a study based on H radial velocity measurements (Rosado et al., 1996). In the radio band, it has been revealed that there is a plerion-like feature closer to the center of the SNR (Clark et al., 1975; Milne et al., 1979). In their XMM-Newton and Chandra study, Yatsu et al. (2013) detected a point source emitting a power-law spectrum with a photon index of 1.3, and they found spectral steepening between the spectral photon indices of 1.7 and 2.5 along the flow line from the apex toward the tail, and also an expanding shell at 860 km s-1 in the Sedov phase. Beside of the steepening photon index with distance from the putative pulsar, Temim et al. (2013) also detected a thermal component with a temperature of 0.5 keV. Using the radio emission, van der Swaluw et al. (2001) estimated the ratio between the PWN radius and the SNR radius of MSH 1556 (/=0.28) and derived the initial spin period () of the pulsar residing in the SNR to be 37 ms. Using two different epochs of the archival Chandra data, Temim et al. (2017) found a pulsar velocity of 720 km s-1, and its direction of motion is 14∘ 22∘ SW, and the ambient density increases from East to West.
In this work, we present the first results of the high spectral resolution Suzaku observation of the SW rim of MSH 1556. Although the X-ray properties of the thermal and non-thermal emission were studied in detail by Yatsu et al. (2013) and Temim et al. (2013), we study this SNR using more recent atomic database (AtomDB)111http://www.atomdb.org version 3.0.9 and give a comparison of metal abundances with xspec222https://heasarc.gsfc.nasa.gov/xanadu/xspec/ and spex333https://www.sron.nl/astrophysics-spex software packages, which provide almost consistent results with each other except a few parameters. We also perform an Athena simulation to investigate the ejecta feature within this SNR. The paper is organized as follows. In Section 2, we describe Suzaku observation and data reduction. In Section 3, we present spectral analysis and results. In Section 4, we discuss the nature of the X-ray emission and the spectral properties of the SNR. Finally, we present our conclusions in Section 5.
2 Observation and data reduction
We use 76.3 ks archival Suzaku data of the SW region of the SNR MSH 1556 (Obs.ID: 507039010, PI: Y. Yatsu) that was observed on 2013 February 3. The observation was performed by the X-ray Imaging Spectrometer (XIS; Koyama et al., 2007). The XIS instrument consists of four X-ray CCD cameras on the focal planes of the X-Ray Telescope (XRT; Serlemitsos et al., 2007). The Suzaku CCDs have a high spectral resolution and low background. The XIS0, 2 and 3 cameras have front-illuminated (FI) CCDs, where the XIS1 is back-illuminated (BI). XIS0, XIS1 and XIS3 are available in this observation. In order to show the location of the regions on the structure of the SNR, we also use a ROSAT PSPC image that was obtained with an exposure time of 3975 s on 1991 March 14.
For data reduction and analysis, we used HEADAS software version 6.20 and xspec version 12.9.1 (Arnaud, 1996) with AtomDB 3.0.9 (Foster et al., 2012). Furthermore, spectral analysis was done using the spex package (Kaastra et al., 1996, 2018) version 3.04.00 with spexact version 3.04.00. We used the xisrmfgen and xissimarfgen tools to create the redistribution matrix file and the ancillary response file, respectively (Ishisaki et al., 2007). All spectra were grouped with a minimum of 30 counts bin-1.
3 Analysis and result
3.1 X-ray image
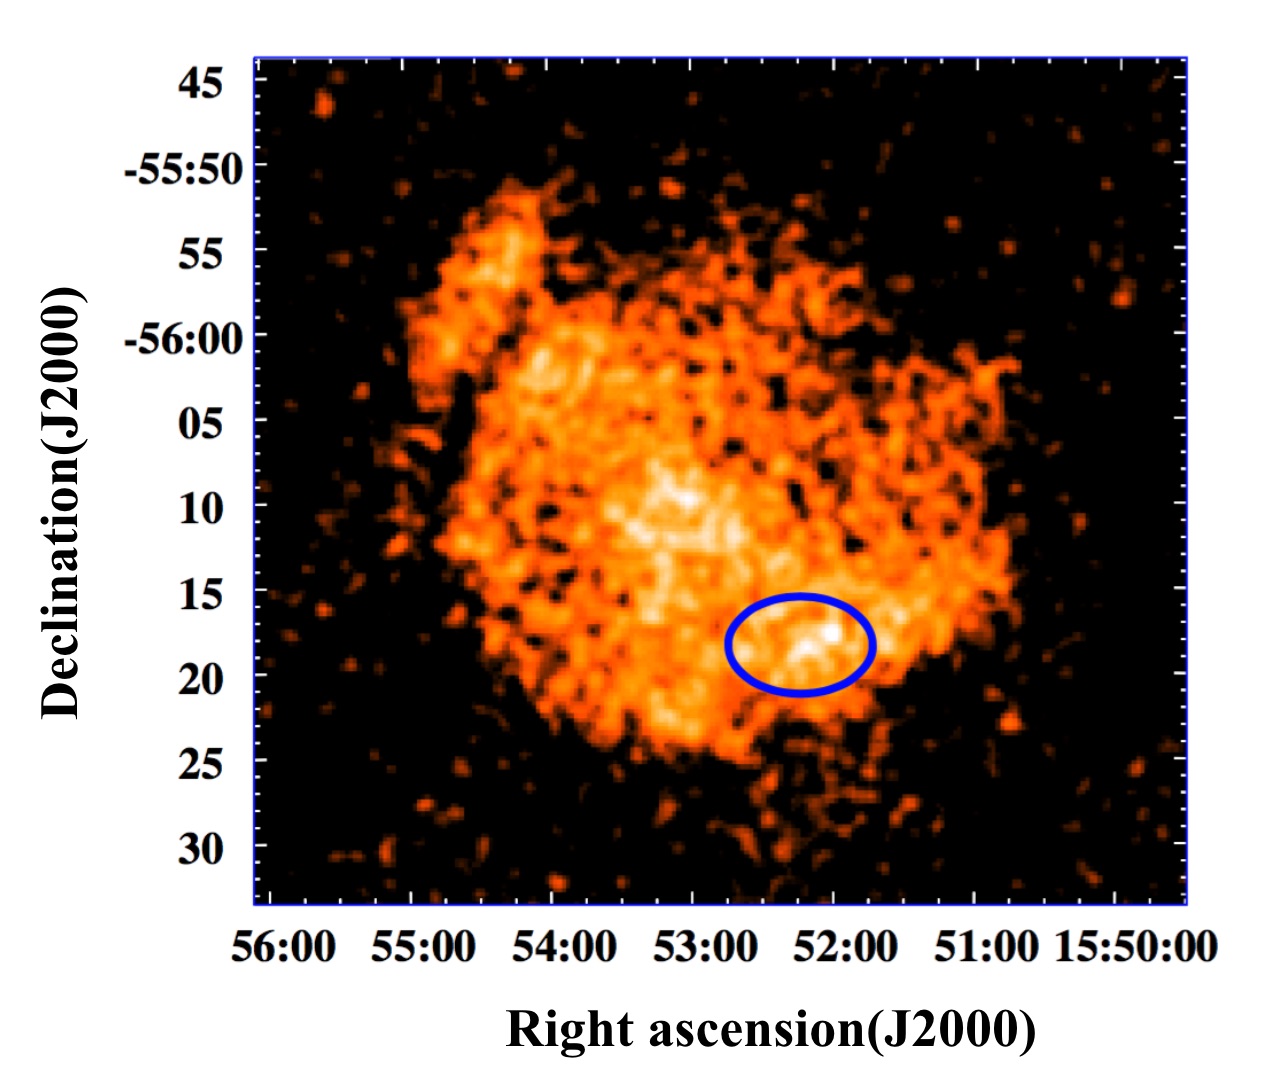
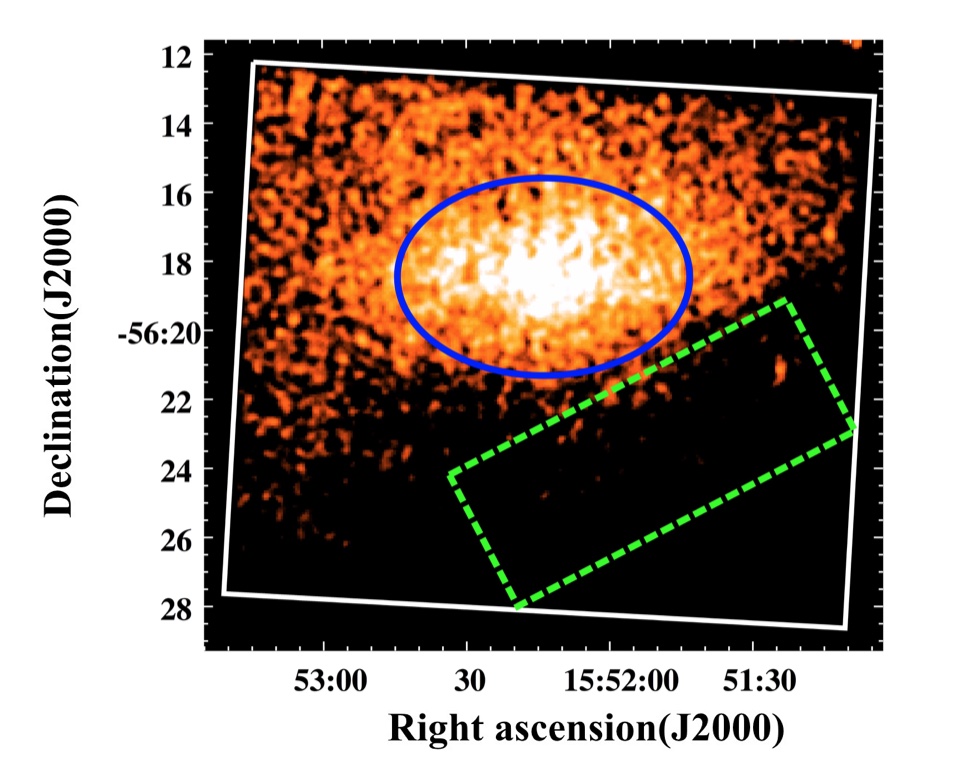
Figure 1 (top) shows the ROSAT image of the SNR MSH 1556 in the 0.12.4 keV energy band. In this figure, the blue elliptical area represents the SW region that was selected for the Suzaku spectral analysis. Subsequently, Figure 1 (bottom) shows the XIS1 image of this region in the 0.310 keV energy band. In order to characterize the emission, we extract the spectrum from an elliptical area with 4.2 arcmin 2.9 arcmin centered at R.A.(J2000) = , Dec.(J2000)=18′28′′.23, which is shown by blue ellipse on the figure. The background region is shown by the dashed box.
3.2 Background estimation
The background spectrum was extracted from the region near the edge of the rim for the purposes of the spectral modeling (see Figure 1, bottom). The average surface brightness of the background region is up to 23 per cent of those of the source region in the 0.67 keV energy band. The Non-X-ray Background (NXB) spectrum for the source and background was estimated from the night-earth data using xisnxbgen (Tawa et al., 2008). From the source and background spectrum, we subtracted the NXB spectrum using the mathpha tool before the spectral fit.
3.3 Spectral fitting
We carried out the spectral fitting in the source region both with xspec and spex. We first tried to fit the spectra with a single-component non-equilibrium ionization (NEI) model. The free parameters are the normalization, the absorption (), the electron temperature (kTe), the ionization time-scale ( = t, where and t represent the mean electron density and the elapsed time after the shock heating of the plasma to a constant temperature, kTe), and the abundances of Ne, Mg, Si and S, respectively. Because of the statistically unacceptable fit (/d.o.f 1.2), we added a power-law model to search for the non-thermal emission component and eventually obtained statistical improvement on the fits between the 0.67 keV energy range (/d.o.f 1).
Fitting the spectrum with this model, we were able to satisfactorily characterize the SW region with the following components: power-law plus vnei model, both coupled with the same absorption model, which was set to vary. We used the absorption models of Tuebingen-Boulder ISM absorption model (tbabs) (Wilms et al., 2000) (in xspec) and hot (in spex), (see spex manual444https://www.sron.nl/astrophysics-spex/manual and Kaastra et al. 2009) to account for the interstellar absorption from our Galaxy. To reckon with the neutral plasma gas limit, we fixed the temperature of the hot model to 0.5 eV (Kaastra et al., 2009). According to the residuals and goodness-of-fit, we thawed the elemental abundances of nei, both in xspec (with nei version 3.0) and spex. Correlative to the best-fit parameters, the elemental abundances of Ne, Mg, Si and S are free parameters, while the other metal abundances were fixed to the solar values relative to the abundance tables of Anders & Grevesse (1989) to compare between the xspec and spex fit directly, which is available in both spectral codes.
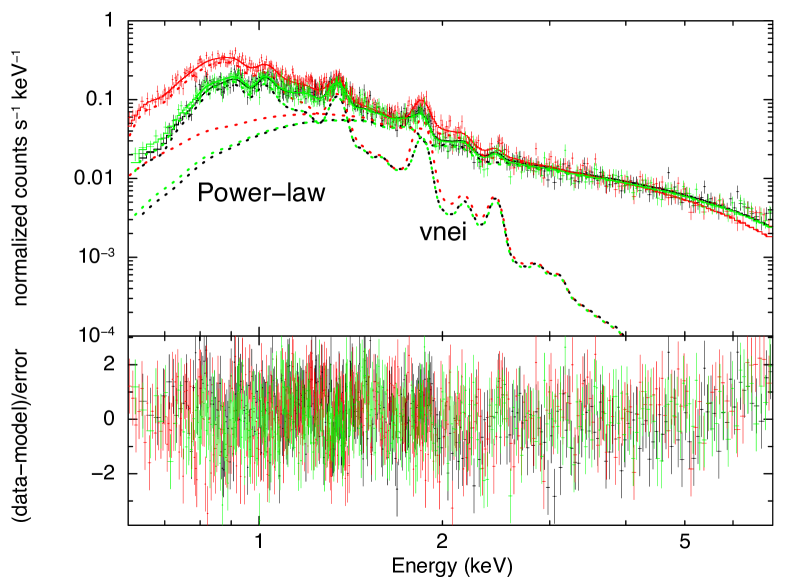
The best-fit spectral results are listed in Table 1, and the XIS spectra are displayed in Figure 2. We calculated the uncertainties at the 90 per cent confidence level with the error command of xspec and spex.
| Value | |||
|---|---|---|---|
| Component | Parameter | xspec | spex |
| Absorption | ( cm | 3.2 | 2.2 |
| NEI | (keV) | 0.64 | 0.63 |
| Ne (solar) | 1.6 | 1.3 | |
| Mg (solar) | 1.7 | 1.8 | |
| Si (solar) | 2.2 | 2.3 | |
| S (solar) | 1.7 | 1.6 | |
| t ( cm-3 s) | 1.4 | 2.0 | |
| norm† () | 1.0 | … | |
| norm‡ | … | 1.1 | |
| Power-law | 2.04 | 2.02 | |
| norm∣ () | 7.8 | … | |
| norm∥ | … | 9.9 | |
| (d.o.f.) | 1.06 (1119) | 1.03 (409) | |
Notes. Abundances are given relative to the solar values in the abundance table of Anders & Grevesse (1989).
† The normalization (norm) of the thermal model (vnei in xspec) is derived by dV in units of cm-5, where and are the electron and Hydrogen densities and V is the volume of the source.
‡ The norm of the thermal model (nei in spex) is the emission measure (Y V) in units of 1066 m-3.
∣ The norm of the power-law (xspec) is in units of photons cm-2 s-1 keV-1 at 1 keV.
∥ The norm of the power-law (spex) is in units of ph s -1 keV-1.
4 Discussion
4.1 Thermal emission
We detected thermal and non-thermal emission from the SW rim with Suzaku data, which indicates the interactive relation between the PWN and the thermal emission, pointing out the material in the remnant interior and an interaction of the SNR reverse shock with the PWN (Gaensler & Wallace, 2003; Borkowski et al., 2016). It is therefore likely that the thermal component integrated with the PWN spectrum may be explained by the morphological relation between the PWN and the shell region. This component dominates nearly half of the X-ray spectrum, accounting for 54 per cent of the total unabsorbed flux [=(3.85) 10-12 ergs cm-2 s-1]. Besides, we found slightly enhanced abundances of Ne, Mg, S and enhanced abundance of Si, which presence of an ejecta feature and confirm the earlier studies. In addition, the abundance table of Anders & Grevesse (1989) which we used during spectral fitting, is an earlier table, but the difference with the recent solar abundances (Lodders & Palme, 2009) is at maximum about 10 per cent for our fitted abundances and is comparable or smaller to the size of the error bars. Thus, impact of using this table on our fitting is not that high.
The Suzaku X-ray spectrum was well described by the electron temperature of 0.64 keV, and with an ionization time-scale of 1.4 cm-3 s, which indicates that the plasma has not yet reached ionization equilibrium. The previous study of Yatsu et al. (2013) has shown that the thermal component in the SW rim has an electron temperature of = 0.61 (0.580.64) keV, which is consistent with our result [ = 0.64 (0.610.67) keV]. Furthermore, compared with the results those of Yatsu et al. (2013), we found higher elemental abundances of Ne, Mg and Si, and the ionization parameter, t, is smaller than their result. A note of caution is due here since they extracted spectra from two regions in the same SW rim area, we only selected a single region which is covering them all. Therefore, the difference between the results might be explained by this factor. Temim et al. (2013) also found thermal emission parameters in their spectral regions [ = 0.62 (0.420.92) keV, for region b (trail), XMM-Newton; = 0.56 (0.540.57) keV, for region region c, Chandra]. In our fittings, the abundance of Si and S are higher than the solar abundances and these results reflect those of Temim et al. (2013). The comparison of our findings with those of other studies confirms the interrelation between PWN and ejecta material.
Based on the normalization of the vnei model, we estimated the SNR parameters considering the distance of 4.1 kpc. We then calculated the volume of the SNR to be , where is the volume filling factor () and is the distance in units of 4.1 kpc. Assuming , we found an electron density of 0.15 and age of kyr, suggesting that it is a middle-aged SNR. Derived age and electron density results corroborate the finding of Yatsu et al. (2013) and Temim et al. (2013). We then calculated the total mass of the emitting gas, using =1.4. The small X-ray-emitting mass indicates that the X-ray emission in the SW region arises from the ejecta.
4.2 Non-thermal emission
The non-thermal component of the xspec and spex models yielded a photon index () values of 2.04 and 2.02, respectively. These findings are consistent with that of Temim et al. (2013) [ = 2.01 (1.902.13), for region b (trail), XMM-Newton; = 2.05 (1.972.16), for region c, Chandra].
The photon index values we found are also slightly higher than those of Yatsu et al. (2013) [ = 1.87 (1.751.99)]. On the other hand, the estimated non-thermal X-ray spectrum of a typical PWN has a spectral photon index value in the range of 1.32.3 (Gotthelf et al., 2002), and our result is consistent with this value. From the X-ray emission in Figure 2, it is apparent that there is a hard X-ray continuum above 2 keV, and in the study of Yatsu et al. (2013), it is attributed to the presence of the arc and PWN components.
4.3 Athena X-IFU simulation
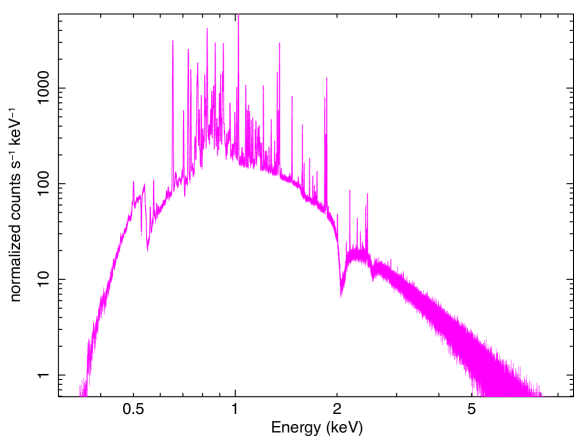
The future X-ray mission Athena (Nandra et al., 2013) may be able to reveal the nature of the ejecta of MSH 1556. With this aim, in this subsection we simulated the Athena X-ray Integral Field Unit (X-IFU) (Barret et al., 2016; Pajot et al., 2018) 50-ks observation using xspec and the latest X-IFU response files. Figure 3 shows Athena X-IFU spectrum fitted with an absorbed vnei+power-law model. Our simulation demonstrates the potential of X-IFU for revealing the thermal emission from MSH 1556. Spectroscopy with X-IFU (2.5 eV energy resolution) would help us separate the thermal and non-thermal components, and constrain the properties of SNR and progenitor.
5 Conclusions
We presented a study of the SW region of the composite SNR MSH 1556, utilizing the archival Suzaku data. We described our main findings as follows.
-
1.
The X-ray spectrum is well described by a two-component model with an absorption of 3.2 cm-2: A non-thermal power-law model with a photon index of 2.04, and a thermal nei model with an electron temperature, 0.64 keV, an ionization time-scale, 1.4 cm-3 s.
-
2.
The slightly enhanced abundances of Ne, Mg, S and enhanced abundance of Si support evidence of ejecta heated by the reverse shock. This result together with the small X-ray-emitting mass suggests that its emission arises from the shock heated ejecta.
-
3.
Future X-ray observations with a high-resolution spectrometer such as Athena will allow us to examine the properties of thermal emission and the ejecta nature of MSH 1556.
6 Acknowledgement
The research leading to these results has received funding from the European Union’s Horizon 2020 Program under the AHEAD project (grant agreement 654215).
References
- Anders & Grevesse (1989) Anders E. & Grevesse N., 1989. Abundances of the elements: Meteoritic and solar geochim. cosmochim. Acta 53, 197-214
- Arnaud (1996) Arnaud, K. A., 1996, in Jacoby G., Barnes J., eds, ASP Conf. Ser. Vol. 101, Astronomical data analysis software and systems V. Astron. Soc. Pac. 101, 17-20
- Barret et al. (2016) Barret, D., Lam Trong, T., den Herder, J.-W., et al. 2016. The Athena X-ray integral field unit (X-IFU). in Proc. SPIE, Space Telescopes and Instrumentation 2016: Ultraviolet to Gamma Ray, 99052F
- Borkowski et al. (2016) Borkowski, K. J., Reynolds, S. P., Roberts, M. S. E., 2016. G11.20.3: The young remnant of a stripped-envelope supernova. ApJ 819, 160-177
- Clark et al. (1975) Clark, D. H., Green, A. J., & Caswell, J. L., 1975. Improved 408 MHz observations of some galactic supernova remnants. AuJPA 37, 75-86
- Dickel et al. (2000) Dickel, J. R., Milne, D. K., & Strom, R. G., 2000. Radio emission from the composite supernova remnant G326.31.8 (MSH 1556). ApJ 543, 840-849
- Foster et al. (2012) Foster, A. R., Ji L., Smith, R. K., Brickhouse N. S., 2012. Updated atomic data and calculations for X-ray spectroscopy. ApJ 756, 128-138
- Gaensler & Wallace (2003) Gaensler, B. M., & Wallace, B. J., 2003. A multifrequency radio study of supernova remnant G292.0+1.8 and its pulsar wind nebula. ApJ 594, 326-339
- Gotthelf et al. (2002) Gotthelf, E. V., Olbert, C. M., 2002. Chandra spectroscopy of pulsars and their wind nebulae. ASP Conf. Ser. 271, Neutron Stars in Supernova Remnants. Astron. Soc. Pac. 171-174
- Green et al. (1997) Green, A. J., Frail, D. A., Goss, W. M., & Otrupcek, R., 1997. Continuation of a survey of OH (1720 MHz) maser emission towards supernova remnants. AJ 114, 2058-2067
- Green et al. (2014) Green, D. A., 2014. A catalogue of 294 Galactic supernova remnants. Bulletin of the Astronomical Society of India 42, 47-58
- Ishisaki et al. (2007) Ishisaki, Y., Maeda, Y., Fujimoto, R. et al., 2007. Monte Carlo simulator and ancillary response generator of Suzaku XRT/XIS system for spatially extended source analysis. PASJ 59, 113-132
- Kaastra et al. (1996) Kaastra, J. S., Mewe, R., Nieuwenhuijzen, H. 1996. SPEX: A new code for spectral analysis of X & UV spectra. UV and X-ray Spectroscopy of Astrophysical and Laboratory Plasmas 411-414
- Kaastra et al. (2009) Kaastra, J. S., de Vries, C. P., Costantini, E., den Herder, J. W. A. 2009. Effective area calibration of the reflection grating spectrometers of XMM-Newton. I. X-ray Spectroscopy of the Crab Nebula. AA 497, 291-310
- Kaastra et al. (2018) Kaastra, J. S. and Raassen, A. J. J. and de Plaa, J. and Gu, Liyi, SPEX: X-ray spectral fitting package, 2018, https://doi.org/10.5281/zenodo.2419563
- Koyama et al. (2007) Koyama, K. et al., 2007. X-Ray imaging spectrometer (XIS) on board Suzaku. PASJ 59, 23-33
- Lodders & Palme (2009) Lodders, K. & Palme, H., 2009. Solar system elemental abundances in 2009. Meteorit. Planet. Sci. Suppl. 72, 5154
- Milne et al. (1979) Milne, D. K., Goss, W. M., Haynes, R. F., et al., 1979. Three unusual supernova remnants. MNRAS 188, 437-444
- Nandra et al. (2013) Nandra, K., Barret, D., Barcons, X. et al., 2013. The hot and energetic universe: A white paper presenting the science theme motivating the Athena mission. Athena mission proposal, arXiv:1306.2307
- Pajot et al. (2018) Pajot, F., Lam Trong, T., den Herder, J.-W., Piro, L., & Cappi, M. 2018. The Athena X-ray integral field unit (X-IFU). Journal Of Low Temperature Physics 193, 901-907
- Plucinsky et al. (1998) Plucinsky, P. P., 1998. ASCA observations of MSH 1556. MmSAI 69, 939-944
- Reynolds et al. (2018) Reynolds, S. P., Borkowski, K. J., Gwynne, P. H., 2018. Expansion and brightness changes in the pulsar-wind nebula in the composite supernova remnant Kes 75. ApJ 856, 133-144
- Rosado et al. (1996) Rosado, M., Ambrocio-Cruz, P., Le Coarer, E., & Marcelin, M., 1996. Kinematics of the galactic supernova remnants RCW 86, MSH 1556 and MSH 1161A. A&A 315, 243-252
- Serlemitsos et al. (2007) Serlemitsos, P. J. et al., 2007. The X-Ray Telescope onboard Suzaku. PASJ 59, 9-21
- Slane et al. (2012) Slane, P., Hughes, J. P., Temim, T., et al., 2012. A broadband study of the emission from the composite supernova remnant MSH 1162. ApJ 749, 131-141
- Tawa et al. (2008) Tawa, N. and Hayashida, K. and Nagai, M. et al., 2008. Reproducibility of non-X-Ray background for the X-Ray imaging spectrometer aboard Suzaku. PASJ 60, S11-S24
- Temim et al. (2013) Temim, T., Slane, P., Castro, D., et al., 2013. High-energy emission from the composite supernova remnant MSH 15-56. ApJ 768, 61-70
- Temim et al. (2017) Temim, T., Slane, P., Plucinsky, P. P., Gelfand, J., Castro, D., Kolb, C., 2017. Proper motion of the high-velocity pulsar in SNR MSH 15-56. ApJ 851, 128-133
- van der Swaluw et al. (2001) van der Swaluw, E., & Wu, Y., 2001. Inferring initial spin periods for neutron stars in composite remnants. ApJL 555, L49-L53
- Wilms et al. (2000) Wilms, J., Allen, A., McCray, R., 2000. On the absorption of X-rays in the interstellar medium. ApJ 542, 914-924
- Yatsu et al. (2013) Yatsu, Y., Asano, K., Kawai, N., Yano, Y., & Nakamori, T., 2013. Spatially resolved spectroscopy of a pulsar wind nebula in MSH 1556. ApJ 773, 25-39