Optical signature of the pressure-induced dimerization in the
honeycomb iridate -Li2IrO3
Abstract
We studied the effect of external pressure on the electrodynamic properties of -Li2IrO3 single crystals in the frequency range of the phonon modes and the Ir - transitions. The abrupt hardening of several phonon modes under pressure supports the onset of the dimerized phase at the critical pressure =3.8 GPa. With increasing pressure an overall decrease in spectral weight of the Ir - transitions is found up to . Above , the local (on-site) - excitations gain spectral weight with increasing pressure, which hints at a pressure-induced increase in the octahedral distortions. The non-local (intersite) Ir - transitions show a monotonic blue-shift and decrease in spectral weight. The changes observed for the non-local excitations are most prominent well above , namely for pressures 12 GPa, and only small changes occur for pressures close to . The profile of the optical conductivity at high pressures (20 GPa) appears to be indicative for the dimerized state in iridates.
I Introduction
In recent years layered honeycomb systems such as Na2IrO3, -Li2IrO3, and -RuCl3 attracted the condensed matter community due to the possible realization of the Kitaev quantum spin-liquid (QSL) ground state Kitaev (2006); Jackeli and Khaliullin (2009); Chaloupka et al. (2010); Singh et al. (2012); Choi et al. (2012); Plumb et al. (2014); Chun et al. (2015); Winter et al. (2017). However, these compounds were found to order magnetically at low temperatures Choi et al. (2012); Sears et al. (2015); Banerjee et al. (2016); Williams et al. (2016) excluding the realization of this desired quantum state at ambient conditions, as not only anisotropic Kitaev but also isotropic Heisenberg and other types of interactions are present in these materials. Effort was taken to tune the most promising candidate -RuCl3 towards the QSL by high external magnetic field Wolter et al. (2017); Baek et al. (2017), but the results are strongly debated until now Winter et al. (2017); Janssen et al. (2016); Winter et al. (2018); Takagi et al. .
A different approach for the realization of the Kitaev QSL is the application of external or chemical pressure on the honeycomb lattice Hermann et al. (2017); Biesner et al. (2018); Simutis et al. (2018), since the hopping parameters could possibly be changed in favor of the Kitaev over Heisenberg interactions. However, it was shown that the Neel temperature of the compounds Na2IrO3 and -RuCl3 increases under low external pressure probably due to the increase in interlayer interaction Simutis et al. (2018); Wang et al. (2018), as hydrostatic pressure mainly compresses the interlayer distance in these materials Hermann et al. (2017, 2018). Furthermore, the QSL ground state is in competition with a dimerized ground state. It was found that the iridates as well as -RuCl3 all dimerize at finite pressures Hermann et al. (2018); Biesner et al. (2018); Bastien et al. (2018); Hu et al. (2018); Majumder et al. (2018), whereby the critical pressure for dimerization depends on several parameters, such as the type of stabilizing central ion, the strength of spin-orbit coupling, and electronic correlations Hermann et al. (2018) \bibnoteFor Na2IrO3, additional pressure-induced transitions were suggested recently from powder x-ray diffraction measurements Xi et al. (2018), which were, however, not observed by higher-quality single-crystal x-ray diffraction data Hermann et al. (2017).. Apparently, hydrostatic pressure is not the most promising approach to tune the honeycomb materials towards the desired Kitaev QSL, and it was concluded that, instead, strain would induce the QSL state Yadav et al. (2018), for example by chemical pressure Hermann et al. (2017); Simutis et al. (2018). Nevertheless, hydrostatic external pressure is one of the superior ways to tune the electronic ground state of these systems.
The layered honeycomb 213 iridates Na2IrO3 and -Li2IrO3 contain Ir4+ ions with a electronic configuration and edge-sharing IrO6 octahedra. The electronic ground state is intensively debated due to the interplay of Coulomb repulsion , Hund’s rule coupling , spin-orbit coupling , crystal field splitting, and electronic bandwidth (given by the hopping parameter ), which are all of similar energy scale Gretarsson et al. (2013). Depending on the hierarchy of these parameters, the 213 iridates were theoretically discussed in terms of semimetals Kim et al. (2012, 2013), relativistic Mott insulators Jackeli and Khaliullin (2009), or within an itinerant picture with the formation of quasi-molecular orbitals (QMOs) Mazin et al. (2012, 2013). Experiments finally showed that the electronic ground state of Na2IrO3 can be well described in terms of a relativistic Mott insulator with a half-filled =-band split by the Hubbard Singh and Gegenwart (2010); Gretarsson et al. (2013); Hermann et al. (2017); Xi et al. (2018), although it exhibits a significant intrahexagon itinerant character which could lead to a mixing of = () and = () states in the Ir t2g level Sohn et al. (2013); Kim et al. (2016); Hermann et al. (2017). Compared to Na2IrO3, for -Li2IrO3 signs for an increased QMO character was observed at ambient conditions Hermann et al. (2017) and at low pressures Clancy et al. (2018).
Two hopping paths are most important for the realization of the QMO ground state in the iridates Mazin et al. (2012): i) The direct metal-metal hopping between two neighboring Ir ions, and ii) the indirect and spatially anisotropic hopping between two neighboring Ir orbitals mediated by the O 2p orbitals. The former depends on the Ir–Ir bond length, while the latter depends on the Ir–O bond lengths as well as the Ir–O–Ir bond angles. Small distortions of the Ir–Ir network and the IrO6 octahedra are proposed to favor the formation of QMOs Foyevtsova et al. (2013). Strong distortions of the Ir–Ir network, however, will probably prevent the realization of a pure QMO picture, and strong trigonal distortions of the octahedra will lead to a breakdown of the relativistic Mott states Bhattacharjee et al. (2012). However, the effect of external pressure on electronic states can be more complicated, as was recently shown by studies on Na3Ir3O8, which exhibits a 1/3-filled -band and is therefore semimetallic at ambient pressure Sun et al. (2018). By applying external pressure, the -band in Na3Ir3O8 gets closer to half-filling due to charge transfer introduced by the stronger overlap of the orbitals, which induces an unusual semimetal to insulator transition Sun et al. (2018).
In our previous single-crystal x-ray diffraction (XRD) study on -Li2IrO3 we observed a pressure-induced dimerization of two of the six Ir–Ir bonds per hexagon at =3.8 GPa due to a subtle interplay between magnetism, electronic correlation, spin-orbit coupling, and covalent bonding Hermann et al. (2018). In contrast to the recent study of Clancy et al.Clancy et al. (2018), where structural and electronic changes were found right above ambient pressure, i.e., well below , we did not find clear indications for structural changes below the sharp transition at Hermann et al. (2018). Here, we study the effect of external pressure on the electrodynamic properties of -Li2IrO3 single crystals. One focus of this study lies on the changes in the phonon mode spectrum at the pressure-induced dimerization of the Ir–Ir bonds at . Possible pressure-induced structural changes below should affect the phonon mode spectrum, from which the discrepancy between our previous XRD study and the study of Clancy et al. Clancy et al. (2018) could be resolved. The second focus lies on the energy range of the on-site and intersite Ir - excitations, which depend on the interplay of the various hopping parameters and the crystal field effects. The pressure-dependent behavior of the Ir - transitions give insight into the electronic ground state of -Li2IrO3 under pressure, which is not yet clear especially in the dimerized phase Clancy et al. (2018).
II Methods
-Li2IrO3 single crystals were grown by vapor transport of separated educts as described in Ref. Freund et al. (2016) using elemental lithium and iridium as starting materials. The samples were characterized by x-ray diffraction, specific heat, and magnetic susceptibility measurements in order to ensure phase-purity and crystal quality. No foreign phases were detected, and a sharp magnetic transition at 15 K was observed.
Pressure-dependent reflectance and transmission measurements were carried out with a Bruker Vertex v80 Fourier transform infrared spectrometer in combination with an infrared microscope (Bruker Hyperion) equipped with a 15 Cassegrain objective. All measurements were done at room temperature. For the measurements in the frequency ranges 150-700 cm-1 and 2000-10000 cm-1 quasi-hydrostatic pressures up to 8.4 and 14.3 GPa, respectively, were achieved by using commercial Diacell CryoDAC-Mega (almax-easylab) diamond-anvil cells (DACs). For the measurements in the frequency range 2000-18500 cm-1 a custom-made Syassen-Holzapfel-type Huber et al. (1977) DAC was used to achieve pressures up to 24.4 GPa. CsI powder served as quasihydrostatic pressure-transmitting medium. The pressure was determined in situ using the ruby-luminescence technique Mao et al. (1986).
The pressure-dependent reflectivity spectrum was calculated according to =, where is the intensity of the radiation reflected from the sample-diamond interface, is the intensity reflected from the inner diamond-air interface of the empty DAC, and is the reflectivity of diamond, =0.167, which was assumed to be independent of pressure Eremets and Timofeev (1992); Ruoff and Ghandehari (1994). The reflectivity spectra in the near-infrared and visible frequency ranges were calibrated against a simulated spectrum based on a Lorentz fitting of the reflectivity spectrum measured at the sample-air interface. The pressure-dependent transmission spectrum was calculated according to , where is the intensity of the radiation transmitted through the thin sample embedded in the pressure-transmitting medium and is the intensity of the radiation transmitted through the pressure-transmitting medium at a sample-free space inside the same pressure cell.
The low-frequency optical conductivity covering the phonon modes was obtained from the reflectivity spectra using the variational dielectric function Kuzmenko (2005). In the near-infrared and visible frequency ranges the optical conductivity was obtained by Kramers-Kronig analysis of the reflectivity , taking into account the diamond-sample interface Plaskett and Schatz (1963). The absorbance was calculated from the transmission spectrum according to .
III Results and Discussion
| Mode | Frequency (cm-1) | Atoms |
|---|---|---|
| 1 | 573 | O |
| 2 | 539 | Ir–O–Li |
| 3 | 512 | Ir–O–Li |
| 4 | 429 | Li |
| 5 | 407 | Li |
| 6 | 387 | Li |
| 7 | 341 | Li |
| 8 | 220 | Li |
| 9 | 195 | Li |
III.1 Phonon modes
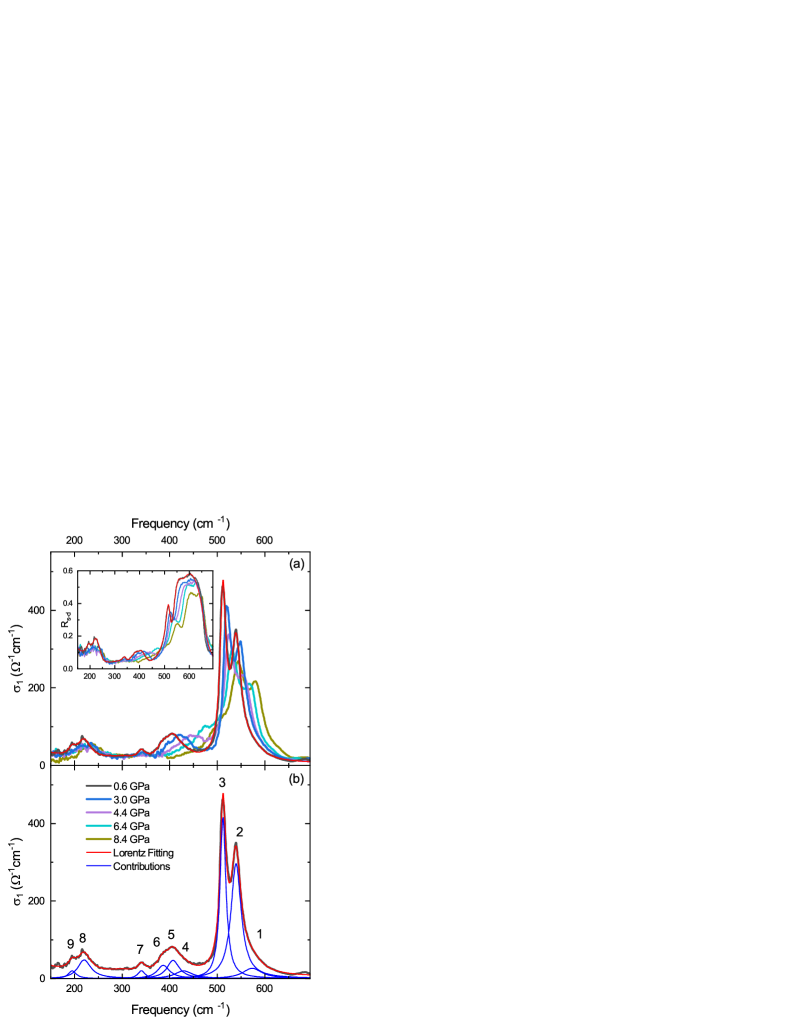
The low-frequency optical conductivity spectra of -Li2IrO3 are depicted in Fig. 1(a) for selected pressures, with the corresponding reflectivity spectra shown in the inset. Both optical conductivity and reflectivity spectra can be well fitted with the Lorentz model, as demonstrated by the Lorentz fittings at the lowest measured pressure (0.6 GPa). Experimentally nine phonon modes are clearly observed in the frequency range 150-700 cm-1, whose contributions to the optical conductivity are shown in Fig. 1(b) for 0.6 GPa. The frequencies of the modes at 0.6 GPa are listed in Table 1, together with the atoms showing the highest displacement (by comparing with the theoretical frequency obtained from Ref. Hermann et al. (2017)). Theoretically, up to 18 infrared-active modes are expected for -Li2IrO3 due to the symmetry. The calculated frequencies of the twelve expected modes in the range 250-700 cm-1 are given in Ref. Hermann et al. (2017). Only seven out of these predicted modes are experimentally well observed, due to the near degeneracy of modes around the modes 2 and 3 and weak modes with low spectral weight between 250-350 cm-1. Two additional modes occur below 250 cm-1 (modes 8 and 9), which are also dominated by Li atoms, but were not discussed in detail in Ref. Hermann et al. (2017).
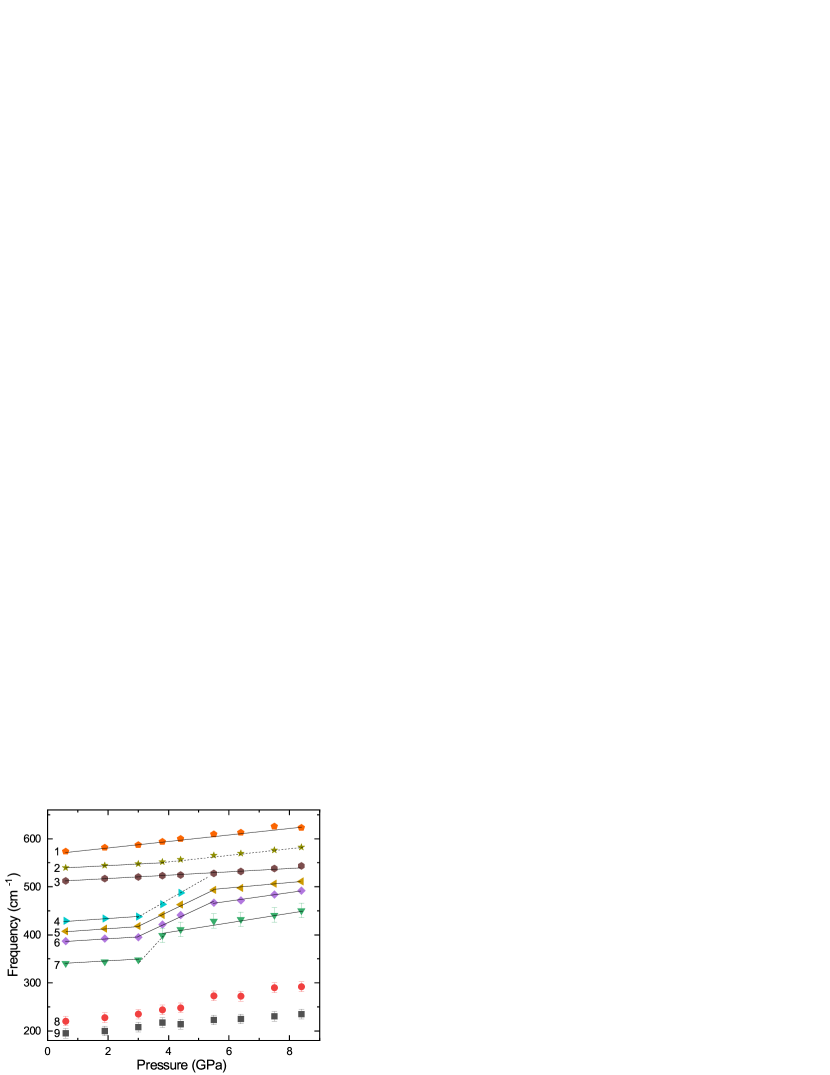
The behavior of the phonon mode frequencies with increasing pressure is shown in Fig. 2. Up to 3.8 GPa all modes harden monotonically, as expected from the pressure-induced decrease in the cell parameters Hermann et al. (2018). The smooth pressure evolution of the modes in this pressure range supports the absence of any structural phase transition, in agreement with our single-crystal XRD data Hermann et al. (2018) and in disagreement with the claim on structural changes at low pressures in Ref. Clancy et al. (2018).
At the phonon modes 4-7 show a drastic increase in the slope of their pressure-induced hardening, which in the case of modes 5 and 6 extends up to a pressure of around 5.5 GPa. Mode 4 shifts into the frequency range of the two strong modes 2 and 3, where it is no longer resolvable, and mode 7 abruptly hardens at . A significant change of the Ir–O–Li based modes at is observed only for mode 2, where above the critical pressure the hardening is increased.
From XRD measurements it is known that the Ir–Ir bonds dimerize at a critical pressure of 3.8 GPa Hermann et al. (2018), which furthermore introduces a change of the symmetry from to . Also in the dimerized phase, 18 infrared-active modes are expected according to group theory Kroumova et al. (2003). Interestingly, all the modes, which undergo drastic changes at the onset of dimerization, belong to the group exhibiting mainly Li displacements at ambient pressure. Accordingly, assuming that the assignment of the phonon modes still holds in the high-pressure, dimerized phase above , the Ir–O bond distances are not strongly affected by the pressure-induced dimerization of the Ir-Ir network. Significant changes of the edge-sharing Ir–O–Ir bond angles could, however, be induced by pressure, which would then affect the Ir - transitions located in the higher-energy ranges, as will be discussed in the following.
III.2 Ir - transitions
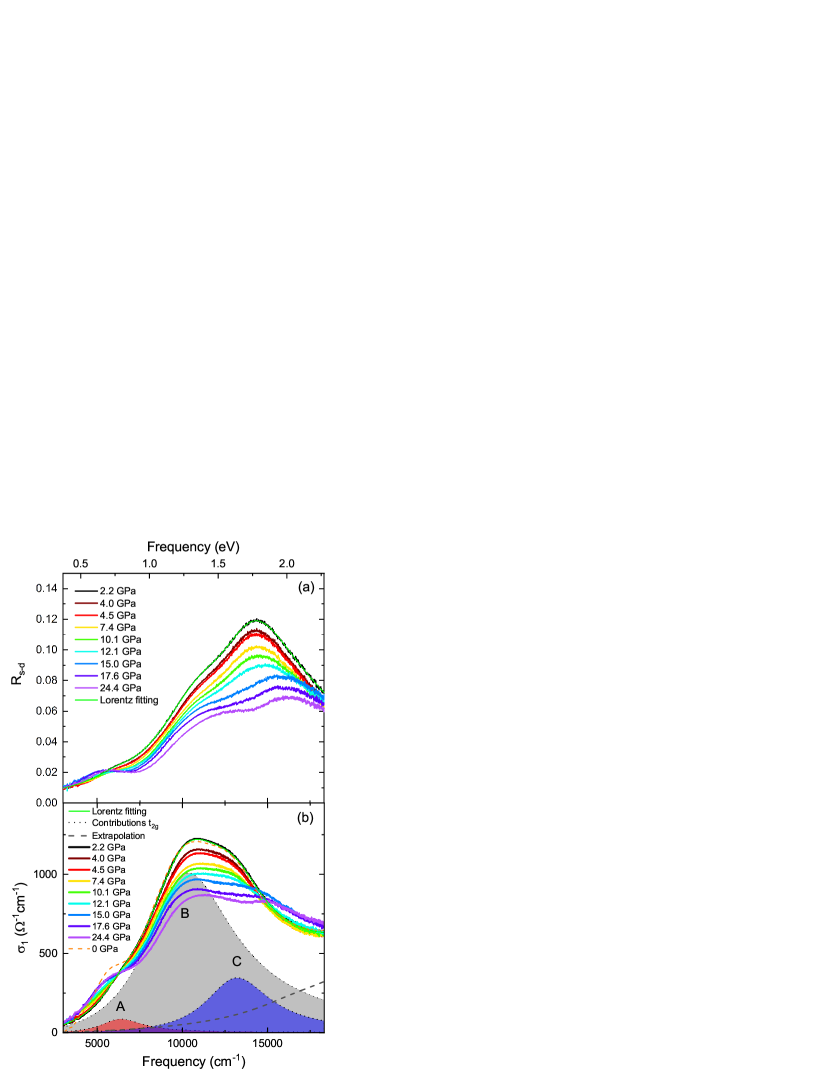
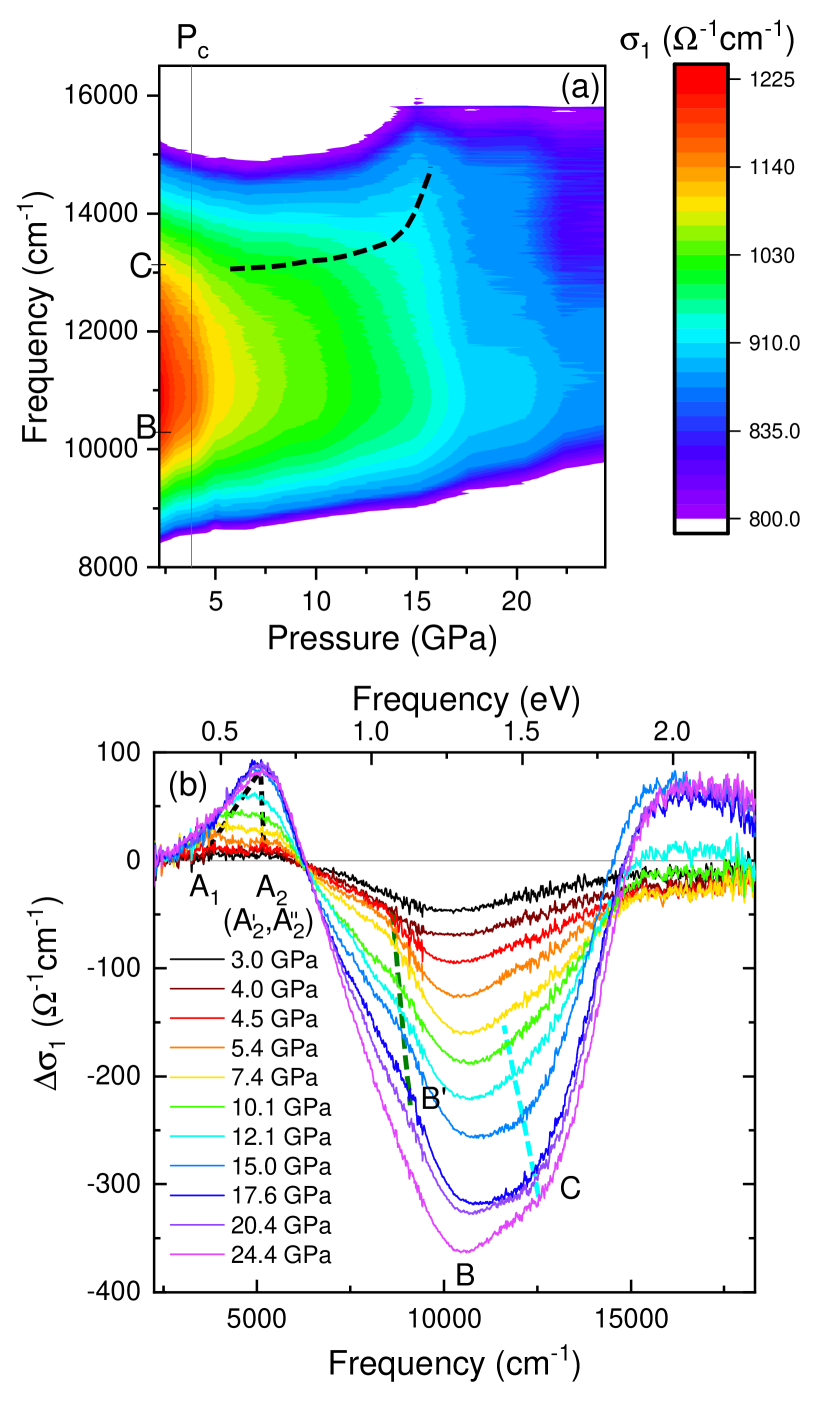
The pressure-dependent reflectivity spectra in the frequency range of the Ir t2g excitations and the corresponding optical conductivity spectra are shown in Fig. 3(a) and (b), respectively. At the lowest measured pressure (2.2 GPa) one finds three main contributions to the optical conductivity, labeled A, B, and C, whereby the contributions B and C are close in energy [see Fig. 3(b)]. According to theoretical calculations they correspond to excitations between the relativistic and orbitals Kim et al. (2014); Li et al. (2015); Kim et al. (2016); Li et al. (2017): As discussed in our previous publication Hermann et al. (2017), contribution A sums up the on-site excitations, peak B is attributed to intersite excitations, and peak C mainly involves intersite excitations Kim et al. (2014); Li et al. (2015); Kim et al. (2016); Li et al. (2017); Li. . Additional contributions, namely intersite and multiple spin-orbit (SO) excitons, were suggested for peak B Li. ; Kim et al. (2014). The spectral weight of contribution B could be a measure of the indirect oxygen-mediated hopping and, thus, of the Kitaev interaction Li et al. (2015). The fourth, weak contribution D, as observed for Na2IrO3 in the range 15500-17000 cm-1 Sohn et al. (2013); Hermann et al. (2017), is even less pronounced in -Li2IrO3 and therefore not included here.
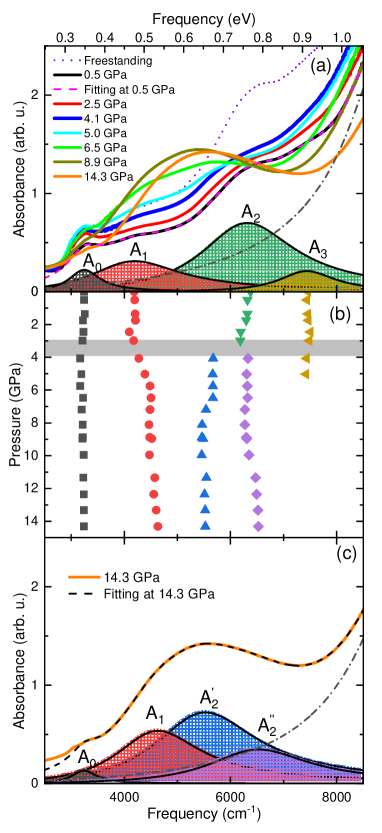
More detailed information on the very weak, low-energy - transitions can be obtained from the pressure-dependent absorbance spectra measured on a 3 m thin sample (see Fig. 4). At low pressures a good fit of the spectra is obtained with four contributions labelled A0–A3, which lie in the range of contribution A in the optical conductivity. The comparison between the absorbance and optical conductivity spectra reveals that the main contribution to A is due to A2. The energies of all contributions to the optical conductivity and absorbance at the lowest measured pressure, resp., are given in Table 2.
| position | assignment | |||
|---|---|---|---|---|
| [eV] | [cm-1] | |||
| A0 | 0.40 | 3250 | excitonic e-h excitations | |
| A1 | 0.52 | 4200 | excitonic e-h excitations | |
| A | 0.79 | 6390 | on-site | |
| A2 | 0.78 | 6320 | on-site | |
| A3 | 0.92 | 7440 | on-site | |
| B | 1.28 | 10350 | intersite and | |
| intersite and | ||||
| multiple SO excitons | ||||
| C | 1.64 | 13220 | intersite | |
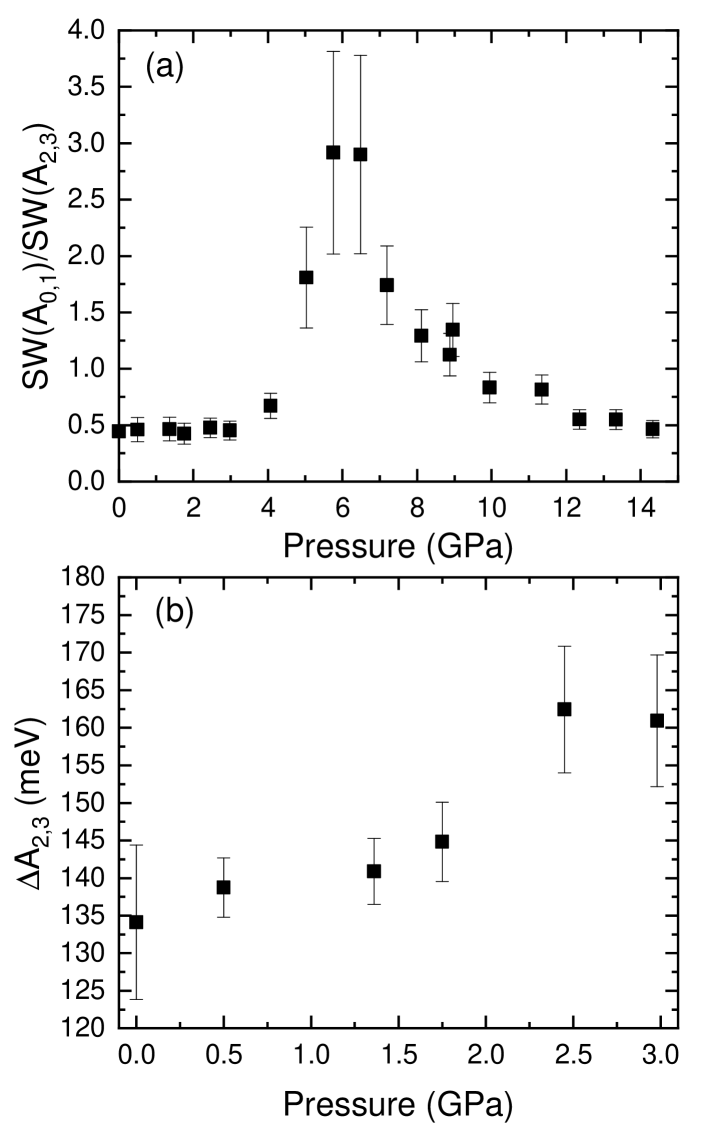
For the interpretation of the observed features, we compare our optical spectra with the theoretical projected excitation spectrum of Na2IrO3 Kim et al. (2014) and the theoretical and experimental RIXS spectra of -Li2IrO3 and Na2IrO3 given in Refs. Kim et al. (2014); Gretarsson et al. (2013); Clancy et al. (2018), although different spectral weights are to be expected for our optical conductivity/absorbance spectra. Accordingly, the energetic position of A2 and A3 fit well to the local excitations \bibnoteWe note that the contributions A2 and A3 would also fit energetically to interband transitions of QMOs, since -Li2IrO3 is known to exhibit both Mott-insulating and QMO character Kim et al. (2016); Hermann et al. (2017) at ambient pressure.. The splitting of the local excitations into two contributions is due to the trigonal crystal field, which splits the level Gretarsson et al. (2013). Therefore, the energy difference between the contributions A2 and A3 may serve as a measure for the strength of the trigonal distortion of the IrO6 octahedra Kim et al. (2014). The value of as a function of pressure is depicted in Fig. 5(b).
The absorption features A0 and A1 can be attributed to excitonic electron-hole (e-h) excitations Kim et al. (2014); Gretarsson et al. (2013) and reflect the itinerant nature of the Ir 5 orbitals Kim et al. (2014). It is therefore intriguing to compare the spectral weight of the contributions A0 and A1 with that of the local excitations A2 and A3. To this end, the spectral weight [] of the contributions A0 and A1 (A2 and A3) was calculated from the area below the corresponding two Lorentz functions. The ratio of the spectral weights, , could serve as a measure for the itinerant character of the material. The pressure dependence of the ratio is shown in Fig. 5(a).
Interestingly, the absorbance of -Li2IrO3 at low pressures is very similar to the absorbance of Na2IrO3 at high pressures Xi et al. (2018). Note that in Ref. Xi et al. (2018) the contribution appears only above 13.5 GPa. (The fourth peak found in our present study is out of range for Ref. Xi et al. (2018)). According to high-quality single crystal XRD data under pressure, -Li2IrO3 is similar to Na2IrO3 at 29 GPa regarding lattice parameters Hermann et al. (2017). Electronically, these two materials are different due to different oxygen mediated hopping parameters, which depend not only on the Ir–O distances but also on Ir–O–Ir bond angles. Nevertheless, the assignment of A0 and A1 in -Li2IrO3 according to theoretical calculations for Na2IrO3 is justified, since no major energy shifts are found with pressure Xi et al. (2018); Hermann et al. (2017) or by Li substitution Hermann et al. (2017) in this energy range.
III.2.1 Pressure range
In comparison to the ambient-pressure optical conductivity data, already at 2.2 GPa the spectral weight of excitation A, which is mainly due to on-site excitations, is drastically reduced. This drastic decrease was also observed by recent pressure-dependent RIXS experiments of Clancy et al. Clancy et al. (2018), where it was interpreted in terms of an increasing QMO-nature. It was furthermore proposed that an itinerant QMO-like state develops for the pressure range 2 GPa3 GPa, and that the relativistic =1/2 ground state breaks down already at low pressure (2 GPa) Clancy et al. (2018). In this low-pressure regime small distortions of the Ir–Ir network and the IrO6 octahedra increase the intrahexagonal hopping parameters and suppress the interhexagon ones, favoring the QMO nature Foyevtsova et al. (2013); Clancy et al. (2018). Indeed, according to our absorbance data, the spectral weight of the on-site excitation A2 at 0.5 GPa is nearly halved as compared to ambient pressure [see Fig. 4(a)]. However, the relative spectral weight between the itinerant and local excitations does not change between 0.5 and 3.5 GPa [see Fig. 5(a)]. Therefore, the previously suggested Clancy et al. (2018) increase in the itinerant character of -Li2IrO3 under pressure is not confirmed by our data \bibnoteA weakening of the optically forbidden on-site excitations may in general also be due to a reduction of the trigonal distortion of the IrO6 octahedra Mazin et al. (2012); Bhattacharjee et al. (2012); Kim et al. (2012). However, according to the energy difference [see Fig. 5(b)] the opposite trend is observed for -Li2IrO3, namely an increase in the trigonal distortion with increasing pressure up to .. Nor have we confirmed the structural changes proposed in Ref. Clancy et al. (2018), as our single-crystal XRD data and phonon spectra both show only a smooth evolution of the structure below .
Besides the above-mentioned initial spectral weight reduction, we do not observe a further pressure-induced spectral weight decrease for the low-energy (1 eV) - excitations for pressures below , contrary to the observations in RIXS studies Clancy et al. (2018). Instead, the spectral weight is slightly increased for all four excitations A0-A3 in a similar manner [see Figs. 4(a) and 5(a)]. The reason for the different behavior of the spectral weight in the RIXS and optical spectra might be related to different selection rules for the two techniques. With increasing pressure, the local excitation A2 shifts to lower energies, in agreement with RIXS results Clancy et al. (2018), whereas the positions of A0, A1, and the local excitation A3 are independent of pressure within the error bar. The shift of A2 results in an increase in [see Fig. 5(b)], which suggests a pressure-induced increase in the trigonal distortion below the onset of dimerization Kim et al. (2014). The weak anomalies in some optical parameters already slightly below (see Fig. 4), suggest an enhancement of the QMO character due to the enhanced trigonal distortion Foyevtsova et al. (2013).
For the non-local transitions in the higher-energy range (excitations B and C) one observes only a slight pressure-induced decrease in the spectral weight below = 3.8 GPa. The pressure-induced changes are further illustrated by the difference spectra [see Fig. 6(b)] calculated according to =-.
To summarize, below no changes occur in the intersite physics, and there are only moderate changes in the on-site physics (energy difference of the on-site transitions) caused by the change in the trigonal distortion.
III.2.2 Pressure range
Directly above , a pressure-induced increase in the spectral weight around the contribution A occurs in the optical conductivity (see Fig. 3) and the absorbance [see Fig. 4(a)]. According to the pressure-dependent absorbance spectrum, the main spectral weight increase is attributed to A1, which concomitantly shifts to higher energies. The pressure-induced shift of A2 to lower energies continues above , but the spectrum can no longer be fitted well with only one Lorentz oscillator. Instead, two Lorentz terms A and A have to be included to obtain a good fit of the spectra [see Fig. 4(a)]. We attribute the splitting to a proposed additional monoclinic distortion induced by Ir-Ir dimerization, which primarily affects the levels. Concurrently, the spectral weight of excitation A3, which is connected to A2 via the trigonal distortion below , is decreased above , and the contribution A3 is no longer observed for pressures above 5 GPa.
With further increasing the pressure up to around 8-10 GPa, A shifts to lower frequencies so that A, A and A1 nearly combine to one broad peak, which can only be fitted well with three Lorentz oscillators. Above 10 GPa this combined peak shifts to higher energies. Interestingly, the spectral weight ratio shows a maximum at before it decreases and reaches its low-pressure value [see Fig. 5(a)]. Whether the spectral weight ratio could still serve as a measure for the itinerant character of -Li2IrO3 in its dimerized phase is, however, questionable.
Corresponding changes are revealed by the difference spectra shown in Fig. 6(b): Above additional spectral weight grows around contribution A, in the frequency range 3000-6000 cm-1. The increase in the spectral weight comprises two contributions, labeled A1 and A2 \bibnoteAccording to the absorbance spectra [see Fig. 4(c)] feature A2 consists of two contributions A and A.. They shift towards each other and become nearly degenerate above 15 GPa, where the increase in the spectral weight saturates. The behavior of these two features with increasing pressure is indicated in Fig. 6(b) by black, dashed lines. The increasing spectral weight of the on-site excitations can be attributed to the increasing octahedral distortions Mazin et al. (2012); Bhattacharjee et al. (2012); Kim et al. (2012).
Also in the higher-energy range of the - transitions significant pressure-induced changes occur well above according to the optical conductivity [see Fig. 3(b)]: The trend of decreasing spectral weight is continued for contribution B and the spectral weight around contribution C shifts to higher frequencies with increasing pressure. As seen more clearly in the contour plot [Fig. 6(a)], this shift of the spectral weight is most pronounced for the pressure range 10-17 GPa.
More detailed information on the changes can be obtained the difference spectra depicted in Fig. 6(b): i) From the lowest up to the highest measured pressure the spectral weight around B is decreased. Since the contribution B is very broad, the whole measured frequency range is affected. ii) A kink in the difference spectrum appears at , located at around 9000 cm-1, and is observable up to 15 GPa [its pressure evolution is marked by a green, dashed line in Fig. 6(b)]. It might be related to an additional feature B′ centered at around 9000 cm-1, whose origin could be the direct hopping between adjacent Ir4+ ions Li et al. (2017). iii) An additional pressure-induced decrease in the spectral weight is observed in the range 11000-13000 cm-1, marked by the cyan dashed line, which is concomitant with the strong increase in the spectral weight for frequencies above 15000 cm-1. These findings suggest a transfer of spectral weight from 11000-13000 cm-1 to the frequency range above 15000 cm-1, which is most pronounced for pressures above 8 GPa. As a consequence, the optical conductivity has a clear three-peak profile at high pressures 20 GPa [see Fig. 3(b)]. The additional spectral weight above 15000 cm-1 could be due to additional electronic bands appearing in the triclinic dimerized phase, as suggested by tight-binding band structure calculations for Na2IrO3 Hu et al. (2018).
For pressures the large distortion of the honeycomb lattice results in the Ir–Ir dimerization and leads to a breakdown of the QMO-state Clancy et al. (2018). The dimerized ground state of -Li2IrO3 above can neither be described by a relativistic =1/2 state nor by an itinerant QMO-state. In Na2IrO3 in its dimerized phase, which is predicted at high pressure Hermann et al. (2018); Hu et al. (2018), the dimerization introduces a Mott insulator to band insulator transition, whereby the low-energy excitations could possibly preserve their -character Hu et al. (2018). Such a Mott to band insulator transition is common to other Mott insulators in their dimerized phase Takayama et al. ; Antonov and Uba (2018); Bastien et al. (2018). It is furthermore interesting to note that the pressure-induced changes in -Li2IrO3 seem to be quite similar to those in the three-dimensional analogue -Li2IrO3, due to the similarities in the local environment of the Ir atoms: It was predicted that -Li2IrO3 undergoes an electronic phase transition from Mott insulator to band insulators, concomitant to the structural phase transition to a dimerized phase Antonov and Uba (2018); Hu et al. (2018); Takayama et al. . The three-peak profile of the optical conductivity of -Li2IrO3 at high pressures, reported here, appears to be indicative for the dimerized state in iridates Takayama et al. .
IV Conclusion
The pressure-induced dimerization of Ir–Ir bonds in -Li2IrO3 at =3.8 GPa leads to an anomaly in the hardening of the Li-based phonon modes. The on-site - transitions, located in the lower-energy range, are strongly affected by the dimerization, showing several anomalies. In contrast, the intersite Ir - transitions at higher energies are mainly affected for pressures well above , showing a monotonic blueshift and decrease in spectral weight. At high pressure (20 GPa) the optical conductivity consists of three main, well-separated contributions. This profile of the optical conductivity seems to be indicative for the dimerized state in iridates.
Acknowledgements.
We thank Roser Valentí, Steve Winter, and Ying Li for the fruitful discussions. PG, AAT, and FF acknowledges financial support by the Deutsche Forschungsgemeinschaft (DFG) through TRR 80 and SPP 1666. AJ acknowledges support from the DFG through Grant No. JE 748/1. AAT acknowledges financial support from the Federal Ministry for Education and Research via the Sofja-Kovalevskaya Award of Alexander von Humboldt Foundation.References
- Kitaev (2006) A. Kitaev, “Anyons in an exactly solved model and beyond,” Ann. Phys. (NY) 321, 2 (2006).
- Jackeli and Khaliullin (2009) G. Jackeli and G. Khaliullin, “Mott Insulators in the Strong Spin-Orbit Coupling Limit: From Heisenberg to a Quantum Compass and Kitaev Models,” Phys. Rev. Lett. 102, 017205 (2009).
- Chaloupka et al. (2010) J. Chaloupka, G. Jackeli, and G. Khaliullin, “Kitaev-Heisenberg Model on a Honeycomb Lattice: Possible Exotic Phases in Iridium Oxides IrO3,” Phys. Rev. Lett. 105, 027204 (2010).
- Singh et al. (2012) Y. Singh, S. Manni, J. Reuther, T. Berlijn, R. Thomale, W. Ku, S. Trebst, and P. Gegenwart, “Relevance of the Heisenberg-Kitaev Model for the Honeycomb Lattice Iridates 2IrO3,” Phys. Rev. Lett. 108, 127203 (2012).
- Choi et al. (2012) S. K. Choi, R. Coldea, A. N. Kolmogorov, T. Lancaster, I. I. Mazin, S. J. Blundell, P. G. Radaelli, Yogesh Singh, P. Gegenwart, K. R. Choi, S.-W. Cheong, P. J. Baker, C. Stock, and J. Taylor, “Spin Waves and Revised Crystal Structure of Honeycomb Iridate Na2IrO3,” Phys. Rev. Lett. 108, 127204 (2012).
- Plumb et al. (2014) K. W. Plumb, J. P. Clancy, L. J. Sandilands, V. Vijay Shankar, Y. F. Hu, K. S. Burch, Hae-Young Kee, and Young-June Kim, “-RuCl3: A spin-orbit assisted Mott insulator on a honeycomb lattice,” Phys. Rev. B 90, 041112 (2014).
- Chun et al. (2015) S. H. Chun, J.-W. Kim, J. Kim, H. Zheng, C. C. Stoumpos, C. D. Malliakas, J. F. Mitchell, K. Mehlawat, Y. Singh, Y. Choi, T. Gog, A. Al-Zein, M. Moretti Sala, M. Krisch, J. Chaloupka, G. Jackeli, G. Khaliullin, and B. J. Kim, “Direct evidence for dominant bond-directional interactions in a honeycomb lattice iridate Na2IrO3,” Nat. Phys. 11, 462 (2015).
- Winter et al. (2017) S. M. Winter, A. A. Tsirlin, M. Daghofer, J. van den Brink, Y. Singh, P. Gegenwart, and R. Valentí, “Models and materials for generalized Kitaev magnetism,” J. Phys.: Condens. Matter 29, 493002 (2017).
- Sears et al. (2015) J. A. Sears, M. Songvilay, K. W. Plumb, J. P. Clancy, Y. Qiu, Y. Zhao, D. Parshall, and Young-June Kim, “Magnetic order in –RuCl3: A honeycomb-lattice quantum magnet with strong spin-orbit coupling,” Phys. Rev. B 91, 144420 (2015).
- Banerjee et al. (2016) A. Banerjee, C. A. Bridges, J-Q Yan, A. A. Aczel, L. Li, M. B. Stone, G. E. Granroth, M. D. Lumsden, Y. Yiu, J. Knolle, S. Bhattacharjee, D. L. Kovrizhin, R. Moessner, D. A. Tennant, D. G. Mandrus, and S. E. Nagler, “Proximate Kitaev quantum spin liquid behaviour in a honeycomb magnet,” Nat. Mater. 15, 733 (2016).
- Williams et al. (2016) S. C. Williams, R. D. Johnson, F. Freund, Sungkyun Choi, A. Jesche, I. Kimchi, S. Manni, A. Bombardi, P. Manuel, P. Gegenwart, and R. Coldea, “Incommensurate counterrotating magnetic order stabilized by Kitaev interactions in the layered honeycomb -Li2IrO3,” Phys. Rev. B 93, 195158 (2016).
- Wolter et al. (2017) A. U. B. Wolter, L. T. Corredor, L. Janssen, K. Nenkov, S. Schönecker, S.-H. Do, K.-Y. Choi, R. Albrecht, J. Hunger, T. Doert, M. Vojta, and B. Büchner, “Field-induced quantum criticality in the Kitaev system ,” Phys. Rev. B 96, 041405 (2017).
- Baek et al. (2017) S.-H. Baek, S.-H. Do, K.-Y. Choi, Y. S. Kwon, A. U. B. Wolter, S. Nishimoto, J. van den Brink, and B. Büchner, “Evidence for a Field-Induced Quantum Spin Liquid in -,” Phys. Rev. Lett. 119, 037201 (2017).
- Janssen et al. (2016) L. Janssen, E. C. Andrade, and M. Vojta, “Honeycomb-Lattice Heisenberg-Kitaev Model in a Magnetic Field: Spin Canting, Metamagnetism, and Vortex Crystals,” Phys. Rev. Lett. 117, 277202 (2016).
- Winter et al. (2018) S. M. Winter, K. Riedl, D. Kaib, R. Coldea, and R. Valentí, “Probing -rucl3 beyond magnetic order: Effects of temperature and magnetic field,” Phys. Rev. Lett. 120, 077203 (2018).
- (16) H. Takagi, T. Takayama, G. Jackeli, G. Khaliullin, and S. E. Nagler, “Kitaev quantum spin liquid - concept and materialization,” arXiv:1903.08081 .
- Hermann et al. (2017) V. Hermann, J. Ebad-Allah, F. Freund, I. M. Pietsch, A. Jesche, A. A. Tsirlin, J. Deisenhofer, M. Hanfland, P. Gegenwart, and C. A. Kuntscher, “High-pressure versus isoelectronic doping effect on the honeycomb iridate Na2IrO3,” Phys. Rev. B 96, 195137 (2017).
- Biesner et al. (2018) T. Biesner, S. Biswas, W. Li, Y. Saito, A. Pustogow, M. Altmeyer, A. U. B. Wolter, B. Büchner, M. Roslova, T. Doert, S. M. Winter, R. Valentí, and M. Dressel, “Detuning the honeycomb of : Pressure-dependent optical studies reveal broken symmetry,” Phys. Rev. B 97, 220401 (2018).
- Simutis et al. (2018) G. Simutis, N. Barbero, K. Rolfs, P. Leroy-Calatayud, K. Mehlawat, R. Khasanov, H. Luetkens, E. Pomjakushina, Y. Singh, H.-R. Ott, J. Mesot, A. Amato, and T. Shiroka, “Chemical and hydrostatic-pressure effects on the Kitaev honeycomb material ,” Phys. Rev. B 98, 104421 (2018).
- Wang et al. (2018) Z. Wang, J. Guo, F. F. Tafti, A. Hegg, S. Sen, V. A. Sidorov, L. Wang, S. Cai, W. Yi, Y. Zhou, H. Wang, S. Zhang, K. Yang, A. Li, X. Li, Y. Li, J. Liu, Y. Shi, W. Ku, Q. Wu, . J. Cava, and L. Sun, “Pressure-induced melting of magnetic order and emergence of a new quantum state in ,” Phys. Rev. B 97, 245149 (2018).
- Hermann et al. (2018) V. Hermann, M. Altmeyer, J. Ebad-Allah, F. Freund, A. Jesche, A. A. Tsirlin, M. Hanfland, P. Gegenwart, I. I. Mazin, D. I. Khomskii, R. Valentí, and C. A. Kuntscher, “Competition between spin-orbit coupling, magnetism, and dimerization in the honeycomb iridates: -Li2IrO3 under pressure,” Phys. Rev. B 97, 020104(R) (2018).
- Bastien et al. (2018) G. Bastien, G. Garbarino, R. Yadav, F. J. Martinez-Casado, R. Beltrán Rodríguez, Q. Stahl, M. Kusch, S. P. Limandri, R. Ray, P. Lampen-Kelley, D. G. Mandrus, S. E. Nagler, M. Roslova, A. Isaeva, T. Doert, L. Hozoi, A. U. B. Wolter, B. Büchner, J. Geck, and J. van den Brink, “Pressure-induced dimerization and valence bond crystal formation in the Kitaev-Heisenberg magnet ,” Phys. Rev. B 97, 241108 (2018).
- Hu et al. (2018) K. Hu, Z. Zhou, Y.-W. Wei, C.-K. Li, and J. Feng, “Bond ordering and phase transitions in under high pressure,” Phys. Rev. B 98, 100103 (2018).
- Majumder et al. (2018) M. Majumder, R. S. Manna, G. Simutis, J. C. Orain, T. Dey, F. Freund, A. Jesche, R. Khasanov, P. K. Biswas, E. Bykova, N. Dubrovinskaia, L. S. Dubrovinsky, R. Yadav, L. Hozoi, S. Nishimoto, A. A. Tsirlin, and P. Gegenwart, “Breakdown of Magnetic Order in the Pressurized Kitaev Iridate ,” Phys. Rev. Lett. 120, 237202 (2018).
- (25) For Na2IrO3, additional pressure-induced transitions were suggested recently from powder x-ray diffraction measurements Xi et al. (2018), which were, however, not observed by higher-quality single-crystal x-ray diffraction data Hermann et al. (2017).
- Yadav et al. (2018) R. Yadav, S. Rachel, L. Hozoi, J. van den Brink, and G. Jackeli, “Strain- and pressure-tuned magnetic interactions in honeycomb kitaev materials,” Phys. Rev. B 98, 121107 (2018).
- Gretarsson et al. (2013) H. Gretarsson, J. P. Clancy, X. Liu, J. P. Hill, E. Bozin, Y. Singh, S. Manni, P. Gegenwart, J. Kim, A. H. Said, D. Casa, T. Gog, M. H. Upton, H.-S. Kim, J. Yu, V. M. Katukuri, L. Hozoi, J. van den Brink, and Y.-J. Kim, “Crystal-Field Splitting and Correlation Effect on the Electronic Structure of A2IrO3,” Phys. Rev. Lett. 110, 076402 (2013).
- Kim et al. (2012) C. H. Kim, H. S. Kim, H. Jeong, H. Jin, and J. Yu, “Topological Quantum Phase Transition in 5d Transition Metal Oxide Na2IrO3,” Phys. Rev. Lett. 108, 106401 (2012).
- Kim et al. (2013) H.-S. Kim, C. H. Kim, H. Jeong, H. Jin, and J. Yu, “Strain-induced topological insulator phase and effective magnetic interactions in Li2IrO3,” Phys. Rev. B 87, 165117 (2013).
- Mazin et al. (2012) I. I. Mazin, H. O. Jeschke, K. Foyevtsova, R. Valentí, and D. I. Khomskii, “Na2IrO3 as a Molecular Orbital Crystal,” Phys. Rev. Lett. 109, 197201 (2012).
- Mazin et al. (2013) I. I. Mazin, S. Manni, K. Foyevtsova, H. O. Jeschke, P. Gegenwart, and R. Valentí, “Origin of the insulating state in honeycomb iridates and rhodates,” Phys. Rev. B 88, 035115 (2013).
- Singh and Gegenwart (2010) Y. Singh and P. Gegenwart, “Antiferromagnetic Mott insulating state in single crystals of the honeycomb lattice material Na2IrO3,” Phys. Rev. B 82, 064412 (2010).
- Xi et al. (2018) X. Xi, X. Bo, X. S. Xu, P. P. Kong, Z. Liu, X. G. Hong, C. Q. Jin, G. Cao, X. Wan, and G. L. Carr, “Honeycomb lattice Na2IrO3 at high pressures: A robust spin-orbit Mott insulator,” Phys. Rev. B 98, 125117 (2018).
- Sohn et al. (2013) C. H. Sohn, H.-S. Kim, T. F. Qi, D. W. Jeong, H. J. Park, H. K. Yoo, H. H. Kim, J.-Y. Kim, T. D. Kang, D.-Y. Cho, G. Cao, J. Yu, S. J. Moon, and T. W. Noh, “Mixing between and orbitals in Na2IrO3: A spectroscopic and density functional calculation study,” Phys. Rev. B 88, 085125 (2013).
- Kim et al. (2016) B. H. Kim, T. Shirakawa, and S. Yunoki, “From a Quasimolecular Band Insulator to a Relativistic Mott Insulator in Systems with a Honeycomb Lattice Structure,” Phys. Rev. Lett. 117, 187201 (2016).
- Clancy et al. (2018) J. P. Clancy, H. Gretarsson, J. A. Sears, Y. Singh, S. Desgreniers, K. Mehlawat, S. Layek, G. Kh. Rozenberg, Y. Ding, M. H. Upton, D. Casa, N. Chen, J. Im, Y. Lee, R. Yadav, L. Hozoi, D. Efremov, J. van den Brink, and Y.-J. Kim, “Pressure-driven collapse of the relativistic electronic ground state in a honeycomb iridate,” npj Quantum Mater. 3, 57 (2018).
- Foyevtsova et al. (2013) K. Foyevtsova, H. O. Jeschke, I. I. Mazin, D. I. Khomskii, and R. Valentí, “Ab initio analysis of the tight-binding parameters and magnetic interactions in Na2IrO3,” Phys. Rev. B 88, 035107 (2013).
- Bhattacharjee et al. (2012) S. Bhattacharjee, S.-S. Lee, and Y. B. Kim, “Spin–-orbital locking, emergent pseudo-spin and magnetic order in honeycomb lattice iridates,” New J. Phys. 14, 073015 (2012).
- Sun et al. (2018) F. Sun, H. Zheng, Y. Liu, E. D. Sandoval, C. Xu, J. Xu, C. Q. Jin, C. J. Sun, W. G. Yang, H. K. Mao, J. F. Mitchell, A. N. Kolmogorov, and D. Haskel, “Electronic and structural response to pressure in the hyperkagome-lattice ,” Phys. Rev. B 98, 085131 (2018).
- Freund et al. (2016) F. Freund, S. C. Williams, R. D. Johnson, R. Coldea, P. Gegenwart, and A. Jesche, “Single crystal growth from separated educts and its application to lithium transition-metal oxides,” Sci. Rep. 6, 35362 (2016).
- Huber et al. (1977) G. Huber, K. Syassen, and W. B. Holzapfel, “Pressure dependence of 4f levels in europium pentaphosphate up to 400 kbar,” Phys. Rev. B 15, 5123 (1977).
- Mao et al. (1986) H. K. Mao, J. Xu, and P. M. Bell, “Calibration of the ruby pressure gauge to 800 kbar under quasi‐hydrostatic conditions,” J. Geoph. Re.: Solid Earth 91, 4673 (1986).
- Eremets and Timofeev (1992) M. I. Eremets and Yu. A. Timofeev, “Miniature diamond anvil cell: Incorporating a new design for anvil alignment,” Rev. Sci. Instr. 63, 3123 (1992).
- Ruoff and Ghandehari (1994) A. L. Ruoff and K. Ghandehari, “Refractive index of diamond anvils at high pressure,” in AIP Conference Proceedings (AIP, 1994) pp. 1523–1525.
- Kuzmenko (2005) A. B. Kuzmenko, “Kramers–Kronig constrained variational analysis of optical spectra,” Rev. Sci. Instr. 76, 083108 (2005).
- Plaskett and Schatz (1963) J. S. Plaskett and P. N. Schatz, “On the Robinson and Price (Kramers–Kronig) Method of Interpreting Reflection Data Taken through a Transparent Window,” J. Chem. Phys. 38, 612 (1963).
- Kroumova et al. (2003) E. Kroumova, M. I. Aroyo, J. M. Perez-Mato, A. Kirov, C. Capillas, S. Ivantchev, and H. Wondratschek, “Bilbao Crystallographic Server: Useful Databases and Tools for Phase-Transition Studies,” Phase Transitions 76, 155 (2003).
- Kim et al. (2014) B. H. Kim, G. Khaliullin, and B. I. Min, “Electronic excitations in the edge-shared relativistic Mott insulator: Na2IrO3,” Phys. Rev. B 89, 081109(R) (2014).
- Li et al. (2015) Y. Li, K. Foyevtsova, H. O. Jeschke, and R. Valentí, “Analysis of the optical conductivity for A2IrO3 (A = Na, Li) from first principles,” Phys. Rev. B 91, 161101 (2015).
- Li et al. (2017) Ying Li, Stephen M. Winter, Harald O. Jeschke, and Roser Valentí, “Electronic excitations in -Li2IrO3,” Phys. Rev. B 95, 045129 (2017).
- (51) “private communication AG Valentí,” .
- (52) We note that the contributions A2 and A3 would also fit energetically to interband transitions of QMOs, since -Li2IrO3 is known to exhibit both Mott-insulating and QMO character Kim et al. (2016); Hermann et al. (2017) at ambient pressure.
- (53) A weakening of the optically forbidden on-site excitations may in general also be due to a reduction of the trigonal distortion of the IrO6 octahedra Mazin et al. (2012); Bhattacharjee et al. (2012); Kim et al. (2012). However, according to the energy difference [see Fig. 5(b)] the opposite trend is observed for -Li2IrO3, namely an increase in the trigonal distortion with increasing pressure up to .
- (54) According to the absorbance spectra [see Fig. 4(c)] feature A2 consists of two contributions A and A.
- (55) T. Takayama, A. Krajewska, A. S. Gibbs, A. N. Yaresko, H. Ishii, H. Yamaoka, K. Ishii, N. Hiraoka, N. P. Funnel, C. L. Bull, and H. Takagi, “Pressure-induced collapse of spin-orbital Mott state in the hyperhoneycomb iridate -Li2IrO3,” arXiv:1808.05494v1 .
- Antonov and Uba (2018) V. N. Antonov and L. Uba, S. und Uba, “Electronic structure and x-ray magnetic circular dichroism in the hyperhoneycomb iridate -Li2IrO3,” Phys. Rev. B 98, 245113 (2018).