Direct Entropy Measurement in a Mesoscopic Quantum System
The entropy of an electronic system offers important insights into the nature of its quantum mechanical ground state. This is particularly valuable in cases where the state is difficult to identify by conventional experimental probes, such as conductance. Traditionally, entropy measurements are based on bulk properties, such as heat capacity, that are easily observed in macroscopic samples but are unmeasurably small in systems that consist of only a few particles Ramirez et al. (1999); Schmidt et al. (2017). In this work, we develop a mesoscopic circuit to directly measure the entropy of just a few electrons, and demonstrate its efficacy using the well understood spin statistics of the first, second, and third electron ground states in a GaAs quantum dot Tarucha et al. (1996); Ciorga et al. (2000); Duncan et al. (2000); Lindemann et al. (2002); Potok et al. (2003); Hofmann et al. (2016). The precision of this technique, quantifying the entropy of a single spin- to within 5% of the expected value of , shows its potential for probing more exotic systems. For example, entangled states or those with non-Abelian statistics could be clearly distinguished by their low-temperature entropyCooper and Stern (2009); Ben-Shach et al. (2013); Smirnov (2015); Hou et al. (2012); Alkurtass et al. (2016).
Our approach is analogous to the milestone of spin-to-charge conversion achieved over a decade ago, in which the infinitesimal magnetic moments of a single spin were detected by transforming them into the presence or absence of an electron charge Elzerman et al. (2004); Ono and Tarucha (2004). Following this example, we perform an entropy-to-charge conversion, making use of the Maxwell relation
| (1) |
that connects changes in entropy, particle number, and temperature (, , and , respectively) to changes in the chemical potential, , a quantity that is simple to measure and control.
The Maxwell relation in Eq. 1 forms the basis of two theoretical proposals to measure non-Abelian exchange of Moore-Read quasiparticles in the state via their entropy Cooper and Stern (2009); Ben-Shach et al. (2013). Reference Ben-Shach et al., 2013 proposes a strategy by which quasiparticle entropy could be deduced from the temperature-dependent shift of charging events on a local disorder potential—a thermodynamic equivalent of the measurements that established the quasiparticle chargeVenkatachalam et al. (2011). As a demonstration of the viability and the high accuracy achievable by this technique, we investigate a well-understood system with localized fermions in place of more exotic quasiparticles: a few-electron GaAs quantum dot. The entropies of the first three electron states in the dot are measured by the temperature-dependent charging scheme laid out in Ref. Ben-Shach et al., 2013. Applying the language of quantum dots to Eq. 1, the entropy difference between the and electron ground states ( for ) is measured via the shift with temperature in the electrochemical potential, , needed to add the th electron to the dot.
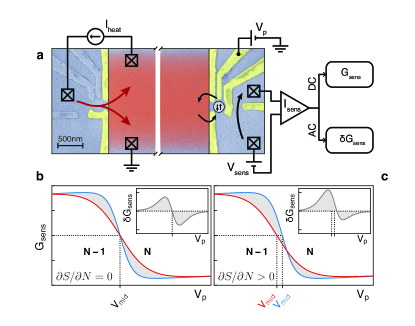
The measurement relies on the mesoscopic circuit shown in Fig. 1a, using electrostatic gates to realize an electron reservoir in thermal and diffusive equilibrium with a few-electron quantum dot coupled to its right side. The occupation of the dot is tuned with the plunger gate voltage, , and measured using an adjacent quantum point contact as a charge sensor Field et al. (1993); Staring et al. (1993); Thierschmann et al. (2015). Applying more positive lowers , bringing the th electron into the dot when drops below the Fermi level of the reservoir, . The reservoir temperature, , can be increased above the GaAs substrate temperature by Joule heating from current, , driven through a quantum point contact on the left side. Charge transitions on the dot appear as steps in the charge sensor conductance, , thermally broadened by the reservoir temperature (Figs. 1b and c). The gate voltage corresponding to the midpoint of the transition, , marks the electrochemical potential at which the probabilities of finding and electrons on the dot are equal.
When shifts with temperature, also shifts; it is the shift in with temperature that forms the basis of our experiment (Fig. 1c). In practice, charge noise limits the accuracy to which can be measured. To overcome this, the measurement is done with a lock-in amplifier, oscillating the temperature using an AC and measuring resultant oscillations in , which we label . As seen in the insets of Figs. 1b and c, the lineshape of is perfectly antisymmetric when , but asymmetric when .
The temperature-induced shift in the dot chemical potential with respect to reservoir can also be understood in terms of detailed balance. At , where probabilities for and electrons on the dot are equal, the tunnel rates and must also be equal. These rates depend on the number of available states in the tunneling process, and therefore on the degeneracies, and , of the and ground states Beenakker (1991); Gustavsson et al. (2009). The condition leads to a simple relationship between degeneracy and the thermally broadened Fermi function, : . Using the Boltzman entropy, , this relationship becomes , clearly demonstrating the connection between entropy, temperature, and the shift in at . Previous experiments have explored the relationship between tunnel rates and degeneracy using time-resolved transport spectroscopy and by coupling quantum dots to atomic force cantilever oscillations Cockins et al. (2010); Bennett et al. (2010); Beckel et al. (2014); Hofmann et al. (2016). The approach presented here is a thermodynamic analogue, and extends entropy measurements to a wider set of applications where tunneling processes may not be observable in real-time.
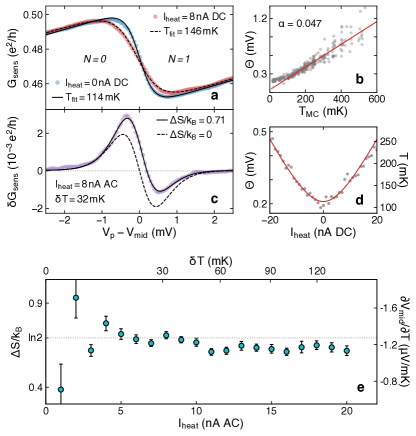
The dot was tuned such that the source was weakly tunnel-coupled to the reservoir with the drain closed. The conductance of the charge sensor was tuned to , where it was most sensitive to charge on the dot. The addition of the first electron to the dot was marked by a decrease in that is consistent with a thermally-broadened two-level transition (Fig. 2a):
| (2) | ||||
where quantifies the sensor sensitivity, is the thermal broadening expressed in units of gate voltage, is the lever arm, reflects the cross capacitance between the charge sensor and plunger gate, and is an offset. Figure 2a shows two such transition curves with thermal broadening set by . For , followed down to approximately (Fig. 2b), validating the approximation of thermal broadening used throughout this experiment.
The data in Fig. 2c, and corresponding fits, illustrate a measurement of across the electron transition. The lock-in measurement of , due to temperature oscillations , yields the characteristic peak-dip structure seen in Fig. 2c.
The expected lineshape of such a curve is , with defined by Eq. 2. This lineshape depends explicitly on , recognizing (via Eq. 1) that :
| (3) | ||||
As expected from Figs. 1b and c, is antisymmetric around for , and asymmetric for . A fit of the data in Fig. 2c to Eq. 3 yields , closely matching the expected for transitions between an empty dot with zero entropy () and the two-fold degenerate one-electron state () with entropy .
It is important to note that is extracted from fits to Eq. 3 based solely on the asymmetry of the lineshape, with no calibration of measurement parameters (such as or the lever arm ) required. We can, however, estimate and by determining from fits to Eq. 2 for varying substrate temperature (Fig. 2b) and (Fig. 2d). Measurements of remained constant over a broad range of (Fig. 2e), as expected for temperatures low enough not to excite orbital degrees of freedom on the dot.
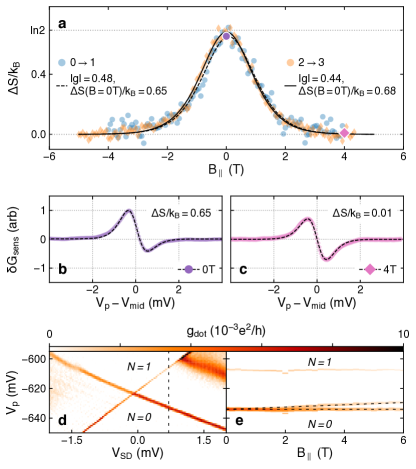
Confirmation that the measured derives from spin degeneracy is seen through its evolution with in-plane magnetic field, . Figure 3a compares for the and transitions, both of which correspond to transitions from total spin zero to total spin one-half. The entropies of the one- and three-electron states go to zero as Zeeman splitting lifts the spin degeneracy, following the Gibbs entropy for a two-level system:
| (4) |
where are the probabilities for the unpaired electron to be in the spin up or spin down states at a given field and temperature. Fits to Eq. 4, with the ratio and an added scaling as free parameters, give and (Fig. 3), and reflect the collapse to zero at high field where spin degeneracy is broken. This collapse can also be seen qualitatively, in the crossover from asymmetric to antisymmetric lineshapes of (Figs. 3b and c). Estimating an average for each data set using the calibration in Fig. 2d yields and for the and transitions, respectively. Errors in the g-factor measurement are likely due to the difficulty of estimating temperature oscillations. Still, the g-factors are consistent with reported valuesCronenwett et al. (1998); Hanson et al. (2003); Zumbühl et al. (2004) and the value measured separately in Fig. 3e using bias spectroscopy.
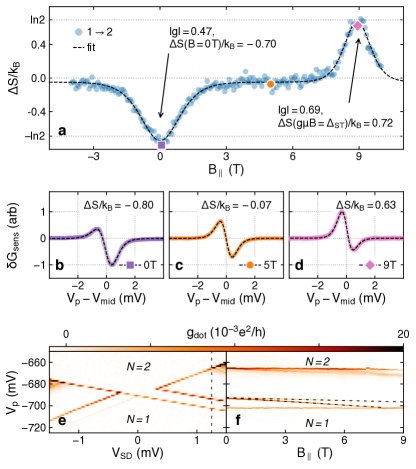
The transition can be understood as the inverse of the transition for , comparing Figs. 3a and 4a. For relatively low fields, the two-electron ground state remains a spin singlet with zero entropy, while the one-electron entropy goes from to zero due to Zeeman splitting. At higher fields, the one-electron ground state remains non-degenerate while the two-electron ground state gains a two-fold degeneracy when the singlet and triplet states cross. This singlet-triplet crossing is seen in bias spectroscopy data (Fig. 4f) at , and in the appearance of a peak in at (Fig. 4a). The discrepancy in field required to drive the singlet-triplet degeneracy in Figs. 4a and f is attributed to a change in shape of the dot potential, caused by altering the confinment gate voltages, when transitioning from one to two open tunnel barriers.
The field-dependent entropy measurement for the transition can again be fit using Eq. 4, with probabilities as before for the one-electron states and , for the two-electron states, where is the singlet-triplet splitting at zero field. From the fit, we find at the two-fold degenerate points, and , are and , respectively. The extracted g-factor, , from the peak at is consistent with the transition. At the high-field singlet-triplet degeneracy we find , an unexpectedly high g-factor that is explained by a shift of the state with magnetic field, as seen in Fig. 4f and previous work Szafran et al. (2004).
We conclude with a few notes to encourage the application of this entropy measurement protocol to other mesoscopic systems. The crucial ingredients in achieving the high accuracy reported here were ) the ability to oscillate temperature rapidly enough to avoid noise, ) the ability to measure charging transitions without perturbing the localized states, and ) the fact that the charging transitions were thermally broadened. Criterion ) enabled the entropy determination purely by asymmetry, without the need to know or other measurement parameters accurately, yielding an uncertainty less than 5%. With this level of precision, it should be possible, for example, to distinguish the entropy of a non-Abelian Majorana bound state from the entropy of an Andreev bound state at an accidental degeneracySmirnov (2015); Hou et al. (2012). Similarly, the two-channel Kondo state could be clearly distinguished from fully screened () or unscreened () spin statesAlkurtass et al. (2016).
Methods The device was built on a AlGaAs/GaAs heterostructure, hosting a 2D electron gas with density and mobility at of and respectively, determined in a separate measurement. Mesas and NiAuGe ohmic contacts to the 2DEG were defined by standard photolithography techniques, followed by atomic layer deposition of to improve the gating stability in the device. Fine gate structures, shown in Fig. 1a, were defined by electron beam lithography and deposition of Ti/Au.
The measurement was carried out in a dilution refrigerator with a two-axis magnet. The 2DEG was aligned parallel to the main axis with the second axis used to compensate for sample misalignment. In practice, out-of-plane fields up to showed no effect on our data. A retuning of the quantum dot gates was necessary to capture the bias spectroscopy data in Figs. 3d,e and 4e,f. The rightmost gate (Fig. 1a) on the quantum dot was used to tune between the one and two lead configurations, for the entropy and bias spectroscopy measurements respectively. This tuning had a significant effect on the shape of the potential well, accounting for variations in parameters such as and between the two measurement configurations. Charge sensor conductance was measured using a DC voltage bias of ; we find that Joule heating through the sensor does not affect our reservoir temperatures up to . The DC current () was measured using an analog-digital convertor while AC current () was measured using a lock-in amplifier. The DC conductance reported here is while the oscillations are defined as .
The temperature of the reservoir was raised above the substrate temperature using at AC or DC, with the QPC heater set by gate voltages to . Applying AC current at yields an oscillating Joule power, . To leading order this gives oscillations in temperature, and therefore , at . These are captured by the lock-in amplifier at the second harmonic of . Except where noted, measurements of were made at , although the error bars in Fig. 2 demonstrate that the measurements would have been just as accurate with set to . The fixed pressure condition of Eq. 1 is met by working well below the Fermi temperature of the 2DEG, , where degeneracy pressure dominates Landau and Lifshitz (1980).
Data Availability Data generated for, and analyzed in, this study are available at https://github.com/nikhartman/spin_entropy. The repository also contains all code necessary to complete the analysis and create each of the figures in this manuscript.
Acknowledgements The authors acknowledge John Martinis for a helpful discussion on the interpretation of our measurements. NH, CO, SL, MS, and JF supported by the Canada Foundation for Innovation, the National Science and Engineering Research Council, CIFAR, and SBQMI. SF, GG, and MM supported by the U.S. DOE Office of Basic Energy Sciences, Division of Materials Sciences and Engineering Award No. DE-SC0006671, with additional support from Nokia Bell Laboratories for the MBE facility gratefully acknowledged.
Author Contributions NH and CO fabricated the mesoscopic device. GaAs heterostructures and their characterization were provided by SF, GG, and MM. SL and MS worked on early versions of the experiment and provided helpful discussion. NH performed measurements and analyzed data. Manuscript written by NH and JF with additional feedback from all authors.
References
- Ramirez et al. (1999) A P Ramirez, A Hayashi, R J Cava, R Siddharthan, and B S Shastry, “Zero-point entropy in ‘spin ice’,” Nature 399, 333 (1999).
- Schmidt et al. (2017) B. A. Schmidt, K. Bennaceur, S. Gaucher, G. Gervais, L. N. Pfeiffer, and K. W. West, “Specific heat and entropy of fractional quantum hall states in the second landau level,” Phys. Rev. B 95, 201306 (2017).
- Tarucha et al. (1996) S. Tarucha, D. G. Austing, T. Honda, R. J. van der Hage, and L. P. Kouwenhoven, “Shell filling and spin effects in a few electron quantum dot,” Phys. Rev. Lett. 77, 3613–3616 (1996).
- Ciorga et al. (2000) M. Ciorga, A. Sachrajda, P. Hawrylak, C. Gould, P. Zawadzki, S. Jullian, Y. Feng, and Z. Wasilewski, “Addition spectrum of a lateral dot from Coulomb and spin-blockade spectroscopy,” Phys. Rev. B 61, R16315–R16318 (2000).
- Duncan et al. (2000) D. S. Duncan, D. Goldhaber-Gordon, R. M. Westervelt, K. D. Maranowski, and A. C. Gossard, “Coulomb-blockade spectroscopy on a small quantum dot in a parallel magnetic field,” Appl. Phys. Lett. 77, 2183–2185 (2000).
- Lindemann et al. (2002) S. Lindemann, T. Ihn, T. Heinzel, W. Zwerger, K. Ensslin, K. Maranowski, and A. C. Gossard, “Stability of spin states in quantum dots,” Phys. Rev. B 66, 195314 (2002).
- Potok et al. (2003) R. M. Potok, J. A. Folk, C. M. Marcus, V. Umansky, M. Hanson, and A. C. Gossard, “Spin and polarized current from coulomb blockaded quantum dots,” Phys. Rev. Lett. 91, 016802 (2003).
- Hofmann et al. (2016) A. Hofmann, V. F. Maisi, C. Gold, T. Krähenmann, C. Rössler, J. Basset, P. Märki, C. Reichl, W. Wegscheider, K. Ensslin, and T. Ihn, “Measuring the degeneracy of discrete energy levels using a quantum dot,” Phys. Rev. Lett. 117, 206803 (2016).
- Cooper and Stern (2009) N. R. Cooper and Ady Stern, “Observable bulk signatures of non-abelian quantum hall states,” Phys. Rev. Lett. 102, 176807 (2009).
- Ben-Shach et al. (2013) G. Ben-Shach, C. R. Laumann, I. Neder, A. Yacoby, and B. I. Halperin, “Detecting non-abelian anyons by charging spectroscopy,” Phys. Rev. Lett. 110, 106805 (2013).
- Smirnov (2015) Sergey Smirnov, “Majorana tunneling entropy,” Phys. Rev. B 92, 195312 (2015).
- Hou et al. (2012) C-Y Hou, K Shtengel, G Refael, and P M Goldbart, “Ettingshausen effect due to majorana modes,” New Journal of Physics 14, 105005 (2012).
- Alkurtass et al. (2016) Bedoor Alkurtass, Abolfazl Bayat, Ian Affleck, Sougato Bose, Henrik Johannesson, Pasquale Sodano, Erik S. Sørensen, and Karyn Le Hur, “Entanglement structure of the two-channel kondo model,” Phys. Rev. B 93, 081106 (2016).
- Elzerman et al. (2004) J. M. Elzerman, R. Hanson, L. H. Willems van Beveren, B. Witkamp, L.P. Kouwenhoven, and L. M. K. Vandersypen, “Single-shot read-out of an individual electron spin in a quantum dot,” Nature 430, 431–435 (2004).
- Ono and Tarucha (2004) Keiji Ono and Seigo Tarucha, “Nuclear-spin-induced oscillatory current in spin-blockaded quantum dots,” Phys. Rev. Lett. 92, 256803 (2004).
- Venkatachalam et al. (2011) Vivek Venkatachalam, Amir Yacoby, Loren Pfeiffer, and Ken West, “Local charge of the = 5/2 fractional quantum Hall state,” Nature 469, 185–188 (2011).
- Field et al. (1993) M. Field, C. G. Smith, M. Pepper, D. A. Ritchie, J. E. F. Frost, G. A. C. Jones, and D. G. Hasko, “Measurements of coulomb blockade with a noninvasive voltage probe,” Phys. Rev. Lett. 70, 1311–1314 (1993).
- Staring et al. (1993) A. A. M. Staring, L. W. Molenkamp, B. W. Alphenaar, H. van Houten, O. J. A. Buyk, M. A. A. Mabesoone, C. W. J. Beenakker, and C. T. Foxon, “Coulomb-blockade oscillations in the thermopower of a quantum dot,” EPL (Europhysics Letters) 22, 57 (1993).
- Thierschmann et al. (2015) Holger Thierschmann, Rafael Sánchez, Björn Sothmann, Fabian Arnold, Christian Heyn, Wolfgang Hansen, Hartmut Buhmann, and Laurens W. Molenkamp, “Three-terminal energy harvester with coupled quantum dots,” Nature Nanotechnology 10, 854–858 (2015).
- Beenakker (1991) C. W. J. Beenakker, “Theory of coulomb-blockade oscillations in the conductance of a quantum dot,” Phys. Rev. B 44, 1646–1656 (1991).
- Gustavsson et al. (2009) S. Gustavsson, R. Leturcq, M. Studer, I. Shorubalko, T. Ihn, K. Ensslin, D. C. Driscoll, and A. C. Gossard, “Electron counting in quantum dots,” Surface Science Reports 64, 191–232 (2009).
- Cockins et al. (2010) Lynda Cockins, Yoichi Miyahara, Steven D. Bennett, Aashish A. Clerk, Sergei Studenikin, Philip Poole, Andrew Sachrajda, and Peter Grutter, “Energy levels of few-electron quantum dots imaged and characterized by atomic force microscopy,” Proceedings of the National Academy of Sciences 107, 9496–9501 (2010).
- Bennett et al. (2010) Steven D. Bennett, Lynda Cockins, Yoichi Miyahara, Peter Grütter, and Aashish A. Clerk, “Strong electromechanical coupling of an atomic force microscope cantilever to a quantum dot,” Phys. Rev. Lett. 104, 017203 (2010).
- Beckel et al. (2014) A. Beckel, A. Kurzmann, M. Geller, A. Ludwig, A. D. Wieck, J. König, and A. Lorke, “Asymmetry of charge relaxation times in quantum dots: The influence of degeneracy,” EPL (Europhysics Letters) 106, 47002 (2014).
- Mittal et al. (1996) A. Mittal, R. G. Wheeler, M. W. Keller, D. E. Prober, and R. N. Sacks, “Electron-phonon scattering rates in GaAs/AlGaAs 2DEG samples below 0.5 K,” Surface Science 361-362, 537–541 (1996).
- Cronenwett et al. (1998) Sara M. Cronenwett, Tjerk H. Oosterkamp, and Leo P. Kouwenhoven, “A tunable kondo effect in quantum dots,” Science 281, 540–544 (1998).
- Hanson et al. (2003) R. Hanson, B. Witkamp, L. M. K. Vandersypen, L. H. Willems van Beveren, J. M. Elzerman, and L. P. Kouwenhoven, “Zeeman energy and spin relaxation in a one-electron quantum dot,” Phys. Rev. Lett. 91, 196802 (2003).
- Zumbühl et al. (2004) D. M. Zumbühl, C. M. Marcus, M. P. Hanson, and A. C. Gossard, “Cotunneling spectroscopy in few-electron quantum dots,” Phys. Rev. Lett. 93, 256801 (2004).
- Szafran et al. (2004) B. Szafran, F. M. Peeters, S. Bednarek, and J. Adamowski, “In-plane magnetic-field-induced wigner crystallization in a two-electron quantum dot,” Phys. Rev. B 70, 235335 (2004).
- Landau and Lifshitz (1980) L.D. Landau and E.M. Lifshitz, “Chapter v - the fermi and bose distributions,” in Statistical Physics (Third Edition) (Butterworth-Heinemann, Oxford, 1980) 3rd ed., pp. 158 – 190.