Discovery of a dark, massive, ALMA-only galaxy at in a tiny 3-millimeter survey
Abstract
We report the serendipitous detection of two 3 mm continuum sources found in deep ALMA Band 3 observations to study intermediate redshift galaxies in the COSMOS field. One is near a foreground galaxy at 13, but is a previously unknown dust-obscured star-forming galaxy (DSFG) at probable , illustrating the risk of misidentifying shorter wavelength counterparts. The optical-to-mm spectral energy distribution (SED) favors a grey attenuation curve and results in significantly larger stellar mass and SFR compared to a Calzetti starburst law, suggesting caution when relating progenitors and descendants based on these quantities. The other source is missing from all previous optical/near-infrared/sub-mm/radio catalogs (“ALMA-only”), and remains undetected even in stacked ultradeep optical ( AB) and near-infrared ( AB) images. Using the ALMA position as a prior reveals faint measurements in stacked IRAC 3.6+4.5, ultradeep SCUBA2 850m, and VLA 3GHz, indicating the source is real. The SED is robustly reproduced by a massive M⊙ and M⊙, highly obscured , star forming M⊙yr-1 galaxy at redshift 1.1. The ultrasmall 8 arcmin2 survey area implies a large yet uncertain contribution to the cosmic star formation rate density CSFRD(z=5) M⊙ yr-1 Mpc-3, comparable to all ultraviolet-selected galaxies combined. These results indicate the existence of a prominent population of DSFGs at , below the typical detection limit of bright galaxies found in single-dish sub-mm surveys, but with larger space densities Mpc-3, higher duty cycles , contributing more to the CSFRD, and potentially dominating the high-mass galaxy stellar mass function.
1 Introduction
In past decades, single dish sub-millimeter surveys have identified populations of massive, dusty star-forming galaxies at (e.g. Casey et al., 2014). While these galaxies are rare even at Cosmic Noon () when the star-formation activity in the Universe peaks, their contribution to the cosmic star-formation rate density (CSFRD) equals that of all optical and near-infrared selected galaxies combined (Madau & Dickinson, 2014). However, at the situation is much less certain. A tail of sub-millimeter selected galaxies have been confirmed beyond , but they trace only the very tip of the star-formation rate (SFR) distribution at early times (e.g. Cooray et al., 2014; Strandet et al., 2017; Marrone et al., 2018). The total contribution of dust-obscured star-formation, and therefore the census of star-formation in the early Universe, is unknown. Despite the strongly negative k-correction allowing sources to be found to , the overwhelming majority of (sub)-mm selected galaxies continue to be confirmed at with Atacama Large Millimeter/submillimeter Array (ALMA) spectroscopy (Danielson et al., 2017; Brisbin et al., 2017). While some dusty galaxies have been discovered beyond through gravitational lensing (Spilker et al., 2016; Zavala et al., 2018b), the lensing correction and selection effects make it challenging to establish their contribution to the CSFRD. Progress is hampered by the limited sensitivity and low spatial resolution of single-dish sub-mm observations and the difficulty of associating detections with counterparts in the optical-NIR. Ultradeep SCUBA surveys over moderate arcmin2 are now pushing into the range of “normal” star formation rates (several 100 M⊙/yr, main sequence galaxies) (e.g., Koprowski et al., 2016; Cowie et al., 2017, 2018) and extending to , but the analysis is often limited by the ability to identify counterparts at other wavelengths and derive accurate redshifts.
ALMA has opened an avenue to address this issue through surveys at superior sensitivity and spatial resolution. ALMA deep fields at 1 mm (Dunlop et al., 2017; Aravena et al., 2016) have probed to extremely deep flux limits over small areas ( arcmin2). Progress has still been limited likely because dust obscured star formation preferentially occurs in massive galaxies (Whitaker et al., 2017), which are clustered and relatively rare (0.1 arcmin-2 at 10.8 and ; Davidzon et al. 2017). Wider (10’s arcmin2) and shallower (100-200Jy) ALMA surveys at 1mm (Hatsukade et al., 2018; Franco et al., 2018) are now approaching large enough areas to identify tentative massive candidates at (e.g. Yamaguchi et al., 2019).
A promising development is to select at longer wavelengths ( mm), which optimizes the selection to dusty star formation at redshift (Béthermin et al., 2015; Casey et al., 2018). However, the current state-of-the-art ALMA Spectroscopic Survey (ASPECS) at 3-mm (González-López et al., 2019), still only covered arcmin2, and identified 6 continuum sources, all at . Larger archival studies of ALMA 3 mm observations to find high-redshift candidates report some spectroscopic confirmations, but like the 1-mm redshift distribution, the majority lie at (Zavala et al., 2018a). Recent advances with IRAM/GISMO provide evidence that mm surveys favor selecting higher-redshift sources (Magnelli et al., 2019), although counterpart identification continues to be problematic due to large beam sizes. Overall, the number of strong candidates for dust-obscured sources at remains small and as a result, the contribution of dust-obscured star formation in the early universe is poorly constrained.
Here we report the serendipitous discovery of 2 previously unknown sources in deep ALMA 3-mm observations in the COSMOS field, and assess the implications for dust obscured star formation at . We assume a CDM cosmology with H0=70 km s-1 Mpc-1, = 0.3, = 0.7, and a Kroupa (2001) initial mass function (IMF).
2 Methods
2.1 ALMA millimeter interferometry
The ALMA observations are part of a program targeting CO(2-1) line emission in galaxies (2018.1.01739.S, PI: Williams; 2015.1.00853.S, PI: Bezanson) in the COSMOS field. The data presented here include ALMA maps of five galaxies, and results on these targets are presented elsewhere (Bezanson et al. 2019, Williams et al. in prep). In one of these pointings we identified two serendipitous continuum sources, unrelated to the original target, which we will describe now in detail.
ALMA Band 3 observations were carried out in two observing blocks on 2018 December 23 and 24 under program 2018.1.01739.S (PI: Williams). One 1.875 GHz spectral window was centered at the sky frequency (94.92 GHz) with 7.8 MHz (24 km s-1) channelization. Three additional 1.875 GHz bandwidth spectral windows were placed at sky frequencies 96.8, 106.9, and 108.8 GHz for continuum observations, each with 15.6 MHz channelization. A total of 43 antennas were active reaching maximum baselines of 500m, for an angular resolution of 2 arcsec (synthesized beam major axis = 2.2”, minor axis = 1.7” under natural weighting). The total time on-source was 97 min.
The data were reduced using the standard ALMA Cycle 6 pipeline, and no problems with the pipeline calibration were found. The imaged data reach a continuum sensitivity of 5.7Jy/beam at 101.9 GHz, and a typical line sensitivity of 55-65Jy/beam per 100 km s-1 channel. We imaged the data using natural weighting, creating a 101 GHz continuum image of the field from all four spectral windows. We imaged the data using 0.2” pixels and created a 500500 pixel image, yielding images 100” on a side. Given the ALMA primary beam at this frequency (57” FWHM), these images extend to approximately the 0.05 response point of the primary beam.
2.2 ALMA source detection
Interferometric maps without correction for the primary beam response have uniform, normally-distributed noise properties across the field, and source detection significance is straightforward to measure from such maps. Two blind 3 mm continuum sources were apparent in this map, located 24.6” and 38.2” from the phase center, corresponding to primary beam response levels of 0.57 and 0.29, respectively. Each source is detected at a peak signal-to-noise ratio of ; the probability of finding a Gaussian noise fluctuation of this magnitude given the number of independent beams in the images is exceedingly low (). Both sources thus are real. The 3 mm flux densities of these sources, corrected for the primary beam response, are 155 20 Jy and 75 10, hereafter referred to as -1 and -2, respectively. Neither source is spatially resolved, based on a comparison of the peak pixel values and the integrated flux densities.
After finding both continuum sources in the combined map, we re-imaged the upper and lower sidebands of the data separately in order to determine the spectral index of each source at these frequencies. Thermal dust emission on the Rayleigh-Jeans tail has a very steep power-law index with and , while non-thermal synchrotron emission typically exhibits a negative spectral index, . Given their respective frequencies, we expect dust emission to be % brighter in the upper sideband than the lower. We find spectral indices for both continuum sources in excellent agreement with the expectation for thermal dust emission.
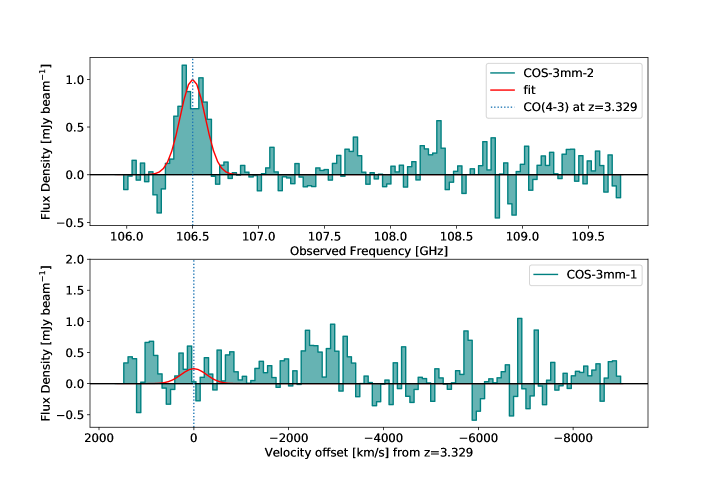
We also re-imaged the data of both sidebands to search for blindly-detected emission lines in each of the two continuum sources, using channel widths ranging from 100-400 km s-1. -2 contains a serendipitous emission line centered at 106.5 GHz, with an integrated flux density of 0.66 0.1 Jy km s-1. The spectrum is shown in Figure 2. A Gaussian fit indicates in a width of km/s. Assuming the line is a transition of carbon monoxide, the possible redshifts are [0.08, 1.16, 2.25, 3.33, 4.41, 5.49]. We find no significant emission lines in the spectrum of -1, and no evidence for a line at the same frequency of -2. A Gaussian fit restricted to the same frequency and width results in an integrated flux density of Jy km s-1, indicating no evidence for a line at that location.
Both -1 and -2 were also contained within the field-of-view of an additional ALMA Band 3 program, 2015.1.00861.S. Both sources were again far out in the primary beam of these data, at approximately the 0.25 and 0.1 response points, respectively. These data are described in more detail in Silverman et al. (2018), and have non-overlapping frequency coverage with our own data. We downloaded and imaged these data following the same procedure as for our own data. The new images reach a continuum sensitivity at phase center of 10Jy/beam at 93.5GHz and a line sensitivity of 120-170Jy/beam per 100 km s-1 channel, approximately a factor of two higher than in our data. Neither source is detected in continuum in these data, and were not expected to be detected given the sensitivity, effective frequency, and position of our sources within the ALMA primary beam. We additionally searched these data for blindly-detected CO lines as in our own data, but found no significant emission lines. The limited (primary beam-corrected) sensitivity of these data preclude us from drawing strong conclusions about the redshifts of either source.
For convenience, we define an equivalent survey area as the total area across all five ALMA maps at which a source with the same as -1 would be detected at . Taking into account the small variations in the central frequency of each map (tuned to the specific redshift of the target 1.5 galaxies), which change the primary beam response shape and the detection threshold (25-31Jy) due to the steep spectral index of dust emission, we derive a total survey area of 8.0 arcmin2 to 155Jy ( limit).
2.3 Multi-wavelength photometry
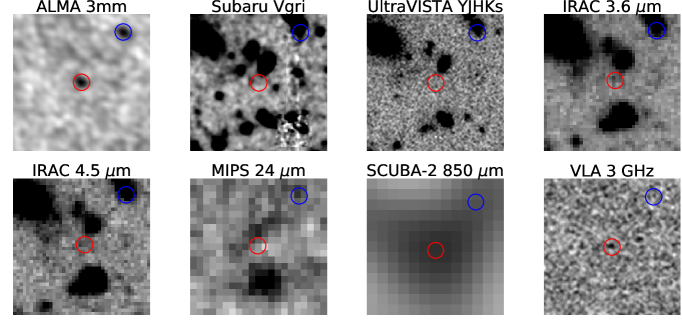
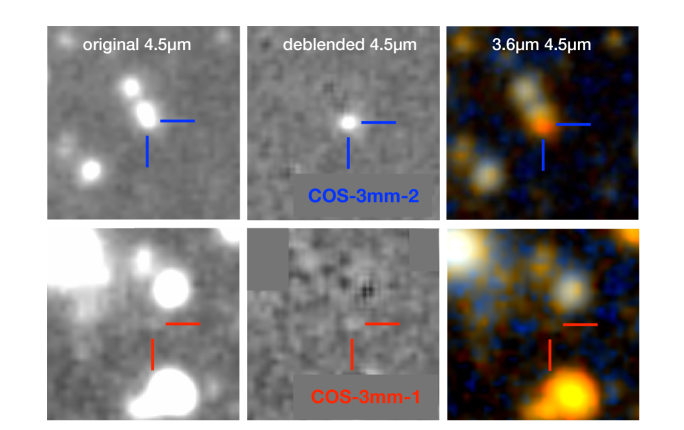
-1 has extremely deep coverage at all optical-to-sub-mm wavelengths, yet it has no counterpart within a radius of 3.3 arcseconds in the deepest published multiwavelength catalogs in COSMOS to date, from m (Laigle et al., 2016; Muzzin et al., 2013; Aretxaga et al., 2011; Geach et al., 2017; Hurley et al., 2017; Le Floc’h et al., 2009) or GHz (Schinnerer et al., 2010; Smolčić et al., 2017). The astrometry of multi-wavelength catalogs in COSMOS are excellent owing to the registration between VLA observations (e.g. Schinnerer et al., 2007), ground-based optical and space-based facilities, with an astrometric accuracy of 5 milli-arcseconds (Koekemoer et al., 2007). Similar astrometric accuracy was found between ALMA and COSMOS multiwavelength datasets (Schreiber et al., 2017). There is no apparent flux at optical-to-Spitzer/IRAC wavelengths at the ALMA position (Figure 1). -2 is also missing from these catalogs, likely because it is blended with a bright neighboring galaxy to its north with photometric redshift 0.95 (see Figure 1), but appears detected in and IRAC. It is possible that the ALMA source is simply a highly obscured region in the low-redshift galaxy, which can be ruled out by spatially deblended SED analysis. We therefore proceeded to perform deblended photometry on both ALMA positions using the following data sets.
2.3.1 Optical, near-infrared, and Spitzer/IRAC
The optical data consists of the Subaru/Suprime-Cam , , , , and -imaging (Taniguchi et al., 2007), with limits of mag in apertures, and Subaru HyperSuprimeCam (HSC) , , , and (Aihara et al. 2018a, b) imaging ( mag, ). Ultradeep NIR coverage is provided by the 4th data release of the UltraVISTA survey (McCracken et al., 2012), thanks to mosaics in the , , and filters to mag (AB, ). Remarkably, the coverage in the band from DR4 is mag deeper than from DR3, allowing us to place strong constraints on the flux density of -1 at NIR wavelengths. Stacked images were constructed using the optical imaging micron and in the near-infrared imaging micron. We use Spitzer/IRAC m and m mosaics that combine data from the S-COSMOS (Sanders et al. 2007) and the Spitzer Large Area Survey with HSC (SPLASH, PI: Capak) programs ( mag, in apertures), and the m and m from the S-COSMOS program ( mag, in apertures).
We measured flux densities for -1 in the optical and UltraVISTA bands in -diameter apertures after subtracting the neighbors using mophongo (Labbé et al. 2013, 2015). This procedure carefully models the light profiles of the sources using a higher resolution image as a prior, minimizing potential contamination by bright nearby objects (see Figure 3). In our analysis we adopted the HSC -band image as prior for -1 as it provides the best compromise between depth and resolution and the F814W-band image for -2, given the nearby bright neighbor at distance. Because of the broader PSF, we adopted apertures for our estimates in the IRAC bands. Total flux densities were then estimated from the spatial profile and the relevant PSF-correction kernel.
2.3.2 Far-infrared to submillimeter
Far-infrared and sub-millimeter Herschel fluxes were measured for both galaxies by simultaneously fitting Gaussian profiles at fixed prior locations in the Herschel images specified by the ALMA locations and augmented by the MIPS positions of all neighboring objects from the S-COSMOS data (Sanders et al., 2007; Le Floc’h et al., 2009). The FWHM of the Gaussians were 7.7, 12” (PACS 100, 160m) and 18, 25 and 37” (SPIRE 250, 350, 500m), respectively. Uncertainties were computed by fitting gaussians at random locations within a 2 arcmin radius and computing the rms. Flux calibration was performed by comparing to the 24m prior catalog of Herschel DR4 (Oliver et al., 2012; Hurley et al., 2017). Comparison of the measured SPIRE fluxes with those published showed a scatter of 30%; this was added in quadrature to the flux uncertainties for those bands. The correction is minor considering the signal to noise ratio of of the SPIRE fluxes. For SPIRE 500m only, the flux of a neighboring galaxy 5” to the south was subtracted separately prior to deblending, using its predicted IR emission based on the infrared SED of Wuyts et al. (2011) and its SFR24,IR=65 M⊙/yr.
The procedure for measuring photometry at 850m follows that of Herschel/PACS and SPIRE (250 and 350m) using the ALMA and MIPS positions as priors. The sources lie in a region of shallower (3 mJy/beam) coverage in the inhomogenous SCUBA-2 Cosmology Legacy Survey (S2CLS; Geach et al., 2017) and are undetected in this map. We therefore use the state-of-the-art S2COSMOS observations (Simpson priv. comm.), which achieved a mJy over the entire field (Simpson et al. in prep).
2.3.3 Radio VLA 3Ghz and 1.4 Ghz
Neither source has a counterpart in either the VLA 3 GHz 5 source catalog (Smolčić et al., 2017) or the 1.4 GHz deep survey 5 source catalog (Schinnerer et al., 2010). Photometry on the 3GHz map using the ALMA position as prior reveals 9.982.39 Jy/beam (4) point source for -1, below the detection limit of the Smolčić et al. (2017) catalog. Blindly detected sources at this flux density have a high probability (50%) of being spurious (Smolčić et al., 2017), therefore requiring the ALMA prior in order to be considered real. -2 shows no significant flux to 3 limits of Jy/beam. Within 10 arcmin2, the 1.4 GHz map has rms 17 Jy/beam and no significant flux () is detected from either galaxy.
2.4 Spectral Energy Distribution Modeling
The deep photometry from m places strong constraints on the SEDs and allows us to model their stellar populations and redshift. It should be noted that even if a source is not formally detected () at most wavelengths, absence of flux can still provide useful constraints, in particular on the redshift. All fitting is performed in linear fluxes and uncertainties and no upper limits are enforced on measurements with low SNR.
We use the Bayesian Analysis of Galaxies for Physical Inference and Parameter EStimation (bagpipes) code (Carnall et al., 2018), which assumes the stellar population synthesis models of Bruzual & Charlot (2003) and implements nebular emission lines following the methodology of (Byler et al., 2017) using the cloudy photoionization code (Ferland et al., 2017). We select the flexible dust absorption model of Charlot & Fall (2000), with the exponent of the effective absorption as a free parameter and adopt the Draine & Li (2007) dust emission model under the assumption of energy balance, such that dust-absorbed light is re-radiated in the far-infrared. All stellar populations have this effective absorption, while the youngest stars (defined as those with age Myr) have an extra factor of attenuation applied () to account for dusty birthclouds.
The dust emission model is parameterized using the starlight intensity incident on the dust (translating into a distribution of dust temperatures), the amount of PAH emission, and the fraction of dust at the coldest temperature. We further assume a delayed exponential star-formation history with and age left free and metallicities ranging from . For each parameter, uniform, diffuse priors are assumed (see Table 1). In general, we do not expect to constrain most free parameters, but we will marginalize over those and limit the discussion to the more important parameters including redshift, stellar mass, and SFR. Where relevant, we will also quote results based on assumptions often used in the literature, such as assuming a fixed Calzetti et al. (2000) dust attenuation model.
3 Results
The photometry for both galaxies is presented in the Appendix (Table 2).
3.1 -1
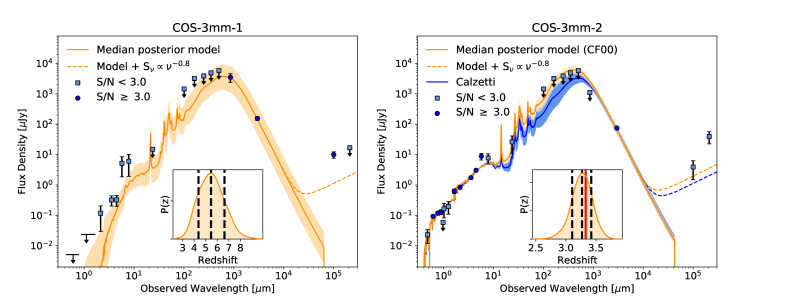
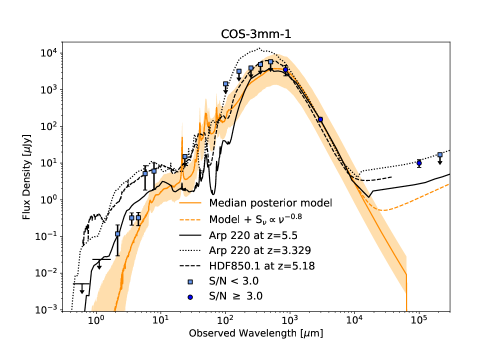
-1 is undetected () in any individual optical (AB), near-infrared (), and Spitzer/IRAC () bands, and remains undetected in the stacked ultradeep optical ( AB) and near-IR ( AB) data ( limits). The source is faintly detected (25.2 AB ) in deep stacked IRAC 3.6+4.5 observations, indicating the source is likely real with extremely red colors. Owing to the shallower depth, the source is undetected in deep Spitzer/MIPS 24 micron and Herschel PACS+SPIRE micron. The flux measured with SCUBA is =3.51.1 mJy (). This flux density is fainter than the depth typically achieved by deep single dish sub-mm surveys (3.5-5 mJy; e.g. Weiß et al., 2009; Aretxaga et al., 2011; Geach et al., 2017; Cowie et al., 2017) at robust detection thresholds (). The observed SED is shown in Figure 4 (left panel). For clarity, photometry with S/N 1 are indicated with arrows at the 1 rms level, and S/N 1 with 1 errorbars. The deep non-detections at all wavelengths between m and the extreme flux ratios (, , , , see e.g., Cowie et al. 2018; Yamaguchi et al. 2019), demand that dust peak is highly redshifted .
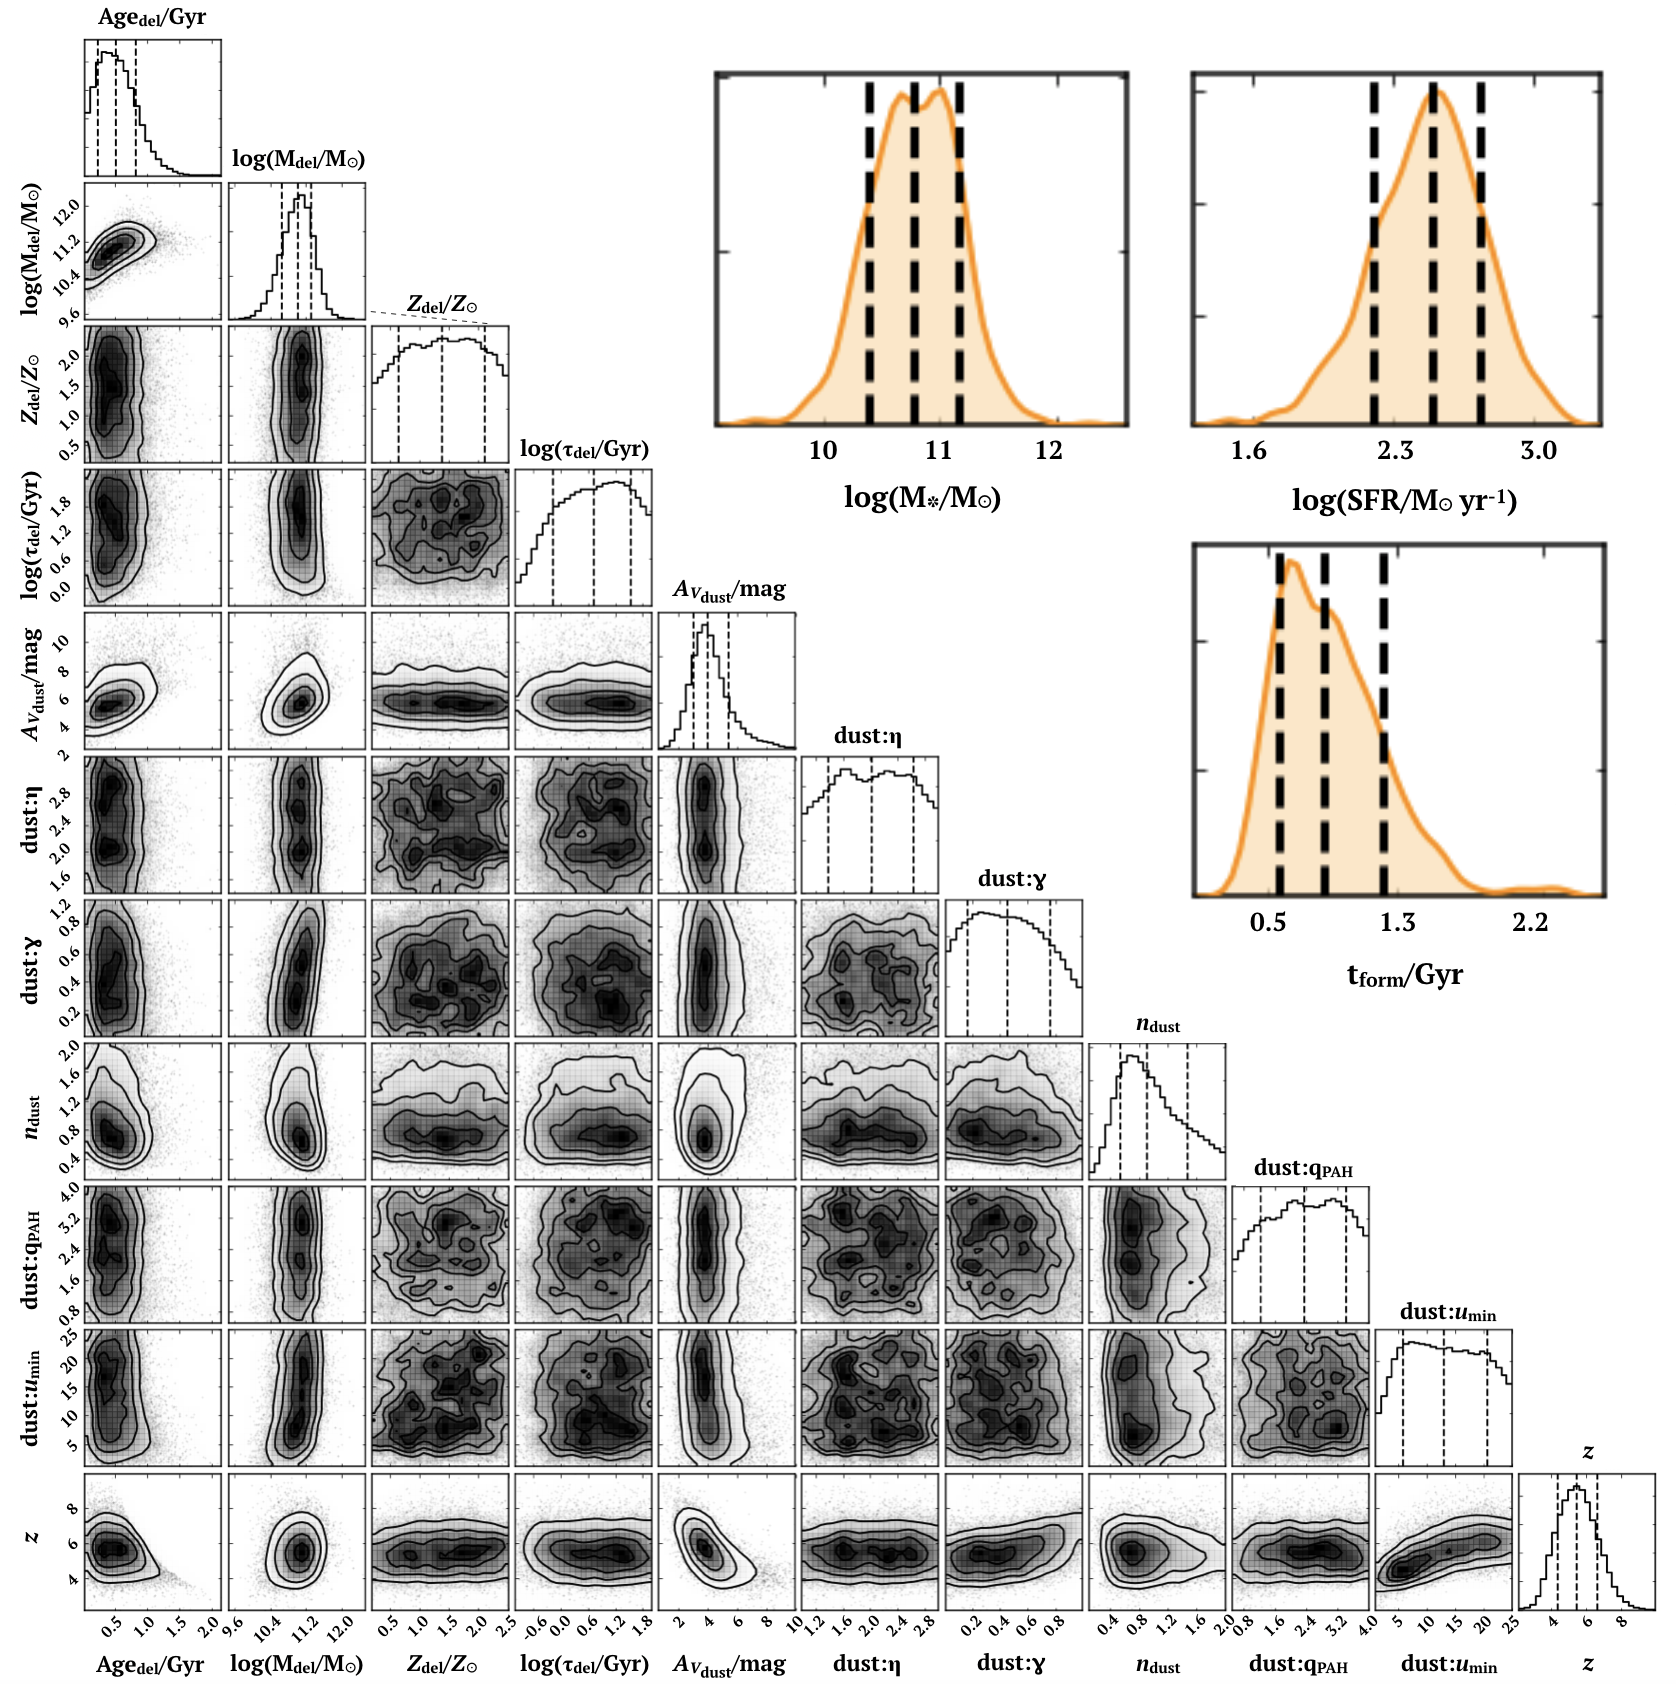
Fitting stellar population models, we find the observations are well reproduced by a massive M⊙, star forming M⊙/yr, highly obscured galaxy at very high redshift . The SED fitting results are shown in Figure 4 and the posterior values and priors are listed in Table 1. The posterior distributions of all parameters are presented in Figure 7. Adopting a classical Calzetti dust law would increase the stellar mass, SFR, and redshift by 60%, 10%, and 5% respectively. These changes are within the uncertainties, so we elect to adopt our more conservative values measured assuming Charlot & Fall (2000) as fiducial. We also experimented with fitting only the mid-infrared to sub-millimeter SED, finding the same results. In all cases, the solutions require the galaxy to be at high redshift, with at 90% confidence and a total infrared luminosity (based on integrating the median posterior spectrum). Adopting an SED typical for the most obscured SMGs (da Cunha et al., 2015) produces similar redshift and LIR, as does adopting the Arp 220 SED. Converting to SFR using the (Kennicutt & Evans, 2012) conversion, which does not implicitly assume a SFH, results in a larger estimated SFRM⊙/yr, but consistent within the 1 uncertainties from SED fitting.
| Parameter | -1a | -2 | -2 | Range (uniform prior) |
|---|---|---|---|---|
| Attenuation Curve | CF00 | CF00 | Calzetti | |
| Coordinates | 10:02:36.82 +02:08:40.60 | 10:02:36.30 +2:08:49.55 | ||
| Redshift | 5.5 | zCO=3.329 | zCO=3.329 | (0.0, 10.0) |
| SFR [M⊙ yr-1] | 309 | 247 | 112 | |
| Log10 Stellar Mass [M⊙] | 10.8 | 11.1 | 10.2 | (6.0, 14.0) |
| Mass-weighted age [Gyr] | 0.2 | 0.5 | 0.1 | |
| AV | 4.0 | 2.7 | 1.4 | (0.0, 10.0) |
| 2.0 | 2.1 | 2.5 | (1, 3.0) | |
| Umind | 13.0 | 7.6 | 4.8 | (1, 25.0) |
| gammae | 0.5 | 0.5 | 0.5 | (0.01, 0.99) |
| nf | 0.9 | 0.4 | - | (0.1, 2.0) |
| qpahg | 2.3 | 3.3 | 3.0 | (0.5, 4.0) |
| Log10 LIRh [L⊙] | 12.6 | 12.4 | 12.1 | |
| Gas mass [M⊙] | 0.5-1.5 |
Calculating redshift using the radio-to-submm spectral index method (using 850m and the upper limit on 1.4GHz) implies a lower limit to the photometric redshift of 4.7 (e.g. Carilli & Yun, 1999). We note that this is very similar to the massive dusty galaxy HDF850.1 which had a redshift 4.1 according to this relation (Dunlop et al., 2004), and was later spectroscopically confirmed at z=5.2 (Walter et al., 2012). The SED of -1 is very similar to that of HDF850.1; scaling its best-fit SED to the 850m and 3-mm fluxes of -1 predicts its observed 3 GHz radio flux of 10m (Figure 5).
The observed 3 GHz radio flux () is in excess of that expected from empirical SED templates for obscured star-forming galaxies (e.g. SMGs; da Cunha et al., 2015) and recent calibrations of the redshift-dependent ratio of total infrared luminosity to rest-frame 1.4 GHz luminosity density (Delhaize et al., 2017; Tisanić et al., 2019). For typical assumptions of the radio spectral slope (dashed line in Figure 4), the radio emission of -1 is a factor of higher than expectations for star-formation, in excess of the commonly adopted 3 threshold for AGN activity (Daddi et al., 2009). No evidence for redshift evolution in the spectral slope, or dependence on sSFR or distance from the main sequence has been reported (Magnelli et al., 2015).
The radio excess therefore indicates plausible evidence for presence of an AGN. We note that no X-ray counterpart exists within 5” (Civano et al., 2016), although this is not surprising given the high-redshift of -1. Given the possible presence of an AGN, it is worth noting that inferred parameters from SED fitting could be biased by AGN emission, in particular in the mid-infrared (e.g. Leja et al., 2018). Therefore, we investigate any possible contamination using the empirical AGN-dominated template published by (Kirkpatrick et al., 2015). We use their mid-infrared template based on galaxies with the largest mid-infrared luminosity contribution from AGN emission scaled to the 24m flux of -1 and subtract the predicted AGN contribution from the observed SED. This represents the maximum AGN contribution that could be accommodated by the data without violating the observed photometry. We then re-measure the SED fitted parameters. Subtracting this empirical AGN template reduces the SFR by 15%, well within the uncertainty, but does not change the inferred stellar mass significantly. We conclude that any AGN contribution does not significantly impact our SED-fitting results.
Finally, the 3-mm flux density enables an estimate of the molecular gas mass for -1 following the calibration of sub-mm flux to gas mass (Scoville et al., 2016). Exploring the range of the photometric redshift PDF, and typical assumptions about the dust emissivity, temperature, and dust-to-gas ratio, we find that -1 likely has M M⊙. This is independent evidence that the galaxy is massive, with a high inferred gas fraction (60%).
3.2 -2
-2 is optically faint, but detected in and relatively bright in IRAC mag, with red optical-to-IRAC colors. There is an apparent break between the and -band, consistent with a Balmer/4000Å break at . The source is undetected at micron, but with less extreme flux ratios (, ) compared to -1, indicating a lower redshift.
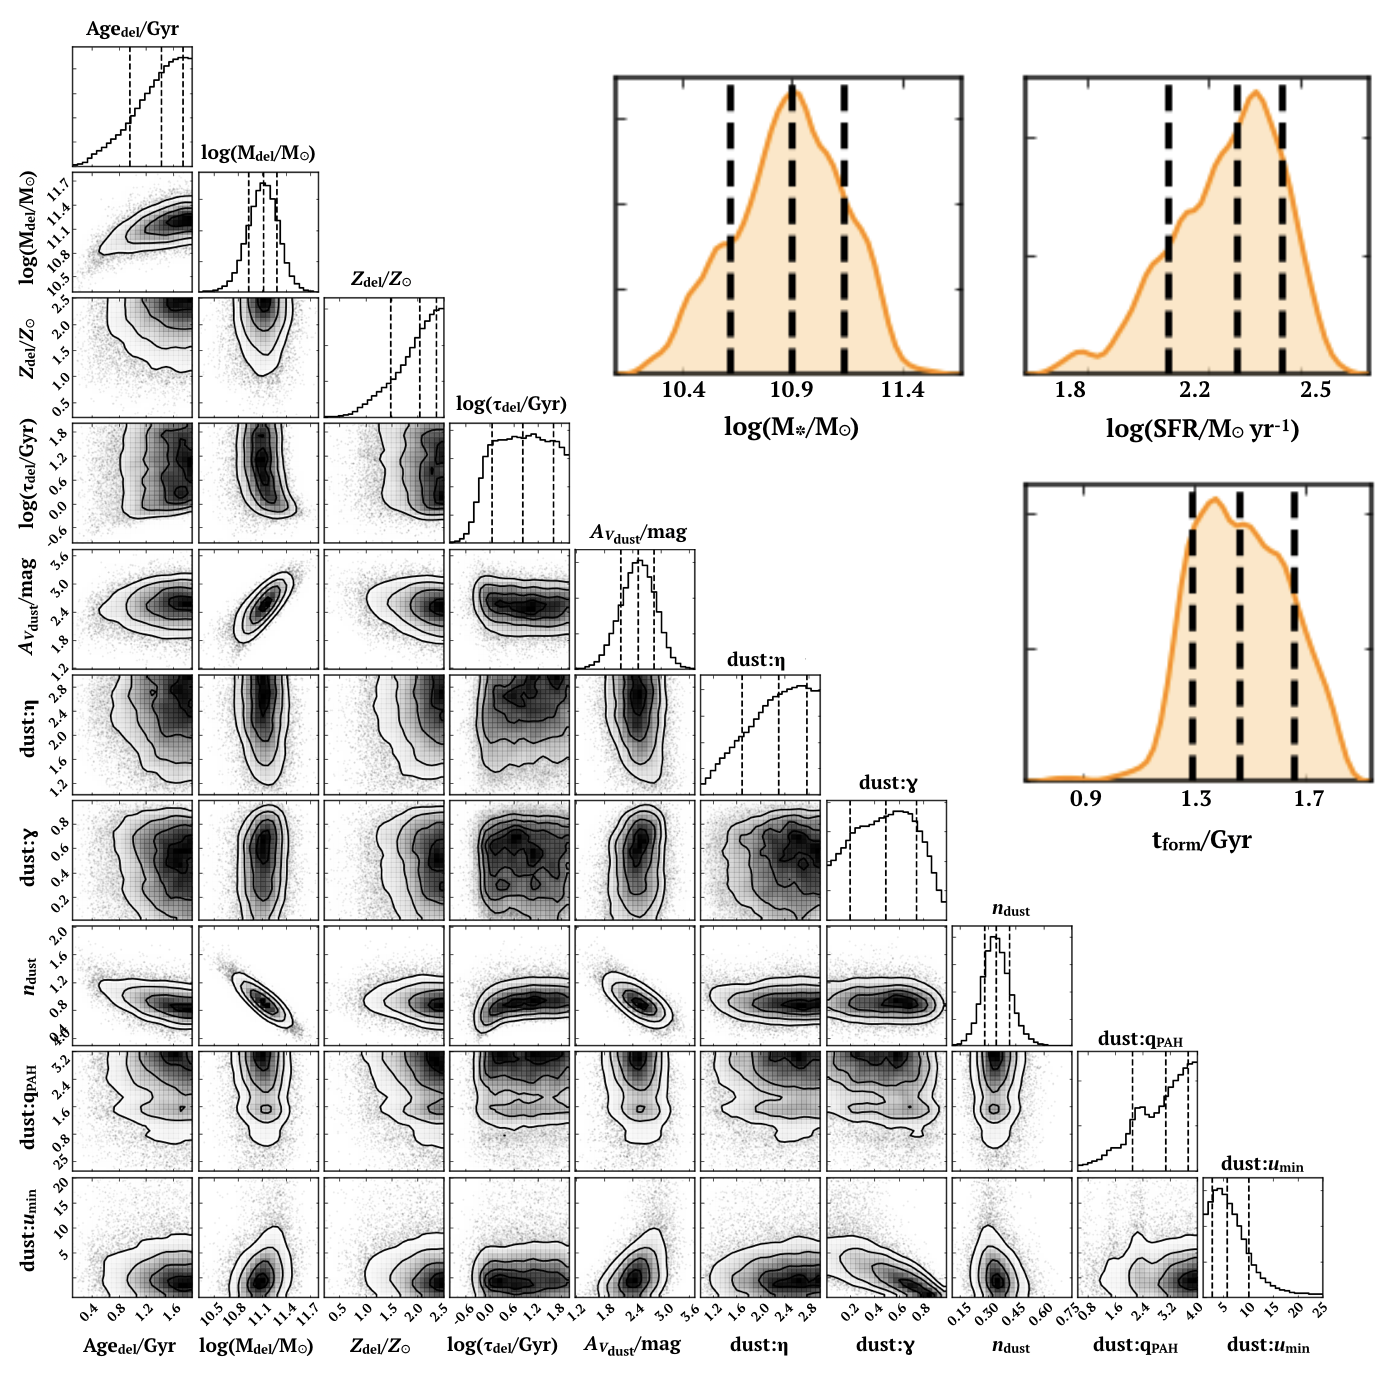
We follow the same procedure as before to fit the SED, finding a well-constrained photometric redshift of (99% probability between ), ruling out that this source is simply a highly obscured region in the nearby foreground galaxy to the north. Considering the CO emission line detection (consistent with redshifts 2.25, 3.33, and 4.41), we determine the line is likely CO() at , in agreement with the best-fit photometric redshift. Fixing the redshift to the spectroscopic redshift, the observations are best reproduced with a massive M⊙, star forming M⊙/yr, highly obscured galaxy. Using the Kennicutt (1998); Kennicutt & Evans (2012) conversion from LIR to SFR yields M⊙ yr-1. The derived gas mass using the CO(4-3) line flux (assuming the average CO excitation from Bothwell et al. 2013) is in the range M⊙, given the factor of four scatter in measured excitation for high-redshift dust obscured galaxies (e.g. Figure 1 in Narayanan & Krumholz, 2014). The 3 mm derived gas mass is M⊙. Both estimates indicate gas fractions in the range %. The SED properties for -2 are listed in Table 1, the SED fit is shown in Figure 4, and posterior distributions for the parameters are presented in Figure 8.
The best-fit power law index for the Charlot & Fall (2000) dust model is , flatter than the appropriate for typical nearby starburst galaxies. The flat spectral index means that the attenuation curve is “greyer” than a Calzetti attenuation law (e.g. Chevallard et al., 2013) resulting in larger attenuation for the same amount of reddening . The assumed attenuation model can have a large impact on the derived stellar mass. If instead of a flexible attenuation model a classical Calzetti starburst law is assumed then the fits result in a factor lower stellar mass ( M⊙) and factor lower SFR (same answer if the infrared-to-mm constraints are also removed). The large difference in stellar mass is remarkable. The reason is that the steeper reddening curve of Calzetti reproduces the data with an intrinsically blue, young, low M/L ratio stellar population, driving the lower masses. The Charlot & Fall (2000) model requires an older, redder, higher M/L population, while also implying larger attenuation at all wavelengths, including the near-infrared. We note that these results all assume energy balance and a parametric delayed SFH. We explore the dependence on SFH by also fitting the SED with prospector (Leja et al., 2017), which is capable of fitting a non-parametric SFH in logarithmic bins of age (Leja et al., 2019). These fits produce qualitatively similar results, with Calzetti yielding lower SFR and stellar mass.
An independent estimate of mass can be derived by estimating the dynamical mass from the 630 km/s width of the CO emission line at 106.5 GHz (Figure 2). Following the procedure used by Wang et al. (2013), we compute and , where we note that inclination angle and disk diameter D (in kpc) are unknown. Adopting the mean size kpc expected for massive 1011M⊙ star forming galaxies at (van der Wel et al., 2014), we find MM⊙. Assuming a disk geometry with an inclination angle of would imply MM⊙. Overall, the high dynamical mass appears to agree better with the high stellar mass inferred from (Charlot & Fall, 2000) dust model with flat than with the Calzetti-based stellar mass, but the large uncertainties in dynamical and stellar mass prevents firmer conclusions.
3.3 Redshifts
Given the close separation on the sky of the two ALMA sources we consider the possibility that they are at the same redshift. The redshift of -2 () is strongly disfavored for -1 (1% probability ). Alternatively, our identification of for -2 is erroneous and the galaxy is at , more consistent with -1. This is unlikely based on the SED fit of -2, which is well constrained by the presence of both a Lyman Break and Balmer break. We find no significant emission line () in the spectrum of -1 which suggests it is unlikely at and . A Gaussian fit to the spectrum of -1 at fixed GHz indicates , providing no evidence for -1 and -2 occupying the same dark matter halo (DMH). Additionally, we scan the nearby velocity space in case both galaxies are in a large scale structure filament, but we find no emission line within km/s. Finally, we consider the odds of finding two 3-mm sources within on the sky. Using the 3-mm number counts of Zavala et al. (2018a), we simulate uniformly random distributions of two sources which indicates an % chance of finding a Jy source within of a Jy source. These odds are low, but not negligible. Overall, there is no conclusive evidence that the two sources are at the same redshift. We therefore proceed and take the for -1 at face value.
4 Discussion
4.1 Implications from full optical-to-mm spectrum SED fitting
We consider the SED fitting analysis using a stellar population model with self-consistent dust absorption and emission under the assumption of energy balance and constrained by high quality optical-to-millimeter observations. In the case of the source -1, which lacks strong detections at any wavelength other than 3 mm, it is remarkable that the Bayesian posterior probability distributions for key parameters such as redshift, stellar mass, dust attenuation and star-formation rate are as constrained as they are (see Table 1 and Figure 7). Closer inspection indicates that the results are mostly driven by the combination of the high SNR ALMA measurement with deep photometric limits in the short wavelength infrared (Spitzer/MIPS and Herschel/PACS m), which demand that the dust emission peak is highly redshifted () and the SFR is high. It is likely that the uncertainties on the stellar mass and other stellar population parameters are underestimated, because of the tight prior imposed by the parametric SFH (Carnall et al., 2019; Leja et al., 2019). We note that our choice of a rising SFH produces a relatively conservative (lower) estimate of stellar mass compared to constant or declining SFH.
There is accumulating evidence that the attenuation law in very dusty galaxies can be flatter than Calzetti (Salmon et al., 2016; Leja et al., 2017; Salim et al., 2018), possibly caused by a more uniformly mixed geometry of both old and young stars with dust (Narayanan et al., 2018). The flat inferred attenuation law for -2 is not surprising in that regard. It is notable and sobering however that modeling the optical-to-millimeter with a classical Calzetti starburst law instead (keeping everything else the same) results in significantly lower SFR and stellar mass (), in apparent tension with the high dynamical mass (M⊙). Detailed analyses of ULIRGs at with photometric constraints on far-infrared dust emission (e.g. Lo Faro et al., 2017) also found that stellar masses inferred using a Calzetti law are systematically lower because of the smaller amount of reddening at near-infrared wavelengths. Clearly, caution should be exercised when applying a single locally-calibrated attenuation law at high redshift. Overall, the results highlight the need for deep (sub-)mm measurements to determine bolometric luminosities and provide high-redshift empirical constraints on the dust law/energy balance (e.g. Hodge et al., 2016).
For the remainder of the paper we emphasize discussing the implications of the ALMA-only source -1, which likely represents a population that is absent from all current optical-IRAC selected galaxy studies, is below the nominal detection threshold of deep single-dish sub-mm surveys, and therefore deserves more scrutiny.
4.2 Number counts
A recent unbiased ALMA 3 mm archival search for continuum sources over 130 independent pointings (Zavala et al., 2018a) enabled the first 3 mm number counts. For archival searches, however, detection limits and effective search area are necessarily very inhomogeneous due to the strong variation of the ALMA primary beam response, complicating a straightforward comparison of results. Restricting the comparison to -1, we use their best-fit powerlaw to the cumulative number counts, which considers effective selection area and incompleteness, predicting one source brighter than SJy per arcmin2. This is consistent with our finding one source in our effective survey area of 8 arcmin2 (see 2.2).
We note that given the estimated stellar mass of M⊙ at z=5.5, we expect -1 to occupy a massive DMH (M⊙) and to be strongly clustered. While our results are dominated by Poissonian uncertainties, this may imply that the uncertainties in published number counts are underestimates. Clustering may affect source counts from studies over very small areas such as the ASPECS 4.6 arcmin2 survey in the HUDF (González-López et al., 2019), and even the counts in the multiple pointings of Zavala et al. (2018a), as these observations were generally targeting moderately-sized deep fields (COSMOS, CDFS, UDS). Clustering effects may be exacerbated by the fact that dust obscuration preferentially occurs in massive galaxies (Whitaker et al., 2017). We note that our results are unlikely to be biased by the original primary targets, which were all at low redshift (). Clearly, larger blind surveys are needed to constrain number densities at the bright end.
4.3 Unbiased ALMA 3 mm selection of
high-redshift galaxies
Simulations of dust obscured galaxies in the early universe predict mm continuum selection optimizes the sensitivity to DSFGs at redshift (Casey et al., 2018). Current evidence is still mixed: continuum detected faint galaxies in the small ultradeep ALMA ASPECS field are at average (González-López et al., 2019), while limited ground-based spectroscopic evidence for sources found in wider-area archival data indicates (Zavala et al., 2018a). Note, however, that the luminosity of the sources and volume covered could impact the redshift selection function (Strandet et al., 2016; Brisbin et al., 2017), and follow up ground-based spectroscopy in the optical and near-IR is possibly biased against highly obscured sources at , due to the faintness of Lyman-alpha, nebular optical lines and lack of wavelength coverage micron. Overall, the redshifts of the two continuum sources in this study, a probable (based on a single CO line and congruous ) and (), are consistent with 3 mm favoring higher redshifts than the typical for m-selected galaxies (Simpson et al., 2014).
A challenge in determining the selection function is the difficulty in identifying counterparts and determining redshifts. Neither of our two 3 mm sources had counterparts in previous deep optical-to-radio selected catalogs, raising some concern for analyses where this is a critical step (e.g., photometric redshifts or spectroscopic follow up in optical/NIR). This is particularly problematic for single-dish sub-mm observations, due to the large beam size, but here we find it challenging even with the high spatial resolution and accurate astrometry offered by ALMA. In the case of -2 the source is very close to a bright foreground galaxy (1.3” to the North), which was initially mistaken as the counterpart. The optical/NIR faintness and low resolution of the Spitzer/IRAC data caused it to be missing or blended in existing multiwavelength catalogs. In the case of -1 the combination of high redshift and high obscuration resulted in it being extremely faint and undetected at all optical-infrared wavelengths. It is therefore possible that the identification of the highest redshift galaxies in existing (sub-)mm selected samples is still incomplete. In addition, obtaining spectroscopic redshifts in the optical/NIR is unfeasible for the faintest sources. ALMA spectral scans targeting CO and [CII] are likely the only recourse until other facilities (e.g., JWST/NIRSpec, LMT Redshift Search Receiver) become available.
4.4 Comparison to other “dark” galaxies
The observed SED of -1 is different from that of other optical/near-IR/IRAC-faint populations. The ALESS survey identified 9 IRAC-faint SMGs to 1 magnitude brighter IRAC limits (Simpson et al., 2014), but these sources were much brighter in the far-infrared (peaking at micron to mJy), with a significantly bluer dust peak consistent with . Such an infrared SED is ruled out by our observations. -1 is fainter at all wavelengths than the so-called H/Kdropout galaxies (e.g. Wang et al., 2016; Schreiber et al., 2017; Caputi et al., 2012), which are generally selected on color, brighter in IRAC, and estimated to be at lower redshift .
More recently, SCUBA surveys have been carried out to unprecedented depth over CANDELS fields ( mJy detection limit; e.g., Koprowski et al., 2017; Cowie et al., 2017, 2018; Zavala et al., 2017, Simpson et al. in prep.). Such surveys are deep enough to discover mJy objects like -1 at . Indeed, the deepest SCUBA surveys have reported sub-mm selected objects that are likely at and that are either extremely faint at optical-IRAC and MIPS wavelengths (Cowie et al., 2018) or likely initially misidentified and determined to be at high redshift based on the long wavelength IR SED (e.g., Koprowski et al., 2016). With optical-IRAC magnitudes in the range AB, no MIPS detection, and only a marginal 3 Ghz radio detection, -1-like objects would have likely defied secure identification, and its probable redshift could have only been determined from the IR SED.
More similar are recently reported ALMA 1.2 mm selected sources from the ASAGAO survey (Yamaguchi et al., 2019) in GOODS-S. These sources also lack obvious counterparts at shorter wavelength, show extremely small and flux ratios (indicative of high redshift), but are generally fainter mJy than -1 (). Additional candidates that lack deep multi-wavelength ancillary data may exist outside legacy fields Wardlow et al. (2018).
4.5 Contribution to CSFRD
The fact that -1 was identified in a survey of such small area suggests that similar galaxies are common in the early Universe. Using the effective area of 8 arcmin2 as derived in §2.2, our finding implies a source density of arcmin-2, an order of magnitude higher than the rare sub-mm selected starbursts at ( arcmin-2; e.g. Danielson et al. 2017; Marrone et al. 2018). If our results are representative, galaxies like -1 could represent the “iceberg under the tip” of the known extreme dust-obscured star-forming galaxies in the early Universe.
To estimate the space densities and contribution to the CSFRD requires estimating a selection volume, which is difficult as we do not know the expected properties or true abundance of DSFGs at . Instead, we derive a simple estimate based on the derived properties of -1. Encouraged by the strong redshift constraints from the long wavelength photometry, we set the lower bound of the selection volume to the lower 10th percentile redshift probability (). The upper bound is chosen to be the redshift beyond which we expect only 0.1 halos of sufficient mass based on the cumulative halo mass function. Using the halo mass function calculator HMF published by Murray et al. (2013) and assuming the halo mass function of Behroozi et al. (2013b) and a high baryon conversion into stars and (converting M∗=M⊙ into a conservative Mhalo M⊙) we compute this upper bound to be .
Using this selection volume we determine a space density of Mpc-3. We find that the contribution to the CSFRD by -1 is M⊙ yr-1 Mpc-3 (converted to a Chabrier 2003 IMF for comparison with literature measurements). Assuming instead the cumulative space density of massive halos (1012) at using the Behroozi et al. (2013b) halo function, produces a very similar M⊙ yr-1 Mpc-3 for our derived SFR.
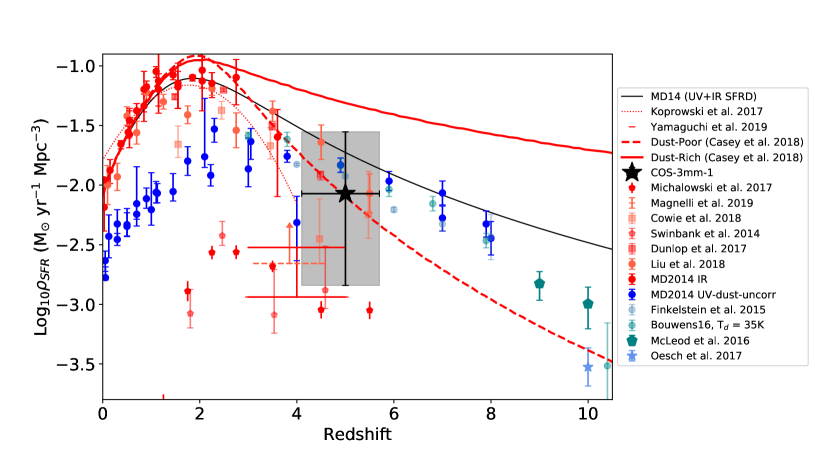
With only a single object, the Poissonian uncertainty is large and dominant (Gehrels, 1986). Cosmic variance is only on the order of 30% based on the calculator by Trenti & Stiavelli (2008), and is therefore not further included. No completeness corrections are applied, because the true distribution is unknown. Figure 6 shows comparisons to various results at from literature that report dust-uncorrected UV-derived SFR and the dust-obscured SFR (IR to millimeter derived).
The contribution of -1 is higher than inferred for the two near-infrared dark ALMA 1.2 mm sources in Yamaguchi et al. (2019), mostly owing to their smaller implied total infrared luminosities. This study does not report formal uncertainties or derive redshifts, which prohibits a more quantitative comparison. Bright SMGs beyond contribute M⊙ yr-1 Mpc-3 (Swinbank et al., 2014; Michałowski et al., 2017), about an order or magnitude lower than our best estimate. Results from fainter SMGs found in the deepest SCUBA surveys, with luminosities similar to -1 (e.g. Koprowski et al., 2017; Cowie et al., 2018) show a declining contribution at , consistent with our estimates.
Interestingly, if -1 is representative, a population with similar properties could contribute as much to the CSFRD as all known ultraviolet-selected galaxies at similar redshifts combined. This could even imply that dust-obscured star-formation continues to dominate the cosmic star-formation history beyond where current infrared-to-mm measurements are incomplete.
4.6 Contribution to Stellar mass density
The high stellar mass M⊙ and large space density Mpc-3 of -1 imply a considerable cosmic stellar mass density (CSMD) in similar objects at : M⊙Mpc-3, higher than reported for bright (S mJy) sub-mm galaxies ( M⊙Mpc-3; Michałowski et al., 2017). Comparing to the estimate of the CSMD based on HST-selected galaxies M⊙Mpc-3 (Song et al., 2016), suggests that they could contribute a significant fraction (%) to the total and perhaps even dominate the high-mass end. The high-mass end of the galaxy stellar mass function at high redshift is still uncertain and susceptible to biases. Current estimates for the number density of M⊙ galaxies at are Mpc-3dex-1 (Duncan et al., 2014; Grazian et al., 2015; Song et al., 2016; Davidzon et al., 2017; Stefanon et al., 2017), comparable to the space density derived for our ALMA-only galaxy -1. Given that optical-IRAC dark galaxies are missing from these previous studies, it is therefore possible that about half the stellar mass density in high-mass galaxies at remains unaccounted for.
4.7 Implications for the formation of massive galaxies
Bright sub-millimeter-selected galaxies at with SFR1000 M⊙yr-1 are often hypothesized as progenitors of massive quiescent galaxies (e.g. Toft et al., 2014; Spilker et al., 2018). More recently, massive quiescent galaxies have been spectroscopically confirmed at (Glazebrook et al., 2017; Schreiber et al., 2018), but finding their progenitors at even earlier times is challenging. Generally, UV-selected galaxies at are presumed not abundant, massive, and star forming enough to produce the population of the earliest known massive quiescent galaxies with N Mpc-3 and Log (M/M (Straatman et al., 2014). Bright ( mJy) sub-millimeter galaxies are a possible avenue, but it is difficult to establish a conclusive connection. Estimated SMG number densities at are low and uncertain Mpc-3 (Ivison et al., 2016; Michałowski et al., 2017; Jin et al., 2018). While their high SFRs indicate they will rapidly form massive galaxies, the modest inferred gas masses indicate gas depletion timescales on the order of Myr (e.g. Aravena et al., 2016; Spilker et al., 2018), and large duty cycle corrections are needed to make up for the low number densities.
The inferred space densities and stellar mass of -1 on the other hand are already as large as those reported for the population of early quiescent galaxies at (Straatman et al., 2014; Nayyeri et al., 2014). The large gas mass and modest SFR indicates much longer depletion timescales ( Myr), half the age of the Universe at this epoch, and implies a % duty cycle for our adopted selection window. -1 could therefore represent a more gradual path for massive galaxy growth compared to a rapid and bursty formation as has been found in some bright merger-induced SMGs (e.g. Pavesi et al., 2018; Marrone et al., 2018). Overall, our results provide evidence for the existence of a sustained growth mode for massive galaxies in the early Universe.
Finally, the large systematic difference in SFR and stellar mass in particular depending on the assumed attenuation model for -2 suggests exercising caution when relating progenitors and descendants galaxies. Often such links are determined based on the capability of a progenitor population to produce adequate numbers of sufficiently massive galaxies at later times (e.g., Straatman et al., 2014; Toft et al., 2014; Williams et al., 2014, 2015), or by the assumption that the rank-order on stellar mass can be reliably determined (e.g. Brammer et al., 2011; Behroozi et al., 2013a; Leja et al., 2013). Such determinations could be more uncertain than has been accounted for if the derived stellar masses of individual galaxies are off by factors of (see §3.2). This is a particular concern at high redshift , where very few galaxies have high enough SNR (sub-)mm observations for meaningful constraints on the dust attenuation model. These results are obviously based on only a single galaxy and larger samples with full optical-to-mm photometry are needed to determine the scatter in stellar mass.
4.8 Future ALMA and JWST observations
The dark nature of the -1, non-detection in very deep stacked optical and near-IR data and the faint IRAC fluxes, suggests a prominent population of DSFGs at . The high inferred redshift may point to the efficacy of blind surveys at mm to find the earliest dusty star forming galaxies (Béthermin et al., 2015; Casey et al., 2018). These galaxies are below the classical detection limit ( mJy) of bright galaxies found in single-dish sub-mm surveys. Deep 2 mm single-dish and wider mm ALMA (sub)-mm surveys are only just starting to push into this territory at very high redshift (e.g. Magnelli et al., 2019; Yamaguchi et al., 2019). Until the launch of the James Webb Space Telescope (JWST), ALMA alone can find and study these galaxies.
Wide-area unbiased ALMA surveys covering 100’s of arcmin2 are necessary to further constrain their prominence in the early universe. Such surveys are feasible at mm with ALMA because of the relatively large size of the primary ALMA beam and the exquisite sensitivity to high redshift star forming galaxies even in short integration times (Casey et al., 2019). To date, none of the ALMA-only galaxies found has been spectroscopically confirmed, but spectral line scans for CO and in particular [CII] are efficient and feasible with ALMA. Future surveys with JWST will enable systematic studies of large samples of faint SMG galaxies. Large legacy surveys such as the JWST Advanced Deep Extragalactic Survey (JADES) will likely characterize galaxies similar to -1 (based on expected number densities from this work and Zavala et al. 2018a, and observations described in Williams et al. 2018). JWST will have the capability to measure stellar population properties and redshifts, and in combination with ALMA far-infrared constraints, will enable a detailed investigation into the star-formation, dust, and stellar population properties of massive galaxies in the early Universe.
| Band | -1 flux density | RMS | -2 flux density | RMS |
|---|---|---|---|---|
| [Jy] | [Jy] | |||
| SUBARU B | [ -1.3E-02 ] | 7.8E-03 | – | – |
| HSC g | [ 3.6E-03 ] | 1.5E-02 | [ 2.3E-02 ] | 1.1E-02 |
| SUBARU V | [ -7.6E-03 ] | 1.8E-02 | – | – |
| HSC r | [ -1.2E-02 ] | 1.4E-02 | 9.3E-02 | 9.7E-03 |
| SUBARU rp | [ 1.2E-03 ] | 1.7E-02 | – | – |
| SUBARU ip | [ 2.0E-03 ] | 2.6E-02 | – | – |
| HSC i | [ -1.0E-02 ] | 2.1E-02 | 1.2E-01 | 1.5E-02 |
| HSC z | [ 1.2E-02 ] | 3.0E-02 | 1.3E-01 | 2.4E-02 |
| SUBARU zp | [ -1.5E-01 ] | 6.5E-02 | – | – |
| HSC Y | [ 2.2E-02 ] | 7.4E-02 | [ 4.9E-02 ] | 5.8E-02 |
| UltraVISTA Y | [ 9.7E-03 ] | 8.9E-02 | [ 1.6E-01 ] | 8.2E-02 |
| UltraVISTA J | [ -1.1E-01 ] | 1.0E-01 | [ 2.0E-01 ] | 8.9E-02 |
| UltraVISTA H | [ -5.9E-02 ] | 1.3E-01 | 6.3E-01 | 1.1E-01 |
| UltraVISTA Ks | [ 1.2E-01 ] | 8.8E-02 | 8.4E-01 | 8.7E-02 |
| Spitzer/IRAC 3.6m | [ 3.2E-01 ] | 1.2E-01 | 1.7E+00 | 9.2E-02 |
| Spitzer/IRAC 4.5m | [ 3.2E-01 ] | 1.3E-01 | 3.0E+00 | 9.9E-02 |
| Spitzer/IRAC 5.8m | [ 5.2E+00 ] | 3.3E+00 | 8.8E+00 | 2.2E+00 |
| Spitzer/IRAC 8m | [ 6.0E+00 ] | 4.1E+00 | [ 7.7E+00 ] | 2.9E+00 |
| Spiter/MIPS 24m | [ 1.1E+01 ] | 1.5E+01 | [ 2.6E+01 ] | 1.5E+01 |
| Herschel/PACS 100m | [ 7.1E+02 ] | 1.4E+03 | [ 1.5E+02 ] | 1.4E+03 |
| Herschel/PACS 160m | [ -2.4E+03 ] | 3.2E+03 | [ -1.9E+03 ] | 3.2E+03 |
| Herschel/SPIRE 250m | [ 3.7E+03 ] | 3.9E+03 | [ 1.0E+03 ] | 3.9E+03 |
| Herschel/SPIRE 350m | [ 4.3E+03 ] | 4.9E+03 | [ -5.0E+02 ] | 4.9E+03 |
| Herschel/SPIRE 500m | [ 5.5E+03 ] | 5.8E+03 | [ 4.4E+03 ] | 5.8E+03 |
| SCUBA2 850m | 3.5E+03 | 1.1E+03 | [ 4.0E+02 ] | 1.1E+03 |
| ALMA 3mm | 1.6E+02 | 2.2E+01 | 7.5E+01 | 1.0E+01 |
| VLA 3 GHz | 1.0E+01 | 2.4E+00 | [ 3.9E+00 ] | 2.4E+00 |
| VLA 1.4 GHz | [ 1.7E+01 ] | 1.7E+01 | [ 4.0E+01 ] | 1.7E+01 |
Note. — Subaru optical photometry for -2 are not measured owing to cosmetic defects in the mosaics that cross the location of the source. Photometric upper limits as indicated by downward arrows in Figure 4 are at the RMS values of photometric points in this table where S/N1. Non-significant photometric points (with SNR) are indicated with brackets.
References
- Aihara et al. (2018a) Aihara, H., Arimoto, N., Armstrong, R., et al. 2018a, PASJ, 70, S4, doi: 10.1093/pasj/psx066
- Aihara et al. (2018b) Aihara, H., Armstrong, R., Bickerton, S., et al. 2018b, PASJ, 70, S8, doi: 10.1093/pasj/psx081
- Aravena et al. (2016) Aravena, M., Decarli, R., Walter, F., et al. 2016, ApJ, 833, 68, doi: 10.3847/1538-4357/833/1/68
- Aretxaga et al. (2011) Aretxaga, I., Wilson, G. W., Aguilar, E., et al. 2011, MNRAS, 415, 3831, doi: 10.1111/j.1365-2966.2011.18989.x
- Behroozi et al. (2013a) Behroozi, P. S., Marchesini, D., Wechsler, R. H., et al. 2013a, ApJ, 777, L10, doi: 10.1088/2041-8205/777/1/L10
- Behroozi et al. (2013b) Behroozi, P. S., Wechsler, R. H., & Conroy, C. 2013b, ApJ, 770, 57, doi: 10.1088/0004-637X/770/1/57
- Béthermin et al. (2015) Béthermin, M., De Breuck, C., Sargent, M., & Daddi, E. 2015, A&A, 576, L9, doi: 10.1051/0004-6361/201525718
- Bezanson et al. (2019) Bezanson, R., Spilker, J., Williams, C. C., et al. 2019, ApJ, 873, L19, doi: 10.3847/2041-8213/ab0c9c
- Bothwell et al. (2013) Bothwell, M. S., Smail, I., Chapman, S. C., et al. 2013, MNRAS, 429, 3047, doi: 10.1093/mnras/sts562
- Bouwens et al. (2016) Bouwens, R. J., Oesch, P. A., Labbé, I., et al. 2016, ApJ, 830, 67, doi: 10.3847/0004-637X/830/2/67
- Brammer et al. (2011) Brammer, G. B., Whitaker, K. E., van Dokkum, P. G., et al. 2011, ApJ, 739, 24, doi: 10.1088/0004-637X/739/1/24
- Brisbin et al. (2017) Brisbin, D., Miettinen, O., Aravena, M., et al. 2017, A&A, 608, A15, doi: 10.1051/0004-6361/201730558
- Bruzual & Charlot (2003) Bruzual, G., & Charlot, S. 2003, MNRAS, 344, 1000, doi: 10.1046/j.1365-8711.2003.06897.x
- Byler et al. (2017) Byler, N., Dalcanton, J. J., Conroy, C., & Johnson, B. D. 2017, ApJ, 840, 44, doi: 10.3847/1538-4357/aa6c66
- Calzetti et al. (2000) Calzetti, D., Armus, L., Bohlin, R. C., et al. 2000, ApJ, 533, 682, doi: 10.1086/308692
- Caputi et al. (2012) Caputi, K. I., Dunlop, J. S., McLure, R. J., et al. 2012, ApJ, 750, L20, doi: 10.1088/2041-8205/750/1/L20
- Carilli & Yun (1999) Carilli, C. L., & Yun, M. S. 1999, ApJ, 513, L13, doi: 10.1086/311909
- Carnall et al. (2019) Carnall, A. C., Leja, J., Johnson, B. D., et al. 2019, ApJ, 873, 44, doi: 10.3847/1538-4357/ab04a2
- Carnall et al. (2018) Carnall, A. C., McLure, R. J., Dunlop, J. S., & Davé, R. 2018, MNRAS, 480, 4379, doi: 10.1093/mnras/sty2169
- Casey et al. (2018) Casey, C. M., Hodge, J., Zavala, J. A., et al. 2018, ApJ, 862, 78, doi: 10.3847/1538-4357/aacd11
- Casey et al. (2014) Casey, C. M., Narayanan, D., & Cooray, A. 2014, Phys. Rep., 541, 45, doi: 10.1016/j.physrep.2014.02.009
- Casey et al. (2019) Casey, C. M., Capak, P., Staguhn, J., et al. 2019, arXiv e-prints. https://arxiv.org/abs/1903.05634
- Chabrier (2003) Chabrier, G. 2003, PASP, 115, 763, doi: 10.1086/376392
- Charlot & Fall (2000) Charlot, S., & Fall, M. 2000, ApJ, 539, 718, doi: 10.1086/309250
- Chevallard et al. (2013) Chevallard, J., Charlot, S., Wandelt, B., & Wild, V. 2013, MNRAS, 432, 2061, doi: 10.1093/mnras/stt523
- Civano et al. (2016) Civano, F., Marchesi, S., Comastri, A., et al. 2016, ApJ, 819, 62, doi: 10.3847/0004-637X/819/1/62
- Cooray et al. (2014) Cooray, A., Calanog, J., Wardlow, J. L., et al. 2014, ApJ, 790, 40, doi: 10.1088/0004-637X/790/1/40
- Cowie et al. (2017) Cowie, L. L., Barger, A. J., Hsu, L.-Y., et al. 2017, The Astrophysical Journal, 837, 139, doi: 10.3847/1538-4357/aa60bb
- Cowie et al. (2018) Cowie, L. L., González-López, J., Barger, A. J., et al. 2018, ApJ, 865, 106, doi: 10.3847/1538-4357/aadc63
- da Cunha et al. (2015) da Cunha, E., Walter, F., Smail, I. R., et al. 2015, ApJ, 806, 110, doi: 10.1088/0004-637X/806/1/110
- Daddi et al. (2009) Daddi, E., Dannerbauer, H., Stern, D., et al. 2009, ApJ, 694, 1517, doi: 10.1088/0004-637X/694/2/1517
- Danielson et al. (2017) Danielson, A. L. R., Swinbank, A. M., Smail, I., et al. 2017, ApJ, 840, 78, doi: 10.3847/1538-4357/aa6caf
- Davidzon et al. (2017) Davidzon, I., Ilbert, O., Laigle, C., et al. 2017, A&A, 605, A70, doi: 10.1051/0004-6361/201730419
- Delhaize et al. (2017) Delhaize, J., Smolčić, V., Delvecchio, I., et al. 2017, A&A, 602, A4, doi: 10.1051/0004-6361/201629430
- Draine & Li (2007) Draine, B. T., & Li, A. 2007, ApJ, 657, 810, doi: 10.1086/511055
- Duncan et al. (2014) Duncan, K., Conselice, C. J., Mortlock, A., et al. 2014, MNRAS, 444, 2960, doi: 10.1093/mnras/stu1622
- Dunlop et al. (2004) Dunlop, J. S., McLure, R. J., Yamada, T., et al. 2004, MNRAS, 350, 769, doi: 10.1111/j.1365-2966.2004.07700.x
- Dunlop et al. (2017) Dunlop, J. S., McLure, R. J., Biggs, A. D., et al. 2017, MNRAS, 466, 861, doi: 10.1093/mnras/stw3088
- Ferland et al. (2017) Ferland, G. J., Chatzikos, M., Guzmán, F., et al. 2017, Rev. Mexicana Astron. Astrofis., 53, 385. https://arxiv.org/abs/1705.10877
- Finkelstein et al. (2015) Finkelstein, S. L., Ryan, Jr., R. E., Papovich, C., et al. 2015, ApJ, 810, 71, doi: 10.1088/0004-637X/810/1/71
- Franco et al. (2018) Franco, M., Elbaz, D., Béthermin, M., et al. 2018, A&A, 620, A152, doi: 10.1051/0004-6361/201832928
- Geach et al. (2017) Geach, J. E., Dunlop, J. S., Halpern, M., et al. 2017, MNRAS, 465, 1789, doi: 10.1093/mnras/stw2721
- Gehrels (1986) Gehrels, N. 1986, ApJ, 303, 336, doi: 10.1086/164079
- Glazebrook et al. (2017) Glazebrook, K., Schreiber, C., Labbé, I., et al. 2017, Nature, 544, 71, doi: 10.1038/nature21680
- González-López et al. (2019) González-López, J., Decarli, R., Pavesi, R., et al. 2019, arXiv e-prints, arXiv:1903.09161. https://arxiv.org/abs/1903.09161
- Grazian et al. (2015) Grazian, A., Fontana, A., Santini, P., et al. 2015, A&A, 575, A96, doi: 10.1051/0004-6361/201424750
- Hatsukade et al. (2018) Hatsukade, B., Kohno, K., Yamaguchi, Y., et al. 2018, PASJ, 70, 105, doi: 10.1093/pasj/psy104
- Hodge et al. (2016) Hodge, J. A., Swinbank, A. M., Simpson, J. M., et al. 2016, ApJ, 833, 103, doi: 10.3847/1538-4357/833/1/103
- Hurley et al. (2017) Hurley, P. D., Oliver, S., Betancourt, M., et al. 2017, MNRAS, 464, 885, doi: 10.1093/mnras/stw2375
- Ivison et al. (2016) Ivison, R. J., Lewis, A. J. R., Weiss, A., et al. 2016, ApJ, 832, 78, doi: 10.3847/0004-637X/832/1/78
- Jin et al. (2018) Jin, S., Daddi, E., Liu, D., et al. 2018, ApJ, 864, 56, doi: 10.3847/1538-4357/aad4af
- Kennicutt & Evans (2012) Kennicutt, R. C., & Evans, N. J. 2012, ARA&A, 50, 531, doi: 10.1146/annurev-astro-081811-125610
- Kennicutt (1998) Kennicutt, Jr., R. C. 1998, ApJ, 498, 541, doi: 10.1086/305588
- Kirkpatrick et al. (2015) Kirkpatrick, A., Pope, A., Sajina, A., et al. 2015, ApJ, 814, 9, doi: 10.1088/0004-637X/814/1/9
- Koekemoer et al. (2007) Koekemoer, A. M., Aussel, H., Calzetti, D., et al. 2007, ApJS, 172, 196, doi: 10.1086/520086
- Koprowski et al. (2017) Koprowski, M. P., Dunlop, J. S., Michałowski, M. J., et al. 2017, MNRAS, 471, 4155, doi: 10.1093/mnras/stx1843
- Koprowski et al. (2016) —. 2016, MNRAS, 458, 4321, doi: 10.1093/mnras/stw564
- Kroupa (2001) Kroupa, P. 2001, MNRAS, 322, 231, doi: 10.1046/j.1365-8711.2001.04022.x
- Labbé et al. (2013) Labbé, I., Oesch, P. A., Bouwens, R. J., et al. 2013, ApJ, 777, L19, doi: 10.1088/2041-8205/777/2/L19
- Labbé et al. (2015) Labbé, I., Oesch, P. A., Illingworth, G. D., et al. 2015, ApJS, 221, 23, doi: 10.1088/0067-0049/221/2/23
- Laigle et al. (2016) Laigle, C., McCracken, H. J., Ilbert, O., et al. 2016, ApJS, 224, 24, doi: 10.3847/0067-0049/224/2/24
- Le Floc’h et al. (2009) Le Floc’h, E., Aussel, H., Ilbert, O., et al. 2009, ApJ, 703, 222, doi: 10.1088/0004-637X/703/1/222
- Leja et al. (2019) Leja, J., Carnall, A. C., Johnson, B. D., Conroy, C., & Speagle, J. S. 2019, ApJ, 876, 3, doi: 10.3847/1538-4357/ab133c
- Leja et al. (2018) Leja, J., Johnson, B. D., Conroy, C., & van Dokkum, P. 2018, ApJ, 854, 62, doi: 10.3847/1538-4357/aaa8db
- Leja et al. (2017) Leja, J., Johnson, B. D., Conroy, C., van Dokkum, P. G., & Byler, N. 2017, ApJ, 837, 170, doi: 10.3847/1538-4357/aa5ffe
- Leja et al. (2013) Leja, J., van Dokkum, P., & Franx, M. 2013, ApJ, 766, 33, doi: 10.1088/0004-637X/766/1/33
- Liu et al. (2018) Liu, D., Daddi, E., Dickinson, M., et al. 2018, ApJ, 853, 172, doi: 10.3847/1538-4357/aaa600
- Lo Faro et al. (2017) Lo Faro, B., Buat, V., Roehlly, Y., et al. 2017, MNRAS, 472, 1372, doi: 10.1093/mnras/stx1901
- Madau & Dickinson (2014) Madau, P., & Dickinson, M. 2014, ARA&A, 52, 415, doi: 10.1146/annurev-astro-081811-125615
- Magnelli et al. (2015) Magnelli, B., Ivison, R. J., Lutz, D., et al. 2015, A&A, 573, A45, doi: 10.1051/0004-6361/201424937
- Magnelli et al. (2019) Magnelli, B., Karim, A., Staguhn, J., et al. 2019, arXiv e-prints. https://arxiv.org/abs/1904.10006
- Marrone et al. (2018) Marrone, D. P., Spilker, J. S., Hayward, C. C., et al. 2018, Nature, 553, 51, doi: 10.1038/nature24629
- McCracken et al. (2012) McCracken, H. J., Milvang-Jensen, B., Dunlop, J., et al. 2012, A&A, 544, A156, doi: 10.1051/0004-6361/201219507
- McLeod et al. (2016) McLeod, D. J., McLure, R. J., & Dunlop, J. S. 2016, MNRAS, 459, 3812, doi: 10.1093/mnras/stw904
- Michałowski et al. (2017) Michałowski, M. J., Dunlop, J. S., Koprowski, M. P., et al. 2017, MNRAS, 469, 492, doi: 10.1093/mnras/stx861
- Murray et al. (2013) Murray, S. G., Power, C., & Robotham, A. S. G. 2013, MNRAS, 434, L61, doi: 10.1093/mnrasl/slt079
- Muzzin et al. (2013) Muzzin, A., Marchesini, D., Stefanon, M., et al. 2013, ApJS, 206, 8, doi: 10.1088/0067-0049/206/1/8
- Narayanan et al. (2018) Narayanan, D., Conroy, C., Davé, R., Johnson, B. D., & Popping, G. 2018, ApJ, 869, 70, doi: 10.3847/1538-4357/aaed25
- Narayanan & Krumholz (2014) Narayanan, D., & Krumholz, M. R. 2014, MNRAS, 442, 1411, doi: 10.1093/mnras/stu834
- Nayyeri et al. (2014) Nayyeri, H., Mobasher, B., Hemmati, S., et al. 2014, ApJ, 794, 68, doi: 10.1088/0004-637X/794/1/68
- Oesch et al. (2018) Oesch, P. A., Bouwens, R. J., Illingworth, G. D., Labbé, I., & Stefanon, M. 2018, ApJ, 855, 105, doi: 10.3847/1538-4357/aab03f
- Oliver et al. (2012) Oliver, S. J., Bock, J., Altieri, B., et al. 2012, MNRAS, 424, 1614, doi: 10.1111/j.1365-2966.2012.20912.x
- Pavesi et al. (2018) Pavesi, R., Riechers, D. A., Sharon, C. E., et al. 2018, ApJ, 861, 43, doi: 10.3847/1538-4357/aac6b6
- Salim et al. (2018) Salim, S., Boquien, M., & Lee, J. C. 2018, ApJ, 859, 11, doi: 10.3847/1538-4357/aabf3c
- Salmon et al. (2016) Salmon, B., Papovich, C., Long, J., et al. 2016, ApJ, 827, 20, doi: 10.3847/0004-637X/827/1/20
- Sanders et al. (2007) Sanders, D. B., Salvato, M., Aussel, H., et al. 2007, ApJS, 172, 86, doi: 10.1086/517885
- Schinnerer et al. (2007) Schinnerer, E., Smolčić, V., Carilli, C. L., et al. 2007, ApJS, 172, 46, doi: 10.1086/516587
- Schinnerer et al. (2010) Schinnerer, E., Sargent, M. T., Bondi, M., et al. 2010, ApJS, 188, 384, doi: 10.1088/0067-0049/188/2/384
- Schreiber et al. (2017) Schreiber, C., Pannella, M., Leiton, R., et al. 2017, A&A, 599, A134, doi: 10.1051/0004-6361/201629155
- Schreiber et al. (2018) Schreiber, C., Glazebrook, K., Nanayakkara, T., et al. 2018, A&A, 618, A85, doi: 10.1051/0004-6361/201833070
- Scoville et al. (2016) Scoville, N., Sheth, K., Aussel, H., et al. 2016, ApJ, 820, 83, doi: 10.3847/0004-637X/820/2/83
- Serjeant & Marchetti (2014) Serjeant, S., & Marchetti, L. 2014, MNRAS, 443, 3118, doi: 10.1093/mnras/stu1266
- Silverman et al. (2018) Silverman, J. D., Rujopakarn, W., Daddi, E., et al. 2018, ApJ, 867, 92, doi: 10.3847/1538-4357/aae25e
- Simpson et al. (2014) Simpson, J. M., Swinbank, A. M., Smail, I., et al. 2014, ApJ, 788, 125, doi: 10.1088/0004-637X/788/2/125
- Smolčić et al. (2017) Smolčić, V., Novak, M., Bondi, M., et al. 2017, A&A, 602, A1, doi: 10.1051/0004-6361/201628704
- Song et al. (2016) Song, M., Finkelstein, S. L., Ashby, M. L. N., et al. 2016, ApJ, 825, 5, doi: 10.3847/0004-637X/825/1/5
- Spilker et al. (2016) Spilker, J. S., Marrone, D. P., Aravena, M., et al. 2016, ApJ, 826, 112, doi: 10.3847/0004-637X/826/2/112
- Spilker et al. (2018) Spilker, J. S., Aravena, M., Béthermin, M., et al. 2018, Science, 361, 1016, doi: 10.1126/science.aap8900
- Stefanon et al. (2017) Stefanon, M., Bouwens, R. J., Labbé, I., et al. 2017, ApJ, 843, 36, doi: 10.3847/1538-4357/aa72d8
- Straatman et al. (2014) Straatman, C. M. S., Labbé, I., Spitler, L. R., et al. 2014, ApJ, 783, L14, doi: 10.1088/2041-8205/783/1/L14
- Strandet et al. (2016) Strandet, M. L., Weiss, A., Vieira, J. D., et al. 2016, ApJ, 822, 80, doi: 10.3847/0004-637X/822/2/80
- Strandet et al. (2017) Strandet, M. L., Weiss, A., De Breuck, C., et al. 2017, ApJ, 842, L15, doi: 10.3847/2041-8213/aa74b0
- Swinbank et al. (2014) Swinbank, A. M., Simpson, J. M., Smail, I., et al. 2014, MNRAS, 438, 1267, doi: 10.1093/mnras/stt2273
- Taniguchi et al. (2007) Taniguchi, Y., Scoville, N., Murayama, T., et al. 2007, ApJS, 172, 9, doi: 10.1086/516596
- Tisanić et al. (2019) Tisanić, K., Smolčić, V., Delhaize, J., et al. 2019, A&A, 621, A139, doi: 10.1051/0004-6361/201834002
- Toft et al. (2014) Toft, S., Smolčić, V., Magnelli, B., et al. 2014, ApJ, 782, 68, doi: 10.1088/0004-637X/782/2/68
- Trenti & Stiavelli (2008) Trenti, M., & Stiavelli, M. 2008, ApJ, 676, 767, doi: 10.1086/528674
- van der Wel et al. (2014) van der Wel, A., Franx, M., van Dokkum, P. G., et al. 2014, ApJ, 788, 28, doi: 10.1088/0004-637X/788/1/28
- Walter et al. (2012) Walter, F., Decarli, R., Carilli, C., et al. 2012, Nature, 486, 233, doi: 10.1038/nature11073
- Wang et al. (2013) Wang, R., Wagg, J., Carilli, C. L., et al. 2013, ApJ, 773, 44, doi: 10.1088/0004-637X/773/1/44
- Wang et al. (2016) Wang, T., Elbaz, D., Schreiber, C., et al. 2016, ApJ, 816, 84, doi: 10.3847/0004-637X/816/2/84
- Wardlow et al. (2018) Wardlow, J. L., Simpson, J. M., Smail, I., et al. 2018, MNRAS, 479, 3879, doi: 10.1093/mnras/sty1526
- Weiß et al. (2009) Weiß, A., Kovács, A., Coppin, K., et al. 2009, ApJ, 707, 1201, doi: 10.1088/0004-637X/707/2/1201
- Whitaker et al. (2017) Whitaker, K. E., Pope, A., Cybulski, R., et al. 2017, ApJ, 850, 208, doi: 10.3847/1538-4357/aa94ce
- Williams et al. (2014) Williams, C. C., Giavalisco, M., Cassata, P., et al. 2014, ApJ, 780, 1, doi: 10.1088/0004-637X/780/1/1
- Williams et al. (2015) Williams, C. C., Giavalisco, M., Lee, B., et al. 2015, ApJ, 800, 21, doi: 10.1088/0004-637X/800/1/21
- Williams et al. (2018) Williams, C. C., Curtis-Lake, E., Hainline, K. N., et al. 2018, ArXiv e-prints. https://arxiv.org/abs/1802.05272
- Wuyts et al. (2011) Wuyts, S., Förster Schreiber, N. M., Lutz, D., et al. 2011, ApJ, 738, 106, doi: 10.1088/0004-637X/738/1/106
- Yamaguchi et al. (2019) Yamaguchi, Y., Kohno, K., Hatsukade, B., et al. 2019, arXiv e-prints. https://arxiv.org/abs/1903.02744
- Zavala et al. (2018a) Zavala, J. A., Casey, C. M., da Cunha, E., et al. 2018a, ApJ, 869, 71, doi: 10.3847/1538-4357/aaecd2
- Zavala et al. (2017) Zavala, J. A., Aretxaga, I., Geach, J. E., et al. 2017, MNRAS, 464, 3369, doi: 10.1093/mnras/stw2630
- Zavala et al. (2018b) Zavala, J. A., Montaña, A., Hughes, D. H., et al. 2018b, Nature Astronomy, 2, 56, doi: 10.1038/s41550-017-0297-8