\ceH2-Induced Pressure Broadening and Pressure Shift in the -Branch of the Band of \ceCH4 from 300 to 700 K
Abstract
For accurate modelling of observations of exoplanet atmospheres, quantification of the pressure broadening of infrared absorption lines for and by a variety of gases at elevated temperatures is needed. High-resolution high-temperature \ceH2-pressure-broadened spectra are recorded for the \ceCH4 -band -branch. Measured linewidths for 116 transitions between 2840 and 3000 cm-1 with temperature and pressures ranging between 300 and 700 K, and 10 and 933 Torr, respectively, were used to find rotation- and tetrahedral-symmetry-dependent coefficients for pressure and temperature broadening and pressure-induced lineshifts. The new pressure-broadening data will be useful in radiative-transfer models for retrieving the properties of observed expolanet atmospheres.
keywords:
Methane (\ceCH4) , High-Temperature FTIR Spectroscopy , High-Temperature Pressure-induced collisional broadening and shift , Lorentzian linewidth coefficients, exoplanetary atmospheres , hydrogen-dominant atmospheres1 Introduction
Methane (\ceCH4) has been observed in the infrared spectra of different solar-system atmospheres including those of terrestrial planets (e.g., on the surface of Mars [1, 2]), Jovian planets (e.g., Jupiter, Saturn, Uranus [3, 4]), and Titan [5, 6]. The abundance of \ceCH4 is also important in constraint understanding the C/O ratio in the atmospheres of brown dwarfs and exoplanets, as well as understanding their formation history [7, 8]. Because the thermochemically dominant carbon-bearing molecule at T1200 K is CO and at T800 K is \ceCH4 [6], their mixing ratios with \ceCO2 are used as a temperature probe and to determine super-Earths/sub-Neptune metallicities [9, 10]. Moreover, \ceCH4 near-infrared (NIR) spectra are an important tool for classifying brown dwarf types (e.g., T-dwarfs [11]). Despite extensive endeavors to model the chemical composition of exoplanetary atmospheres by means of radiative transfer modeling (i.e., transmission and emission exoplanetary spectra [12, 13, 14]), a proposed detection of \ceCH4 is still under debate [15]. Additionally, high-resolution Earth-based searches of methane through the cross-correlation technique have been unsuccessful [16]. However, it has been argued thermochemically that \ceCH4 is one of the main absorbers in super-Earth to sub-Neptune atmospheres [17]. \ceH2 is the major broadening molecule (or perturber) in these exoplanetary atmospheres, and therefore, the accuracy of radiative transfer modeling, particularly for the cross-correlation technique (see section 3.5 in [18]), relies strongly upon the accuracy and completeness of \ceCH4 spectroscopic data including rovibrational transitions and pressure-broadening coefficients appropriate for high-temperature and \ceH2-dominated atmospheres [19, 20]. Accurate quantification of pressure-broadening coefficients at room- and high-temperature is fundamental because they influence the absorption cross-section data and, therefore, the modeled exoplanet atmospheric spectra [20, 21].
Methane is a tetrahedral molecule with five symmetry species: , , , , and . The fundamental band arises from asymmetric C–H stretching (see chapter 7 in [22]). Given the relevance of \ceCH4 infrared (IR) absorption and emission in the study of brown dwarfs and planetary/exoplanetary atmospheres, many experimental and theoretical studies recorded or computed the relevant rovibrational transitions. High-resolution IR spectra of \ceCH4 have been recorded at both room [23, 24] and high temperatures [25, 26, 27, 28, 29, 30]. Additionally, several ab-initio studies have computed the \ceCH4 rovibrational transitions [25, 31, 32, 33, 34].
Since the 1980s, several laboratory measurements of the pressure-broadening of \ceCH4 by various broadeners (hereafter referred to as absorber@[broadener], e.g., \ceCH4@[\ceH2]) at room temperature have been made. Non-Voigt pressure-broadening coefficients of the \ceCH4@[\ceH2, \ceN2, \ceAr, or \ceHe] band branch were analyzed using a laser spectrometer at high resolution [35, 36] and showed a strong dependency of linewidths on broadener and total angular-momentum quantum number, . In addition, the measured linewidths are dependent on the tetrahedral symmetry species (i.e., ). The -branch of the 3 overtone ( cm-1) of \ceCH4@[\ceH2] was measured up to =6 by Fourier transform spectroscopy with 0.01 cm-1 spectral resolution [37, 38].
Several studies have used quantum or semi-classical approaches to calculate, predict, and explain pressure broadening of \ceCH4 in different broadeners (or perturbers)[39]. Anderson theory, for instance, utilizes a perturbation approach to compute the line broadening and their temperature-dependence coefficients through electrostatic interactions [40, 41, 42]. However, it was shown later that electrostatic forces are not able to explain the broadening for some perturbers such as \ceO2 and \ceN2 [43]. In comparison, Robert-Bonamy theory [44] was used to show the atom-atom potential energy is the main cause of collisional broadening for these species [45].
To the best of our knowledge, there are no measurements of \ceCH4@[\ceH2] (or any other broadeners) at T 315 K. Measurements for temperatures between 200 and 300 K show the temperature-dependence coefficient (, see section 4.2) of the band of \ceCH4@[Air] and \ceCH4@[\ceN2] is 0.6 – 1.0 [46] and 0.94–0.97 [43], respectively. For the band of \ceCH4@[Air] and \ceCH4@[\ceN2], n is 0.5 – 0.8 [47]. A complete list of literature regarding measurement of temperature-dependence coefficients is reported in Table 5.
For this study, we used Fourier-transform infrared spectroscopy (FTIR) to record rovibrational lines of \ceCH4@[\ceH2] in the branch of the band over the temperature range 300–700 K (Sec. 2). Then, using a least-squares fitting analysis, the Lorentzian linewidth () and temperature-dependence coefficients () are determined for = 2 – 17 (Sec. 3). The dependency of the Lorentzian coefficients on total quantum number and the tetrahedral symmetry species is discussed in Sec. 4.
2 Experimental details
2.1 Instrumental setup
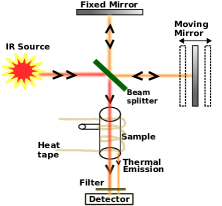
All spectra in this study were recorded with a Bruker 125HR infrared Fourier-transform spectrometer located at the Advanced Light Source (ALS) of the Lawrence Berkeley National Laboratory (LBNL). As shown in Fig. 1, the evacuated sample chamber in this model of spectrometer is located between the beam splitter and detector. In this case, the thermal IR emission from the heated sample gas cells does not contribute to the recorded interferogram, and no post-analysis correction for the cell emission is required in comparison with other studies in which the heated cell was placed at the entrance to the spectrometer (e.g., Ref. [26]). For measurements at high temperature, we designed a sealed monolithic gas cell. Due to its high transmittance over a spectral range of 2750–3250 cm-1 and high melting point, the whole gas cell and spectral windows are fabricated from fused quartz.
2.2 Recorded Spectra
We recorded spectra for temperatures 300, 500 and 700 K and over a pressure range of 0.8 – 7.0 Torr for \ceCH4 gas and 10 – 933 Torr (0.013–1.2 atm) of \ceH2 broadening gas. In total, four quartz gas cells with a path length of 100.2 cm were used in these measurements. Different amounts of \ceCH4 and \ceH2 gases were inserted in each tube at room temperature and then the port was sealed. After sealing the gas cell at room temperature with known number densities of \ceCH4 and \ceH2, FTIR transmittance spectra of each tube were recorded at three different temperatures: 300, 500, 700 K. Table 1 reports the experimental conditions in detail.
| Parameter | Value |
| Spectral coverage | 2800 – 3200 cm-1 |
| Temperature range | 300 – 700 K |
| \ceCH4 pressure | 0.8 – 7.0 Torr |
| \ceH2 pressure | 10.0 – 933.3 Torr |
| Cells path length | 10.00.2 cm |
| Number of averaged scans | 100 – 400 |
| Gas cell material/windows | Quartz (\ceSiO2) |
| Gas cell transmission range | 2750 – 3250 cm-1 |
| Light source | SiC Globar |
| Beam splitter | KBr |
| Detector | MCT LN2 |
| Filter | fused silica and Ge |
| Spectral resolution (cm-1) | 0.01 – 0.005 |
| Apodization function | Box-car |
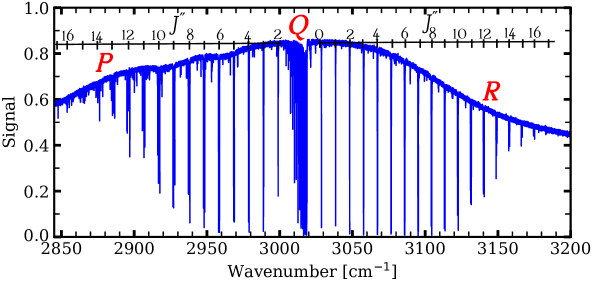
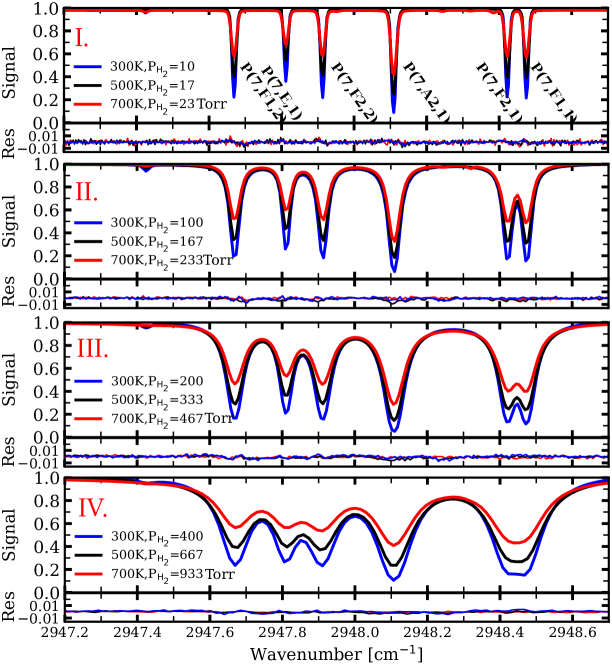
Overall, 12 different spectra of \ceCH4 were recorded at various resolutions. Figure 2 represents an overview of spectrum 4 (i.e., P=1.1 Torr and P=100.0 Torr), which encompasses , , and branches up to =17. In addition, each consists of a cluster of transitions with various symmetry species and quantum index111 The \ceCH4 energy levels are labelled by different quantum numbers such as and (tetrahedral symmetry), and (quantum index) defined in Brown et al. [48].. Figure 3 illustrates the modeled spectra for (7) transitions. The elevated temperature gas pressures, P and P, were then calculated using the ideal gas law. Table 2 lists the resolution, number of scans, and the P and P values for all measurements. Spectrum 1 was used to measure the unbroadened Doppler-width and intensity of each line.
| Tube | [K] | R†[cm-1] | Scan‡ | [Torr] | [Torr] | |
| 1 | 1 | 300 | 0.005 | 400 | 0.8 | 10.0 |
| 2 | 1 | 500 | 0.005 | 200 | 1.3 | 16.7 |
| 3 | 1 | 700 | 0.005 | 200 | 1.9 | 23.3 |
| 4 | 2 | 300 | 0.01 | 150 | 1.1 | 100.0 |
| 5 | 2 | 500 | 0.01 | 100 | 1.8 | 166.7 |
| 6 | 2 | 700 | 0.01 | 100 | 2.6 | 233.3 |
| 7 | 3 | 300 | 0.01 | 200 | 2.2 | 200.0 |
| 8 | 3 | 500 | 0.01 | 200 | 3.7 | 333.3 |
| 9 | 3 | 700 | 0.01 | 200 | 5.1 | 466.7 |
| 10 | 4 | 300 | 0.02 | 100 | 3.0 | 400.0 |
| 11 | 4 | 500 | 0.02 | 100 | 5.0 | 666.7 |
| 12 | 4 | 700 | 0.02 | 100 | 7.0 | 933.3 |
Tube lengths are 10.3, 9.8, 10.2, and 9.9 cm, respectively.
†Spectral resolution.
‡Number of scans averaged.
The decomposition of \ceCH4 is an important issue for high-temperature measurements [49]. To decrease the potential for loss of \ceCH4, we added 10 Torr of \ceH2 into the first gas cell at room temperature. The main product of \ceCH4 + CH4 bimolecular dissociation in the absence of \ceH2 is \ceCH3, but in the presence of \ceH2 gas as a third-body component, \ceCH4 will reform. In other words, \ceH2 gas will decrease the amount of decomposition by increasing the back reaction. Additionally, 10 Torr of \ceH2 has a negligible pressure-broadening effect. The volume mixing ratios of these gases can be calculated through minimizing Gibbs free energy which is dependent on the temperature, pressure, and gas concentrations. Therefore, we used the online thermodynamical simulator222http://navier.engr.colostate.edu/code/code-4/index.html to calculate the fraction of decomposition of pure \ceCH4 at different temperatures and pressures. Table 3 (case 1) represents the thermodynamic mixing ratios of 0.8 Torr of pure \ceCH4. Note that these calculations are done up to 900 K while the maximum laboratory temperature in this work is 700 K. Thermal decomposition of pure \ceCH4 is predicted to occur for temperatures 700 K and above but is suppressed by the mixture of a small amount of \ceH2. Ultimately, no significant decrease of the \ceCH4 column density was noted even at 700 K. In this study, the line assignments and the line positions of \ceCH4 were adopted from HITRAN2016 [50, 51].
| (K) | \ceCH4() | \ceH2() | \ceC2H2() | \ceC2H4() |
| Case 1: pure (100) 0.8 Torr of \ceCH4 at 300 K ‡ | ||||
| 300 | 100 | 0.0 | 0.0 | 0.0 |
| 500 | 99.9 | 0.01 | 0.0 | 0.0 |
| 700 | 98.6 | 0.9 | 0.0 | 0.5 |
| 900 | 81.2 | 13.1 | 1.7 | 4.0 |
| Case 2: 0.8 (7.4) \ceCH4 in 10.0 Torr (92.6) \ceH2 at 300 K †† | ||||
| 300 | 7.4 | 92.6 | 0.0 | 0.0 |
| 500 | 7.4 | 92.6 | 0.0 | 0.0 |
| 700 | 7.4 | 92.6 | 0.0 | 0.0 |
| 900 | 7.4 | 92.6 | 0.0 | 0.0 |
†These mixing ratios are calculated by minimizing the Gibbs free energy of an ideal gas mixture.
‡The reported pressure in each case is for 300 K. and at high temperatures are calculated using ideal gas law.
†† In this study, 10 Torr of \ceH2 gas added in order to suppress the \ceCH4 decomposition.
The \ceCH4 and \ceH2 gases were 99.99 and obtained from Matheson. The gas pressure while filling the sample tubes was measured using two different MKS Baratron pressure gauges (maximum range 100 and 1000 Torr). For controlling the temperature, heat tapes from BriskHeat company (Type BW0) were used. A thermocouple connected to each gas cell was used in a feedback loop with the heat-tape controller to maintain a constant temperature. Omega company states typical uncertainties as 0.1 of the displayed reading for their digital readers. The uncertainty for type K probes is estimated to be 0.75 (2.2 K at 300 K). Therefore, the overall uncertainty is due to the probe, not the reader, and T is good to within 2 K at the location of the junction. There is a possibility of temperature nonuniformity in our gas cell. We expect this effect to be small given the high heating-element coverage of the cell excluding the transmitting windows but including its support structure, the small size of the cell, and its vacuum environment. The uncertainty in the measurement of and is less than 0.5, and is also negligible.
3 Data Analysis
Our main goal is to extract pressure-induced broadening coefficients by modeling all lines with Voigt line profiles. Lorentzian and temperature-dependence coefficients for each rovibrational line are determined from linewidths extracted from spectra 1–12 using a least-squares fitting method. The signal-to-noise ratio (S/N) is insufficiently high to justify modeling the spectra with non-Voigt profiles.
The negligibly pressure-broadened sample tube 1 was analyzed first to determine the correct \ceCH4 line assignments, wavenumber calibration, and the presence of other \ceCH4 bands and other contaminant species. Line strengths were determined separately at each measured temperature. The highly-blended pressure-broadened spectra were analyzed with line strengths fixed to their unbroadened values and line widths and positions freely modified.
3.1 Continuum / baseline fitting
All \ceCH4 spectra were converted from their interferograms with a Boxcar apodization using the OPUS software333www.bruker.com. The effect of instrumental broadening was modeled using a custom fitting code as a sinc function [52]. The background continuum is also modeled using cubic splines optimised during the least-squares fitting procedure [53]. Additionally, interference between the two cell windows that affects the recorded spectra by introducing sinusoidal behavior into the spectral continuum. We modeled this interference effect by employing two sine functions scaling the modeled spectrum.
3.2 Line position corrections
Line assignments are determined from the recent version of HITRAN [51, 50]. All corresponding line positions from HITRAN were input into the fitting code, and a global fit was made to calculate a single global shift induced by any slight miscalibration of the spectrometer. Afterward, the calculated shift was applied to our low pressure spectra (i.e., spectra 1–3 in Table 2). Later, the corrected/shifted line positions from the low pressure spectra were used to fit high pressure spectra (i.e., spectra 4–12 in Table 2), where pressure-induced lineshifts were also evident.
3.3 Line profiles
At very low pressure, the effect of collisions on molecular spectra is negligible. However, molecular velocities are distributed according to the Maxwell–Boltzmann statistics resulting in Doppler broadening (see chapter 1 at [54]). The Doppler half-width at half-maximum (HWHM) linewidth () were individually modeled using Gaussian line profile :
| (1) |
| (2) |
where is the molar mass of the absorber molecule in grams, is the Avogadro constant, is the Boltzmann constant, and is the line position or the energy gap between quantum levels and in any arbitrary energy unit (e.g., cm-1). values for our various measurements are in the range 0.004 – 0.007 cm-1 given the dependence of on the temperature and wavenumber. The natural radiative linewidth of the \ceCH4 band is 10-9 cm-1 (i.e., in the range of 10–100 Hz) [55], which is fully negligible when fitting the spectra.
Since the intensity of each line is distributed as a result of pressure-broadening, we increased the column density of \ceCH4 when a high \ceH2 pressure is present in order to obtain optimal S/N ratios without saturating any lines. As a result of this change, the modeled \ceCH4 optical depth of high-pressure spectra (i.e., spectrum 4–12) were scaled up uniformly.
The Lorentzian HWHM linewidth and lineshift were fitted individually for each line using the Lorentzian line profile :
| (3) |
| (4) |
| (5) |
in which (cm-1/atm) and nT are the Lorentzian linewidth coefficient and its temperature-dependence coefficient, respectively. (cm-1/atm) and are the Lorentzian lineshift coefficient and its temperature-dependence coefficient, respectively. is a reference temperature, and it is set equal to 300 K. Note, all these coefficients are dependent on the total rotational quantum number of , tetrahedral (T) symmetry species, and the broadeners. The code computes the Voigt profile as the Faddeeva function.444http://ab-initio.mit.edu/wiki/index.php/Faddeeva_Package
The Lorentzian coefficients , extracted from the recorded spectra result from the effect of collisional-induced broadening. The pressure-broadening from \ceCH4 self broadening is negligible since 1.1. Regarding Dicke narrowing, this effect becomes important at intermediate pressures or the Doppler–Lorentzian transition region because Doppler broadening at low pressures and Lorentzian broadening at high pressures mask the narrowing. For example, Pine [35] found the largest discrepancy between Voigt and Rautian at 50 Torr \ceH2, and a corresponding 5 difference in the derived for the two cases. This difference will be reduced by about half at 100 Torr (the lowest pressure we use). Then our Lorentzian linewidths fitted at 100 Torr may be underestimated by up to 3 (in comparison with random fitting uncertainties of at 4 or more).
4 Results and Discussion
4.1 Pressure broadening coefficients: and
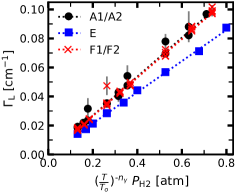
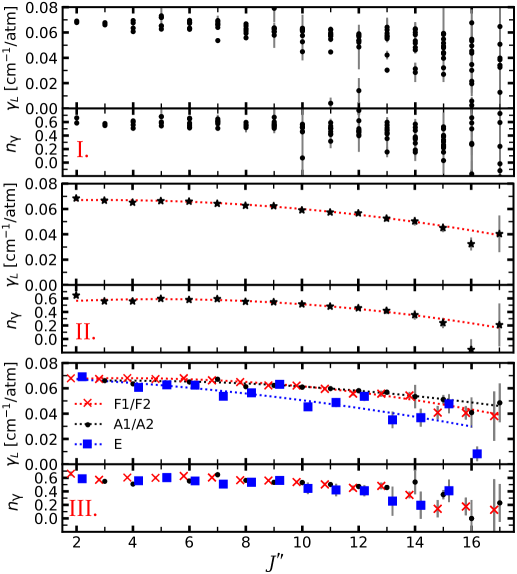
After fitting all 12 spectra from 300 to 700 K, the Lorentzian HWHM (i.e., in Eq. 4) is extracted for each tetrahedral rovibrational transition555 Each tetrahedral transition is labelled by total rotational quantum number , symmetry species , and quantum index [48].. Then, the and coefficients are computed in three different ways: 1) for all lines individually including its own , symmetry and numbers, 2) averaged over lines with the same but different symmetry and index (i.e., the multiplicity index), and 3) all lines with the same and symmetry but different index were fitted. As a sample fitting, Fig. 4 illustrates versus (T/300 K) for =7 and different symmetry species ( is computed below). Figure 4 shows the fitted slope (i.e., ) of transitions with / and / is higher than for the symmetry lines.
Figure 5(I–III) illustrates the trend of and with . Figure 5(I) represents and fitted to all lines individually. At each value, there is the scatter of both and coefficients which arise from the difference between T symmetries, indexes, and random fitting errors. In the first analysis step, individual lines with the same from all spectra were fitted to extract the and coefficients data. From this we determine the Lorentzian linewidth of each individual line as a result of \ceH2 collisional impact. Figures 4 and 5(I) as well as the supplementary Table (S1) represent these results. The error bars shown in these figures and the table uncertainties are due to the fitting uncertainties, noise, and the low signal-to-noise of some lines. These line-by-line coefficients are the main outcome of this study and they can be utilized in generating absorption cross-section (or opacity) data the standard HITRAN code666i.e. HITRAN Application Programming Interface (HAPI) [56], https://github.com/hitranonline/hapi or the NASA Ames Freedman’s code [19, 57].
In contrast, if we average the coefficients for all lines with the same value, then and coefficients fall in the range of 0.07–0.03 and 0.65–0.25, respectively (see Fig. 5(II) and Table 4). In Table 4, the scatter of these coefficients are mostly due to the scattering of lines with the same but different symmetries and dependencies, as well as, the uncertainty in fitting the Lorentzian linewidths from the recorded spectra. Another motivation for this step is to provide data for opacity codes which input only -dependent pressure-broadening values such as the current version of EXOCROSS code777https://github.com/Trovemaster/exocross[58]. Figure 5(II) shows that there is a clear dependency of the Lorentzian coefficient and its temperature-dependence with ( and ) on . This data are also presented in Table 4, and the range of scatter for each one is shown as a range of – and –. According to the Anderson collisional theory [40], the coefficient is expected to be 0.5; however, our analysis shows that coefficients deviate from this value by up to 30. We also find that and decrease by 25 and 80 , respectively, between =2 and 17 in agreement with the trend calculated by Neshyba et al. [45] and Gabard [44].
Next, we grouped the lines with similar symmetries, and extracted the Lorentzian coefficients from each group. Figure 5(III) shows the symmetry-dependence of and . The bars shown in this figure are due to the uncertainty in fitting this data (similar to Fig. 5(III)) and also the scatter imposed by different values of the quantum index. It should be noted that only some symmetry- combinations have multiple values. Therefore, two kinds of uncertainties are shown in Table 7: statistical fitting uncertainties for singular- values, and the range of scatter for values averaged over mutiple transitions. In general, within each manifold, -lines are the weakest and also have the narrowest Lorentzian linewidth . In contrast, lines with and symmetries are generally the strongest, and have the broadest linewidth.
Following the complex Robert-Bonamy theory[59], Neshyba et al. [45] calculated the impact of electrostatic and atom-atom intermolecular potential on the line broadening and line shift of the \ceCH4@[\ceN2] system. They found that the atom–atom potential component is the main reason for the line broadening with a corresponding decrease with increasing total angular momentum, . In addition, the broadening effect is symmetry dependent and it was shown [60, 47, 44] the total collisional cross-section for symmetry is lower than for and at low , which results in smaller perturbation and collisional-broadening for the -symmetry species, as we observed.).
| – | – | † | |||||
| 1 | 2 | 0.069 | 0.068–0.069 | 0.65 | 0.59–0.66 | ||
| 2 | 3 | 0.067 | 0.066–0.068 | 0.56 | 0.55–0.57 | 0.0040(5) | 1.4(5) |
| 3 | 4 | 0.065 | 0.061–0.068 | 0.56 | 0.51–0.60 | 0.0035(4) | 1.2(3) |
| 4 | 5 | 0.066 | 0.063–0.067 | 0.60 | 0.54–0.68 | 0.0032(4) | 1.0(3) |
| 5 | 6 | 0.066 | 0.063–0.068 | 0.58 | 0.55–0.63 | 0.0041(4) | 1.1(3) |
| 6 | 7 | 0.064 | 0.054–0.067 | 0.59 | 0.51–0.65 | 0.0038(7) | 1.5(6) |
| 7 | 8 | 0.063 | 0.057–0.061 | 0.55 | 0.54–0.57 | 0.0031(5) | 1.2(4) |
| 8 | 9 | 0.063 | 0.062–0.063 | 0.55 | 0.53–0.56 | 0.0035(5) | 1.5(5) |
| 9 | 10 | 0.059 | 0.045–0.062 | 0.52 | 0.44–0.54 | 0.0030(8) | 1.6(9) |
| 10 | 11 | 0.058 | 0.049–0.060 | 0.48 | 0.42–0.52 | 0.0027(5) | 1.6(6) |
| 11 | 12 | 0.057 | 0.054–0.058 | 0.46 | 0.41–0.47 | 0.0032(8) | 1.9(9) |
| 12 | 13 | 0.053 | 0.035–0.057 | 0.42 | 0.25–0.48 | ||
| 13 | 14 | 0.051 | 0.037–0.054 | 0.36 | 0.20–0.54 | ||
| 14 | 15 | 0.046 | 0.041–0.051 | 0.24 | 0.14–0.41 | ||
| 15 | 16 | 0.043‡ | 0.24‡ | ||||
| 16 | 17 | 0.041 | 0.038–0.049 | 0.20 | 0.14–0.65 |
Note:
⋆ – and – represent the range of coefficients before averaging over symmetry and . Only the lines with high S/N ratios are considered for extracting the Lorentzian pressure-shift coefficients ( and ).
†The scattering in the pressure-shift coefficients arises from their dependencies into the symmetry and .
‡The extracted values of and for =16 are 0.0324(51) and -0.2(1), which are out of the trend. Therefore, these values are replaced with the expected values from the polynomial equation 8 due to the weakness of the lines.
4.2 Lorentzian temperature-dependence coefficient:
According to early Anderson collisional theory [40, 61] a broadened line has a Lorentzian profile (Eq. 3), and the broadening linewidth is proportional to T-0.5 following Eqs. 6 and 7:
| (6) |
where is the broadener column density (i.e., == ), is the mean thermal velocity from Maxwell-Boltzmann distribution (i.e., where is the \ceH2 mass), and is the real component of the collisional cross-section (see discussion in [62]).
| (7) |
Following Eqs. 6 7, the temperature-dependence coefficient, is 0.5. Note, there are different assumptions at play in Eq. 7 including the hard-sphere approximation, ideal gas law, and also a single thermal velocity for all broadeners. Therefore, this =0.5 value should be considered as a gas kinetic value, and a more sophisticated picture is reviewed by Gamache and Vispoel [63]. Our results show that strongly depends on , and it is in the range of 0.65–0.2 (see Fig. 5(II)). No significant dependence of on the tetrahedral symmetry species is found.
Table 5 lists most previous temperature-dependence measurements of \ceCH4 in different broadeners. In addition, the measurements are for different fundamental and combination vibrational modes providing insight into the vibrational dependency of . The of \ceCH4@[\ceN2] and \ceCH4@[Air] falls in the range of 0.55–1.0 and 0.4–0.9, respectively, which are roughly 30 larger than our results for \ceCH4@[\ceH2]. In comparison, \ceCH4@[\ceHe] is about half that of \ceCH4@[\ceH2]. Table 5 also illustrates the slight vibrational-dependency of for various broadeners.
| Broadener | T[K] | Band | Lines | † | Ref. |
| \ceH2 | 300 – 700 | 116 | 0.2 – 0.65 | PS‡ | |
| 77 – 295 | 6,5 | 2 | 0.45, 0.53 | [64] | |
| 130 – 295 | 6 | 0.46 – 0.51 | [65, 66] | ||
| 161 – 295 | 6 | 0.35 – 0.52 | [67] | ||
| Air | 200 – 300 | 3 | 0.62 – 1.0 | [46] | |
| 211 – 314 | 148 | 0.50 – 0.80 | [47] | ||
| 212 – 297 | 130 | 0.50 – 0.85 | [68] | ||
| 212 – 297 | 406 | 0.50 – 0.90 | [68] | ||
| 212 – 297 | 71 | 0.40 – 0.85 | [68] | ||
| \ceN2 | 215 – 297 | 3 | 0.94 – 0.97 | [43] | |
| 215 – 297 | 2 | 0.86, 0.92 | [43] | ||
| 77 – 295 | 6,5 | 2 | 0.77, 0.97 | [64] | |
| 130 – 295 | 6 | 0.75 – 0.83 | [65, 66] | ||
| 161 – 295 | 6 | 0.71 – 0.82 | [67] | ||
| 211 – 314 | 148 | 0.55 – 0.85 | [47] | ||
| 90 – 296 | 4 | 0.84 – 0.86 | [69] | ||
| Self | 77 – 295 | 6,5 | 2 | 0.84, 0.93 | [64] |
| \ceHe | 77 – 295 | 6,5 | 2 | 0.37, 0.67 | [64] |
| 130 – 295 | 6 | 0.28 – 0.38 | [65, 66] | ||
| 161 – 295 | 6 | 0.26 – 0.38 | [67] | ||
| \ceAr | 130 – 295 | 2 | 0.80 – 0.83 | [65, 66] | |
| 161 – 295 | 6 | 0.72 – 0.82 | [67] |
† coefficients are reported within a range due to their dependency on and vibrational quantum numbers. In this table, the reported in some cases are extracted from a few transitions.
‡ Present Study
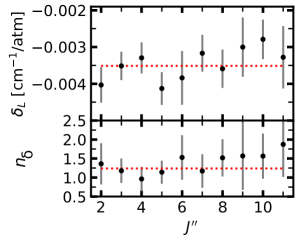
4.3 Lorentzian line-shift coefficients: and
The S/N ratio in the current study is insufficiently high to extract pressure shifts for all lines. Hence, a pressure-shift coefficient is calculated only for lines with =2–11, and falls in the range of to cm-1/atm. We discern no significant dependence of the Lorentzian pressure-shift coefficients on the values (Fig. 6), and the mean value of and are 0.0035 cm-1/atm and 1.24, respectively. The reported uncertainties for Lorentzian pressure-shift coefficients ( and ) are due to the scatter of the symmetry- and -dependency. Note that our is larger than , and this difference has been reported for water self-broadening as well [70].
The form of Eq. 5 is based on Eq. 4, which is derived from the ideal gas law and hard-sphere approximation. Some studies of other systems such as Frost [41] and Baldacchini et al. [71] have shown temperature-dependence has more complex form than our selected formula in Eq. 5. Additionally, Smith et al. [47] found both positive and negative and values for the \ceCH4 band. However, we exclusively observed negative and positive values.
4.4 Global equations for Lorentzian coefficients
In order to provide Lorentzian broadening coefficients ( and ) appropriate for high-temperature \ceH2-dominanted exoatmospheres (i.e., super-Earth or warm-Neptunes with 400–900 K temperature), the dependency of these coefficients with is presented by fitting the experimental results to a second-order polynomial -dependence (e.g., Eq. 8 see the red-dashed line in Fig. 5(II)). Additionally, due to the significant dependence of on the symmetry species, the fitting coefficients are extracted from them separately (i.e., Eq. 9 dashed lines in Fig. 5(III)) conforming to:
| (8) |
| (9) |
where , , and are the fitted constants, is the Lorentzian coefficient i.e., , , and “sym” can be , , or symmetry species. All the polynomial fitted constants are presented in Table 6.
| Case | |||
| () | 0.066 | 0.0008 | 0.00014 |
| () | 0.520 | 0.0290 | 0.00290 |
| (, ) | 0.0657 | 0.0012 | 0.00017 |
| (, ) | 0.0650 | 0.0007 | 0.00011 |
| (, ) | 0.0690 | 0.0010 | 0.00010 |
4.5 Comparison with existing data
Since \ceCH4 is an important molecule in the atmosphere of the Earth, other planets, and brown dwarfs, many experiments have been carried out for broadeners in the atmosphere of Earth (i.e., \ceN2 and \ceO2), Jupiter (i.e., \ceH2 and \ceHe), and other broadeners such as Ar- and self-broadening. In the following, we will discuss the comparison of our results with the most relevant literature data.
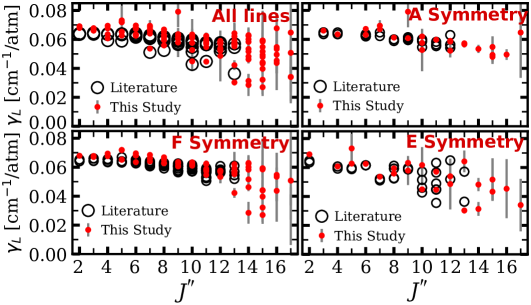
Figure 7 represents the comparison of our results with the literature data [72, 35, 65, 66, 73] for the \ceCH4@[\ceH2] band. Note that most of the previous studies have been for the branch [72, 35] and employed Rautian line profiles; while there are a few measurements on the branch [65, 73], none employ \ceH2 as a broadener. Figure 7 (I,II) shows the comparison of all lines with their -, symmetry- and -dependencies. In Fig. 7 (II), the Pine [72] results are slightly lower than ours which might be due to the selection of different line profiles and branches. In Fig. 7, a comparison of lines within different symmetry classes is shown.
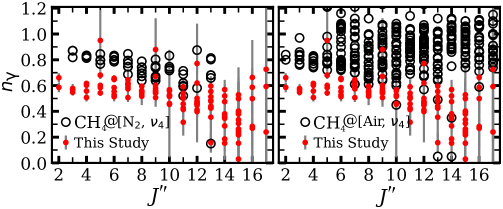
Figure 8 illustrates the comparison between our temperature-dependence coefficients (i.e., \ceCH4@[\ceH2] for branch) with both \ceCH4@[\ceN2] and \ceCH4@[Air] for band. Note, there are a two differences between these measurements: 1) our broadener \ceH2 is different from the previous works, 2) there might be some vibrational-dependency of . In general our coefficients (@[\ceH2]) is smaller than both @[Air]-broadening and @[\ceN2]-broadening 5.
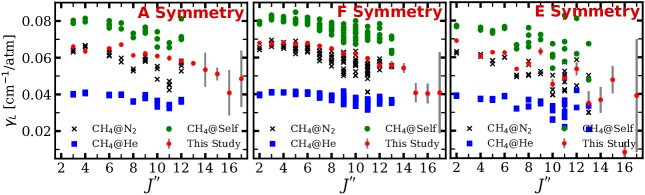
Figure 9 represents the effect of various broadeners (i.e., self or \ceCH4, \ceN2, and \ceHe) on for different symmetry species [72, 35, 65, 66, 73, 43]. In general (Self) (\ceH2) (\ceN2) (\ceHe). In earlier work [42], electrostatic forces (dipole, quadrupoles, and higher-order multipoles) were theorised to cause the differing broadening effects of various broadeners (or perturbers) on \ceCH4. However, the quadrupole moments of \ceO2 and \ceN2 could not explain their similar broadening of \ceCH4 (e.g., [43]), given that their quadrupole moments differ by a factor of 3. Later, Neshyba et al. [45] showed that in fact atom-atom interactions supplant electrostatic interactions is a minor reason, and atom–atom interaction is the major source of broadening using Robert-Bonamy theory [59] (see the theory section in Ref. [44]).
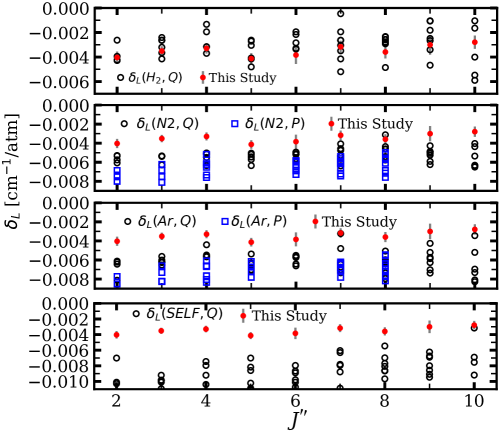
Figure 10 compares our Lorentzian pressure-shift results branch, see Table 4) with literature values for different broadeners and branches. The reported are averaged over of , and they are in the range of the Pine [35] -branch data. In addition, this figure shows that the collisional effect of \ceN2 and \ceAr species on pressure shift is larger than \ceH2. The largest , however, would be due to the \ceCH4 self-broadening interactions, and it is 2 higher than our results ().
5 Summary Conclusion
High-temperature Lorentzian broadening and shift coefficients of \ceCH4@[\ceH2] for more than 100 individual rovibrational transitions in the branch are obtained using high resolution (0.01–0.005 cm-1) FTIR spectroscopy. We find that falls in the range 0.03–0.07 cm-1/atm, and is strongly dependent on molecular rotation and symmetry dependent. The temperature-dependence broadening coefficient, falls in the range 0.20–0.65. The averaged shift pressure and its temperature-dependence coefficient, and are 0.0035 cm-1/atm and 1.24, respectively, and these are constant with J as far as our data can determine.
All these coefficients were fitted to simple polynomial equations in terms of and neglecting symmetry and quantum index for the benefit of the astrophysical/exoplanetary community. Table S1 lists the and for all individual lines, showing the change in these coefficients with , symmetry, and numbers, and is recommended to use these data where these details are important. The detection of \ceCH4 spectral features in hot-Jupiters to super-Earths needs these pressure-broadening data because of their high-temperature and \ceH2-dominant atmospheres.
These pressure-broadening and pressure-shift coefficients can be directly incorporated into current databases, such as HITRAN/HITEMP or EXOMOL.
6 Acknowledgment
We kindly thank Glenn Stark, David Wright, Adam Schneider, and the Arizona State University exoplanet group for many useful discussions. E.G.N. especially thanks Mike Line for invaluable numerous invalvuable discussions during this work as well as Richard Freedman and Mark Marley invaluable discussions regarding the intricacies of opacity data. E.G.N. acknowledges funding from the GRSP research grant from the Arizona State University Graduate office program award XH51027. A.N.H.’s research was supported by an appointment to the NASA Postdoctoral Program at Arizona State University and the NASA Astrobiology Institute, administered by Universities Space Research Association under contract with NASA. This research used resources of the Advanced Light Source, which is a DOE Office of Science User Facility under contract no. DE-AC02-05CH11231.
| Sym | [cm-1/atm] | – | – | |||
| 1 | 2 | 0.069(1) | 0.59(4) | |||
| 1 | 2 | 0.068(1) | 0.66(3) | |||
| 2 | 3 | 0.066(1) | 0.55(3) | |||
| 2 | 3 | 0.067(1) | 0.57(2) | |||
| 3 | 4 | 0.064(2) | 0.51(3) | |||
| 3 | 4 | 0.061(2) | 0.56(4) | |||
| 3 | 4 | 0.068 | 0.068–0.069 | 0.60 | 0.60–0.62 | |
| 4 | 5 | 0.063 | 0.063–0.073 | 0.60 | 0.60–0.95 | |
| 4 | 5 | 0.067 | 0.065–0.072 | 0.60 | 0.54–0.68 | |
| 5 | 6 | 0.065 | 0.063–0.067 | 0.55 | 0.53–0.58 | |
| 5 | 6 | 0.063(1) | 0.55(3) | |||
| 5 | 6 | 0.068 | 0.063–0.070 | 0.63 | 0.51–0.66 | |
| 6 | 7 | 0.067 | 0.067–0.069 | 0.65 | 0.59–0.65 | |
| 6 | 7 | 0.054(1) | 0.51(2) | |||
| 6 | 7 | 0.066 | 0.064–0.068 | 0.60 | 0.57–0.62 | |
| 7 | 8 | 0.061(1) | 0.56(2) | |||
| 7 | 8 | 0.057 | 0.056–0.059 | 0.54 | 0.52–0.53 | |
| 7 | 8 | 0.065 | 0.063–0.067 | 0.57 | 0.55–0.60 | |
| 8 | 9 | 0.062 | 0.061–0.079 | 0.53 | 0.52–0.88 | |
| 8 | 9 | 0.063 | 0.058–0.063 | 0.56 | 0.56–0.67 | |
| 8 | 9 | 0.062 | 0.061–0.064 | 0.56 | 0.51–0.60 | |
| 9 | 10 | 0.061 | 0.053–0.062 | 0.53 | 0.46–0.57 | |
| 9 | 10 | 0.045 | 0.045–0.062 | 0.44 | 0.07–0.45 | |
| 9 | 10 | 0.062 | 0.061–0.063 | 0.54 | 0.52–0.56 | |
| 10 | 11 | 0.060(2) | 0.50(3) | |||
| 10 | 11 | 0.049 | 0.045–0.057 | 0.42 | 0.41–0.43 | |
| 10 | 11 | 0.060 | 0.055–0.059 | 0.50 | 0.32–0.59 | |
| 11 | 12 | 0.058 | 0.052–0.059 | 0.47 | 0.46–0.50 | |
| 11 | 12 | 0.054 | 0.049–0.054 | 0.41 | 0.40–0.62 | |
| 11 | 12 | 0.056 | 0.055–0.058 | 0.45 | 0.41–0.77 | |
| 12 | 13 | 0.057(1) | 0.46(3) | |||
| 12 | 13 | 0.035 | 0.030–0.064 | 0.25 | 0.16–0.48 | |
| 12 | 13 | 0.056 | 0.055–0.062 | 0.48 | 0.36–0.60 | |
| 13 | 14 | 0.053(9) | 0.54(18) | |||
| 13 | 14 | 0.037 | 0.031–0.048 | 0.19 | 0.19–0.29 | |
| 13 | 14 | 0.054 | 0.052–0.063 | 0.35 | 0.15–0.57 | |
| 14 | 15 | 0.051 | 0.049–0.055 | 0.35 | 0.22–0.50 | |
| 14 | 15 | 0.048 | 0.043–0.052 | 0.41 | 0.31–0.40 | |
| 14 | 15 | 0.041 | 0.027–0.059 | 0.14 | 0.15–0.53 | |
| 15 | 16 | 0.048† | 0.041–0.068 | 0.24† | 0.24–0.59 | |
| 15 | 16 | 0.027‡ | 0.24‡ | |||
| 15 | 16 | 0.041 | 0.041–0.053 | 0.19 | 0.24–0.66 | |
| 16 | 17 | 0.049 | 0.045–0.065 | 0.24 | 0.18–0.59 | |
| 16 | 17 | 0.039 | 0.023–0.034 | 0.65 | 0.18–0.73 | |
| 16 | 17 | 0.038 | 0.037–0.051 | 0.14 | 0.18–0.24 |
Note:
⋆ The uncertainties in parentheses (in units of the least-significant digit) are derived from the estimated uncertainty of fitted linewidths. These are not well defined where lines of differing quantum index, , have been averaged and instead the range of parameters for individual lines is given as – and –. †Extracted values of and for =16 are 0.041(12) and -0.00(27), which are out of the trend. Therefore, these values are replaced with the expected values from the polynomial equation 9 due to the weakness of the lines.
‡The extracted values of and for =16 are 0.008(6) and -1.50(66), which are out of the trend. Therefore, these values are replaced with the expected values from the polynomial equation 9 due to the weakness of the lines.
7 Reference
References
- Krasnopolsky et al. [2004] V. A. Krasnopolsky, J. P. Maillard, T. C. Owen, Detection of methane in the martian atmosphere: evidence for life?, Icarus 172 (2) (2004) 537–547, ISSN 0019-1035.
- Lyons et al. [2005] J. R. Lyons, C. Manning, F. Nimmo, Formation of methane on Mars by fluid-rock interaction in the crust, GRL 32 L13201.
- Orton et al. [2014a] G. S. Orton, J. I. Moses, L. N. Fletcher, A. K. Mainzer, D. Hines, H. B. Hammel, J. Martin-Torres, M. Burgdorf, C. Merlet, M. R. Line, Mid-infrared spectroscopy of Uranus from the Spitzer infrared spectrometer: 2. Determination of the mean composition of the upper troposphere and stratosphere, Icarus 243 (2014a) 471–493, ISSN 0019-1035.
- Orton et al. [2014b] G. S. Orton, L. N. Fletcher, J. I. Moses, A. K. Mainzer, D. Hines, H. B. Hammel, F. J. Martin-Torres, M. Burgdorf, C. Merlet, M. R. Line, Mid-infrared spectroscopy of Uranus from the Spitzer Infrared Spectrometer: 1. Determination of the mean temperature structure of the upper troposphere and stratosphere, Icarus 243 (2014b) 494–513, ISSN 0019-1035.
- Atreya et al. [2003] S. K. Atreya, P. R. Mahaffy, H. B. Niemann, M. H. Wong, T. C. Owen, Composition and origin of the atmosphere of Jupiter - An update, and implications for the extrasolar giant planets, Planetary and Space Science 51 (2) (2003) 105–112, ISSN 00320633.
- Lodders [2010] K. Lodders, Exoplanet Chemistry, 157, 2010.
- Marley and Robinson [2015] M. S. Marley, T. D. Robinson, On the Cool Side: Modeling the Atmospheres of Brown Dwarfs and Giant Planets, ARAA 53 (2015) 279–323, ISSN 0066-4146.
- Fortney [2012] J. J. Fortney, On the Carbon-to-oxygen Ratio Measurement in nearby Sun-like Stars: Implications for Planet Formation and the Determination of Stellar Abundances, ApJL 747 L27.
- Venot et al. [2014] O. Venot, M. Agúndez, F. Selsis, M. Tessenyi, N. Iro, The atmospheric chemistry of the warm Neptune GJ 3470b: Influence of metallicity and temperature on the CH4/CO ratio, A&A 562 (2014) A51, ISSN 0004-6361.
- Kreidberg et al. [2018] L. Kreidberg, M. R. Line, D. Thorngren, C. V. Morley, K. B. Stevenson, Water, High-altitude Condensates, and Possible Methane Depletion in the Atmosphere of the Warm Super-Neptune WASP-107b, AJ 858 (1) (2018) L6, ISSN 2041-8213.
- Burgasser et al. [2006] A. J. Burgasser, T. R. Geballe, S. K. Leggett, J. D. Kirkpatrick, D. A. Golimowski, A Unified Near‐Infrared Spectral Classification Scheme for T Dwarfs, AJ 637 (2) (2006) 1067–1093, ISSN 0004-637X.
- Line et al. [2011] M. R. Line, G. Vasisht, P. Chen, D. Angerhausen, Y. L. Yung, Thermochemical and Photochemical Kinetics in Cooler Hydrogen-dominated Extrasolar Planets: A Methane-poor GJ436b?, ApJ 738 32.
- Kreidberg et al. [2018] L. Kreidberg, M. R. Line, D. Thorngren, C. V. Morley, K. B. Stevenson, Water, High-altitude Condensates, and Possible Methane Depletion in the Atmosphere of the Warm Super-Neptune WASP-107b, APJL 858 L6.
- Swain et al. [2010] M. R. Swain, P. Deroo, C. A. Griffith, G. Tinetti, A. Thatte, G. Vasisht, P. Chen, J. Bouwman, I. J. Crossfield, D. Angerhausen, C. Afonso, T. Henning, A ground-based near-infrared emission spectrum of the exoplanet HD189733b, Nature 463 (2010) 637–639.
- Désert et al. [2009] J.-M. Désert, A. Lecavelier des Etangs, G. Hébrard, D. K. Sing, D. Ehrenreich, R. Ferlet, A. Vidal-Madjar, Search for Carbon Monoxide in the Atmosphere of the Transiting Exoplanet HD 189733b, ApJ 699 (2009) 478–485.
- Wang et al. [2018] J. Wang, D. Mawet, J. J. Fortney, C. Hood, C. V. Morley, B. Benneke, Detecting Water in the Atmosphere of HR 8799 c with L-band High-dispersion Spectroscopy Aided by Adaptive Optics, AJ 156 272.
- Moses et al. [2013] J. I. Moses, M. R. Line, C. Visscher, M. R. Richardson, N. Nettelmann, J. J. Fortney, T. S. Barman, K. B. Stevenson, N. Madhusudhan, Compositional Diversity in the Atmospheres of Hot Neptunes, with Application to GJ436b, ApJ 777 (1) (2013) 34, ISSN 0004-637X.
- Brogi and Line [2019] M. Brogi, M. R. Line, Retrieving Temperatures and Abundances of Exoplanet Atmospheres with High-resolution Cross-correlation Spectroscopy, AJ 157 (3) (2019) 114.
- Freedman et al. [2014] R. S. Freedman, J. Lustig-Yaeger, J. J. Fortney, R. E. Lupu, M. S. Marley, K. Lodders, Gaseous mean opacities for giant planet and ultracool dwarf atmospheres over a range of metallicities and temperatures, ApJS 214 (2), ISSN 00670049.
- Gharib-Nezhad and Line [2019] E. Gharib-Nezhad, M. R. Line, The Influence of H2O Pressure Broadening in High-metallicity Exoplanet Atmospheres, ApJ 872 (1) (2019) 27.
- Fortney et al. [2019] J. J. Fortney, T. D. Robinson, S. Domagal-Goldman, A. D. Del Genio, I. E. Gordon, E. Gharib-Nezhad, et. al., The Need for Laboratory Measurements and Ab Initio Studies to Aid Understanding of Exoplanetary Atmospheres, arXiv e-prints .
- Bernath [2005] P. Bernath, Spectra of Atoms and Molecules, Oxford University Press, 2 edn., ISBN 9780195177596, 2005.
- Albert et al. [2009] S. Albert, S. Bauerecker, V. Boudon, L. R. Brown, J.-P. Champion, M. Loëte, A. Nikitin, M. Quack, Global analysis of the high resolution infrared spectrum of methane 12CH 4 in the region from 0 to 4800 cm -1, Chemical Physics 356 (2009) 131–146.
- Campargue et al. [2013] A. Campargue, O. Leshchishina, L. Wang, D. Mondelain, S. Kassi, The WKLMC empirical line lists (5852–7919cm−1) for methane between 80K and 296K: “Final” lists for atmospheric and planetary applications, JMS 291 (2013) 16–22, ISSN 0022-2852.
- Wong et al. [2019] A. Wong, P. F. Bernath, M. Rey, A. V. Nikitin, V. G. Tyuterev, Atlas of Experimental and Theoretical High-temperature Methane Cross Sections from T=295 to 1000 K in the Near-infrared, ApJS 240 4.
- Hargreaves et al. [2015] R. J. Hargreaves, P. F. Bernath, J. Bailey, M. Dulick, Empirical Line Lists and Absorption Cross Section for Methane at High Temperatures, ApJ 813 (1) (2015) 12, ISSN 1538-4357.
- Nassar and Bernath [2003] R. Nassar, P. Bernath, Hot methane spectra for astrophysical applications, JQSRT 82 (1-4) (2003) 279–292, ISSN 00224073.
- Perrin and Soufiani [2007] M.-Y. Perrin, A. Soufiani, Approximate radiative properties of methane at high temperature, JQSRT 103 (1) (2007) 3–13, ISSN 00224073.
- Hargreaves et al. [2012] R. J. Hargreaves, C. A. Beale, L. Michaux, M. Irfan, P. F. Bernath, Hot Methane Line Lists for Exoplanet and Brown Dwarf Atmospheres, ApJ 757 (1) (2012) 46, ISSN 0004-637X.
- Thiévin et al. [2008] J. Thiévin, R. Georges, S. Carles, A. Benidar, B. Rowe, J.-P. Champion, High-temperature emission spectroscopy of methane, JQSRT 109 (11) (2008) 2027–2036, ISSN 00224073.
- Ba et al. [2013] Y. A. Ba, C. Wenger, R. Surl1eau, V. Boudon, L. Daumont, D. A. Bonhommeau, V. G. Tyuterev, M.-L. Dubernet, MeCaSDa and ECaSDa: Methane and ethene calculated spectroscopic databases for the virtual atomic and molecular data centre, JQSRT 130 (2013) 62–68, ISSN 0022-4073.
- Nikitin et al. [2015] A. Nikitin, O. Lyulin, S. Mikhailenko, V. Perevalov, N. Filippov, I. Grigoriev, I. Morino, Y. Yoshida, T. Matsunaga, GOSAT-2014 methane spectral line list, JQSRT 154 (2015) 63–71, ISSN 00224073.
- Rey et al. [2017] M. Rey, A. V. Nikitin, V. G. Tyuterev, Accurate Theoretical Methane Line Lists in the Infrared up to 3000 K and Quasi-continuum Absorption/Emission Modeling for Astrophysical Applications, ApJ 847 (2) (2017) 105, ISSN 1538-4357.
- Rey et al. [2018] M. Rey, A. V. Nikitin, B. Bézard, P. Rannou, A. Coustenis, V. G. Tyuterev, New accurate theoretical line lists of 12CH4 and 13CH4 in the 0–13400cm−1 range: Application to the modeling of methane absorption in Titan’s atmosphere, Icarus 303 (2018) 114–130, ISSN 0019-1035.
- Pine [1992] A. S. Pine, Self-, N2, O2, H2, Ar, and He broadening in the band branch of CH4, JCP 97 (1992) 773–785.
- Pine and Gabard [2003] A. Pine, T. Gabard, Multispectrum fits for line mixing in the 3 band Q branch of methane, JMS 217 (1) (2003) 105–114, ISSN 0022-2852.
- Fox and Jennings [1985] K. Fox, D. E. Jennings, Measurements of nitrogen-, hydrogen- and helium-broadened widths of methane lines at 9030–9120 cm-1, JQSRT 33 (3) (1985) 275–280, ISSN 0022-4073.
- Fox et al. [1988] K. Fox, D. E. Jennings, E. A. Stern, R. Hunnard, Measurements of argon-, helium-, hydrogen-, and nitrogen-broadened widths of methane lines near 9000 cm−1, JQSRT 39 (6) (1988) 473–476, ISSN 0022-4073.
- Hartmann et al. [2018] J.-M. Hartmann, H. Tran, R. Armante, C. Boulet, A. Campargue, F. Forget, L. Gianfrani, I. Gordon, S. Guerlet, M. Gustafsson, J. T. Hodges, S. Kassi, D. Lisak, F. Thibault, G. C. Toon, Recent advances in collisional effects on spectra of molecular gases and their practical consequences, JQSRT 213 (2018) 178–227, ISSN 0022-4073.
- Anderson [1949] P. W. Anderson, Pressure Broadening in the Microwave and Infra-Red Regions, Phys. Rev. 76 (1949) 647–661.
- Frost [1976] B. S. Frost, A theory of microwave lineshifts, Journal of Physics B: Atomic and Molecular Physics 9 (6) (1976) 1001–1020.
- Tejwani and Varanasi [1971] G. D. T. Tejwani, P. Varanasi, Calculation of Collision-Broadened Linewidths in the Infrared Bands of Methane, JCP 55 (1971) 1075–1083.
- Devi et al. [1983] V. Devi, B. Fridovich, D. Snyder, G. Jones, P. P. Das, Tunable diode laser measurements of intensities and Lorentz broadening coefficients of lines in the ν2 band of 12CH4, JQSRT 29 (1) (1983) 45 – 47, ISSN 0022-4073.
- Gabard [2013] T. Gabard, Calculated line broadening parameters for methane perturbed by diatomic molecules, JMS 291 (2013) 61 – 68, ISSN 0022-2852.
- Neshyba et al. [1994] S. P. Neshyba, R. Lynch, R. Gamache, T. Gabard, J. Champion, Pressure‐induced widths and shifts for the ν3 band of methane, JCP 101 (11) (1994) 9412–9421.
- Varanasi [1975] P. Varanasi, Air-broadened line widths of methane at atmospheric temperatures, JQSRT 15 (3) (1975) 281, ISSN 0022-4073.
- Smith et al. [1992] M. Smith, C. Rinsland, V. Devi, D. Benner, Temperature dependence of broadening and shifts of methane lines in the band, Spectrochimica Acta Part A: Molecular Spectroscopy 48 (9) (1992) 1257–1272, ISSN 0584-8539.
- Brown et al. [1992] L. Brown, J. Margolis, J. Champion, J. Hilico, J. Jouvard, M. Loete, C. Chackerian, G. Tarrago, D. Benner, Methane and its isotopes: Current status and prospects for improvement, JQSRT 48 (5) (1992) 617 – 628, ISSN 0022-4073, special Issue Conference on Molecular Spectroscopic Databases.
- Guéret et al. [1997] C. Guéret, M. Daroux, F. Billaud, Methane pyrolysis: thermodynamics, Chemical Engineering Science 52 (5) (1997) 815 – 827, ISSN 0009-2509.
- Gordon et al. [2017] I. Gordon, L. Rothman, C. Hill, R. Kochanov, Y. Tan, P. Bernath, M. Birk, V. Boudon, A. Campargue, K. Chance, B. Drouin, J.-M. Flaud, R. Gamache, J. Hodges, D. Jacquemart, V. Perevalov, A. Perrin, K. Shine, M.-A. Smith, J. Tennyson, G. Toon, H. Tran, V. Tyuterev, A. Barbe, A. Császár, V. Devi, T. Furtenbacher, J. Harrison, J.-M. Hartmann, A. Jolly, T. Johnson, T. Karman, I. Kleiner, A. Kyuberis, J. Loos, O. Lyulin, S. Massie, S. Mikhailenko, N. Moazzen-Ahmadi, H. Müller, O. Naumenko, A. Nikitin, O. Polyansky, M. Rey, M. Rotger, S. Sharpe, K. Sung, E. Starikova, S. Tashkun, J. V. Auwera, G. Wagner, J. Wilzewski, P. Wcisło, S. Yu, E. Zak, The HITRAN2016 molecular spectroscopic database, JQSRT 203 (2017) 3–69, ISSN 00224073.
- Brown et al. [2013] L. Brown, K. Sung, D. Benner, V. Devi, V. Boudon, T. Gabard, C. Wenger, A. Campargue, O. Leshchishina, S. Kassi, D. Mondelain, L. Wang, L. Daumont, L. Régalia, M. Rey, X. Thomas, V. G. Tyuterev, O. Lyulin, A. Nikitin, H. Niederer, S. Albert, S. Bauerecker, M. Quack, J. O’Brien, I. Gordon, L. Rothman, H. Sasada, A. Coustenis, M. Smith, T. Carrington, X.-G. Wang, A. Mantz, P. Spickler, Methane line parameters in the HITRAN2012 database, JQSRT 130 (2013) 201–219, ISSN 00224073.
- Bretzlaff and Bahder [1986] R. Bretzlaff, T. Bahder, Apodization effects in Fourier transform infrared difference spectra, Revue de Physique Appliquée 21 (12) (1986) 833–844, ISSN 0035-1687.
- Burden et al. [2011] R. L. Burden, J. D. Faires, A. M. Burden, Numerical analysis, Cengage Learning US, 9th edn., ISBN 9781305253667, 2011.
- Buldyreva et al. [2011] J. Buldyreva, N. Lavrentieva, V. Starikov, Collisional Line Broadening and Shifting of Atmospheric Gases: a Practical Guide for Line Shape Modelling by Current Semi-Classical Approaches, World Scientific Publishing Co, 2011.
- Jin et al. [1993] W. Jin, S. Murray, D. Pinchbeck, G. Stewart, B. Culshaw, Absorption measurement of methane gas with a broadband light source and interferometric signal processing, Optics Letters 18 (16) (1993) 1364, ISSN 0146-9592.
- Kochanov et al. [2016] R. Kochanov, I. Gordon, L. Rothman, P. Wcisło, C. Hill, J. Wilzewski, HITRAN Application Programming Interface (HAPI): A comprehensive approach to working with spectroscopic data, Journal of Quantitative Spectroscopy and Radiative Transfer 177 (2016) 15 – 30, ISSN 0022-4073, xVIIIth Symposium on High Resolution Molecular Spectroscopy (HighRus-2015), Tomsk, Russia.
- Freedman et al. [2008] R. S. Freedman, M. S. Marley, K. Lodders, Line and Mean Opacities for Ultracool Dwarfs and Extrasolar Planets, ApJS 174 (2008) 504–513.
- Yurchenko, Sergei N. et al. [2018] Yurchenko, Sergei N., Al-Refaie, Ahmed F., Tennyson, Jonathan, EXOCROSS: a general program for generating spectra from molecular line lists, A&A 614 (2018) A131.
- Robert and Bonamy [1979] D. Robert, J. Bonamy, Short range force effects in semiclassical molecular line broadening calculations, Journal de Physique 40 (10) (1979) 923–943.
- Smith and Secrest [1981] L. N. Smith, D. Secrest, Close coupling and coupled state calculations of argon scattering from normal methane, JCP 74 (7) (1981) 3882–3897.
- Baranger [1958] M. Baranger, Simplified Quantum-Mechanical Theory of Pressure Broadening, Physical Review 111 (2) (1958) 481–493, ISSN 0031-899X.
- Lyons et al. [2018] J. Lyons, H. Herde, G. Stark, D. Blackie, J. Pickering, N. de Oliveira, VUV pressure-broadening in sulfur dioxide, JQSRT 210 (2018) 156 – 164, ISSN 0022-4073.
- Gamache and Vispoel [2018] R. R. Gamache, B. Vispoel, On the temperature dependence of half-widths and line shifts for molecular transitions in the microwave and infrared regions, JQSRT 217 (2018) 440 – 452, ISSN 0022-4073.
- Keffer et al. [1986] C. E. Keffer, C. P. Conner, W. Smith, Pressure broadening of methane lines in the 6190Åand 6825Åbands at room and low temperatures, JQSRT 35 (6) (1986) 495–499, ISSN 0022-4073.
- Varanasi [1989] P. Varanasi, Temperature Dependence of Strengths, Widths and Shifts of CH4 at Planetary Atmospheric Temperatures, BAAS 21 (1989) 961.
- Varanasi and Chudamani [1989] P. Varanasi, S. Chudamani, Measurements of collision-broadened line widths in the nu4-fundamental band of (C-12)H4 at low temperatures, JQSRT 41 (1989) 335–343.
- Varanasi and Chudamani [1990] P. Varanasi, S. Chudamani, The temperature dependence of lineshifts, linewidths and line intensities of methane at low temperatures, JQSRT 43 (1) (1990) 1–11, ISSN 0022-4073.
- Devi et al. [1994] V. Devi, D. Benner, M. Smith, C. Rinsland, Temperature dependence of Lorentz air-broadening and pressure-shift coefficients of 12CH4 lines in the 2.3-m spectral region, JQSRT 51 (3) (1994) 439–465, ISSN 0022-4073.
- Mondelain et al. [2007] D. Mondelain, S. Payan, W. Deng, C. Camy-Peyret, D. Hurtmans, A. W. Mantz, Measurement of the temperature dependence of line mixing and pressure broadening parameters between 296 and 90K in the band of 12CH4 and their influence on atmospheric methane retrievals, JMS 244 (2) (2007) 130–137, ISSN 0022-2852.
- Markov [1994] V. Markov, Temperature Dependence of Self-Induced Pressure Broadening and Shift of the 643-550 Line of the Water Molecule, JMS 164 (1) (1994) 233 – 238, ISSN 0022-2852.
- Baldacchini et al. [1996] G. Baldacchini, G. Buffa, F. D’Amato, F. Pelagalli, O. Tarrini, Variations in the sign of the pressure-induced lineshifts in the ν2 band of ammonia with temperature, JQSRT 55 (6) (1996) 741 – 743, ISSN 0022-4073.
- Pine [2019] A. Pine, Speed-dependent Line Mixing in the Band Branch of Methane, JQSRT 224 (2019) 62 – 77, ISSN 0022-4073.
- Es-sebbar and Farooq [2014] E. Es-sebbar, A. Farooq, Intensities, Broadening and Narrowing Parameters in the band of Methane, JQSRT 149 (2014) 241 – 252, ISSN 0022-4073.
- Smith et al. [2009] M. Smith, D. C. Benner, A. Predoi1-Cross, V. M. Devi, Multispectrum Analysis of 12CH4 in the band, JQSRT 110 (9-10) (2009) 639–653, ISSN 00224073.
- Pine [1997] A. S. Pine, N2 and Ar broadening and line mixing in the P and R branches of the 3 band of CH4, JQSRT 57 (1997) 157–176.