Jamming and percolation of -mers on simple cubic lattices
Abstract
Jamming and percolation of three-dimensional (3D) cubic objects (-mers) deposited on simple cubic lattices have been studied by numerical simulations complemented with finite-size scaling theory. The -mers were irreversibly deposited into the lattice. Jamming coverage was determined for a wide range of (). exhibits a decreasing behavior with increasing , being the limit value for large -mer sizes. In addition, a finite-size scaling analysis of the jamming transition was carried out, and the corresponding spatial correlation length critical exponent was measured, being . On the other hand, the obtained results for the percolation threshold showed that is an increasing function of in the range . For , all jammed configurations are non-percolating states, and consequently, the percolation phase transition disappears. The interplay between the percolation and the jamming effects is responsible for the existence of a maximum value of (in this case, ) from which the percolation phase transition no longer occurs. Finally, a complete analysis of critical exponents and universality has been done, showing that the percolation phase transition involved in the system has the same universality class as the 3D random percolation, regardless of the size considered.
pacs:
64.60.ah, 64.60.De, 68.35.Rh, 05.10.LnTo whom all correspondence should be addressed.
I Introduction
Percolation theory and cluster concepts have been extremely useful in elucidating many problems in physics Stauffer ; Sahimi ; Grimmett ; Sornette ; Bollobas . In most cases the theory predicts a geometrical transition at the percolation threshold, characterized in the percolative phase by the presence of a giant cluster, which becomes infinite in the thermodynamic limit.
One of the applications of percolation theory is connected to the study of physical and chemical properties of adsorbed monolayers. In this framework, deposition of extended objects on different surfaces is of considerable interest for a wide range of applications in biology, nanotechnology, device physics, physical chemistry, and materials science. Theoretically, several models have been developed to capture the basic physics of this situation, and by far the most studied is that of random sequential adsorption.
The random sequential adsorption (RSA), introduced by Feder Feder , has served as a paradigm for modeling irreversible deposition processes. The main features of the RSA model are Evans : (1) the objects are put on randomly chosen sites, (2) the adsorption is irreversible and (3) at any time only one object is being adsorbed, so that the process takes place sequentially. The final state generated by RSA is a disordered state (known as jamming state), in which no more objects can be deposited due to the absence of free space of appropriate size and shape. The jamming state has infinite memory of the process and the orientational order is purely local. In addition, the limiting or jamming coverage strongly depends on the shape and size of the depositing particles.
As it was mentioned, the percolation transition is based on calculating the probability of occurrence of an infinite connectivity among the elements occupying on the lattice. Thus, the jamming coverage has an important role on the percolation threshold and the interplay between jamming and percolation has been discussed in several works Evans ; Budi1 ; Budi2 ; Redner ; Stauffer ; Becklehimer ; Vandewalle ; Corne1 ; Corne2 ; Leroyer ; Bonnier ; Kondrat ; Tara2012 ; Kondrat2017 ; Slutskii ; EPJB4 ; PHYSA38 ; Nakamura86 ; Nakamura87 ; Centres2018 ; Baldosas3D . In the following, we will discuss the main results obtained on one-dimensional Stauffer ; Redner ; Evans and square plaquette lattices Becklehimer ; Vandewalle ; Corne1 ; Corne2 ; Leroyer ; Bonnier ; Kondrat ; Tara2012 ; Kondrat2017 ; Slutskii ; EPJB4 ; PHYSA38 ; Nakamura86 ; Nakamura87 ; Centres2018 ; Baldosas3D , which is the topic of this paper.
In the case of straight rigid -mers on one-dimensional (1D) lattices, the RSA problem has been exactly solved and an explicit expression for has been derived Redner . From the equation of , the dependence on of the jamming coverage can be obtained. Note that represents the fraction of lattice sites covered at time by the deposited objects and, consequently, . For , the jamming threshold tends to Rényi’s Parking constant for the continuous case Renyi . On the other hand, the percolation problem of linear -mers on 1D lattices is trivial: the percolating cluster appears only for and full coverage () Stauffer ; Evans . For , the jamming coverage is less than 1 and consequently, the percolation phase transition disappears.
Several authors investigated the isotropic deposition of straight rigid -mers on two-dimensional (2D) square lattices Becklehimer ; Vandewalle ; Corne1 ; Corne2 ; Leroyer ; Bonnier ; Kondrat ; Tara2012 ; Kondrat2017 ; Slutskii . In Ref.Becklehimer , linear -mers with a length in the interval were randomly and isotropically deposited on a 2D square lattice. By computer simulations, the authors found that the percolation threshold decreases with increasing the chain length . A similar behavior was observed by Vandewalle et al. Vandewalle for sizes ranging from 1 to 10, and by Cornette et al. Corne1 ; Corne2 for sizes ranging from 1 to 15.
Later papers extended the analysis to larger lattices and longer objects Leroyer ; Bonnier ; Kondrat . The results obtained revealed that: (1) the jamming concentration monotonically decreases and tends to as the length of the rods increases; (2) the percolation threshold is a nonmonotonic function of the size : it decreases for small rod sizes, goes through a minimum around , and finally increases for large segments; and (3) the ratio of the two thresholds has a more complex behavior: after initial growth, it stabilizes between and , and then it grows again.
Tarasevich et al. Tara2012 confirmed that the percolation threshold initially decreases, passes through a minimum at , and then increases with increasing . In addition, the authors determined that the percolation phase transition only exists for values of between 1 and approximately . For larger , percolation cannot occur even at the jamming concentration, which is the maximum the system can achieve. Very recently, Kondrat et al. Kondrat2017 refuted the conjecture that in the RSA processes of linear -mers on square lattices the percolation is impossible if the needles are sufficiently long Tara2012 . The authors presented a strict proof that in any jammed configuration of nonoverlapping, fixed-length, horizontal or vertical needles on a square lattice, all clusters are percolating clusters. The theoretical result obtained in Ref. Kondrat2017 was recently corroborated using simulation techniques Slutskii . Based in a very efficient parallel algorithm, Slutskii et al. Slutskii studied the problem of large linear -mers (up to ) on a square lattice with periodic boundary conditions. The obtained results indicate that, in the case of linear -mers on square lattices, percolation always occurs before jamming.
In Ref. EPJB4 , the percolation problem corresponding to linear -mers was extended to three-dimensional (3D) simple cubic lattices. The -mers were irreversibly and isotropically deposited into the lattice. Then, the percolation threshold and critical exponents were obtained by numerical simulations and finite-size scaling theory. The results, obtained for ranging from 1 to 100, revealed that (i) the percolation threshold exhibits a decreasing function when it is plotted as a function of the -mer size; and (ii) the phase transition occurring in the system belongs to the standard 3D percolation universality class regardless of the value of considered.
Later, the deposition kinetics of linear -mers on cubic lattices was investigated in Ref. PHYSA38 . The study revealed that (i) the jamming coverage exhibits a decreasing function when it is plotted in terms of the -mer size, being the value of the limit coverage for large ’s; and(ii) the ratio between percolation threshold and jamming coverage shows a non-universal behavior, monotonically decreasing to zero with increasing . These findings indicate that the percolation phase transition occurs for all values of .
The RSA problem becomes more difficult to solve when the depositing particles are compact objects, and only very moderate progress has been reported so far. In the line of present work, M. Nakamura Nakamura86 ; Nakamura87 studied the problem of square tiles (-mers) irreversibly deposited on 2D square lattices. The author showed that the percolation threshold is an increasing function of in the range . For , all jammed configurations are non-percolating states, and consequently, the percolation phase transition disappears. This finding was corroborated by theoretical analysis based on exact calculations of all the possible configurations on finite cells Centres2018 .
Jamming and percolation properties change substantially when the -mers are deposited on 3D simple cubic lattices. This problem was investigated in Ref. Baldosas3D . The jamming coverage was found to decrease to a nonzero constant with as the power law obtaining the fitting value . On the other hand, a nonmonotonic size dependence was observed for the percolation threshold, which decreases for small particles sizes, goes through a minimum around , and finally increases for large segments. As in the case of linear -mers deposited on 2D square lattices, it would be expected that the percolation phase transition survives as .
In this paper, we have studied jamming and percolation aspects of cubic objects (-mers) deposited on 3D simple cubic lattices. Using extensive simulations supplemented by finite-size scaling analysis, jamming coverages and percolation thresholds were determined for a wide range of values. This study (i) completes previous work on jamming and percolation of extended objects on -dimensional lattices Becklehimer ; Vandewalle ; Corne1 ; Corne2 ; Leroyer ; Bonnier ; Kondrat ; Tara2012 ; Kondrat2017 ; Slutskii ; EPJB4 ; PHYSA38 ; Nakamura86 ; Nakamura87 ; Centres2018 ; Baldosas3D ; and (ii) allow us to extract general conclusions about the behavior of the system and its dependence on the relationship between the dimension of the depositing object and the dimension of the substrate.
II Model and Monte Carlo Simulation Details
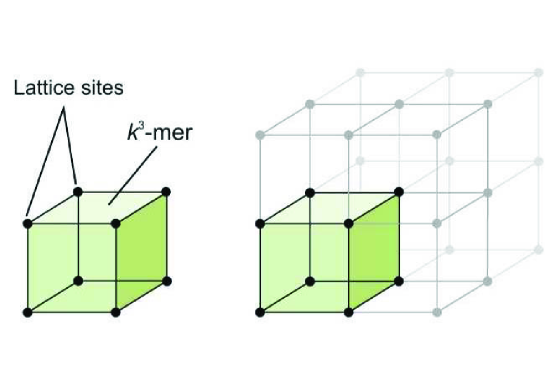
We consider a substrate composed by a 3D simple cubic lattice of sites with periodic boundary conditions in each direction (a torus). In this way, all the lattice sites are equivalent and there are no edge effects in the filling process. The deposition procedure is as follow. A set of nearest-neighbor sites, conforming a cube of side (see Fig. 1), is randomly chosen; if all the selected sites are empty, a -mer is deposited onto the lattice (the sites are marked as occupied). Otherwise, the attempt is rejected. When -mers are deposited, the concentration is . In order to efficiently occupy the lattice sites, we actually select at random the empty -tuples from a list of empty -tuples, instead of from the whole lattice, updating the list in each step. This strategy, although it is more memory consuming, significantly improves the computational cost of the filling algorithm.
III Jamming
The calculation of the jamming concentration for different values of on a lattice of linear size (a -lattice) is carried out by using the probability that a particular RSA process reaches the coverage PHYSA38 . The procedure to determine this probability consists of simulating the following steps: (a) the setup of an initially empty cubic -lattice, and (b) the deposition of the objects on the lattice until reaching a jamming condition. runs of the steps (a)-(b) are carried out for each lattice size and each object size . Then the probability can be calculated, where is the number of runs that reach the coverage . A set of independent runs was numerically obtained for several values of the lattice sizes as well as for different values of . The ratio is kept constant to prevent any spurious effects.
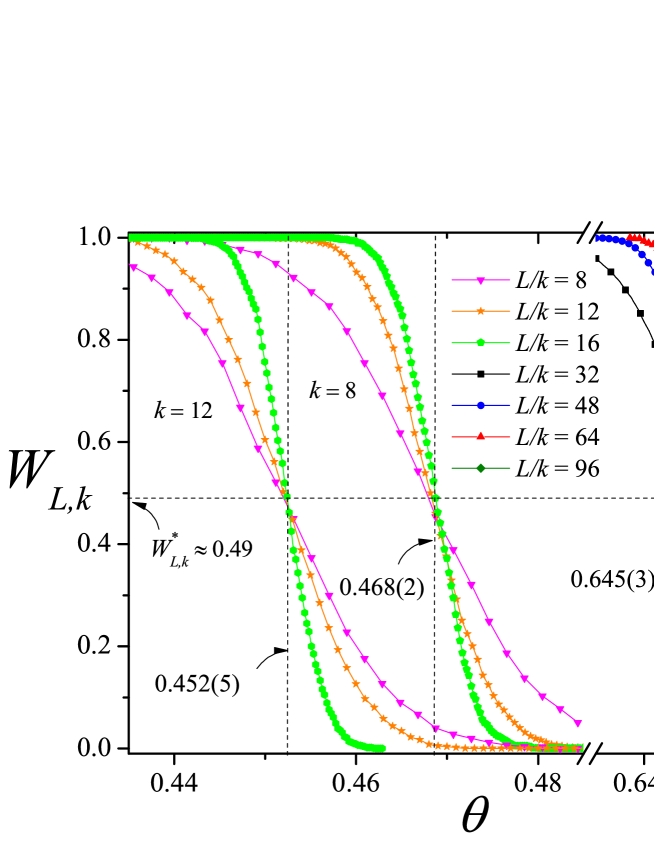
For an infinite system () should be a step function, being 1 for and 0 for , whereas for finite values of , varies continuously between 1 and 0, with a sharp fall around . Thereby, the jamming coverage can be estimated from the curves of versus plotted for several lattice sizes PHYSA38 . In the vicinity of the limit coverage, the probabilities show a strong dependence on the system size. However, at the jamming point, the probabilities adopt an unique value , irrespective of the system sizes in the scaling limit. Thus, plotting for different linear sizes yields an intersection point , which gives an accurate estimation of the jamming coverage, , in the infinite system. The interval width where the curves cross each other is taken as the error in the determination of .
In Fig. 2, the probabilities are shown for values of ranging from 8 to 96, as indicated, and three typical cases: , and . From the inspection of the figure (and from data not shown here for a sake of clarity), it can be seen that: (a) for each , the curves cross each other in a unique point ; (b) those points do not modify their numerical value for the different cases studied, being ; (c) those points are located at very well defined values in the -axes determining the jamming threshold, , for each ; and (d) decreases for increasing values of .

| 2 | 0.645(4) | 0.259(2) |
| 3 | 0.559(1) | 0.268(6) |
| 4 | 0.521(1) | 0.291(3) |
| 5 | 0.499(2) | 0.312(4) |
| 6 | 0.485(2) | 0.332(5) |
| 7 | 0.476(2) | 0.352(3) |
| 8 | 0.468(3) | 0.367(7) |
| 9 | 0.463(3) | 0.382(1) |
| 10 | 0.459(4) | 0.397(3) |
| 11 | 0.456(3) | 0.408(3) |
| 12 | 0.452(5) | 0.418(3) |
| 13 | 0.451(5) | 0.426(1) |
| 14 | 0.447(5) | 0.432(8) |
| 15 | 0.447(5) | 0.438(2) |
| 16 | 0.447(5) | 0.440(7) |
| 17 | 0.445(4) | - |
| 18 | 0.442(8) | - |
| 19 | 0.442(8) | - |
| 20 | 0.441(7) | - |
| 25 | 0.436(5) | - |
| 30 | 0.434(5) | - |
| 40 | 0.430(5) | - |
The procedure of Fig. 2 was repeated for ranging between 2 and 40. The results are shown in Fig. 3 and compiled in the second column of Table I. A decreasing behavior is observed for , with a finite value of saturation in the limit of infinitely long -mers. The simulation data have been fitted to the function: , being =0.4204(9), =0.44(3) and =-0.75(30). The fitting curve is shown in Fig. 3 (dashed line). For , the inset of Fig. 3 shows a practically linear dependence of as a function of , which allows us to corroborate the previously obtained value .
It is interesting to compare the results in Fig. 3 with similar data resulting from the deposition of linear -mers (objects of ) PHYSA38 and tiles or -mers (objects of ) Baldosas3D on simple cubic lattices. The main similarities and differences are as follows: in the three cases, the jamming coverage was also found to be a decreasing function of ; in the range studied by simulations (), the -mers are less effective in filling the 3D cubic lattice than other less compact objects. As an illustrative example, 0.5256, 0.4820 and 0.4407, for -mers, -mers and -mers, respectively; and the tendency described in point does not seem to be valid for large values of . Thus, =0.4045(19) PHYSA38 , 0.4285(6) Baldosas3D and 0.4204(9), for -mers, -mers and -mers, respectively. The limiting values of were obtained by simulations for relatively small sizes and then extrapolated to represent very long objects. Additional simulation research of RSA with extremely long objects should be performed in the future to confirm or reject the prediction in point .
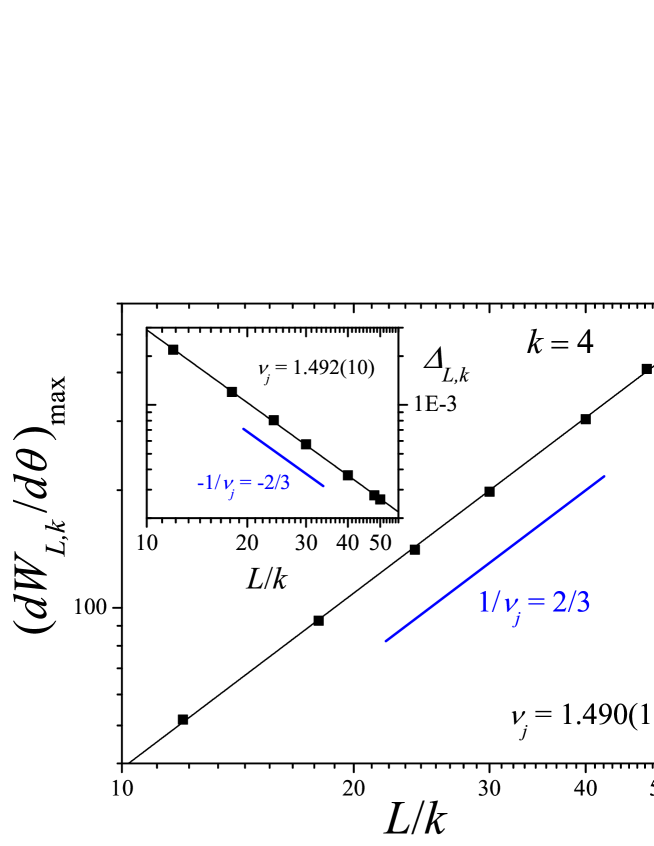
To further deepen the study of jamming, the critical exponent of the jamming transition was calculated. For this purpose, the derivative is expected to behave like a Gaussian function around the maximum Vandewalle ,
| (1) |
where is the concentration at which the slope of is maximum and is the standard deviation from . Then, by fitting the derivative according to Eq. (1) it is possible to determine :
| (2) |
Fig. 4 shows as a function of for in a log-log graph. can be obtained from the slope of the curve (the line is a linear fit of the points). In this case, .
An alternative way to obtain is from the divergence of the jamming standard deviation at the critical point,
| (3) |
The inset in Fig. 4 shows as a function of for the same case of the main figure. With this scheme, the resulting value of the critical exponent was . In both cases (main figure and inset), the critical exponent obtained from the slope of the curves is close to . The procedure was repeated for different values of . In all the cases, the values obtained for : (1) remain close to , and (2) coincide, within the numerical errors, with the values previously reported by us in other 3D systems PHYSA38 ; Baldosas3D .
IV Percolation
As it was already mentioned, the main goal of percolation theory is the determination of the minimum concentration for which a cluster extends from one side of the system to the opposite. We are interested in determining: (i) the dependence of as a function of the size , and (ii) the critical exponents and the universality class of the phase transition occurring in the system.
The finite-scaling theory gives us the basis to determine the percolation threshold and the critical exponents of a system with a reasonable accuracy. For this purpose, the probability that an -lattice percolates at the concentration of occupied sites by cubic objects of size can be defined Stauffer ; Binder ; Yone1 . Here, the following criteria can be given according to the meaning of :
-
•
: the probability of finding a percolating cluster along the -direction,
-
•
: the probability of finding a percolating cluster along the -direction,
-
•
: the probability of finding a percolating cluster along the -direction.
Other useful definitions for the finite-size analysis are:
-
•
: the probability of finding a cluster which percolates on any direction,
-
•
: the probability of finding a cluster which simultaneously percolates in the three directions,
-
•
=: the arithmetic average.
Computational simulations were applied to determine each of the previously mentioned quantities. Each simulation run consists of the following steps: (a) the construction of a simple cubic lattice of linear size and coverage , (b) the cluster identification using the union-and-find algorithm Hoshen with open boundary conditions. In the last step, the size of the largest cluster is determined, as well as the existence of a percolating island and all the probabilities .
A total of independent runs of such two steps procedure were carried out for each lattice size . From these runs, a number of them present a percolating cluster according to the criterion . Then, is defined and the procedure is repeated for different values of , and .
In addition to the different probabilities , the percolation order parameter and the corresponding susceptibility have been measured Biswas ; Chandra ,
| (4) |
and
| (5) |
where means an average over simulation runs.
In our percolation simulations, we used . In addition, for each value of , the effect of finite size was investigated by examining cubic lattices with and . As it can be appreciated, this represents extensive calculations from the numeric point of view (with an effort reaching almost the limits of our computational capabilities). From there on, the finite-scaling theory can be used to determine the percolation threshold and the critical exponents with a reasonable accuracy.
An initial way to estimate the percolation threshold Yone1 is from the interception of the curves of . To improve the accuracy, different curves are expressed as a function of continuous values of . Then, as in the case of jamming probability, can be fitted by the Gaussian function 111The behavior of is known not to be a Gaussian in all range of coverage Newman3 . However, this quantity is approximately Gaussian near the peak, and fitting with a Gaussian function is a good approximation for the purpose of locating its maximum.,
| (6) |
where and have the same meaning as in Eq. (1).

The probability , which represents the percolation cumulant and whose properties are identical to those of the Binder cumulant in standard thermal transitions Binder ; Privman , obeys the same scaling relation as , and the intersection of the curves of for different system sizes can be used to determine the critical point that characterizes the phase transition occurring in the system Stauffer ; Corne2 ; Newman ; Fortunato1 ; Fortunato2 . This procedure is shown in Fig. 5, where the probabilities , and are shown for and different lattice sizes as indicated. From a simple inspection of the figure (and from data not shown here for the sake of clarity) it is observed that: (a) the curves, corresponding to the various percolation criteria (, , , etc.), cross each other in a unique universal point, , which depends on the criterion used; and (b) those points are located at well defined values in the -axes determining the critical percolation threshold for each .
As it is well-known, the transition is never sharp for finite systems. Accordingly, the intersection point in previous figure is not an unique point and shows a slight shift with changes of the lattice size . As we will show next, the scaling theory offers a more accurate route to determinate the percolation thresholds.
We will start by analyzing the correlation length, . This quantity, associated with emergence of the percolating cluster, has the scaling relation:
| (7) |
where is the critical exponent. As the correlation length , being the linear dimension of the system. Thus, we have
| (8) |
where is a non-universal constant and represents the percolation threshold in the thermodynamic limit.
As it can be seen from Eq. (8), the exponent is of importance because it is necessary in order to calculate the percolation threshold. The finite-size scaling theory allows to estimate through the scaling relationship for :
| (9) |
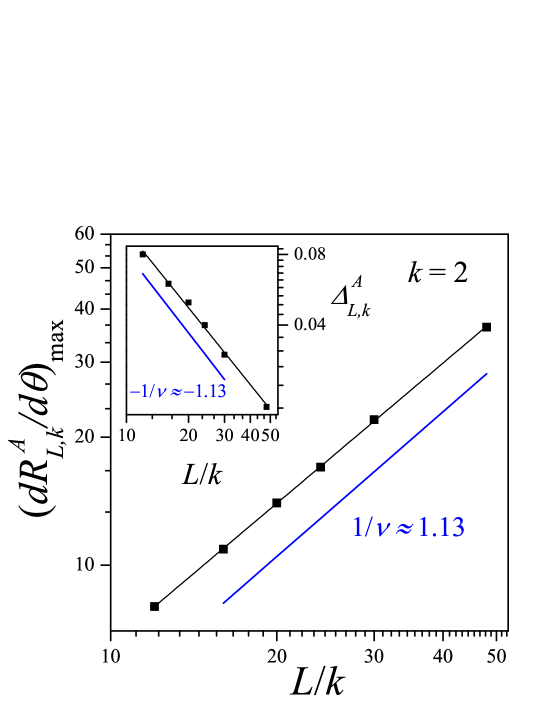
being the scaling function and . Thus, the maximum of the derivative of Eq. (9) leads to
| (10) |
In Fig. 6, this relation has been plotted as a function of (in log-log scale) for . As can be observed, the slope of the curve () remains constant and close to . Thus, the resulting value of the critical exponent was .
Another alternative way to obtain is given by the divergence of the root mean square deviation of the threshold observed from their average values, in Eq. (1) Stauffer ,
| (11) |
The inset of Fig. 6 shows as a function of (note the log-log functional dependence) for . According to Eq. (11), the slope corresponds to . In this case, it results .
The study in Fig. 6 was repeated for the and percolation criteria and different values of ranging between 2 and 16. In all cases, the results coincide, within numerical errors, with the well-known value of the critical exponent of the ordinary 3D percolation Koza .
The values of can be obtained for different values of and by fitting the corresponding curves according to Eq. (6). Then, once was determined, the percolation thresholds can be calculated by using Eq. (8). This procedure is shown in Fig. 7 for a typical case: . The figure supports the relation given by Eq. (8): (a) all the curves (different criteria) are well correlated by a linear function, and (b) they have a quite similar value for the ordinate in the limit .
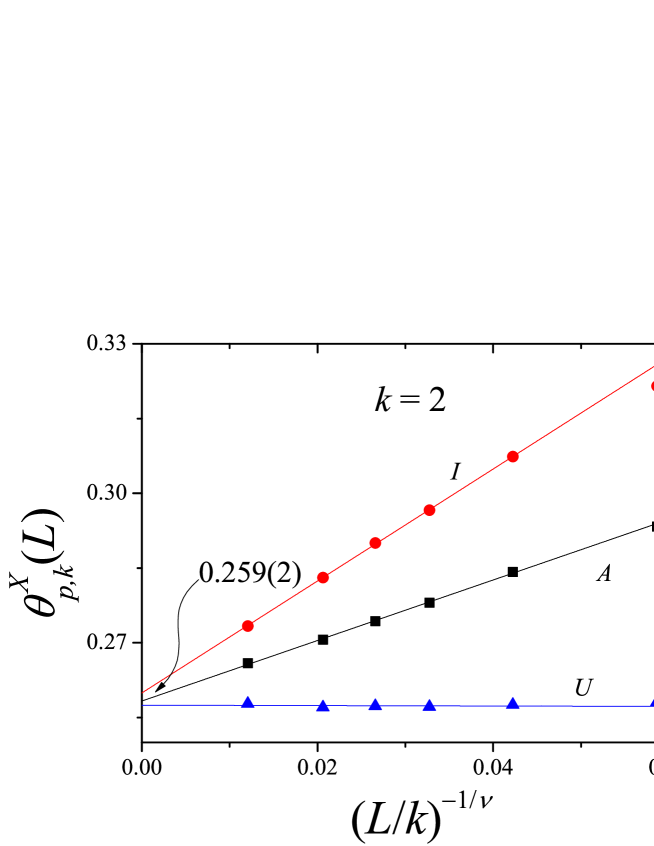
From the procedure shown in Fig. 7, one obtains for the criteria , and . Combining the three estimates for each , the final values of are obtained. The maximum of the differences between , , and , gives the error bar for . In the case of Fig. 7, the value obtained for the percolation threshold was: . For the rest of the paper, we will denote the percolation threshold for each size by [for simplicity we will drop the symbol“”].
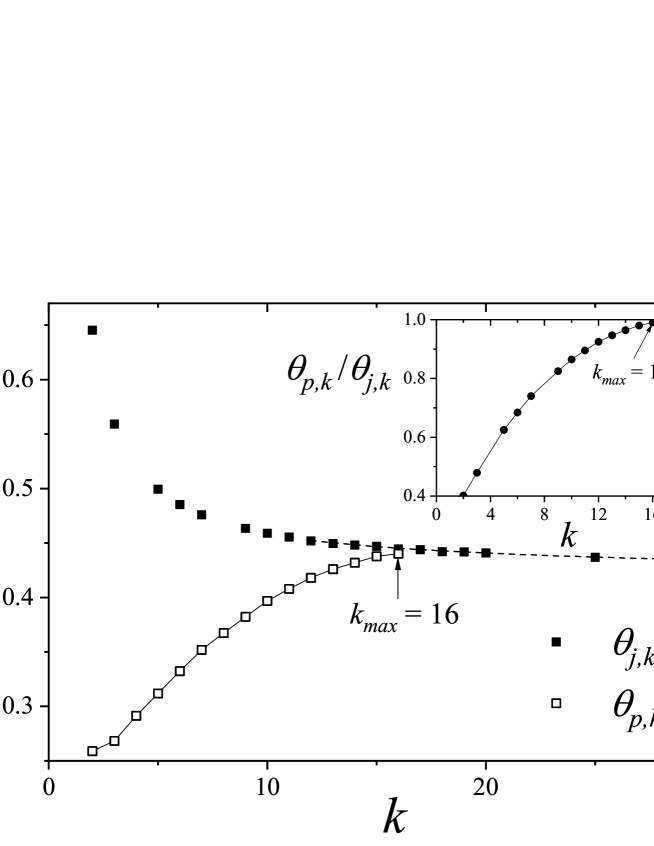
In Fig. 8 the percolation threshold is plotted as a function of (open squares). The corresponding numerical values are collected in Table I (third column). The figure also includes the jamming curve (solid squares). For , the percolation threshold increases upon increasing . For , all jammed configurations are non-percolating states, and consequently, there is no percolating phase transition. Jamming and percolation can simultaneously occur in these systems up to , with diminishing values for the jamming critical coverage. For larger values of , the jamming critical concentration happens earlier than the likely percolation concentration thus suppressing this property. This phenomenon can be better visualized in the inset of Fig. 8, where the ratio has been plotted as a function of . A similar behavior has already been observed in a system of tiles on square lattices, being in this case Nakamura86 ; Nakamura87 ; Centres2018 .
On the other hand, the result shown in Fig. 8 contrasts with the behavior observed in systems of -dimensional objects deposited on -dimensional lattices (with ): straight rigid -mers on 2D square lattices Becklehimer ; Vandewalle ; Corne1 ; Corne2 ; Leroyer ; Bonnier ; Kondrat ; Tara2012 ; Kondrat2017 ; Slutskii ; straight rigid -mers on 3D simple cubic lattices EPJB4 and tiles (-mers) on 3D simple cubic lattices Baldosas3D . In these systems, percolating and non-percolating phases extend to infinity in the parameter space and, consequently, the model presents percolation transition in all ranges of -mer size.
The values previously calculated for the critical exponent (see Fig. 6) clearly indicate that the percolation phase transition belongs to the the universality class of 3D random percolation. In order to reinforce or discard this hypothesis, the critical exponents and can be calculated from the scaling behavior of and Stauffer as follows:
| (12) |
and
| (13) |
where and are scaling functions for the respective quantities.
Then, given and , and were obtained by plotting versus and versus and looking for data collapsing Stauffer . As is shown in Fig. 9, the data scaled extremely well using and Stauffer . Figure 9 also includes the data collapse of versus .
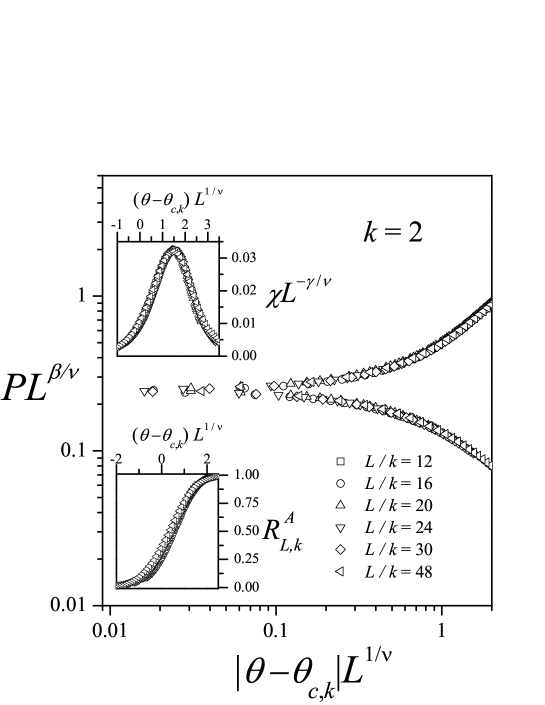
The results obtained in Fig. 9 support the hypothesis that the model studied here belongs to the universality class of 3D random percolation Stauffer ; Koza (see Wikipedia webpage: https://en.wikipedia.org/wiki/Percolation-critical-exponents). Identical results were found for different values of in the range (not shown here for space reasons), showing that the universality does not depend on the -mer size. This kind of behavior, which is expected for systems without long-range correlations, has been observed in previous studies of percolation of extended objects. Thus, Cornette et al Corne2 found that straight rigid -mers and tortuous -mers isotropically deposited on two-dimensional square lattices are in the same universality class as the 2D standard percolation. The same result was obtained for percolation of aligned rigid rods Longone and percolation of rigid rods under equilibrium conditions Matoz on 2D square lattices. In the case of 3D systems, García et al PHYSA38 arrived at the same conclusion studying the RSA process of rods. The authors reported that even though the intersection points of the curves of for different objects sizes exhibit nonuniversal critical behavior, the percolation transition occurring in the system belongs to the standard 3D random percolation universality class regardless of the value of considered.
V Conclusions
Jamming and percolation properties in RSA of cubic objects (-mers) deposited on simple cubic lattices have been studied by numerical simulations complemented with finite-size scaling theory.
The dependence of the jamming coverage on the size was studied for ranging from 2 to 40. A decreasing behavior was observed for , with a finite value of saturation in the limit of infinitely long -mers: , being =0.4204(9), =0.44(3) and =-0.75(30). A similar decreasing behavior was found for RSA of linear -mers PHYSA38 and tiles Baldosas3D on simple cubic lattices. However, some important differences between these systems were observed: in the range studied by simulations (), the -mers are less effective in filling the 3D cubic lattice than other less compact objects (such as linear -mers and tiles); and the tendency described in point seems to become invalid for large values of , and =0.4045(19) PHYSA38 , 0.4285(6) Baldosas3D and 0.4204(9), for -mers, -mers and -mers, respectively. Conclusion is based on extrapolating simulation results obtained for relatively small sizes. Accordingly, more simulations are necessary in order to obtain direct confirmation of these predictions.
To conclude with the analysis of jamming properties, the critical exponent was measured for different values of the size . In all cases, the values obtained for (1) remain close to 3/2, (2) coincide, within numerical errors, with the same value of the critical exponent obtained by us for other three dimensional systems PHYSA38 ; Baldosas3D , and (3) differs clearly from the value reported by Vandewalle et al. Vandewalle for the case of linear -mers on square lattices, and from other 2D systems Centres2018 ; JSTAT9 .
Once the limiting parameters were determined, the percolation properties of the system were studied. The numerical calculations showed that the percolation threshold is an increasing function of in the range . For , all jammed configurations are non-percolating states, and consequently, the percolation phase transition disappears. The interplay between the percolation and the jamming effects is responsible for the existence of a maximum value of (in this case, ) from which the percolation phase transition no longer occurs. A similar behavior was observed in the case of square tiles on 2D square lattices, where the percolation phase transition disappears for Nakamura86 ; Nakamura87 ; Centres2018 .
Finally, and in order to test the universality of the problem, the phase transition involved on it has been studied by using finite-size scaling theory. The accurate determination of critical exponents (, and ) revealed that the model belongs to the same universality class as the 3D random percolation, regardless of the size considered. In addition, the corresponding curves collapse according to the predictions of the scaling theory.
The results obtained in the present study, along with the data reported by us and others previously Stauffer ; Evans ; Nakamura86 ; Nakamura87 ; Centres2018 ; Tara2012 ; Baldosas3D ; Kondrat2017 ; Slutskii ; EPJB4 , allow us to state the following classification, according to the relationship between the dimension of the depositing object and the dimension of the substrate:
-
•
-dimensional lattice and -dimensional depositing object: The percolation threshold is an increasing function of in the range . For , all jammed configurations are non-percolating states, and consequently, the percolation phase transition disappears. Thus, (1) for straight rigid -mers on 1D lattices Stauffer ; Evans ; (2) for square tiles (-mers) on 2D square lattices Nakamura86 ; Nakamura87 ; Centres2018 ; and (3) for cubic objects (-mers) deposited on 3D simple cubic lattices (this work).
-
•
-dimensional lattice and ()-dimensional depositing object: The percolation threshold is a nonmonotonic function of the size : it decreases for small particle sizes, goes through a minimum around , and finally tends to a constant value for large ’s. In other words, the percolation phase transition occurs for all values of . Thus, for straight rigid -mers on 2D square lattices Tara2012 and for -mers on 3D simple cubic lattices Baldosas3D . The tendency to a constant value for large objects has been established only for straight rigid -mers on square lattices. In this line, Kondrat et al. Kondrat2017 presented a strict proof that in any jammed configuration, all clusters are percolating clusters. Later, the results obtained in Ref. Kondrat2017 were corroborated using simulation techniques Slutskii . In the case of -mers on 3D simple cubic lattices, direct simulation of the RSA for such large objects is a very-time-consuming task and, therefore, it is still an open problem.
-
•
-dimensional lattice and ()-dimensional depositing object: This case corresponds to straight rigid -mers on 3D simple cubic lattices. The percolation threshold shows a monotonic decrease with the size and remains below the curve of jamming coverage versus . Consequently, percolating and non-percolating phases extend to infinity in the space of the parameter and the model presents percolation transition in all ranges of said value EPJB4 .
VI ACKNOWLEDGMENTS
This work was supported in part by CONICET (Argentina) under project number PIP 112-201101-00615; Universidad Nacional de San Luis (Argentina) under project No. 03-0816; and the National Agency of Scientific and Technological Promotion (Argentina) under project PICT-2013-1678. The numerical work were done using the BACO parallel cluster (composed by 50 PCs each with an Intel i7-3370 / 2600 processor) located at Instituto de Física Aplicada, Universidad Nacional de San Luis - CONICET, San Luis, Argentina.
References
- (1) D. Stauffer and A. Aharony, Introduction to Percolation Theory (Taylor & Francis, London, 2003).
- (2) M. Sahimi, Applications of Percolation (Theory Taylor & Francis, London, 1994).
- (3) G. Grimmett, Percolation (Springer, Berlin, 1999).
- (4) D. Sornette, Critical Phenomena in Natural Sciences: Chaos, Fractals, Selforganization and Disorder: Concepts and Tools, Springer Series in Synergetics (Springer, Berlin, 2006).
- (5) B. Bollobás, O. Riordan, Percolation (Cambridge) University Press, New York, 2006.)
- (6) J. Feder, J. Theor. Biol. 87, 237 (1980).
- (7) J. W. Evans, Rev. Mod. Phys. 65, 1281 (1993).
- (8) Lj. Budinski-Petković, I. Lončarević, M. Petković, Z. M. Jakšić, and S. B. Vrhovac, Phys. Rev. E 85, 061117 (2012).
- (9) Lj. Budinski-Petković, I Lončarević, Z. M. Jakšić, and S. B. Vrhovac, J. Stat. Mech. 053101 (2016).
- (10) P. L. Krapivsky, S. Redner, and E. Ben-Naim, A Kinetic View of Statistical Physics (Cambridge University Press, UK, 2010).
- (11) J. Becklehimer and R. B. Pandey, Physica A 187, 71 (1992).
- (12) N. Vandewalle, S. Galam, and M. Kramer, Eur. Phys. J. B 14, 407 (2000).
- (13) V. Cornette, A. J. Ramirez-Pastor, and F. Nieto, Physica A 327, 71 (2003).
- (14) V. Cornette, A. J. Ramirez-Pastor, and F. Nieto, Eur. Phys. J. B 36, 391 (2003).
- (15) Y. Leroyer and E. Pommiers, Phys. Rev. B 50, 2795 (1994).
- (16) B. Bonnier, M. Hontebeyrie, Y. Leroyer, C. Meyers, and E. Pommiers, Phys. Rev. E 49, 305 (1994).
- (17) G. Kondrat and A. Pȩkalski, Phys. Rev. E 63, 051108 (2001).
- (18) Y. Y. Tarasevich, N. I. Lebovka, and V. V. Laptev, Phys. Rev. E 86, 061116 (2012).
- (19) G. Kondrat, Z. Koza, and P. Brzeski, Phys. Rev. E 96, 022154 (2017).
- (20) M. G. Slutskii, L. Y. Barash, and Y. Y. Tarasevich, Phys. Rev. E 98, 062130 (2018).
- (21) G. D. García, F. O. Sanchez-Varretti, P. M. Centres, and A. J. Ramirez-Pastor, Eur. Phys. J. B 86, 403 (2013).
- (22) G. D. García, F. O. Sanchez-Varretti, P. M. Centres, and A. J. Ramirez-Pastor, Physica A 436, 558 (2015).
- (23) M. Nakamura, J. Phys. A: Math Gen. 19 (1986) 2345 .
- (24) M. Nakamura, Phys. Rev. A 36 (1987) 2384.
- (25) A. J. Ramirez-Pastor, P. M. Centres, E. E. Vogel, and J. F. Valdés, Phys. Rev. E 99, 042131 (2019).
- (26) P. M. Pasinetti, P. M. Centres and A.J. Ramirez-Pastor, submitted (2019).
- (27) A. Rényi, Sel. Transl. Math. Stat. Probab. 4, 203 (1963).
- (28) K. Binder, Rep. Prog. Phys. 60, 488 (1997).
- (29) F. Yonezawa, S. Sakamoto, and M. Hori, Phys. Rev. B 40, 636 (1989); 40, 650 (1989).
- (30) J. Hoshen and R. Kopelman, Phys. Rev. B 14, 3438 (1976).
- (31) S. Biswas, A. Kundu, and A. K. Chandra, Phys. Rev. E 83, 021109 (2011).
- (32) A. K. Chandra, Phys. Rev. E 85, 021149 (2012).
- (33) M E J Newman and R M Ziff, Phys. Rev. E 64, 016706 (2001).
- (34) V. Privman, P.C. Hohenberg, A. Aharony, Universal Critical-Point Amplitude Relations, in Phase Transitions and Critical Phenomena, edited by C. Domb, J.L. Lebowitz (Academic, NY, 1991) Vol. 14, Chap. 1.
- (35) M.E.J. Newman, R.M. Ziff, Phys. Rev. Lett. 85, 4104 (2000).
- (36) S. Fortunato, Phys. Rev. B 67, 014102 (2003).
- (37) S. Fortunato, Phys. Rev. B 66, 054107 (2002).
- (38) Z. Koza and J. Poła, J. Stat. Mech. 103206 (2016), and references therein.
- (39) Y. Y. Tarasevich, and V. A. Cherkasova, Eur. Phys. J. B 60, 97 (2007).
- (40) D. A. Matoz-Fernandez, D. H. Linares, A. J. Ramirez-Pastor, Eur. Phys. J. B 85, 296 (2012).
- (41) P. Longone, P. M. Centres, and A. J. Ramirez-Pastor, Phys. Rev. E 85, 011108 (2012).
- (42) L. S. Ramirez, P. M. Centres, and A. J. Ramirez-Pastor, J. Stat. Mech. 033207 (2019).