pnasresearcharticle \significancestatementCapillary effects in cement paste are associated with multiple degradation mechanisms. Using a novel framework, we investigated the role of capillary forces in cement paste under partial saturation, from nano-grains level to the mesoscale. We show that the largest capillary forces concentrate at the boundary between gel pores and larger capillary pores inducing nonaffine deformations with correlations up to a few tens of nm. Our results suggest a homogenization length scale common to liquid and solid stresses, correlated with the scale of inherent structural heterogeneities. This opens the route to studying the poromechanics of complex multiscale media with explicit fluid-solid coupling. \authorcontributionsT.Z., K.I. and R.P. designed research, T.Z. conducted research, T.Z., K.I., F. U., M.B. and R.P. wrote the paper. \authordeclarationThe authors declare no conflict of interest. \correspondingauthor1To whom correspondence should be addressed. E-mail: pellenq@mit.edu, aikaterini.ioannidou@umontpellier.fr
Multi-scale poromechanics of wet cement paste
Abstract
Capillary effects such as imbibition-drying cycles impact the mechanics of granular systems over time. A multiscale poromechanics framework was applied to cement paste, that is the most common building material, experiencing broad humidity variations over the lifetime of infrastructure. First, the liquid density distribution at intermediate to high relative humidities is obtained using a lattice gas density functional method together with a realistic nano-granular model of cement hydrates. The calculated adsorption/desorption isotherms and pore size distributions are discussed and compare well to nitrogen and water experiments. The standard method for pore size distribution determination from desorption data is evaluated. Then, the integration of the Korteweg liquid stress field around each cement hydrate particle provided the capillary forces at the nanoscale. The cement mesoscale structure was relaxed under the action of the capillary forces. Local irreversible deformations of the cement nano-grains assembly were identified due to liquid-solid interactions. The spatial correlations of the nonaffine displacements extend to a few tens of nm. Finally, the Love-Weber method provided the homogenized liquid stress at the micronscale. The homogenization length coincided with the spatial correlation length of nonaffine displacements. Our results on the solid response to capillary stress field suggest that the micronscale texture is not affected by mild drying, while nanoscale irreversible deformations still occur. These results pave the way towards understanding capillary phenomena induced stresses in heterogeneous porous media ranging from construction materials, hydrogels to living systems.
keywords:
cement paste homogenization capillary stress multi-scale poromechanics nonaffine deformationsThis manuscript was compiled on
-2pt
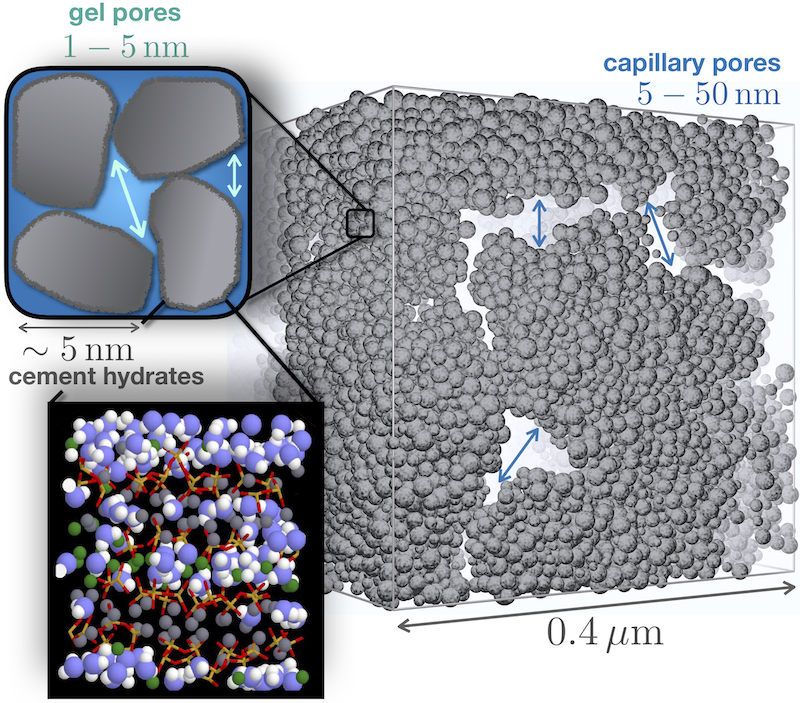
Over the life-time of cement paste, the degree of water saturation can span a wide range: the initial reaction and precipitation of cement hydrates happens when cement powder is mixed with water to form the cement paste. Later, during setting, remaining water (not used by the dissolution-precipitation reaction) gradually evaporates from the pore space (1) that is composed of gel pores (1-5 nm) and capillary pores (5-50 nm). The set paste in construction environment is then exposed to weather conditions that correspond to different relative humidities. These changes in saturation level of cement paste induce capillary stress and material deformation, as demonstrated in drying shrinkage experiments (2, 2, 3, 4), which potentially contributes to the degradation and failure of buildings and bridges.
Structural changes due to liquid intake/drainage in porous media are known as “sorption induced deformation” (5). Irreversible deformations during drying shrinkage of cement paste have been observed. Under mild drying conditions, small angle neutron scattering (SANS) experiments (3) show plastic rearrangements at very small length scales, but no significant structural changes are detected at larger scales. However, harsh drying conditions can lead to large strain irreversibility at the macroscale(2, 4). It is also known that pressurization of the pore fluid in liquid saturated rocks is an important weakening mechanism that can lead to fracture (6).
Capillary condensation and induced mechanical strain in materials consisting of simple pore structures (such as MCM-type mesoporous silica and carbon nanotubes) have been successfully described using independent pores of cylindrical geometry(7, 8, 9, 5). However, the multi-scale pore structure of a heterogeneous material such as cement paste invalidates these theories mainly for 2 reasons. 1) The pores are connected to form a complex percolating topology, which gives rise to more complicated hysteretic behaviors in the sorption isotherms and liquid distributions. 2) The liquid distribution inside the pores renders a heterogeneous force boundary condition, which along with a highly heterogeneous solid structure, challenges the applicability of classical continuum tools (10). Thus to study the mechanics of undersaturated cement paste, a multi-scale approach must be undertaken.
Homogenization methods play a central role in bridging different scales to understand how large scale properties emerge from small scale interactions. When the material is heterogeneous and partially saturated, it is necessary to re-examine the emergence of a continuum description. One important issue is how to determine a proper physical homogenization scale(11). For some cases of dense granular flows, the continuum postulate has been shown valid (11, 12). However, this has not been tested for poromechanics in the presence of capillary forces.
In this paper, we first simulate the liquid distribution in a heterogeneous mesoscale model of cement paste at partial saturations, using lattice gas density functional theory (DFT). Fig.1 shows the mesoscale model of cement paste composed of cement hydrates nano-grains ( 5 nm) interacting with effective potentials from atomistic simulations(13, 14, 15). Our simulated hysteric adsorption/desorption isotherms of water and nitrogen compare well with experiments. Our subsequent calculations reveal the nanoscale details of capillary forces, by constructing the Korteweg stress tensor field and integrating over Voronoi cells centered on cement hydrate nano-grains(16). Using the capillary forces, we simulate structural relaxation and a subsequent sorption cycle. Analysis of the statistics of solid and liquid stress distributions point to the same homogenization length. We rationalize it as the length scale of structural heterogeneity. To our knowledge this is the first example examining the continuum postulate for unsaturated porous media. Our results provide insights to drying/wetting of cement paste.
Sorption hysteresis and pore size distributions
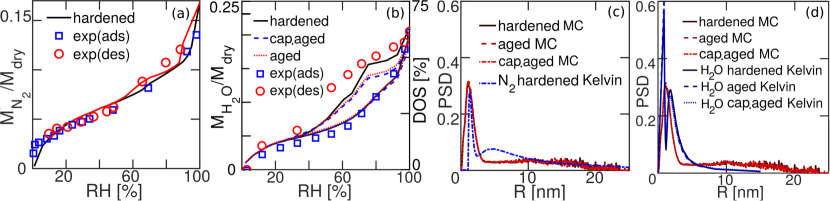
To obtain the liquid distributions in cement paste, we simulated the adsorption/desorption isotherms for two adsorbents nitrogen and water in mesoscale configurations of cement hydrates using lattice gas DFT (21, 22) described in the Materials and Methods section. The sorption isotherms calculated for both adsorbents are in good agreement with experimental data, as shown in Fig.2a and b for nitrogen (77 K) and water (300 K) respectively. The nitrogen adsorption/desorption isotherm displays only minimal hysteresis in agreement to experimental observations of Ref.(19). The mesoscale configuration of cement hydrates used for the nitrogen and water lattice DFT simulation is called “hardened” as it is obtained right after out-of-equilibrium precipitation of nano-grains (15) and has internal eigenstresses (23) (see Methods and SI Appendix).
The water adsorption/desorption isotherm features a significant hysteresis. We focus our analysis to pure capillary effects at > and the results compare well with experimental data of Ref. (20). Under harsh drying conditions other chemo-physical processes may take place and these are beyond our scope (24, 25). Our approach allows us to explain the water hysteresis loop from meta-stable ink-bottleneck states upon desorption due to the pore constrictions in cement paste. This contrasts with previous results based on equilibrium thermodynamics for both adsorption and desorption branches and pore connectivity assumption (25, 26).
To investigate the poromechanical effect of internal eigenstresses and water capillary forces, we simulated a second cycle of adsorption/desorption 1) on the “aged” (the hardened configuration relaxed to zero average eigenstress by means of Molecular Dynamics (MD) simulation in the NPT ensemble) and 2) on the “capillary aged” (the hardened configuration relaxed to zero average eigenstress by MD simulation in the NPT ensemble under the action of capillary forces at where capillary forces are the largest; see next sections). All curves for the adsorption branch of water are superposable (Fig.2b). The desorption branches differ between the hardened and the two relaxed configurations, showing a densification tendency altering pore constrictions, due to structural relaxation. We note that the distribution of pore sizes between the hardened and relaxed configurations show no significant differences (Fig.2d).
Pore size distribution (PSD) is an important piece of information in the characterization of porous media, which experimentally is often derived from adsorption/desorption isotherms (27, 28, 29), using Kelvin’s equation and surface adsorption models(30, 31, 32). However, isolated and geometrically idealized pore shapes such as cylinders or spheres are usually assumed in these calculations. Another way to calculate PSD is using Monte Carlo (MC) sampling of the pore space of simulated samples (as in this work) or experimentally-acquired 3d tomography images (33). To access the pore connectivity down to nanometer scale, techniques as nuclear magnetic resonance (NMR) or X-ray tomography (see e.g. (29, 34)) are used. Here, we apply the MC algorithm to the mesoscale cement paste models that have a realistic PSD in agreement with experimental data (18).
The extracted PSDs are compared in Fig.2c and d for nitrogen and water respectively. The MC results capture a population of gel pores ( nm) and large pores that extends to 25 nm. The Kelvin equation results for nitrogen shows similar features. However, for water the Kelvin equation results feature bi-modal distributions with both peaks smaller than 5 nm, similar to the curves derived from experimental data in Ref. (20). The lack of large pores derived from the Kelvin equation using water sorption isotherm data is due to the non-linear relationship between Kelvin radius and the relative humidity , so that pores larger than 5 nm will correspond to >95%. Our results indicate that the PSD derived from nitrogen soprtion isotherms are consistent with the real morphology of the pore space, while those derived from water sorption isotherms lack the large capillary pores. However, such incomplete PSDs from water sorption experiments are often reported in the literature.
Capillary Forces at nano-grains Level
Having the water distributions from the lattice gas DFT simulations, we proceed to calculate the capillary forces on the nano-grains following our previous work described in Ref. (16). At low water saturation, capillary bridges between 2 or more nano-grains can be described by Kelvin’s equation. This traditional method requires increasing effort for more nano-grains (35, 36) and fail when liquid clusters starts percolating. The advantage of our method (16) is to enable us to calculate capillary stress at arbitrary liquid saturation levels. We first construct the Korteweg stress field (37, 38) based on the liquid density and its gradient (see Materials and Methods). Then we integrate the stresses over the surface of Voronoi cells of each nano-grains to obtain the capillary forces.
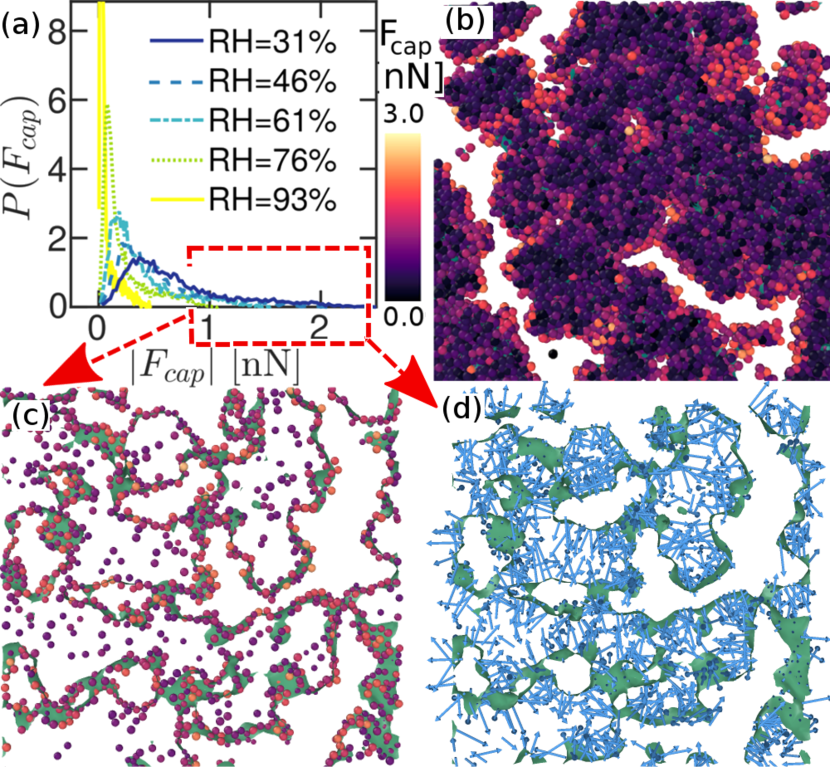
Fig.3a shows the water capillary force per nano-grain distributions computed at different values. Qualitatively, capillary forces increase in magnitude when decreases. The forces at (the closing point of the hysteris loop) exhibit a long-tailed distribution at the particle level, with a mean value around nN and the largest is above nN (see Fig.3a). The maximum of (3 nN) is still smaller than the magnitude of solid-solid particle interaction forces ( 5-10 nN). Fig.3b shows the magnitude of the capillary force on each particle of a thin section of the 3D hardened cement paste.
Fig.3c and d depict the particles experiencing the largest capillary forces at (magnitude and vector respectively). The small gel pores are always filled until low , while large capillary pores remain empty even at high , thus creating largest capillary forces between the gel pores (15 nm) and the capillary pores (>5 nm). The overall capillary effect at is densification of the solid texture since the capillary forces enhance attractions between nano-grains surrounding small capillary pores.
Irreversible Rearrangements due to Capillary Stresses
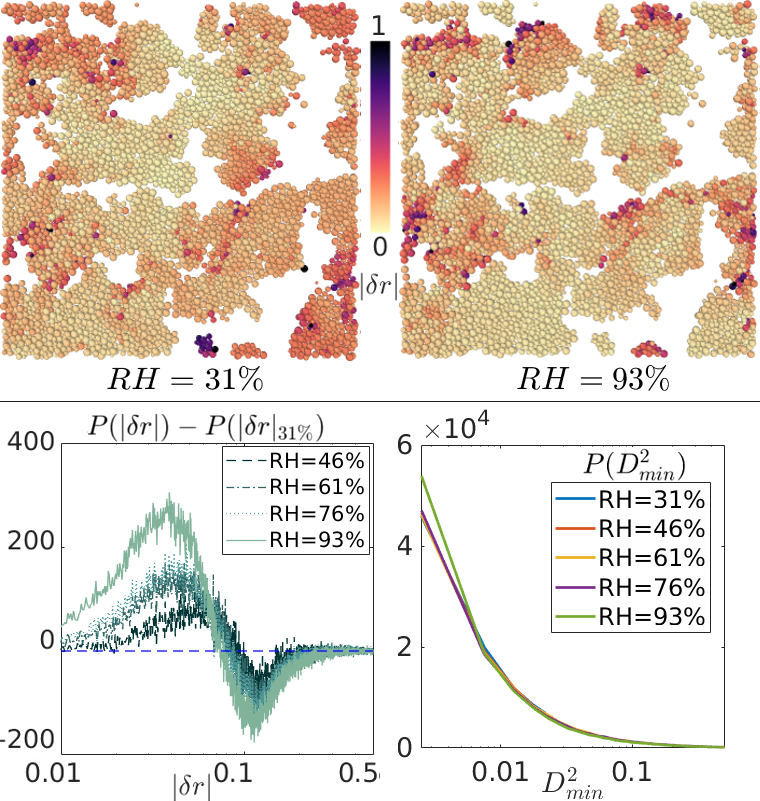
We further investigate the relaxation of the solid structure with eigenstresses (hardened sample) under wet conditions using MD simulations with capillary and pairwise particle interactions. We assume the capillary forces to be constant along the MD trajectories. This assumption is proven to be valid as capillary forces do not induce large particle displacements as shown in Fig.4(a) where the distributions of particle displacement magnitudes (, being the average particle diameter) are displayed. Under the action of capillary forces in all , only <0.1% of the particle population undergo displacement comparable to their own size (i.e. few nm). This is due to the fact that the magnitude of the capillary forces are in general five times smaller than inter-particle cohesion. As the value decreases, capillary forces increase, and the peak of distribution shifts to larger values. At larger displacements, the distributions at all exhibit an algebraic decay with characteristic exponent equal to .
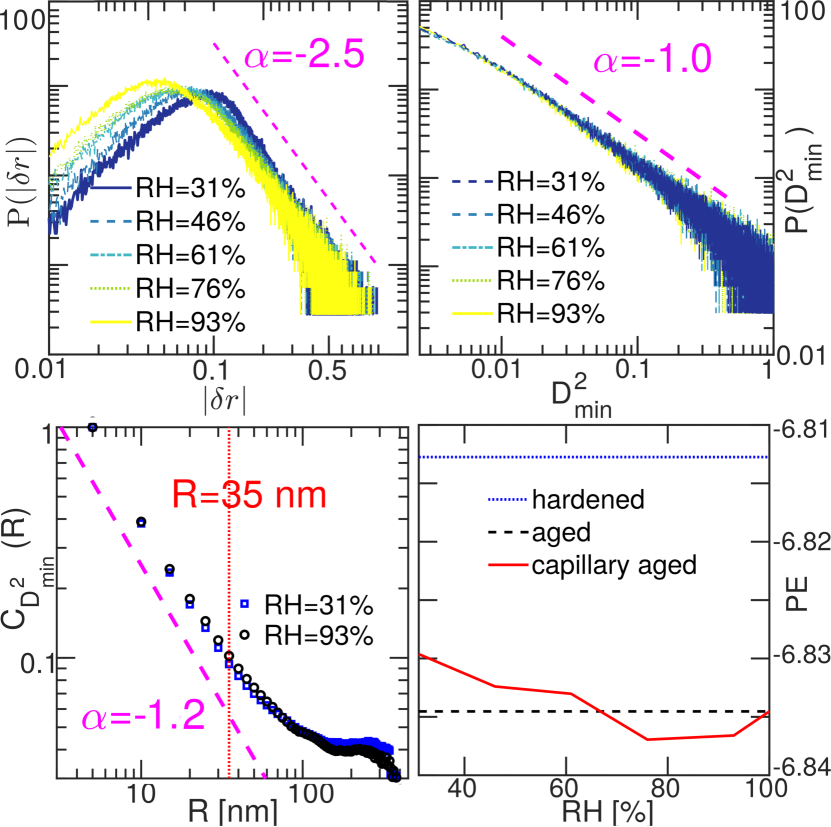
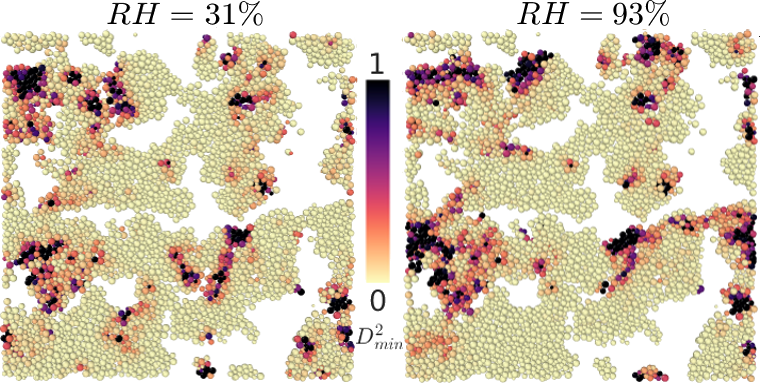
To investigate further the effect of capillarity in the structural relaxation of cement, we measure the drying induced irreversible diplacements in the capillary aged sample taking as reference the aged sample. This quantity is akin to what in glass physics is coined nonaffine displacement, which in our case is a result of capillary pressure. (See more details in Materials and Methods.)
Fig.4(b) shows the distributions of nonaffine deformations that exhibit long range correlations with algebraic decay with exponent of at all . However, further analysis of by means of the spatial correlation function
| (1) |
shows an algebraic behavior of exponent restricted to short distances (R<35 nm, see Fig.4(c)) by contrast to observations for dense colloidal glasses under shear deformations (39, 40). We tentatively attribute this behavior to the presence of capillary pores that localized these nonaffine deformations at their vicinity.
We note that high RH values (>) result in a lower potential energy (PE) of the system than the fully wet aging condition (no capillary effects) after relaxation, as seen in Fig.3(d). This range of values corresponds to capillary forces of smaller amplitude (see Fig.2a). Capillary forces of larger amplitude at RH < increase the PE.
Stress Homogenization
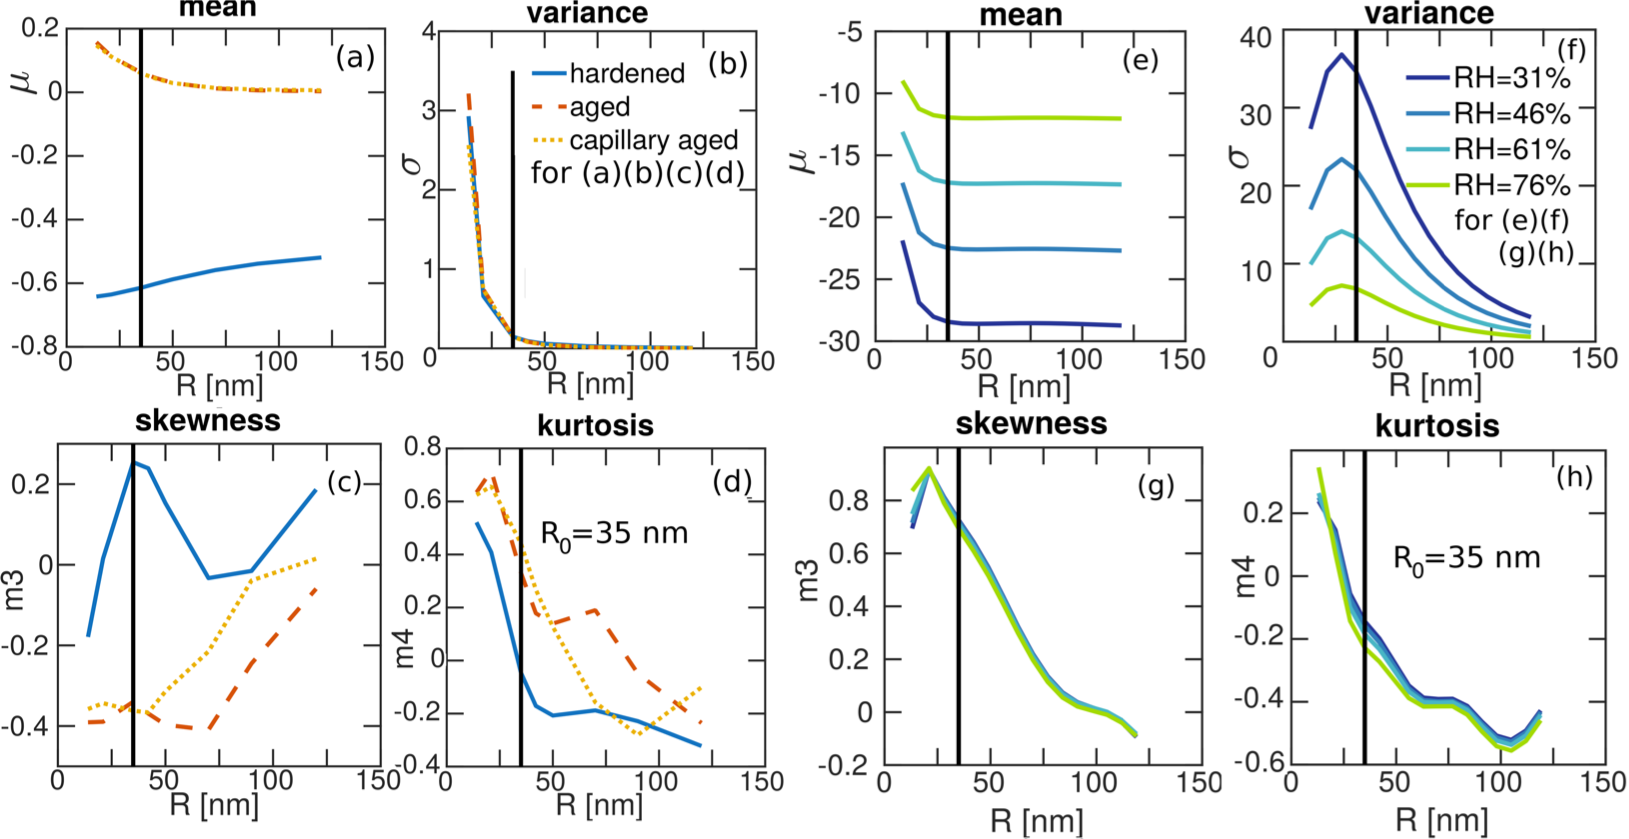
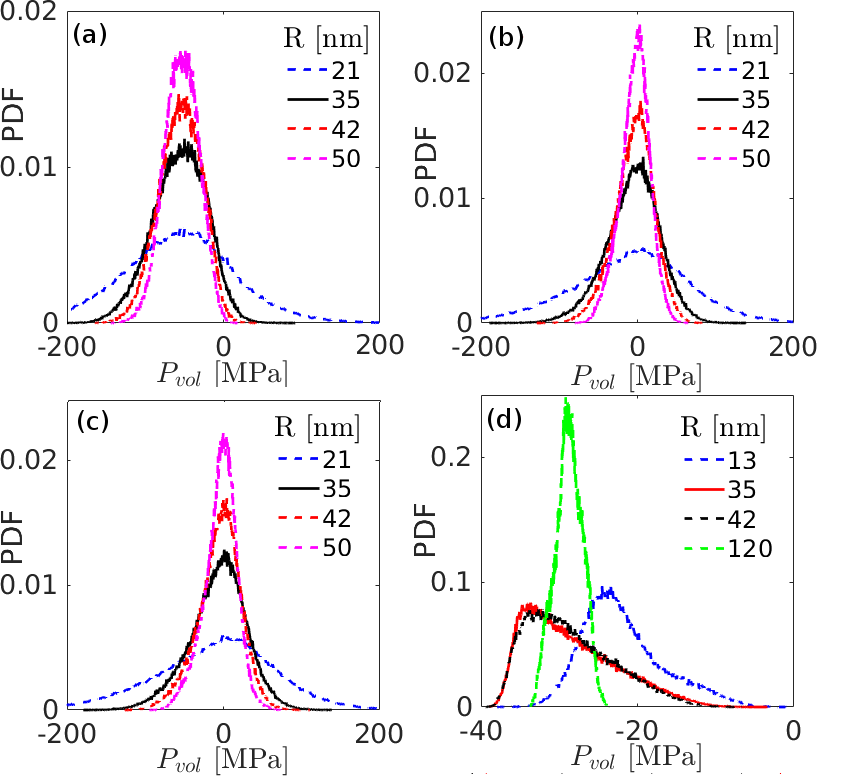
The capillary forces calculated on the cement hydrate nano-grains show a heterogeneous distribution (Fig.3(a)). We adopt the Love-Weber homogenization(41, 42) scheme to coarse-grain the nanometric capillary stress distribution (see SI Appendix). For solid and capillary stresses, we tested different homogenization scales (Fig.5) ranging from 10 nm to 100 nm in all the cement paste models considered in this work. The distribution of solid stress in the hardened sample shows a maximum at non zero pressure due to the eigenstress acquired during setting. The distributions of solid stresses in the aged and capillary aged samples are similar in amplitude and width (see SI Appendix). The shape and width of the capillary stress distribution at for the hardened sample change with (see Fig.S3 and skewness in Fig.5g ). However, Fig.5 presenting the first four moments of these distributions, indicates that a characteristic length scale emerges around 35 nm. Above this scale, the first moments converge to the macroscopic mean, the second moments monotonically decreases and the excess kurtosis is negative or close to zero indicating shorter tails than the normal distribution.
Beside the heterogeneity of the structure, it is interesting to note that is an order of magnitude smaller than the simulation box size ( nm) and it is also similar to the correlation length of in Fig.4(c). The emerging homogenization length common to both capillary stress and solid stress, is rationalized as the scale of long range spatial correlations inherent in the heterogeneous texture has been shown in Ref. (18) via scattering data and chord length distributions.
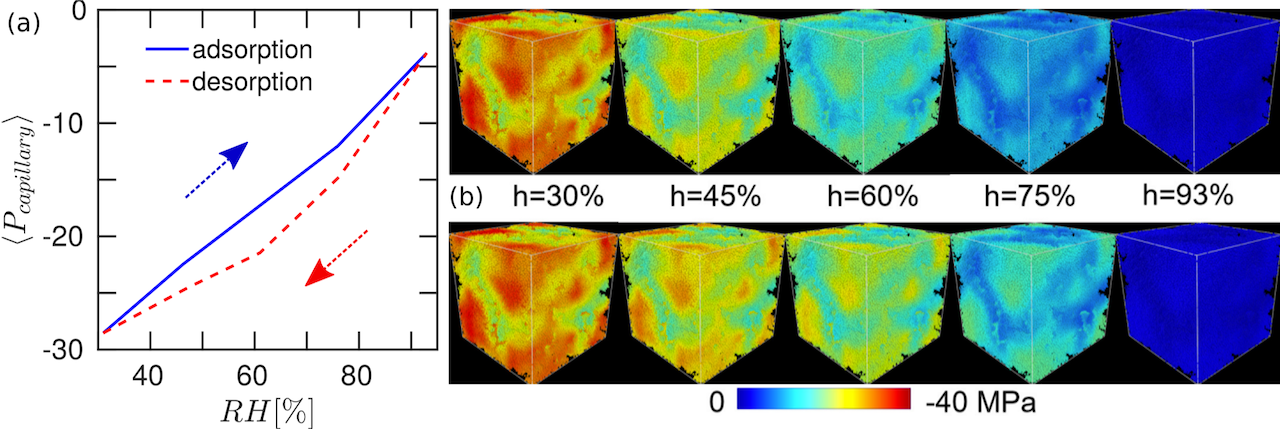
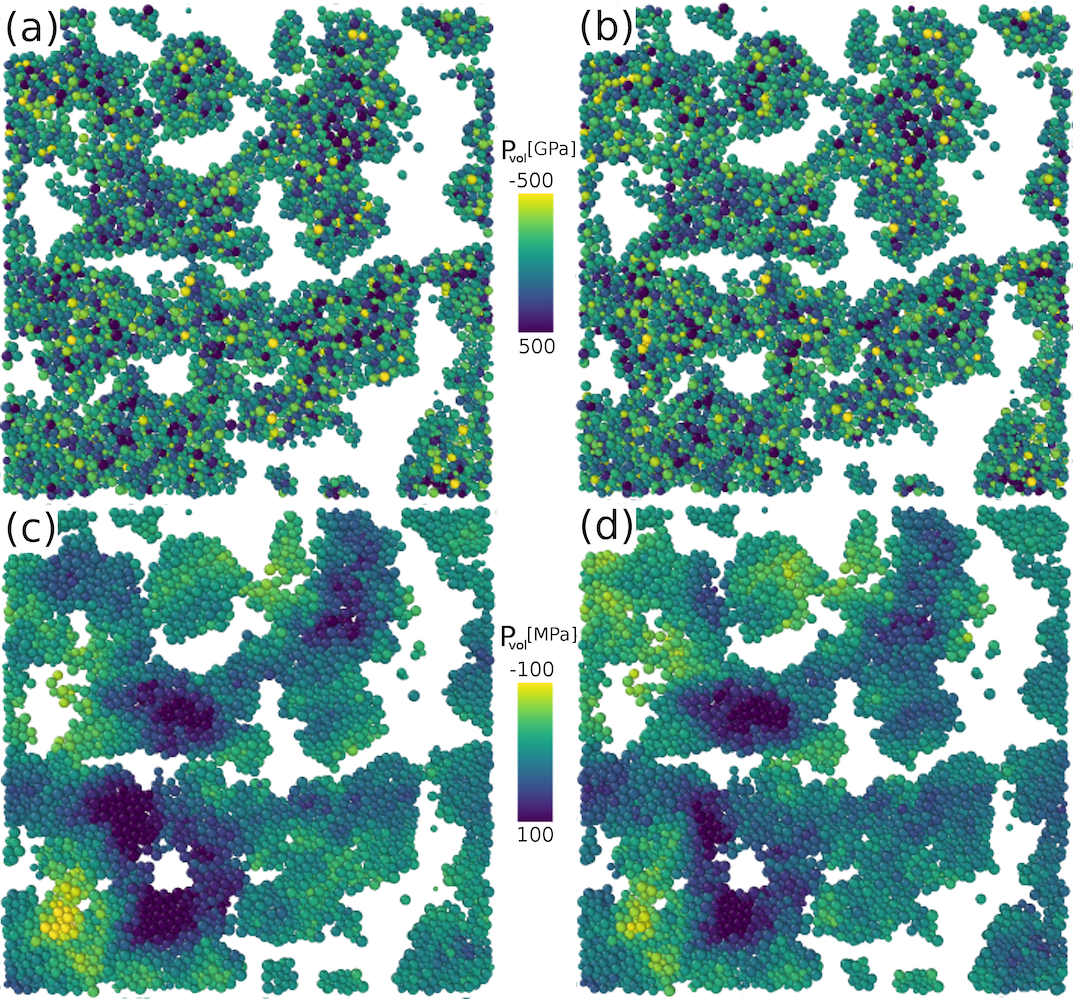
Averaging over the entire simulation box results in the overall capillary pressure at the micron level, as shown in Fig.6(a). Cement paste, although a heterogeneous porous medium, displays a hysteretic capillary pressure similar to that found for simple geometry porous media (9, 5). Fig.6(b) shows the homogenized capillary pressure calculated at =35 nm at different during adsorption (upper row) and desorption (lower row). In absolute value, the homogenized capillary stress is larger upon desorption and it is more intense in densest matrix regions.
Conclusion
In this work, we investigated the role of capillary forces in the relaxation mechanism of a granular model of cement paste under partial saturation, from the nano-grain level (5 nm) to the mesoscale (400 nm). We achieved agreement with nitrogen and water sorption experiments, and assessed the validity of the Kelvin equation in determining the PSD of cement paste. We showed that nitrogen desorption data give better PSD than water, compared with the PSD obtained from 3D stereological analysis. We also considered one more drying/wetting cycle showing structural densification but without significant change of the PSDs.
The framework that we developed based on the liquid distribution and stress field at the nano-grain level enables us to show that the largest capillary forces are concentrated at the interface between gel pores and larger capillary pores. We found that the largest capillary forces are obtained at the closure point of the hysteresis loop (RH=31%) and correspond to menisci located at the interface between gel and capillary pores. These forces induce local irreversible rearrangements that have relatively short spatial length correlations due to the presence of the capillary pores spanning the samples, and hence do not exhibit the long-range character found in colloidal glasses during inhomogeneous shear (40, 39). Under additional mechanical loading and longer timescales, or with multiple drying/wetting cycles, we speculate that they may contribute altogether to creep and fracture, similar to observations in amorphous materials (43, 44) and fluid saturated rocks(6).
The results suggest a homogenization length scale common to both liquid and solid stress fields, correlated with the scale of structural heterogeneities. Therefore this length sets the representative volume element (RVE) size for upscaling poromechanics, either using discrete or continuum descriptions such as the LEM method(45).
In soft porous materials, capillary forces are comparable to the solid cohesive forces and may induce large deformations, such as drying of colloidal suspensions (46, 47). The framework we proposed can be readily adopted in these materials.
Sorption Simulations and Stress Calculation
The sorption simulations are based on the lattice gas density functional theory model (21, 22), by minimizing the grand potential: , where denotes the normalized density of fluid on site i, continuously varying from 0 to 1, or 1 indicating site i occupied by solid or vacant, and are the fluid-fluid interaction and fluid-solid interaction energy, respectively. is determined by the bulk critical point , with the number of nearest neighbors. is imported from atomistic simulation data as the isosteric heat of adsorption (i.e. the differential heat of adsorption), in the limit of zero-coverage. For water and nitrogen adsorption in cement (24). To estimate the lattice spacing , we estimate the surface tension which is energy per area, . For nitrogen at K, 8.94 mN/m which gives 0.345 nm. For water at K, 72 mN/m which gives 0.24 nm. Based on the estimates we choose a fine grid cell size of . Taking g/mL for solid phase density of cement hydrates, we convert degree of saturation measured from the simulations to total amount of absorbed liquid in cement paste. The Korteweg stress tensor can be derived as (see SI Appendix) , where is the identity tensor and an arbitrary constant tensor. is the asymptotic bulk value of the hydrostatic pressure.
Simulations of structural relaxation
The initial mesoscale configuration of cement hydrates is the hardened configuration that has an average eigenstress -50 MPa. Structural relaxation MD simulations of the hardened sample were carried out using LAMMPS(48) on NPT conditions of zero pressure and room temperature. Capillary forces at different values were constantly applied during the entire simulation. The hardened configuration under the action of capillary forces at , where the distribution of capillary forces has the longest tail is called capillary aged. All simulations were terminated after 500000 MD steps with time step in reduced unit when the system had converged. From the particle positions, nonaffine displacements were computed. The nonaffine displacement is defined as , where runs over neighbors of the central particle indexed by 0 (49, 50). corresponds to the deformation gradient in continuum mechanics, and essentially captures the higher order deformations that are usually not considered in linear theories. The reference configuration for the nonaffine displacements was the aged configuration. The aged configuration is final state of the hardened configuration after relaxation to zero average eigenstress by MD simulation in the same NPT conditions (zero pressure and room temperature) but without capillary forces (only inter particle interactions).
1 Supplement Information Appendix
1.1 Mesoscale model of hardened cement paste
Ioannidou’s et al. mesoscale C-S-H model (23, 18) was used to calculate the water adsorption/desorption by DFT simulations. The precipitation of C-S-H nano-grains and settings was simulated using the approach recently proposed in Ref. (15). In this approach, a free energy gain drives the precipitation of particles of few nanometers (C-S-H nanoscale hydrates) which also interact and aggregate. The simulations consisted of a Grand-Canonical Monte Carlo (GCMC) scheme, where the chemical potential corresponds to the free energy gain just mentioned, coupled to a Molecular Dynamics (MD) scheme.
The effective interparticle forces between cement hydrates depends on the concentration of calcium ions in the solution and changes during the hydration (51, 52). In precious works, the microstructure of C-S-H gels at early hydration stages was investigated using attracto-repulsive potential arising from ion-ion correlation forces (15, 23).
Differently from (15) here we consider only effective interactions that would correspond to the hardened cement paste and can be well modeled (18) with a short-range attractive Mie potential
| (2) |
where is the inter-particle distance, is the well depth (with the unit energy) between two particles with size diameter and we have fixed the exponent to . We have set and the temperature to (typically measured in units ), while time is measured in usual MD units , all in reduced units.
A GCMC cycle consists of attempts of particle insertion or deletion and it is followed by MD steps. where nm is the length of the simulation box and , is the rate of hydrate production that mimics the chemistry of the system. For the simulations reported here we use a chemical potential (in reduced units) and a rate .
During hydration of cement, densification of C–S–H is heterogeneous and that this is the source of significant local structural and mechanical heterogeneitieis in the final solid material. For a more realistic structure, particle size polydispersity was introduced in the following way. Each particle of a configuration containing 177975 particles was randomly assigned a particle diameter in the range between and nm. To facilitate the computation the range of diameters was discretized into 53 intervals. Then the simulation box size was increased by to avoid particle overlapping and energy minimization with the conjugate gradient algorithm was applied. The mesoscale structure produced by the precipitation persists after the introduction of polydisperse particle sizes. All MD and GCMC simulations have been performed using LAMMPS (48).
The model cement paste has accumulated eigen-stresses due to the out-of-equilibrium precipitation of nano-grains. This configuration is named “hardened” cement paste. This particle configurations was relaxed to a total pressure as close to zero as possible, being less than . Cycles of energy minimization using conjugate gradient with and without box size change were applied with energy tolerance . This relaxed configuration is named “aged” cement paste. The hardened sample relaxed with capillary forces calculated on the hardened structure at RH = 31% where capillary effects are larger, referred to as “capillary aged” sample.
1.2 Sorption simulation and capillary forces
We use the lattice gas density functional theory (DFT) to simulate both nitrogen and water adsorption/desorption isotherms in cement paste. This approach was first developed by Kierlik (21, 22) for adsorption/desorption of a non polar fluid in a quenched random porous solid. Subsequently, it was applied to Vycor(53), controlled porous silica glasses and aerogels (54, 55), to infer qualitatively adsorption/desorption isotherms through minimizing the grand potential:
| (3) |
where denotes the normalized density of fluid on site i, continuously varying from 0 to 1, or 1 indicating site i occupied by solid or vacant. and are the fluid-fluid interaction and fluid-solid interaction, respectively. is only a property of the fluid, determined by the bulk critical point , with the number of nearest neighbors. While is imported from atomistic simulation data as the isosteric heat of adsorption (i.e. the differential heat of adsorption), in the limit of zero-coverage (for water adsorption in cement see Figure 4 in (24), giving . Same ratio is taken for nitrogen). The parameters and are in units of energy. To arrive at a characteristic length scale as the lattice spacing a, we estimate the surface tension which is energy per area:
| (4) |
for nitrogen at , which gives ; for water at , which gives . Based on the estimates we choose a fine grid cell size of . Taking for solid phase density of CSH, we convert degree of saturation measured from the simulations to total amount of absorbed water in cement paste.
For capillary force and drying shrinkage, we first simulate one wetting-drying cycle of water sorption on the hardened structure with eigen-stress that has not been released after C-S-H precipitation. Then we take liquid distributions at different relative humidities and calculate capillary forces on the nano-particles according to the framework described in reference (56). The continuum limit of the lattice gas model is the Cahn-Hilliard model:
| (5) |
where is the boundary normal vector at liquid-solid surface denoted by , pointing from liquid outward into solid; is the choice of lattice spacing, =6 the number of nearest neighbors. We can derive the Korteweg stress tensor in this context. Thermodynamics shows that pressure is for a homogeneous system of free energy . At mechanical equilibrium, we generalize the stress tensor for an inhomogeneous system, insisting that it should satisfy:
| (6) |
where the last equality essentially neglects all higher order terms in the expansion of . Using Stokes’ theorem
| (7) |
Now where Because of the identities
| (8) |
and notice we then have
| (9) |
Finally we arrive at the generalized inhomogeneous stress tensor
| (10) |
where is an arbitrary tensor constant and the asymptotic bulk value of the hydrostatic pressure. Integration of the stress tensor over Voronoi cell faces of nano-grains produces a capillary force vector associated with each nano-grain.
1.3 Relaxation with and without capillary forces
For each relative humidity () value, molecular dynamics (MD) simulations were carried out using LAMMPS(48, 57) on the cement hydrate model, performing NPT relaxation at room temperature and 0 ambient pressure. NVT relaxation are also performed but not discussed here. Capillary forces were constantly applied during the entire simulation. All simulations were terminated after 500000 MD steps with timestep in Lennard-Jones unit when the system is already converged and stable. We start from the configuration right after out-of-equilibrium dissolution-precipitation, referred to as “hardened” sample, that has an overall eigenstress -50 MPa. 2) the hardened sample relaxed to 0 average eigen-stress, referred to as “aged” sample and 3) the hardened sample relaxed with capillary forces calculated on the hardened structure at RH = 31%.
1.4 Stress homogenization and deformation analysis
Under the assumption of mechanical equilibrium, the Love-Weber stress takes the same mathematical form as the Virial stress(58):
| (11) |
where one sums over particles indexed by on the boundary of the homogenization volume element V, which is a sphere of radius centered on each particle. is the jth coordinate of particle , the ith component of capillary force on particle Fig.7 (a)(b) show the displacement fields at and . Throughout this work all deformation analysis were done with a cut-off radius equal 2 times of average nano-particle radius. Homogeneous background is always subtracted when calculating the strain fields. As increases, the distribution of slightly narrows so that more particles experience very small non-affine deformations, as shown in Fig.7(d). We show a cross section view of the non-affine deformations at RH=31% and 93% in Fig.8.
The homogenized capillary stress field is calculated according to Eqn.(1) in main text. A Love stress tensor is obtained for each particle for a given sphere radius. The distribution of liquid stress is shown in Fig.9 (d), together with the solid stress PDFs (a-c). The solid stresses in aged and capillary aged samples are contrasted in Fig.10(a)(b), together with their homogenized version in (c)(d).
The authors would like to thank E. Masoero (U Newcastle), S. Yip and P. Cao (MIT) for helpful discussions. This work has been supported by the Concrete Sustainability Hub at MIT, A*MIDEX (the Aix-Marseille University foundation) and CNRS. K.I. acknowledges the support of the CEMCAP CNRS-Momentum program.
References
- Schießl et al. (2000) A Schießl, WJ Weiss, JD Shane, NS Berke, TO Mason, and SP Shah. Assessing the moisture profile of drying concrete using impedance spectroscopy. Concrete Science and Engineering(France), 2(6):106–116, 2000.
- Feldman and Sereda (1968) Rolf F Feldman and Peter J Sereda. A model for hydrated portland cement paste as deduced from sorption-length change and mechanical properties. Materials and structures, 1(6):509–520, 1968.
- Thomas et al. (2008) Jeffrey J Thomas, Andrew J Allen, and Hamlin M Jennings. Structural changes to the calcium–silicate–hydrate gel phase of hydrated cement with age, drying, and resaturation. Journal of the American Ceramic Society, 91(10):3362–3369, 2008.
- Maruyama et al. (2015) Ippei Maruyama, Go Igarashi, and Yukiko Nishioka. Bimodal behavior of csh interpreted from short-term length change and water vapor sorption isotherms of hardened cement paste. Cement and Concrete Research, 73:158–168, 2015.
- Gor et al. (2017) Gennady Y Gor, Patrick Huber, and Noam Bernstein. Adsorption-induced deformation of nanoporous materials—a review. Applied Physics Reviews, 4(1):011303, 2017.
- Brantut and Rice (2011) Nicolas Brantut and James R Rice. How pore fluid pressurization influences crack tip processes during dynamic rupture. Geophysical Research Letters, 38(24), 2011.
- Gelb et al. (1999) Lev D Gelb, KE Gubbins, R Radhakrishnan, and M Sliwinska-Bartkowiak. Phase separation in confined systems. Reports on Progress in Physics, 62(12):1573, 1999.
- Pellenq et al. (2009a) Roland J-M Pellenq, Benoit Coasne, Renaud O Denoyel, and Olivier Coussy. Simple phenomenological model for phase transitions in confined geometry. 2. capillary condensation/evaporation in cylindrical mesopores. Langmuir, 25(3):1393–1402, 2009a.
- Gor and Neimark (2010) Gennady Yu Gor and Alexander V Neimark. Adsorption-induced deformation of mesoporous solids. Langmuir, 26(16):13021–13027, 2010.
- Torquato (2013) Salvatore Torquato. Random heterogeneous materials: microstructure and macroscopic properties, volume 16. Springer Science & Business Media, 2013.
- Rycroft et al. (2009) Chris H Rycroft, Ken Kamrin, and Martin Z Bazant. Assessing continuum postulates in simulations of granular flow. Journal of the Mechanics and Physics of Solids, 57(5):828–839, 2009.
- Kamrin et al. (2007) Ken Kamrin, Chris H Rycroft, and Martin Z Bazant. The stochastic flow rule: a multi-scale model for granular plasticity. Modelling and Simulation in Materials Science and Engineering, 15(4):S449, 2007.
- Bonnaud et al. (2016) Patrick A Bonnaud, Christophe Labbez, Ryuji Miura, Ai Suzuki, Naoto Miyamoto, Nozomu Hatakeyama, Akira Miyamoto, and Krystyn J Van Vliet. Interaction grand potential between calcium–silicate–hydrate nanoparticles at the molecular level. Nanoscale, 8(7):4160–4172, 2016.
- Pellenq et al. (2009b) Roland J-M Pellenq, Akihiro Kushima, Rouzbeh Shahsavari, Krystyn J Van Vliet, Markus J Buehler, Sidney Yip, and Franz-Josef Ulm. A realistic molecular model of cement hydrates. Proceedings of the National Academy of Sciences, 106(38):16102–16107, 2009b.
- Ioannidou et al. (2014) Katerina Ioannidou, Roland J-M Pellenq, and Emanuela Del Gado. Controlling local packing and growth in calcium–silicate–hydrate gels. Soft Matter, 10(8):1121–1133, 2014.
- Zhou et al. (2019) Tingtao Zhou, Katerina Ioannidou, Enrico Masoero, Mohammad Mirzadeh, Roland J.-M. Pellenq, and Martin Z. Bazant. Capillary stress and structural relaxation in moist granular materials. Langmuir, 35(12):4397–4402, 2019. 10.1021/acs.langmuir.8b03400. URL https://doi.org/10.1021/acs.langmuir.8b03400. PMID: 30798608.
- Ioannidou et al. (2016a) Katerina Ioannidou, Matej Kanduc, Lunna Li, Daan Frenkel, Jure Dobnikar, and Emanuela Del Gado. The crucial effect of early-stage gelation on the mechanical properties of cement hydrates. Nature Communications, 7:12106, 2016a.
- Ioannidou et al. (2016b) Katerina Ioannidou, Konrad J Krakowiak, Mathieu Bauchy, Christian G Hoover, Enrico Masoero, Sidney Yip, Franz-Josef Ulm, Pierre Levitz, Roland J-M Pellenq, and Emanuela Del Gado. Mesoscale texture of cement hydrates. Proceedings of the National Academy of Sciences, 113(8):2029–2034, 2016b.
- Mikhail et al. (1964) R Sh Mikhail, Llewellyn Everard Copeland, and Stephen Brunauer. Pore structures and surface areas of hardened portland cement pastes by nitrogen adsorption. Canadian Journal of Chemistry, 42(2):426–438, 1964.
- Baroghel-Bouny (2007) Véronique Baroghel-Bouny. Water vapour sorption experiments on hardened cementitious materials: Part i: Essential tool for analysis of hygral behaviour and its relation to pore structure. Cement and Concrete Research, 37(3):414–437, 2007.
- Kierlik et al. (2001a) E Kierlik, PA Monson, ML Rosinberg, L Sarkisov, and G Tarjus. Capillary condensation in disordered porous materials: Hysteresis versus equilibrium behavior. Physical review letters, 87(5):055701, 2001a.
- Kierlik et al. (2002) E Kierlik, PA Monson, ML Rosinberg, and G Tarjus. Adsorption hysteresis and capillary condensation in disordered porous solids: a density functional study. Journal of Physics: Condensed Matter, 14(40):9295, 2002.
- Ioannidou et al. (2017) Katerina Ioannidou, Emanuela Del Gado, Franz-Josef Ulm, and Roland J-M Pellenq. Inhomogeneity in cement hydrates: Linking local packing to local pressure. Journal of Nanomechanics and Micromechanics, 7(2):04017003, 2017.
- Bonnaud et al. (2012) PA Bonnaud, Q Ji, B Coasne, RJ-M Pellenq, and KJ Van Vliet. Thermodynamics of water confined in porous calcium-silicate-hydrates. Langmuir, 28(31):11422–11432, 2012.
- Pinson et al. (2015) Matthew B Pinson, Enrico Masoero, Patrick A Bonnaud, Hegoi Manzano, Qing Ji, Sidney Yip, Jeffrey J Thomas, Martin Z Bazant, Krystyn J Van Vliet, and Hamlin M Jennings. Hysteresis from multiscale porosity: Modeling water sorption and shrinkage in cement paste. Physical Review Applied, 3(6):064009, 2015.
- Pinson et al. (2018) Matthew B Pinson, Tingtao Zhou, Hamlin M Jennings, and Martin Z Bazant. Inferring pore connectivity from sorption hysteresis in multiscale porous media. Journal of colloid and interface science, 532:118–127, 2018.
- Lowell et al. (2012) Seymour Lowell, Joan E Shields, Martin A Thomas, and Matthias Thommes. Characterization of porous solids and powders: surface area, pore size and density, volume 16. Springer Science & Business Media, 2012.
- Sing (1985) Kenneth SW Sing. Reporting physisorption data for gas/solid systems with special reference to the determination of surface area and porosity (recommendations 1984). Pure and applied chemistry, 57(4):603–619, 1985.
- Rouquerol et al. (2012) Jean Rouquerol, Gino V Baron, Renaud Denoyel, Herbert Giesche, Johan Groen, Peter Klobes, Pierre Levitz, Alexander V Neimark, Sean Rigby, Romas Skudas, et al. The characterization of macroporous solids: An overview of the methodology. Microporous and Mesoporous Materials, 154:2–6, 2012.
- Barrett et al. (1951) Elliott P Barrett, Leslie G Joyner, and Paul P Halenda. The determination of pore volume and area distributions in porous substances. i. computations from nitrogen isotherms. Journal of the American Chemical society, 73(1):373–380, 1951.
- Hagymassy Jr et al. (1969) Julius Hagymassy Jr, Stephen Brunauer, and R Sh Mikhail. Pore structure analysis by water vapor adsorption: I. t-curves for water vapor. Journal of Colloid and Interface Science, 29(3):485–491, 1969.
- Langmuir (1918) Irving Langmuir. The adsorption of gases on plane surfaces of glass, mica and platinum. Journal of the American Chemical society, 40(9):1361–1403, 1918.
- Bhattacharya and Gubbins (2006) Supriyo Bhattacharya and Keith E Gubbins. Fast method for computing pore size distributions of model materials. Langmuir, 22(18):7726–7731, 2006.
- Chae et al. (2013) Sejung R Chae, Juhyuk Moon, Seyoon Yoon, Sungchul Bae, Pierre Levitz, Robert Winarski, and Paulo JM Monteiro. Advanced nanoscale characterization of cement based materials using x-ray synchrotron radiation: a review. International Journal of Concrete Structures and Materials, 7(2):95–110, 2013.
- Melnikov et al. (2015) Konstantin Melnikov, Roman Mani, Falk K Wittel, Marcel Thielmann, and Hans J Herrmann. Grain-scale modeling of arbitrary fluid saturation in random packings. Physical Review E, 92(2):022206, 2015.
- Delenne et al. (2015) Jean-Yves Delenne, Vincent Richefeu, and Farhang Radjai. Liquid clustering and capillary pressure in granular media. Journal of Fluid Mechanics, 762, 2015.
- Korteweg (1901) Diederick Johannes Korteweg. Sur la forme que prennent les équations du mouvements des fluides si l’on tient compte des forces capillaires causées par des variations de densité considérables mais connues et sur la théorie de la capillarité dans l’hypothèse d’une variation continue de la densité. Archives Néerlandaises des Sciences exactes et naturelles, 6:1–24, 1901.
- Anderson et al. (1998) Daniel M Anderson, Geoffrey B McFadden, and Adam A Wheeler. Diffuse-interface methods in fluid mechanics. Annual review of fluid mechanics, 30(1):139–165, 1998.
- Chikkadi and Schall (2012) V Chikkadi and P Schall. Nonaffine measures of particle displacements in sheared colloidal glasses. Physical Review E, 85(3):031402, 2012.
- Chikkadi et al. (2011) Vijayakumar Chikkadi, Gerard Wegdam, Daniel Bonn, Bernard Nienhuis, and Peter Schall. Long-range strain correlations in sheared colloidal glasses. Physical Review Letters, 107(19):198303, 2011.
- Love (2013) Augustus Edward Hough Love. A treatise on the mathematical theory of elasticity. Cambridge university press, 2013.
- Weber (1966) J Weber. Recherches concernant les contraintes intergranulaires dans les milieux pulvérulents. Bulletin de Liaison des Ponts-et-chaussées, 20:1–20, 1966.
- Cao et al. (2017) Penghui Cao, Michael P Short, and Sidney Yip. Understanding the mechanisms of amorphous creep through molecular simulation. Proceedings of the National Academy of Sciences, 114(52):13631–13636, 2017.
- Cao et al. (2018) Penghui Cao, Karin A Dahmen, Akihiro Kushima, Wendelin J Wright, Harold S Park, Michael P Short, and Sidney Yip. Nanomechanics of slip avalanches in amorphous plasticity. Journal of the Mechanics and Physics of Solids, 114:158–171, 2018.
- Laubie et al. (2017) Hadrien Laubie, Farhang Radjai, Roland Pellenq, and Franz-Josef Ulm. Stress transmission and failure in disordered porous media. Physical review letters, 119(7):075501, 2017.
- Dufresne et al. (2003) Eric R Dufresne, Eric I Corwin, NA Greenblatt, Jacqueline Ashmore, DY Wang, Anthony D Dinsmore, JX Cheng, XS Xie, John W Hutchinson, and David A Weitz. Flow and fracture in drying nanoparticle suspensions. Physical Review Letters, 91(22):224501, 2003.
- Tsapis et al. (2005) Nicolas Tsapis, Eric R Dufresne, Shrabani S Sinha, Christophe S Riera, John W Hutchinson, Lakshminarayana Mahadevan, and David A Weitz. Onset of buckling in drying droplets of colloidal suspensions. Physical Review Letters, 94(1):018302, 2005.
- Plimpton (1995) Steve Plimpton. Fast parallel algorithms for short-range molecular dynamics. Journal of computational physics, 117(1):1–19, 1995.
- Falk and Langer (1998) Michael L Falk and James S Langer. Dynamics of viscoplastic deformation in amorphous solids. Physical Review E, 57(6):7192, 1998.
- Shimizu et al. (2007) Futoshi Shimizu, Shigenobu Ogata, and Ju Li. Theory of shear banding in metallic glasses and molecular dynamics calculations. Materials transactions, 48(11):2923–2927, 2007.
- Pellenq and Van Damme (2004) Roland J-M Pellenq and Henri Van Damme. Why does concrete set?: The nature of cohesion forces in hardened cement- based materials. MRS Bull, 29(5):319–323, 2004.
- Plassard et al. (2005) Cedric Plassard, Eric Lesniewska, Isabelle Pochard, and André Nonat. Nanoscale Experimental Investigation of Particle Interactions at the Origin of the Cohesion of Cement. Langmuir, 21(16):7263–7270, 2005.
- Coasne et al. (2013) Benoit Coasne, Anne Galarneau, Roland JM Pellenq, and Francesco Di Renzo. Adsorption, intrusion and freezing in porous silica: the view from the nanoscale. Chemical Society Reviews, 42(9):4141–4171, 2013.
- Detcheverry et al. (2004) F Detcheverry, E Kierlik, ML Rosinberg, and G Tarjus. Mechanisms for gas adsorption and desorption in silica aerogels: The effect of temperature. Langmuir, 20(19):8006–8014, 2004.
- Kierlik et al. (2001b) E Kierlik, ML Rosinberg, G Tarjus, and P Viot. Equilibrium and out-of-equilibrium (hysteretic) behavior of fluids in disordered porous materials: Theoretical predictions. Physical Chemistry Chemical Physics, 3(7):1201–1206, 2001b.
- Zhou et al. (2018) T. Zhou, K. Ioannidou, E. Masoero, M. Mirzadeh, R. J.-M. Pellenq, and M. Z. Bazant. Capillary stress and structural relaxation in moist granular materials. ArXiv e-prints, March 2018.
- Plimpton et al. (2007) Steve Plimpton, Paul Crozier, and Aidan Thompson. Lammps-large-scale atomic/molecular massively parallel simulator. Sandia National Laboratories, 18:43, 2007.
- Tsai (1979) DH Tsai. The virial theorem and stress calculation in molecular dynamics. The Journal of Chemical Physics, 70(3):1375–1382, 1979.