Power laws in code repositories: A skeptical approach ††thanks: This paper has been supported in part by project DeepBio (TIN2017-85727-C4-2-P)
Abstract
Software development as done using modern methodologies and source control management systems, has been often established as an example of self-organization, with code growing and evolving organically, through activities that do not stem from centralized power, leader or directives. The main challenge in proving these claims is that self organization cannot be detected through direct observation, but through measurements on the system, looking for hints such as the existence of power laws over some features, such as the size of changes over time. The problem we intend to tackle in this paper is to establish a methodology for checking, for a chosen set of repositories we had already measured in the past, if the claims about power laws actually hold from a precise mathematical point of view, since, although shown as pervasive in the software engineering literature (and others), power laws are more elusive than they might seem at first sight. For that reason, in this paper we present a statistically accurate set of tests that will help us decide, from the way repositories are changing, if they are really distributed by a power law, which could indicate us the existence of a state reached via self-organization, or actually, how accurately a power law fits the observed distribution of the size of changes of commits in git repositories of 16 open source repositories. We revisit one of the most representative papers of these observations to reevaluate its results and compare them with the current status of the repositories analyzed in it, trying to elucidate if there has been any change in the possible presence, or not, of a power law.
Keywords: Complex systems, self-organizing systems, self-organized criticality, power laws, software development, software repositories
1 Introduction
There are several steps in the study of self-organized systems [Bak et al., 1988]. One of them is to study the existence of a power law distribution in the data from our system. This property is intrinsically related to the scale-free behaviour these systems exhibit, that is, systems where there is no single characteristic event size [Golyk, 2012]. Understanding what distribution is producing our data gives us insights of how confident we are about claiming that our system is in a critical state, since these states are usually correlated with the appearance of a power law [Newman, 2005].
Moreover, it is interesting to see if there is some kind of evolution in the distribution of the data. A change in the distribution could be originated by a phase change, which usually implies that we have crossed a momentary critical state described by a power law.
However, during the process of investigating the existence of self organization, or the change to a critical state, we have to justify every conclusion we get, not only by fitting our data, but by giving a proper statistical measure of the probability of our conclusions, that is, following an standardize mathematical method based on hypothesis testing.
In our case, we are mainly interested in code repositories. The existence or not of a critical state is essential to understand the processes taking place in free software repositories, which are sometimes partly or fully based on volunteer work. In these cases, sustainability is the main objective, and understanding how self-organization relates to productivity and to the continuous collaboration of volunteers is essential to keep a software team healthy. Also, understanding the micro-mechanisms through which self-organization takes place provides insights on the possible incentives to avoid churn of volunteers, as well as to make their work add as much value as possible to the project.
Following the approach outlined in [Merelo-Guervós, 2016b, Merelo, 2016, Merelo-Guervós, 2017, Merelo et al., 2017b, Merelo et al., 2017a], we are going to try and comprehend code repositories by the interactions (events) made in them. Code repositories are one of the main ways software is developed nowadays. Multiple platforms like GitLab or GitHub offer the possibility of interact with the code making changes, adding and deleting lines. All these interactions are reflected in an archive by the so called commits. From this archive we can obtain the data about how this code has been changed. Although these changes sometimes obey issues with the code, or bug fixes, in many cases they simply are piece-wise improvements or code changes that are decided by programmers themselves.
But to really start to understand the behavior and possible self-organization of software development teams as reflected by their activity in repositories, we should not only try to fit a power law in our data but try to make a statistically accurate study to confirm how much evidence we have of this type of behavior.
Most of the measures and estimations about power laws in code repositories are collected in studies like [Merelo et al., 2017a], where some evidences of power laws are presented. However, since there are better methods to study this data [Clauset et al., 2009], we are going to re-evaluate all the results obtained, offering an alternative skeptic view of the existence of power laws, following recent papers such as [Holme, 2019, Broido and Clauset, 2019].
We have focused in this particular topic because of three reasons.
-
•
First of all, there are no extensive analysis that addresses this question. We haven’t found a comparative study that offers data-based statistical measures to check if the power law assumptions hold. So we are going to fill this gap offering a complete statistically study about the evidences of power laws behavior in a variety of repositories.
-
•
Moreover, we are not going to evaluate just our evidences about the existence of a power law, we are going to offer a short range of distributions that can generate similar results and could easily be confounded by a power law. This is an standard way to discover if our data is more likely to be produced by other heavy-tailed distribution [Clauset et al., 2009], like the logNormal or the truncated power law.
-
•
Finally, since we are able to access to multiple years’ data, we also interested in study the temporal evolution of the two previous analysis. Here our main objective is to show how these measure could have changed (if they have at all). We should remember that repositories are evolving system by definition, so they can experiment qualitative changes in his events distribution. Furthermore, even if they preserve their behaviour, they can still change some distribution’s parameters. To locate and analyze this changes could be translated in a deeper knowledge in the evolution of these system, specially in the presence of phase changes [Merelo et al., 2017a] or self-organized critically (understood as a mechanism by which the system is regulating himself to stay in those parameters [Newman, 2005]).
This way, we offer a test to analyze how much evidence there is for or against our assumptions in every step, and a set of comparatives to identify some relevant temporal changes, establishing a statistically correct result about the existence of power laws in repositories.
All these questions lead us to our final result: power laws are not the only concept that should be used to address the question of self organization in repositories [Alderson and Doyle, 2010], we should use additional measures to assure our conclusions. Even if we use them, the statistical significance of these fits is very low (which means that other distributions have at least the same probability of being generating the data).
Next, we will explain our methodology followed by the results obtained, closing with our conclusions.
2 State of the art
The study of code repositories from the point of view of self-organized criticality has not followed a continuous line of investigation. Methods and conclusions often change from one research paper to another, making difficult to compare results and possible implications.
On the one hand, we find that self-organized criticality has been described by a wide variety of code repositories with a certain probability. These studies can be found in[Wu et al., 2007, Gorshenev and Pis’mak, 2004], but they are not the only ones of this kind. Tests on the possible self-organized criticality have also been sought in another type of repositories and projects, which are enumerable in size and purpose [Merelo, 2016, Merelo-Guervós, 2016a, Merelo-Guervós, 2016b, Merelo et al., 2017a].
In most of these studies, however, the evidences in favor of the existence of a power law are not accompanied by a significant statistical study. It is usual, as described in [Newman, 2005] that the evidence leading to a suggestion of a power law in the distribution is visual. Once we have these tests, the study goes through the adjustment of a possible power law [Merelo et al., 2017a, Arafat and Riehle, 2009].
The general trend being the lack of statistical evidence that supports the hypothesis of the existence of a power law, the truth is that as described in [Newman, 2005, Clauset et al., 2009] the most common method for making subsequent adjustments, Leas Square Medium [Merelo et al., 2017a, Arafat and Riehle, 2009, Merelo-Guervós, 2016b], usually implies the existence of a greater error than the possible alternatives.
Currently, the general trend that started with the description of the power laws in self-organized systems has been slowed down. Instead, due to the existence of more objective evaluation methods, the results that were assumed until now are being re-evaluated.
Examples of this trend are papers such as [Holme, 2019, Broido and Clauset, 2019], where the power laws in the networks and in the results have been reevaluated, obtaining an analysis that can change the way we make our assumptions about power laws.
Next we will present the methodology used to choose those repositories and mine their information.
3 Methodology
In this part we are going to explain the methods used in our research. It is divided in four sections, explaining all procedures used from the data extraction to the visualization. We emphasize the second and third, being the ones that really represent a conceptual change in the analysis of the existence of power laws in code repositories.
3.1 Data extraction
We have chosen 16 repositories in different states of development. These repositories were chosen in [Merelo, 2016], for several reasons: They all represent a wide array of languages and functionalities, from web frameworks such as Django to Atom plugins, through one-of-a-kind frameworks such as Docker.
Normally a code repository is related to a software project, for this reason, it is usual that they include several different languages which are used in different parts of the project. This mixture of languages also offer a big range of variability between languages that are interpreted or compiled, either to machine code or to bytecode.
Repositories vary also in professionalism, that is, the team behind that software project. From a small Atom editor plugin to TensorFlow, an open library created and maintained by a fully professional community.
Repository mining was done during the months of January to March 2017, with the second sweep of the same repositories performed in February 2019.
The way we look at changes in the repository was initially proposed by [Merelo, 2016] and was also used in [Merelo et al., 2017a], where a deeper explanation can be found.
This procedure is based on three main concepts:
-
•
The usage of a discrete timeline formed by the commits, with every commit counting as time=1.
-
•
Work with selected files in the repository, excluding those related to images or style
-
•
We take the largest value from the inserted and deleted lines of code.
Please note that, in principle, we are not interested in the number of developers that participate in the project. A certain amount of developers is not a necessary condition for self-organization, but in any case we are interested in detecting power laws in these time series of change sizes in repositories, which do not include data at all on the number of users. The repositories we have been analyzing here do have a wide range of users, from one or two to several dozens but, as indicated, our methodology does not need to include information on the number of users.
Up to this point, there is nothing new. But is the way that we evaluate our results that differs from previous analysis.
3.2 Hypothesis tests
Once the information from the repositories has been extracted, we proceed to analyze it in order to find clues about what kind of distribution is generating our data.
With that particular objective in mind, we change the methodology used in [Merelo et al., 2017a] for several reasons.
First of all we want to offer a test that checks whether the observed data set actually follows a power law, instead of only visualize the result. This kind of tests can vary based on different measured and techniques. The one we are going to use is suggested in [Clauset et al., 2009], which consists in using a goodness-of-fit hypothesis test via bootstrapping procedure.
Due to the use of bootstrapping, this procedure is a time and resources consuming one. We essentially generate multiple data sets with our two main parameters and and then we re-infer the model parameters. The outcome of the algorithm will result in a P-value, which, if is large enough, tell us that the difference between our data and the power law model we have generated is small and mostly attributed to statistically randomness. On the other hand, if P-value is close to 0, it is quite unlikely that our model fits the data properly. Following [Clauset et al., 2009] we choose our threshold value in , in addition we are going to perform this analysis with R package: PoweRlaw. A detailed description of it and the hypothesis tests can be found in [Gillespie, 2015].
Up to this point, we have detected what data sets are unlikely to be fitted by a power law in any of its range. Notice, on the contrary case, that we are only assuming that we can not discard that a power law is generating the data. However, as there is some probability of the appearance of this distribution in our data we can study and analyze how its two main parameters may evolve between 2017 and 2019.
As it is unrealistic to think that a power law distribution will fit all our data, our first step is to check what portion of the data could be fitted with a power law, or in other words, what is the minimal value (if there is one) from which the scaling relationship of the power law begins 111This is a fair assumption since we are working with heavy-tailed distributions and our main interest is the behaviour of the tail of our data.. This value is usually noted by and is our first parameter.
Once we have the first value, we proceed to estimate the scale of our power law. As it is shown in papers like [Newman, 2005, Clauset et al., 2009], least square method is a poor but wide-spread way to proceed when estimating the scale parameter. Instead, we are going to use a direct method describe in [Clauset et al., 2009] and implemented in [Alstott et al., 2014] that use the data values we have. This method is known to produce a very nice fit with less error than the others mentioned above.
Up to this point we have revisited our way of analyze power law fitting and the estimation of our parameters. However, there is a more deep question unanswered: does our data really follow (in a statistically relevant way) a power law? This kind of answers were lacking in [Merelo et al., 2017a] and they are relevant independently our first test’s results, since they usually offer an unbiased look of the data .
Taking into account that our main question is whether a power law is the best description of our data, we choose to apply a comparative test that could evaluate if there are any alternative distribution that could have generated our data with greater likelihood than a power law. That is the main reason why we choose to use a log-likelihood ratio test implemented in [Alstott et al., 2014]. There are two algorithm’s outcomes. First we have the log-likelihood ratio between the two candidate distributions. The sign of this quantity will point out which distribution is more likely to be producing out data. After it, we calculate the signification of this ratio, a P-value. Following [Alstott et al., 2014] indications we establish our P-value threshold at ; above that point the loglikehood ratio has no significance and we can not decide which distribution is better fitting out data.
3.3 Classification
With all this information we are able to offer a precise conclusion about the probability that power law is generating our data. To sum up all the tests in a single statement we use the scale proposed in [Clauset et al., 2009], which is described as:
-
•
None: Data-set is probably not distributed by a power law (first test failed).
-
•
Moderate: Power law is a possible fit but there are other plausible distributions that fit the data.
-
•
Good: Power law is a possible fit and none of the other distributions is plausible.
-
•
Truncated: when truncated power law is clearly favored over a simple power law
A relevant remark should be made: Even when the first test give us a low probability of our data being distributed by a power law, the next tests offers us an interesting insight. A power law can exceed others distributions at explaining how our data is distributed, meaning that, even though our data is not distributed by a power law, this fit could offer us more information about our data than other distributions.
3.4 Visualization
On the visual aspects, a clarification should be made. Here we offer a graphical view that differs from [Merelo et al., 2017a] but not a novel one. It has been used in [Arafat and Riehle, 2009] with similar purposes. Briefly, we are going to use the probability density function (PDF) for plotting. Due to the requirement of binning the data to this type of graphic, we are going to use a logarithmic spacing, since it reduces the statistical errors in the tail in log-log plots at it is stated in [Newman, 2005].
4 Results
| Repository name | |||
|---|---|---|---|
| atom | 10.0 | 2.039242998376567 | 0.15492119930071382 |
| cask | 18.0 | 1.7336857967225443 | 0.06725686671465021 |
| Dancer2 | 107.0 | 2.177500075690754 | 0.07730666731550309 |
| django | 10786.0 | 2.1744317304939558 | 0.01917838984962695 |
| docker | 73.0 | 1.4645926562553306 | 0.004754872537365103 |
| ejabberd | 2.0 | 1.228631569923214 | 0.0033017325614456455 |
| fission | 25.0 | 1.7697310637483803 | 0.09937185303186655 |
| mojo | 32.0 | 2.1283668081735456 | 0.03162540535355575 |
| Moose | 36.0 | 1.768059278495766 | 0.0197132783524576 |
| rakudo | 11.0 | 1.6159534004325067 | 0.006834230629556248 |
| scalatra | 105.0 | 1.7126278313239238 | 0.02583273870367301 |
| tensorflow | 6.0 | 1.2136744934008 | 0.002587381661200525 |
| tpot | 39.0 | 1.601798428793051 | 0.0374663336679551 |
| tty | 85.0 | 2.5687968664786887 | 0.16355837969418938 |
| vue | 10.0 | 1.4008340778667951 | 0.007381204719143647 |
| webpack | 66.0 | 1.7525127838915868 | 0.030568742256899546 |
| Repository name | |||
|---|---|---|---|
| atom | 9.0 | 1.8359195263285408 | 0.11705214645679832 |
| cask | 22.0 | 1.7974451838770937 | 0.07249501671609943 |
| Dancer2 | 106.0 | 2.261037545006354 | 0.08425661509414822 |
| django | 22380.0 | 2.6887068697480156 | 0.03580856180986959 |
| docker | 85.0 | 1.471139237773135 | 0.004450258248742491 |
| ejabberd | 4.0 | 1.2671552485187476 | 0.00372055095134032 |
| fission | 22.0 | 1.4589753590316525 | 0.021399836458042016 |
| mojo | 32.0 | 2.1384964656994434 | 0.031043490328162827 |
| Moose | 36.0 | 1.7677961781806713 | 0.019622681314368864 |
| rakudo | 12.0 | 1.603181925304308 | 0.006028504486885445 |
| scalatra | 105.0 | 1.678355887867916 | 0.02363164712583398 |
| tensorflow | 16.0 | 1.276851335699674 | 0.0017743964236792348 |
| tpot | 176.0 | 2.139617006349855 | 0.08401368034180524 |
| tty | 83.0 | 2.6669971731409587 | 0.1582243695783554 |
| vue | 12.0 | 1.4407170088980175 | 0.007474075257736019 |
| webpack | 50.0 | 1.481958114820392 | 0.00906295021690492 |
First, analyzing the parameters of the possible power law distribution, we find that in those repositories with low variation of the parameter there is a lack of correlation between the changes in the estimated starting point from which the distribution of power law starts and the scale parameter, . Even if small changes in produce small changes in , the lack of correlation probably means that this changes are the result of the natural stochasticity of the evolution process.
However, as it can be seen in Tables 1 and 2, repositories such as Django, which have a strong variation in the initial point, also have a greater variation in the scale parameter. This is not produced because of a global change in the overall distribution. The main reason for this change is the variation of the parameter, due to the existence of a different range of commits that fits a power law better than the previous one.
| Repository name | KS test | PL vs. LogN | PL vs. Exp | PL vs. PLtrunc | Result |
|---|---|---|---|---|---|
| atom | 0.244 | ND | ND | PLtrunc | Moderated |
| cask | 0.236 | ND | PL | ND | Moderated |
| Dancer2 | 0.178 | ND | PL | ND | Moderated |
| django | 0.002 | LogN | PL | PLtrunc | None |
| docker | 0 | LogN | PL | PLtrunc | None |
| ejabberd | 0 | LogN | PL | PLtrunc | None |
| fission | 0.654 | ND | PL | PLtrunc | Moderated |
| mojo | 0.874 | PL | PL | ND | Moderated |
| Moose | 0.2 | PL | PL | PLtrunc | Truncated |
| rakudo | 0 | PL | PL | PLtrunc | None |
| scalatra | 0 | LogN | PL | PLtrunc | None |
| tensorflow | 0 | LogN | PL | PLtrunc | None |
| tpot | 0.01 | LogN | PL | PLtrunc | None |
| tty | 0.418 | ND | ND | ND | Moderated |
| vue | 0 | PL | PL | PLtrunc | None |
| webpack | 0.004 | LogN | PL | PLtrunc | None |
| Repository name | KS test | PL vs. LogN | PL vs. Exp | PL vs. PLtrunc | Result |
|---|---|---|---|---|---|
| atom | 0.108 | ND | ND | PLtrunc | Moderate |
| cask | 0.276 | ND | PL | ND | Moderate |
| Dancer2 | 0.426 | ND | PL | ND | Moderate |
| django | 0.862 | LogN | PL | PLtrunc | Truncated |
| docker | 0.118 | LogN | PL | PLtrunc | Moderate |
| ejabberd | 0 | LogN | PL | PLtrunc | None |
| fission | 0 | ND | PL | PLtrunc | None |
| mojo | 0.88 | PL | PL | ND | Moderate |
| Moose | 0.224 | PL | PL | PLtrunc | Truncated |
| rakudo | 0 | PL | PL | PLtrunc | None |
| scalatra | 0 | LogN | PL | PLtrunc | None |
| tensorflow | 0.418 | LogN | PL | PLtrunc | Moderate |
| tpot | 0.184 | LogN | PL | PLtrunc | Moderate |
| tty | 0.47 | ND | ND | ND | Moderate |
| vue | 0 | PL | PL | PLtrunc | None |
| webpack | 0.002 | LogN | PL | PLtrunc | None |
Another special remark should be addressed to Tensorflow. The distribution fit of the repository in 2019 has caused a little controversy between [Alstott et al., 2014] and [Gillespie, 2015], as the final numerical results where different. We believe the main reason for that is the two different sections detected by their algorithms. One package gives more probability of fitting a power law between 10 to commit size and the other starting from commit size till the end. However, choosing different starting points produced similar results in the final tests.
After analyzing the parameters estimated by assuming a power law fit, it is time to check what are the results from the hypothesis tests, made to know if there are other possible distributions generating the data. These results can be found in Tables 3 and 4.
We can observe that in general, as the repositories evolve over time, there is a tendency to the appearance of a greater probability in favor of power law existence, as None cases have been reduced between 2017 and 2019.
Even so, it is worth noting the complete lack of repositories in which our confidence in finding a power law distribution is high (following our scale: Good).
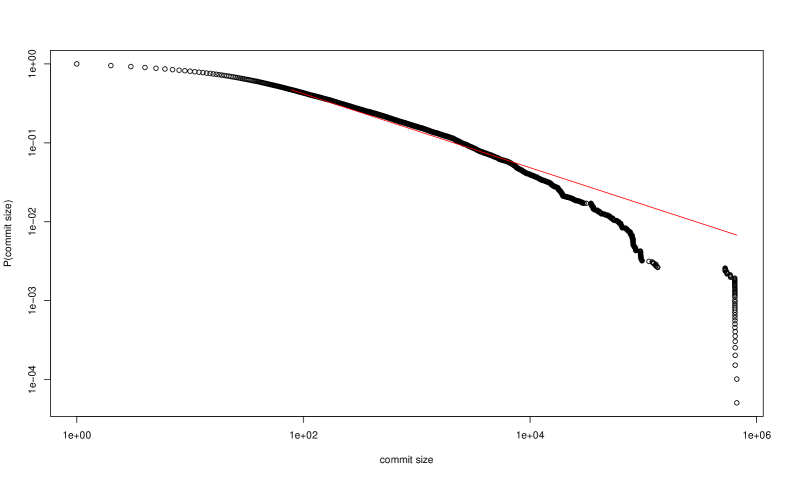
Faced with the most common visualizations, the one used in our paper highlights even more how we can not affirm the existence of power laws distributions if we look at them in detail. See as an example how Fig. 2. shows that the adjustment of a power law would not capture some characteristics in the tail of our data.
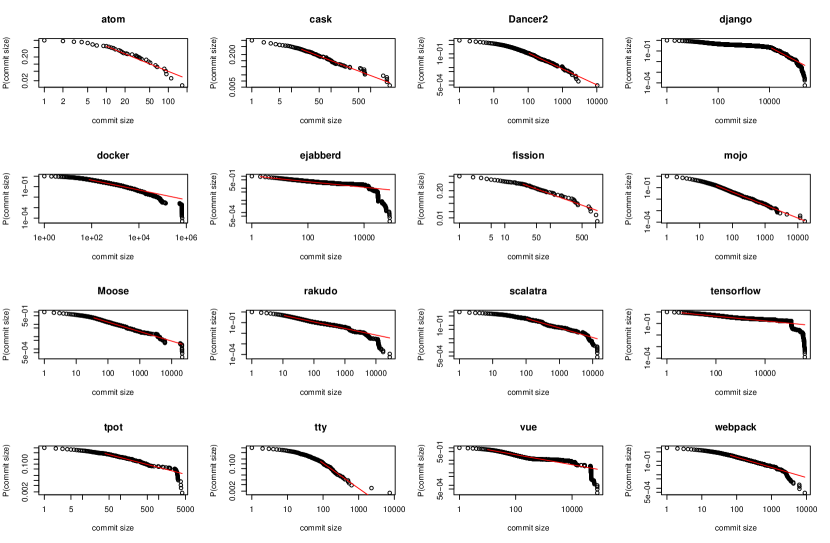
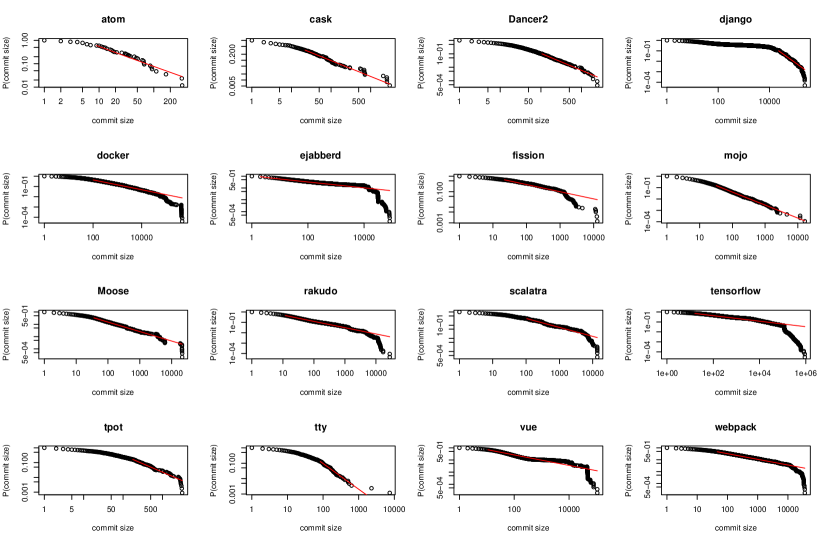
We would like to remark that, even in smaller plots like 3 and 4, where we could easily say that there are power laws only by sight, the mathematics presented in this paper support that the probability of that happening is, as maximum, moderate.
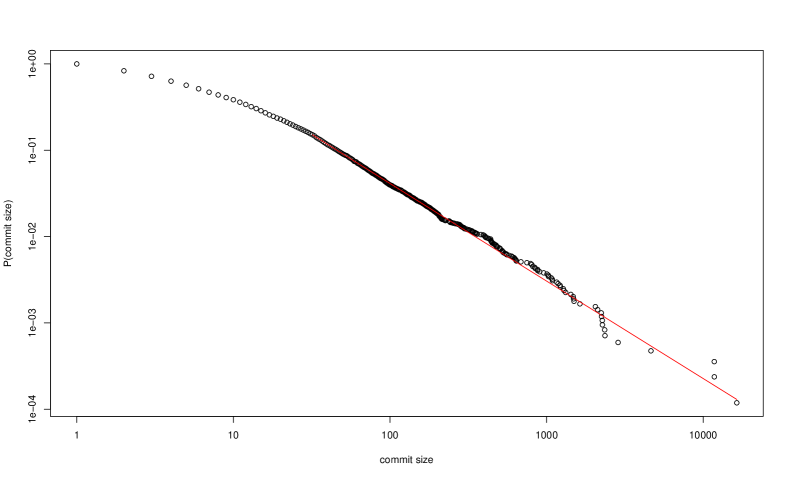
A proper example of this kind of biased assumptions is Fig. 1. Seen the Mojo distribution and power law fit we can suspect the existence of a power law in the repository. Its distribution that also remains in time till 2019. This can be an indicative that this repository is self-organizing to stay in that point. But even in this case, the probability of a power law is only, again, moderate.
On overall the higher rank is not achieved in any repository. We can only state that in most of the repositories a power law could explain the data, but, other distributions are equally probable.
5 Conclusions
In general, we should always use a standard mathematical approach in order to affirm any behaviour in the distribution of our data. That way, we can be assured that our results are unbiased, not simply based in our sight or plots, and they have been tested statistically. This is what we have done in this paper, that not only uses that methodology on data already published, but also updates the data checking whether there has been any evolution in the actual existence of a power law in the repositories under study.
In general, the probability of finding a power law in the repositories studied is quite low, so, up to now, we can not categorically affirm that the studied systems are in a critical state due to self-organization, at least from this point of view that uses the size of changes in every commit in a repository.
This result, however, does not imply that there is not any kind of self-organization or even a power law, but that the systems have not been regulated enough and, therefore has not been established near a possible critical state.
Furthermore we would like to explore the possible causes of such dramatic changes as the ones seen in repositories like Django, since they may be related to a possible phase change.
In any case, the article presents an principled and objective workflow to study the existence of power law distributions that settles the status of these kind of measures in software development via repositories.
Thanks to this procedure, we hope we can establish a new state of art, from which researchers can begin to study these and other properties of code repositories in order to understand which of them may be related to self-organization and which ones have a very low probability of that.
This paper is also a starting point for the in-depth study of how, when and what produces complex behaviors or self-organized criticality in code repositories. We have only treated the number of commits, but there are many other parameters or variables (contributions per author, per file, blame chunks sizes 222Code lines that are next to each other and were modified together or authors in different files) that can cause the appearance of power laws within the repositories, which could give us clues about a possible critical state of our system.
On the other hand, as our sample size of repositories is relatively small, we could extend this study to different repositories, to detect possible general patterns or patterns related to repositories written in certain languages or ascribed to certain software projects.
We would like to conclude pointing out that all the software used in this research (being the main ones R[R Development Core Team, 2008], Python [van Rossum, 1995] and LaTeX) is open source. Furthermore, all the scripts used and data obtained (curated and not curated) are open and can be checked at https://github.com/geneura-papers/2019-SASO-Repos-Powerlaws.
References
- [Alderson and Doyle, 2010] Alderson, D. L. and Doyle, J. C. (2010). Contrasting views of complexity and their implications for network-centric infrastructures. IEEE Transactions on systems, man, and cybernetics-Part A: Systems and humans, 40(4):839–852.
- [Alstott et al., 2014] Alstott, J., Bullmore, E., and Plenz, D. (2014). powerlaw: a python package for analysis of heavy-tailed distributions. PloS one, 9(1):e85777.
- [Arafat and Riehle, 2009] Arafat, O. and Riehle, D. (2009). The commit size distribution of open source software. In 2009 42nd Hawaii International Conference on System Sciences, pages 1–8. IEEE.
- [Bak et al., 1988] Bak, P., Tang, C., and Wiesenfeld, K. (1988). Self-organized criticality. Physical review A, 38(1):364.
- [Broido and Clauset, 2019] Broido, A. D. and Clauset, A. (2019). Scale-free networks are rare. Nature Communications, 10(1):1017.
- [Clauset et al., 2009] Clauset, A., Shalizi, C. R., and Newman, M. E. (2009). Power-law distributions in empirical data. SIAM review, 51(4):661–703.
- [Gillespie, 2015] Gillespie, C. S. (2015). Fitting heavy tailed distributions: The poweRlaw package. Journal of Statistical Software, 64(2):1–16.
- [Golyk, 2012] Golyk, V. A. (2012). Self-organized criticality.
- [Gorshenev and Pis’mak, 2004] Gorshenev, A. and Pis’mak, Y. M. (2004). Punctuated equilibrium in software evolution. Physical Review E, 70(6):067103.
- [Holme, 2019] Holme, P. (2019). Rare and everywhere: Perspectives on scale-free networks. Nature Communications, 10(1):1016.
- [Merelo, 2016] Merelo, J. J. (2016). Quantifying activity through repository mining: the case of Moose. Technical report, GeNeura/UGR/CITIC. 10.6084/m9.figshare.3756768.v3.
- [Merelo et al., 2017a] Merelo, J. J., Castillo, P. A., Mora, A. M., García-Valdez, M., Cotta, C., and Fernandes, C. (2017a). Self-organized criticality in code repositories. Proceedings of the European Conference on Artificial Life, pages 545–552.
- [Merelo et al., 2017b] Merelo, J. J., Castillo, P. A., and Valdez, M. G. (2017b). Finding self-organized criticality in collaborative work via repository mining. In Rojas, I., Joya, G., and Català, A., editors, Advances in Computational Intelligence - 14th International Work-Conference on Artificial Neural Networks, IWANN 2017, Cadiz, Spain, June 14-16, 2017, Proceedings, Part I, volume 10305 of Lecture Notes in Computer Science, pages 483–496. Springer.
- [Merelo-Guervós, 2016a] Merelo-Guervós, J.-J. (2016a). Self-organized criticality in fiction: the case of #slash, a novel. Technical Report 2016-7, GeNeura group, University of Granada.
- [Merelo-Guervós, 2016b] Merelo-Guervós, J.-J. (2016b). Self-organized criticality in repository-mediated projects. Technical report, GeNeura group, University of Granada. https://www.academia.edu/28083421/Self-organized_criticality_in_repository-mediated_projects.
- [Merelo-Guervós, 2017] Merelo-Guervós, J.-J. (2017). Phase transitions in software repositories. Technical Report 2016-7, GeNeura group, University of Granada. http://sl.ugr.es/soc_soft.
- [Newman, 2005] Newman, M. E. (2005). Power laws, pareto distributions and zipf’s law. Contemporary physics, 46(5):323–351.
- [R Development Core Team, 2008] R Development Core Team (2008). R: A Language and Environment for Statistical Computing. R Foundation for Statistical Computing, Vienna, Austria. ISBN 3-900051-07-0.
- [van Rossum, 1995] van Rossum, G. (1995). Python tutorial. Technical Report CS-R9526, Centrum voor Wiskunde en Informatica (CWI), Amsterdam.
- [Wu et al., 2007] Wu, J., Holt, R. C., and Hassan, A. E. (2007). Empirical evidence for SOC dynamics in software evolution. In 2007 IEEE International Conference on Software Maintenance, pages 244–254. IEEE.