Cooperativity transitions driven by higher-order oligomer formations in
ligand-induced receptor dimerization
Abstract
While cooperativity in ligand-induced receptor dimerization has been linked with receptor-receptor couplings via minimal representations of physical observables, effects arising from higher-order oligomer (e.g., trimer and tetramer) formations of unobserved receptors have received less attention. Here, we propose a dimerization model of ligand-induced receptors in multivalent form representing physical observables under basis vectors of various aggregated receptor-states. Our simulations of multivalent models not only reject Wofsy-Goldstein parameter conditions for cooperativity, but show higher-order oligomer formations can shift cooperativity from positive to negative.
- DOI
-
10.1103/PhysRevE.100.062407
Introduction. Collective behavior is a phenomenon common in human, animal, cellular, and biomolecular systems. Despite varying significantly in terms of the type and composition of biological components, fundamental dynamical properties allow collectives to exhibit rapid or gradual responses in complex environments. For example, group behaviors of wild baboons have been precisely linked to characteristic “S”-shaped (or sigmoid) response curves via pairwise interactions of subgroups Strandburg-Peshkin et al. (2017); *strandburg2015. The dynamics of animal groups also exhibit parallels with collective behaviors among biomolecules in living cells, such as the process by which hemoglobin binds to oxygen Koshland and Hamadani (2002); Ferrell (2009); Stefan and Nove (2013); Phillips et al. (2013). Thus, by abstracting structural details of biomolecules and relating biochemical interactions directly to mathematical networks, we can consider key insight regarding collective behavior and likely demonstrate various aspects of biomolecular binding systems.
Collective biomolecular behavior is generally referred to as cooperativity, its main functions being to allow biomolecular binding systems to exhibit either positive or negative sigmoid responses Koshland and Hamadani (2002); Ferrell (2009); Stefan and Nove (2013); Phillips et al. (2013). For example, a conformational change in proximal and distal regions of hemoglobin complex enables efficient transport of oxygen between the lungs and tissue, exhibiting positive cooperativity: steeper sigmoid (or switch-like) responses with a threshold in a concentration range of stimuli Koshland and Hamadani (2002); Ferrell (2009); Stefan and Nove (2013); Phillips et al. (2013). Receptor systems coupling to G-proteins can, however, display more gradual sigmoid curvature, achieving less decisive but also less restricted with respect to a wide concentration range of signaling molecules Koshland and Hamadani (2002); Ferrell (2009); Stefan and Nove (2013). Such gradual cooperative responses are known as negative cooperativity.
In standard systems biology approaches, the fundamental rules governing cooperativity in living cells can be investigated by mapping and analyzing biomolecular networks and their parameter conditions. A key challenge of analyzing network models is finding meaningful and nonintuitive effects. Using data-driven (or inductive) modeling approaches, network models are generally constructed with various biochemical parameters (e.g., equilibrium binding constants) but restricted to observable components (or states) imposed by experimental techniques (e.g., live-cell imaging via biomolecules tagged with fluorescence emitters). The network models can lead to the parameter conditions exhibiting either positive or negative cooperativity. It is often overlooked, however, that these conditions can vary greatly by incorporating realistic but unobserved components (or states) into the network models. For example, the Monod-Wyman-Changeux (MWC) model that describes allosteric regulations of proteins always exhibits positive cooperativity; nevertheless, modifications in the scale of protein’s conformational changes proposed by Koshland, Nemethy and Filmer, offer parameter regions that allow negative cooperativity Monod et al. (1965); Koshland et al. (1966); Alan (1999); Koshland and Hamadani (2002). By introducing hidden components (or states) in the network models, cooperativity can shift from positive to negative (or negative to positive). Such cooperativity transitions thus hinder physical interpretations of the cooperativity extracted from the data-driven modeling approaches.
Collective behavior of cell-surface receptors is a key function for enabling the efficient transduction of biochemical signals to cellular interiors. Prior experimental studies have explored the origin of negative cooperativity in dimer formations for equilibrium binding of ligands to cell-surface receptors, mainly using the simplest dimerization model formulated by Wofsy and Goldstein Wofsy et al. (1992); *wofsy1992b; Klein et al. (2004); Mayawala et al. (2005a, b); Ozcan et al. (2006); Macdonald and Pike (2008); Lemmon (2008); Adak et al. (2011); Pike (2012); Hiroshima et al. (2012); *hiroshima2013. While this dimerization model predicts the parameter conditions that give rise to negative cooperativity, effects arising from higher-order oligomer (e.g., trimer and tetramer) formations of unobserved receptors have received less attention. In this article, we consider dimerization models in multivalent form that represent physical observables under basis vectors of various aggregated receptor-states (see Figure 1). We then evaluate the cooperative behavior that arises from multivalent models, comparing the cooperativity expected from the Wofsy-Goldstein (WG) formulation. Our results from model simulations imply violation of the WG parameter conditions. We also demonstrate how a mixture of various aggregated receptor-states in the multivalent models can lead to the transition of cooperativity from positive to negative.
Theoretical framework. We consider the following assumptions: (a) there is no internalization of ligands and receptors; (b) each binding process is independent of chain and ring formation; (c) the four local equilibrium constants (,,,) are dependent on each other, and; (d) detailed balance conditions are given by and .
In state-vector representation of physical observables, the dimerization model is described by a function containing the probabilities of biochemical interactions that form various aggregated receptor-states. All possible aggregated receptor-states in the dimerization models can be treated mathematically as basis vectors in a multidimensional real vector space. Observed receptor-state vectors in the formation of nulls (, ), monomers (, ) and dimers () are given by
| (1) |
where and represent the receptors and the ligand-mediated receptors, respectively. refers the number of receptors that can be aggregated in the and observed states. There are elements in the , , and observed states.
Figure 1 shows a network of observed receptor-states in the dimerization model. In first-order interactions of ligands with receptors, the rates of association (, , ) and dissociation (, , ) are represented by and/or diagonal matrices acting upon the basis vectors, transforming one aggregated state to one observed state.
The dissociation rates (, , ) for the receptor-receptor interactions are represented by diagonal matrices. Non-diagonal matrices of the association rates can, however, transform into a mixture of various aggregated states in one observed state. The non-diagonal matrices can be written in the form of
| (2) |
where and are the receptor-receptor association rate and scaling matrices of the -th index, respectively.
For convenience, we redefine the dimensionless lumped parameter that constrains the fraction of dimer formations in the absence of ligands. The lumped parameter can be rewritten in the matrix form of
| (3) |
where is the dimensionless lumped parameter originally defined in the WG formulations Wofsy et al. (1992); *wofsy1992b.
Multivalent models. We construct monovalent () and bivalent () cell-models of ligand-induced receptor dimerization. We then use the E-Cell platform Tomita et al. (1999); Arjunan and Tomita (2010) to simulate the cell-models of biological fluctuation that arise from stochastic changes in the cell surface geometry, number of receptors, ligand binding, molecular states, and diffusion constants. These cell-models assume that the non-diffusive receptors are uniformly distributed on a flat cell-surface measuring and in the horizontal and vertical axes. We also assume that the total receptor concentration, binding affinity and dissociation rates for each interaction are given by , , , , , and . The relation of the local equilibrium constants to the association and dissociation rates is also given by where . In a concentration range of ligand stimuli from to , we run model-simulations for a period of to verify the complete convergence of receptor response to full equilibrium.
The scaling factor and matrices in the monovalent model are given by and . In the bivalent model, we assume that the symmetric scaling matrices can be written in the form of
| (4) |
where and are matrix elements. must be less than unity to satisfy the positive definite condition. The second-order interactions forming oligomers (e.g., dimers and trimers) in the null and monomeric observables are given by
| (5) | |||
| (6) |
where and represent dual vectors of the null and monomeric observables, respectively. In these formulations, the second-order interaction of the null observables can exhibit null dimers, trimers and tetramers: , and . Monomeric dimers, trimers and tetramers can be also formed through the second-order interactions between the null and monomeric observables: , , and . There is no dimeric trimers and tetramers defined in the bivalent model.
The WG formulation Wofsy et al. (1992); *wofsy1992b. The network diagram of the WG dimerization model is equivalent to that of the monovalent model. The dimerization process was, however, formulated under a “special” assumption that the local equilibrium constant of direct receptor-receptor (or second-order) interaction () is independent of first-order interactions of receptors associated with ligands (,,). The total cell-surface receptor concentrations and the number of ligand-induced oligomers per a unit surface-area are given by
| (7) | |||||
| (8) |
where and are the concentration of unbound receptors and ligand concentration input in , respectively. The -factor in the third term of Eq. (8) is meant to count the dimers as single molecules. Unit representations of local equilibrium constants in this formulation are not consistent with the units in our multivalent formulation, thereby requiring a unit transformation: where .
This WG formulation leads to a parameter condition that approximately exhibits negative cooperativity. The condition can be written in the form of
| (9) |
where () is the dimensionless lumped parameter. This relation implies that the model always exhibits positive cooperativity if .
(a) (b)
(c) (d)
(e) (f)
(a) (b) () (c) ()
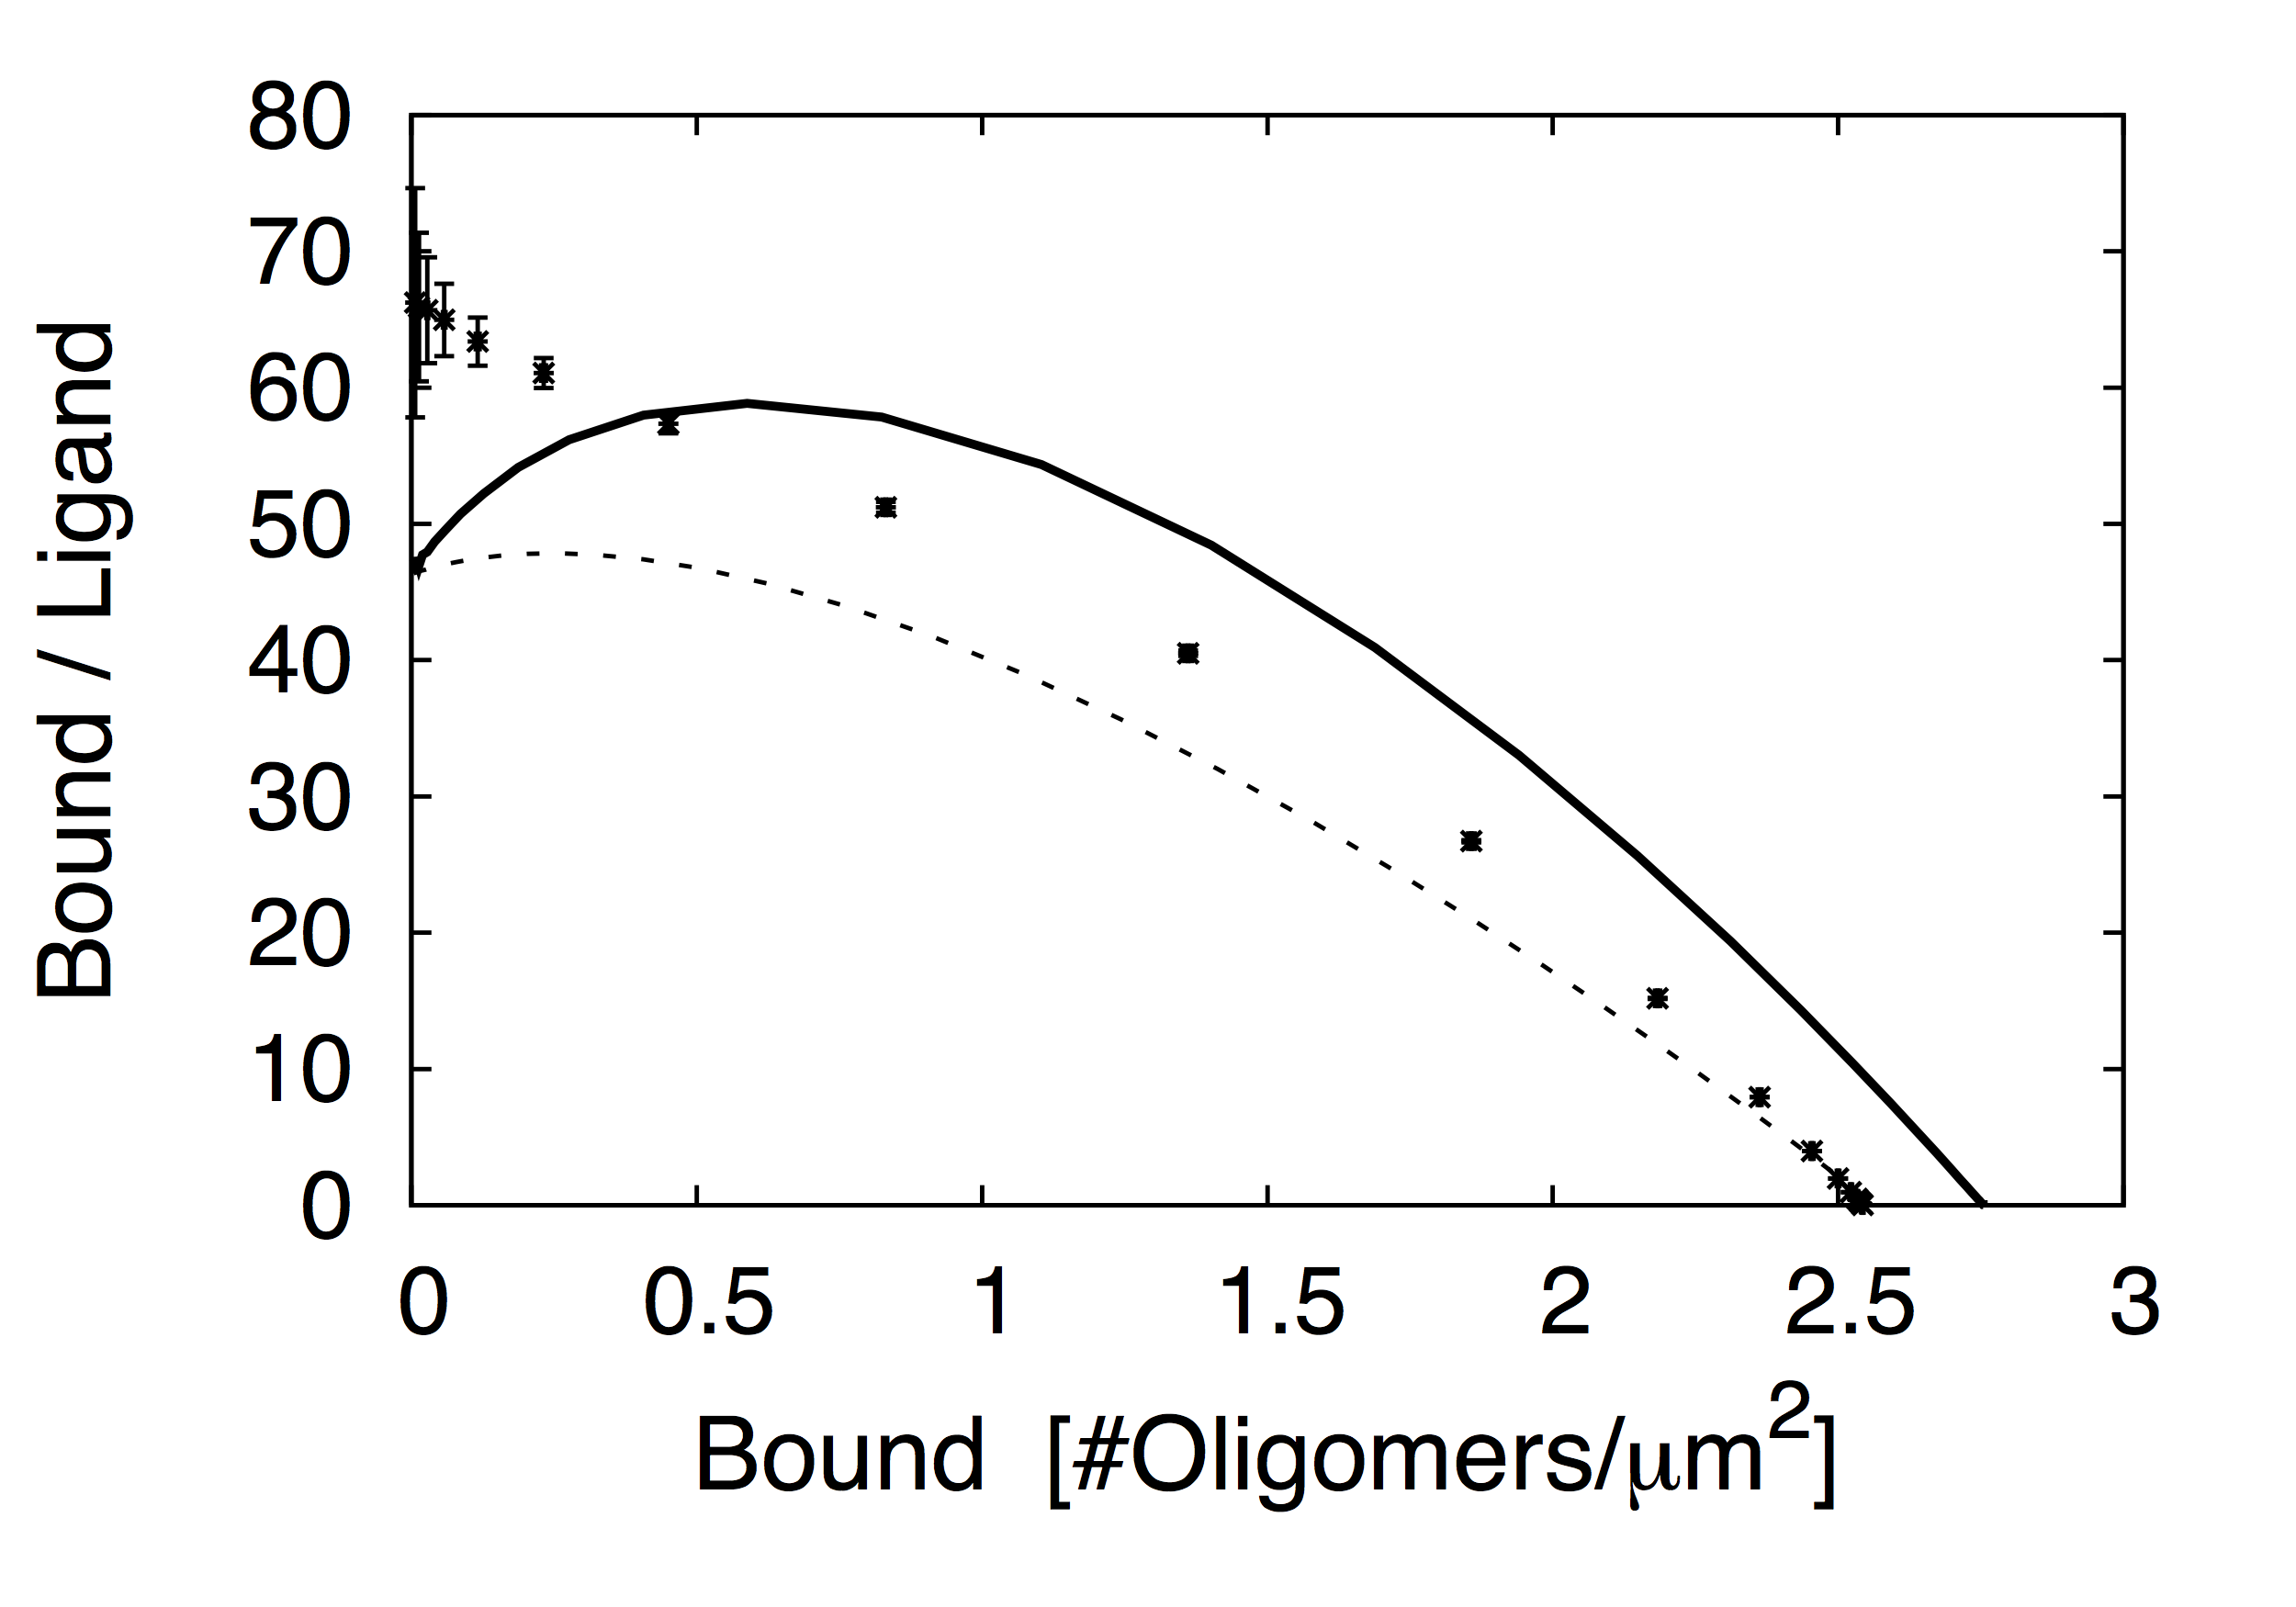
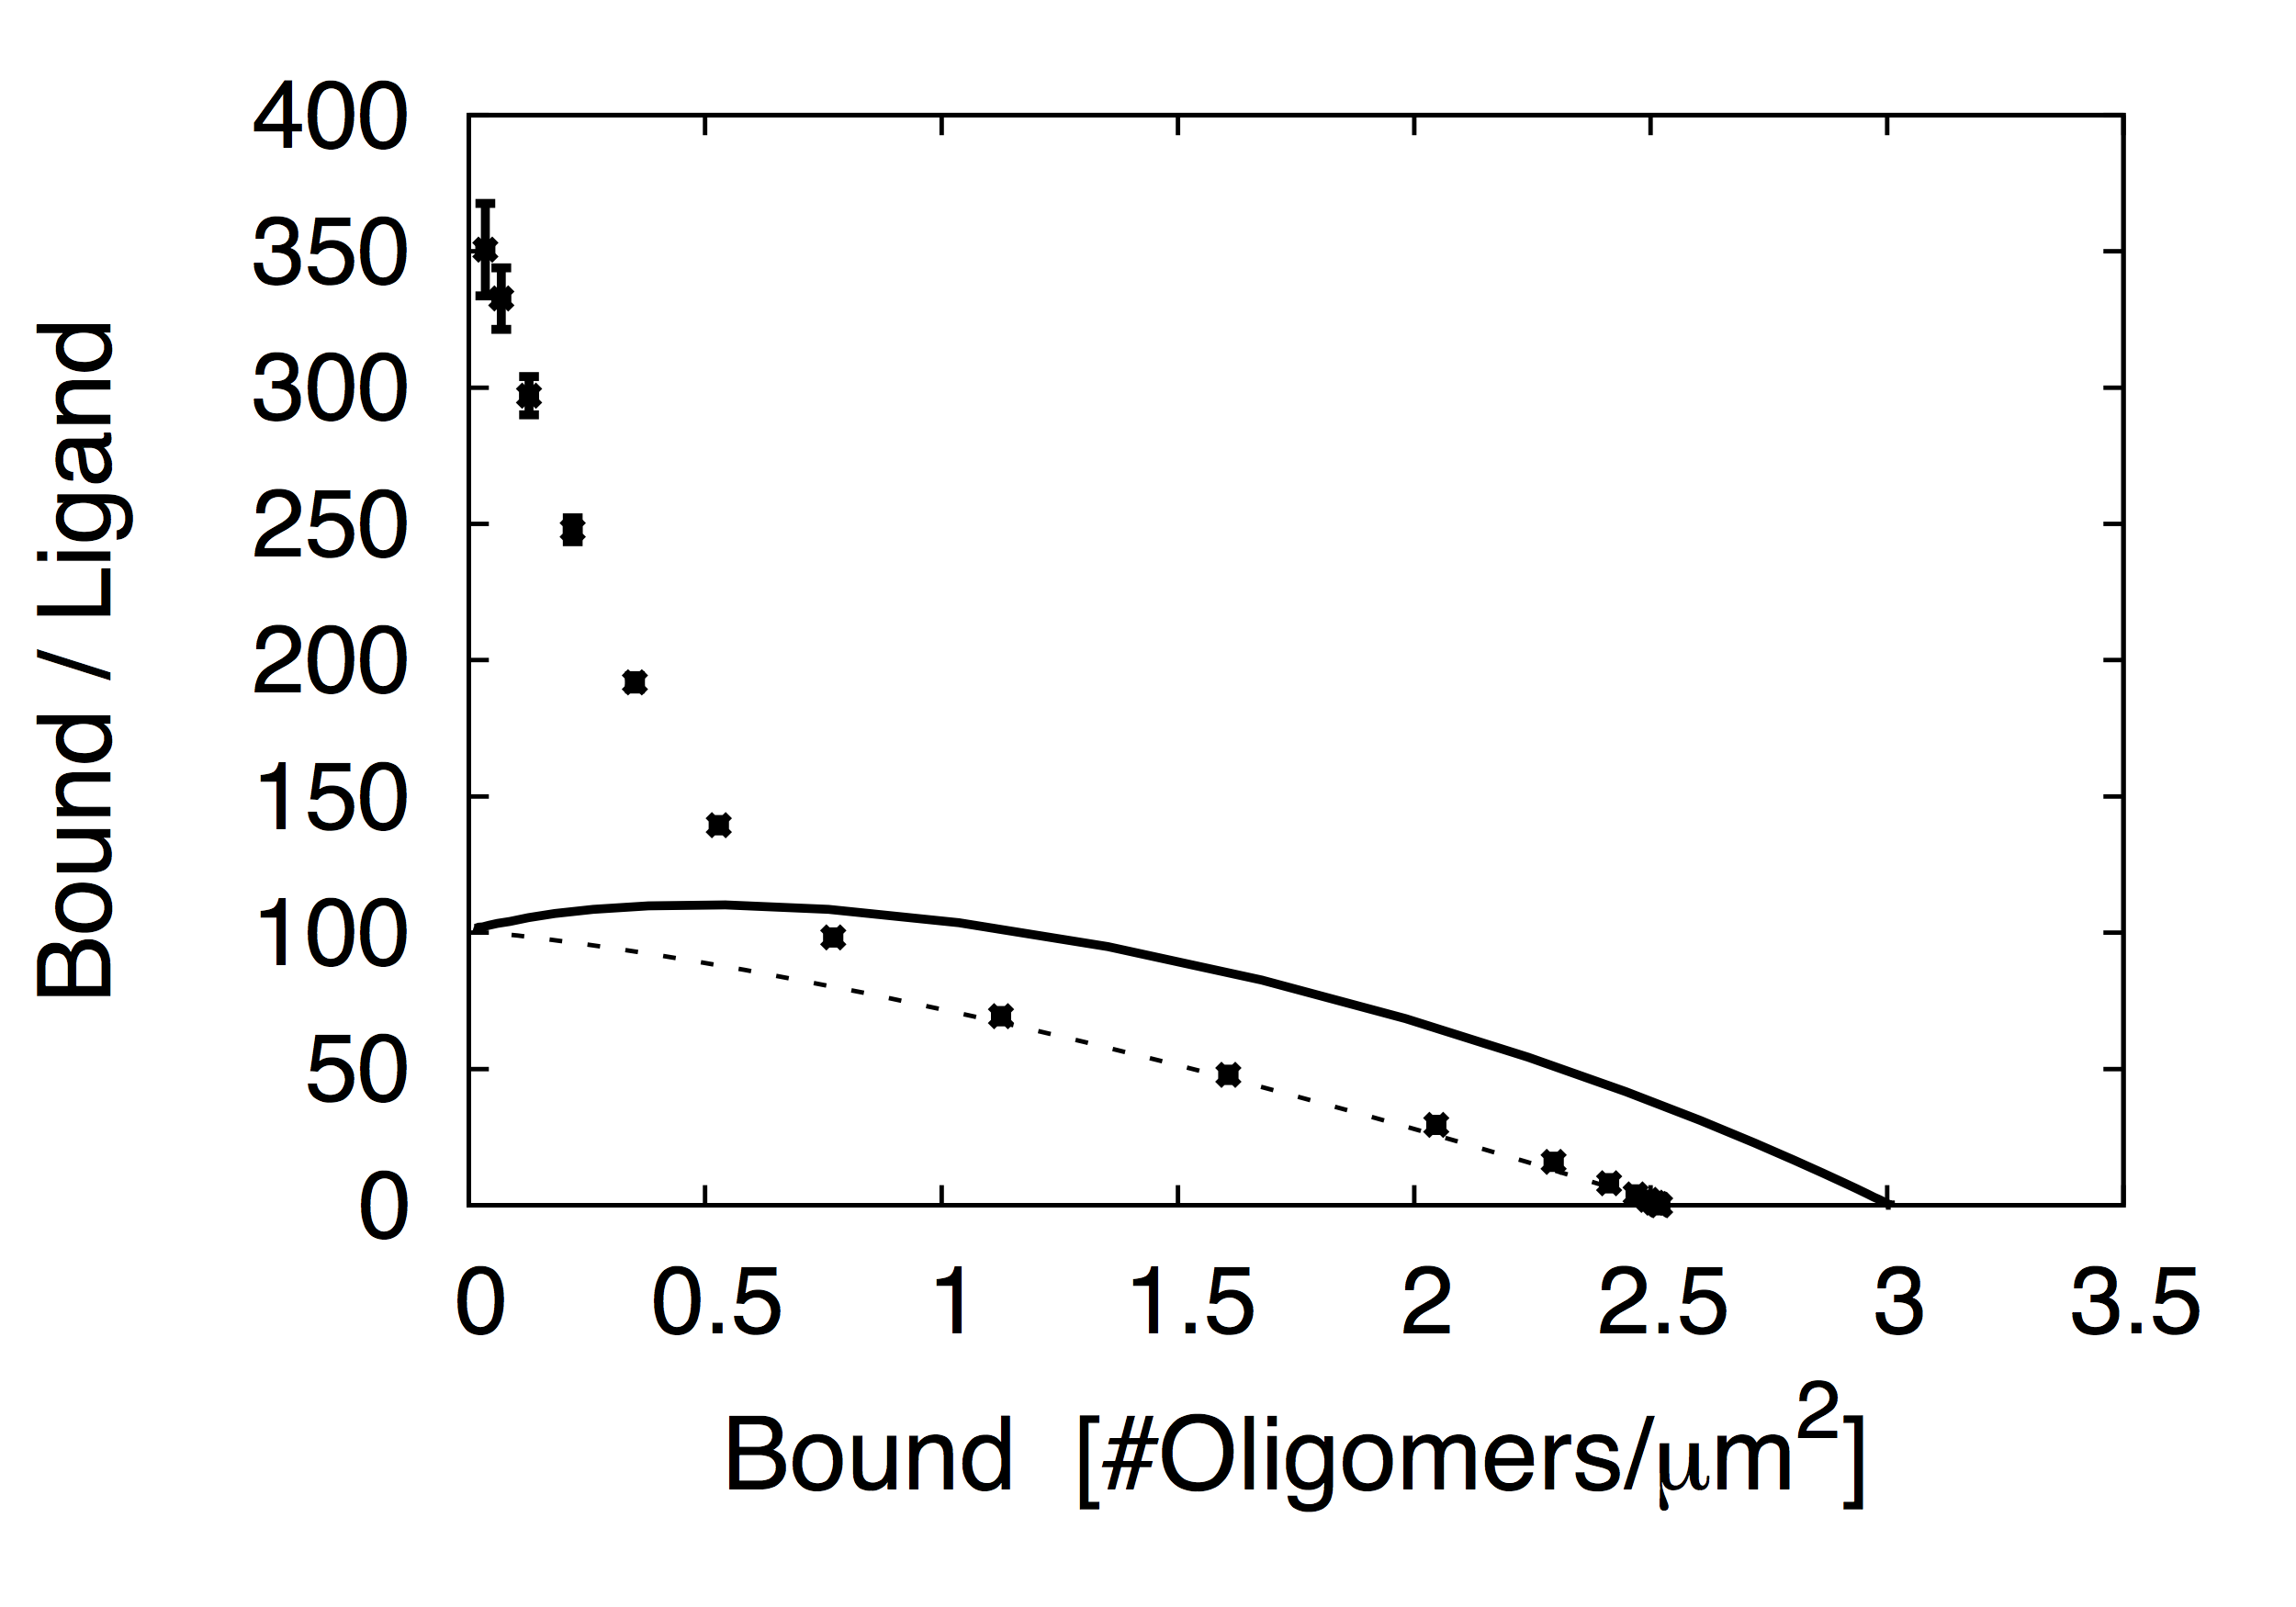
Model comparison. Cooperative effects can be generally seen in the concavity of the Scatchard plots. We compare the Scatchard plots among the three cell-models configured to have same parameter values. Model differences can be clearly seen in Figure 2b,d,f. For and , the Scatchard plots of the three models exhibit concave downward curvatures that approximately represent positive cooperativity. The bivalent model () in Figure 2f, however, exhibits a concave-up curve of the Scatchard plot that represents negative cooperativity. If the Scatchard plot represents a straight line, then there is no cooperativity. These comparison results thus imply that cooperative effects can vary as a function of the lumped parameter, .
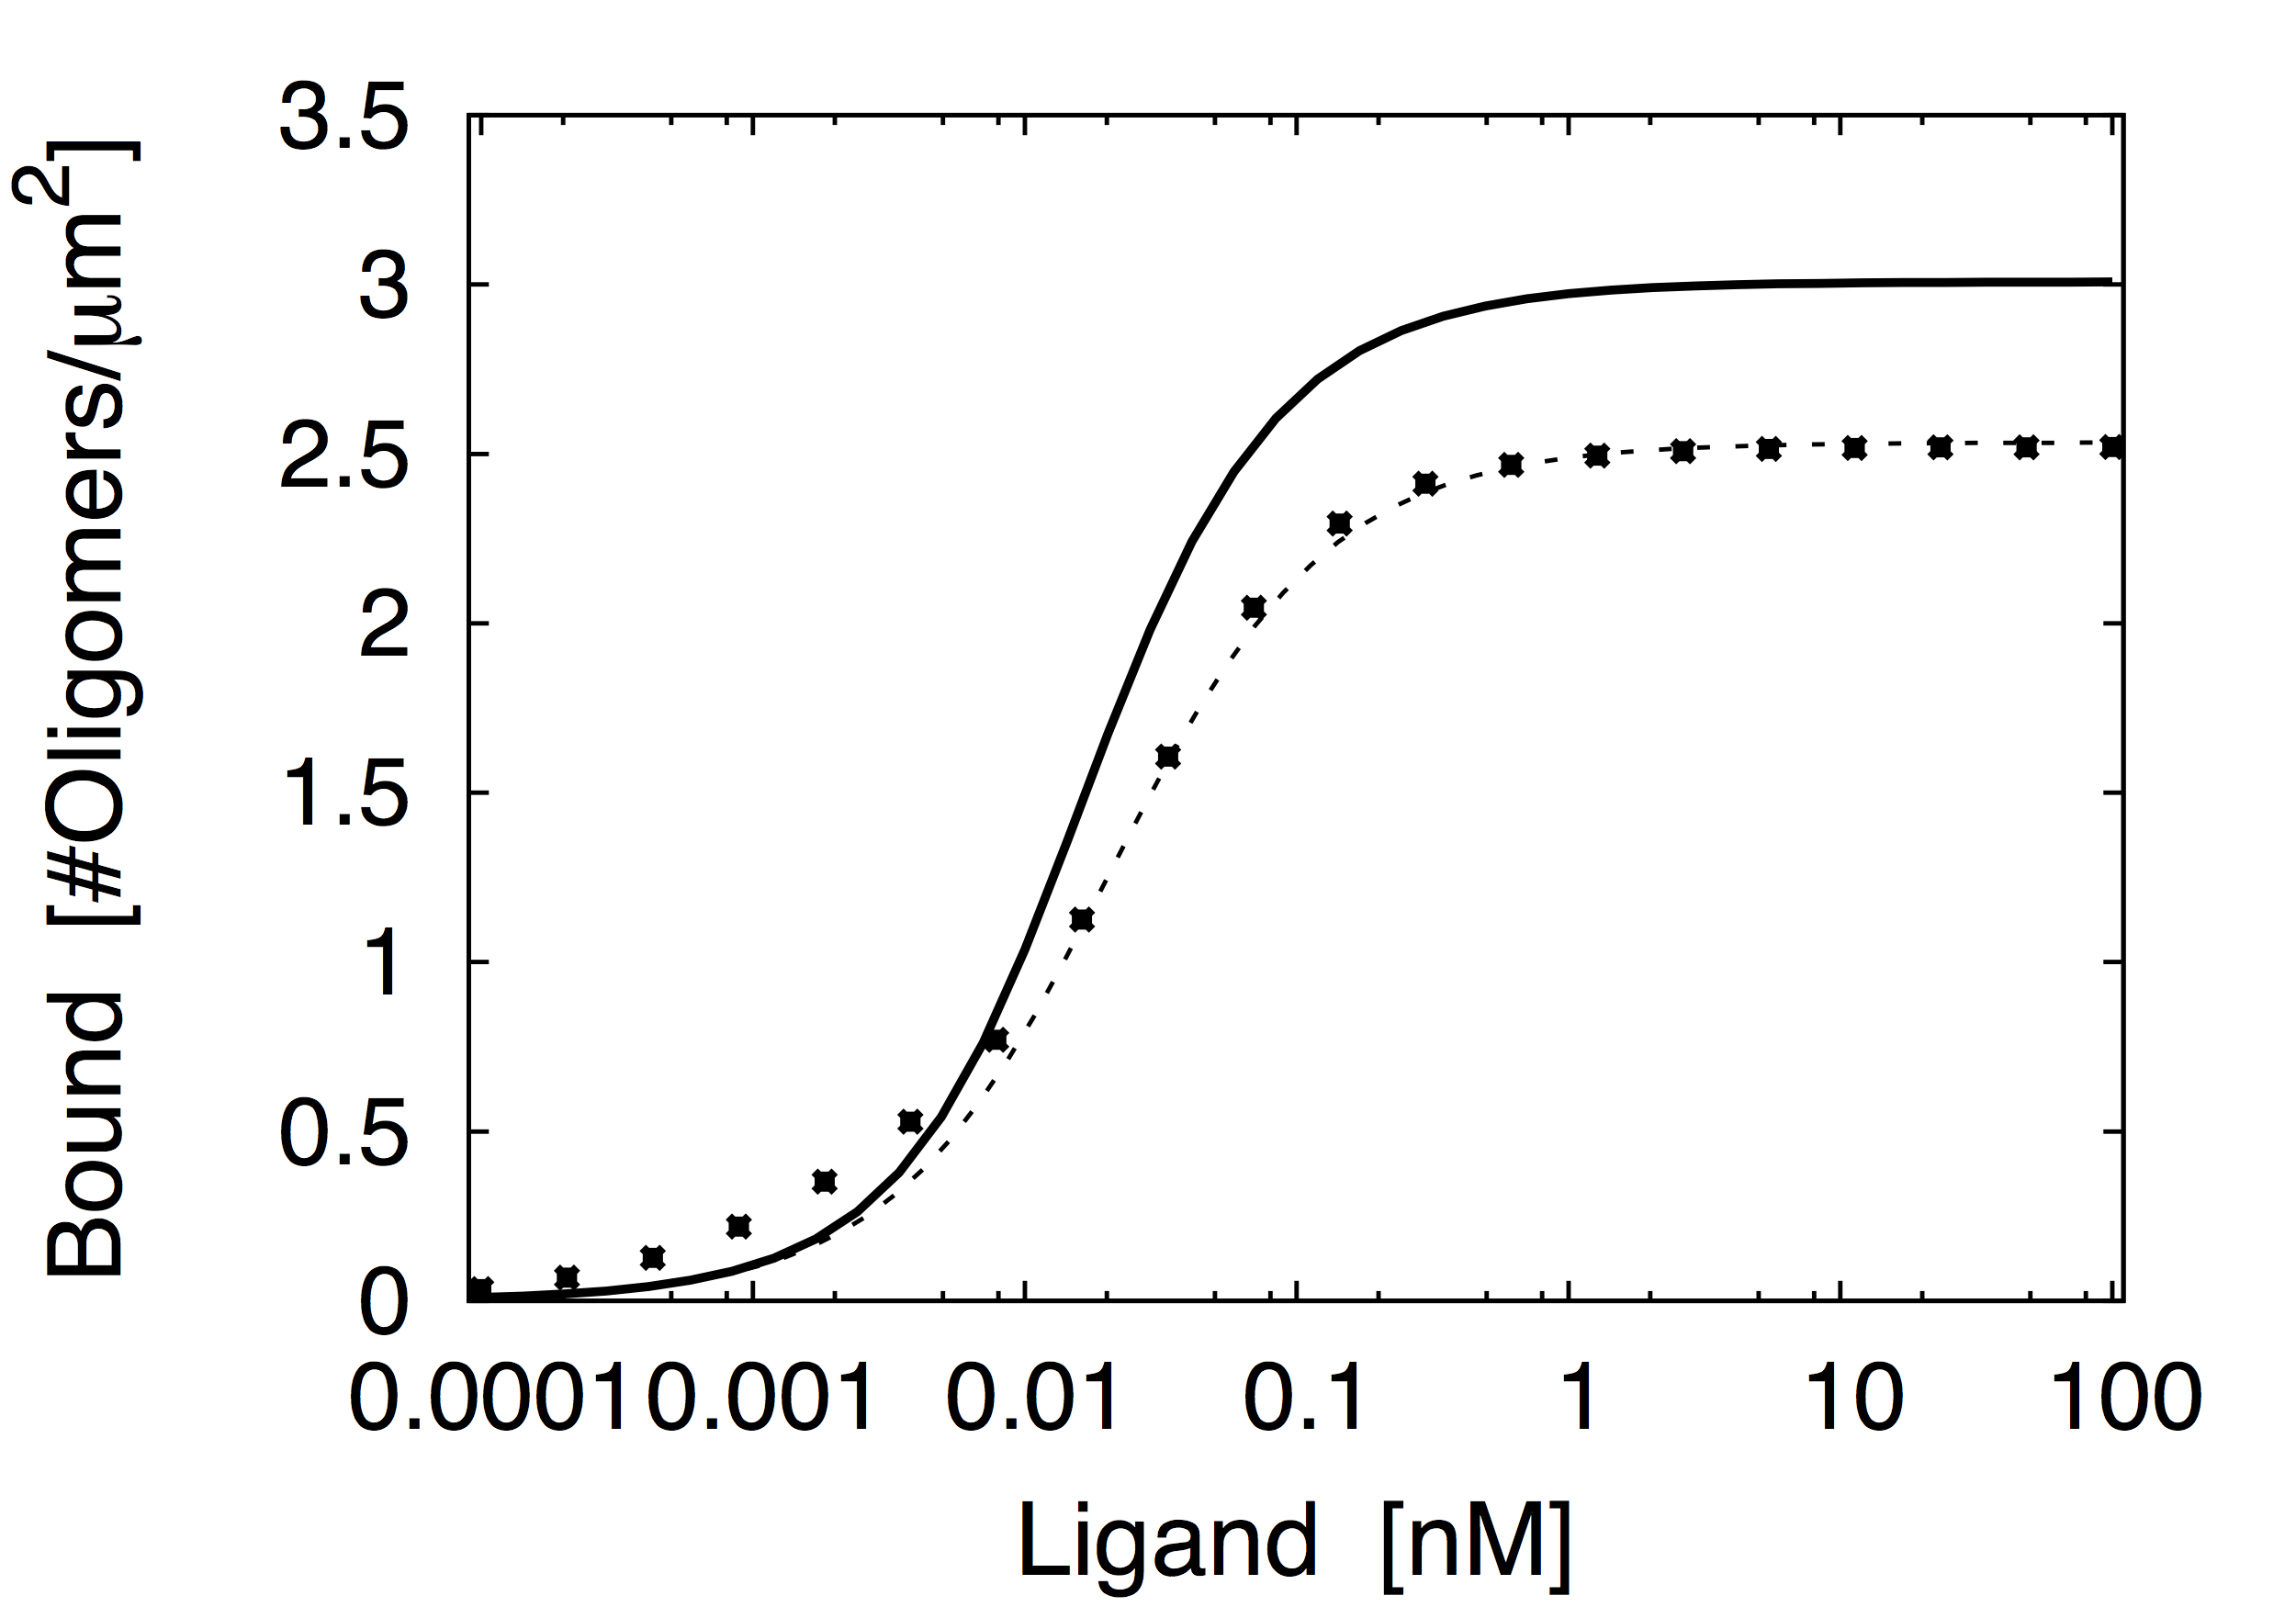
Cooperative effects can be also seen in the shape of the equilibrium binding curves. We compare the binding curves among the three cell-models configured to have same parameter values. For , and , the comparison results are shown in Figure 2a,c,e. In standard systems biology approaches, the Hill function can be fitted to the binding curves to quantify the cooperative characteristics in the cell-models. The Hill function can be generally written in the form of
| (10) |
where , , and represent ligand concentration, maximum area-density of the ligand-induced oligomers, ligands occupying half of the oligomers and the Hill coefficient, respectively. If the Hill coefficient is less than unity (), then the receptor system exhibits negative cooperativity. If , then cooperativity is positive. There is no cooperativity if .
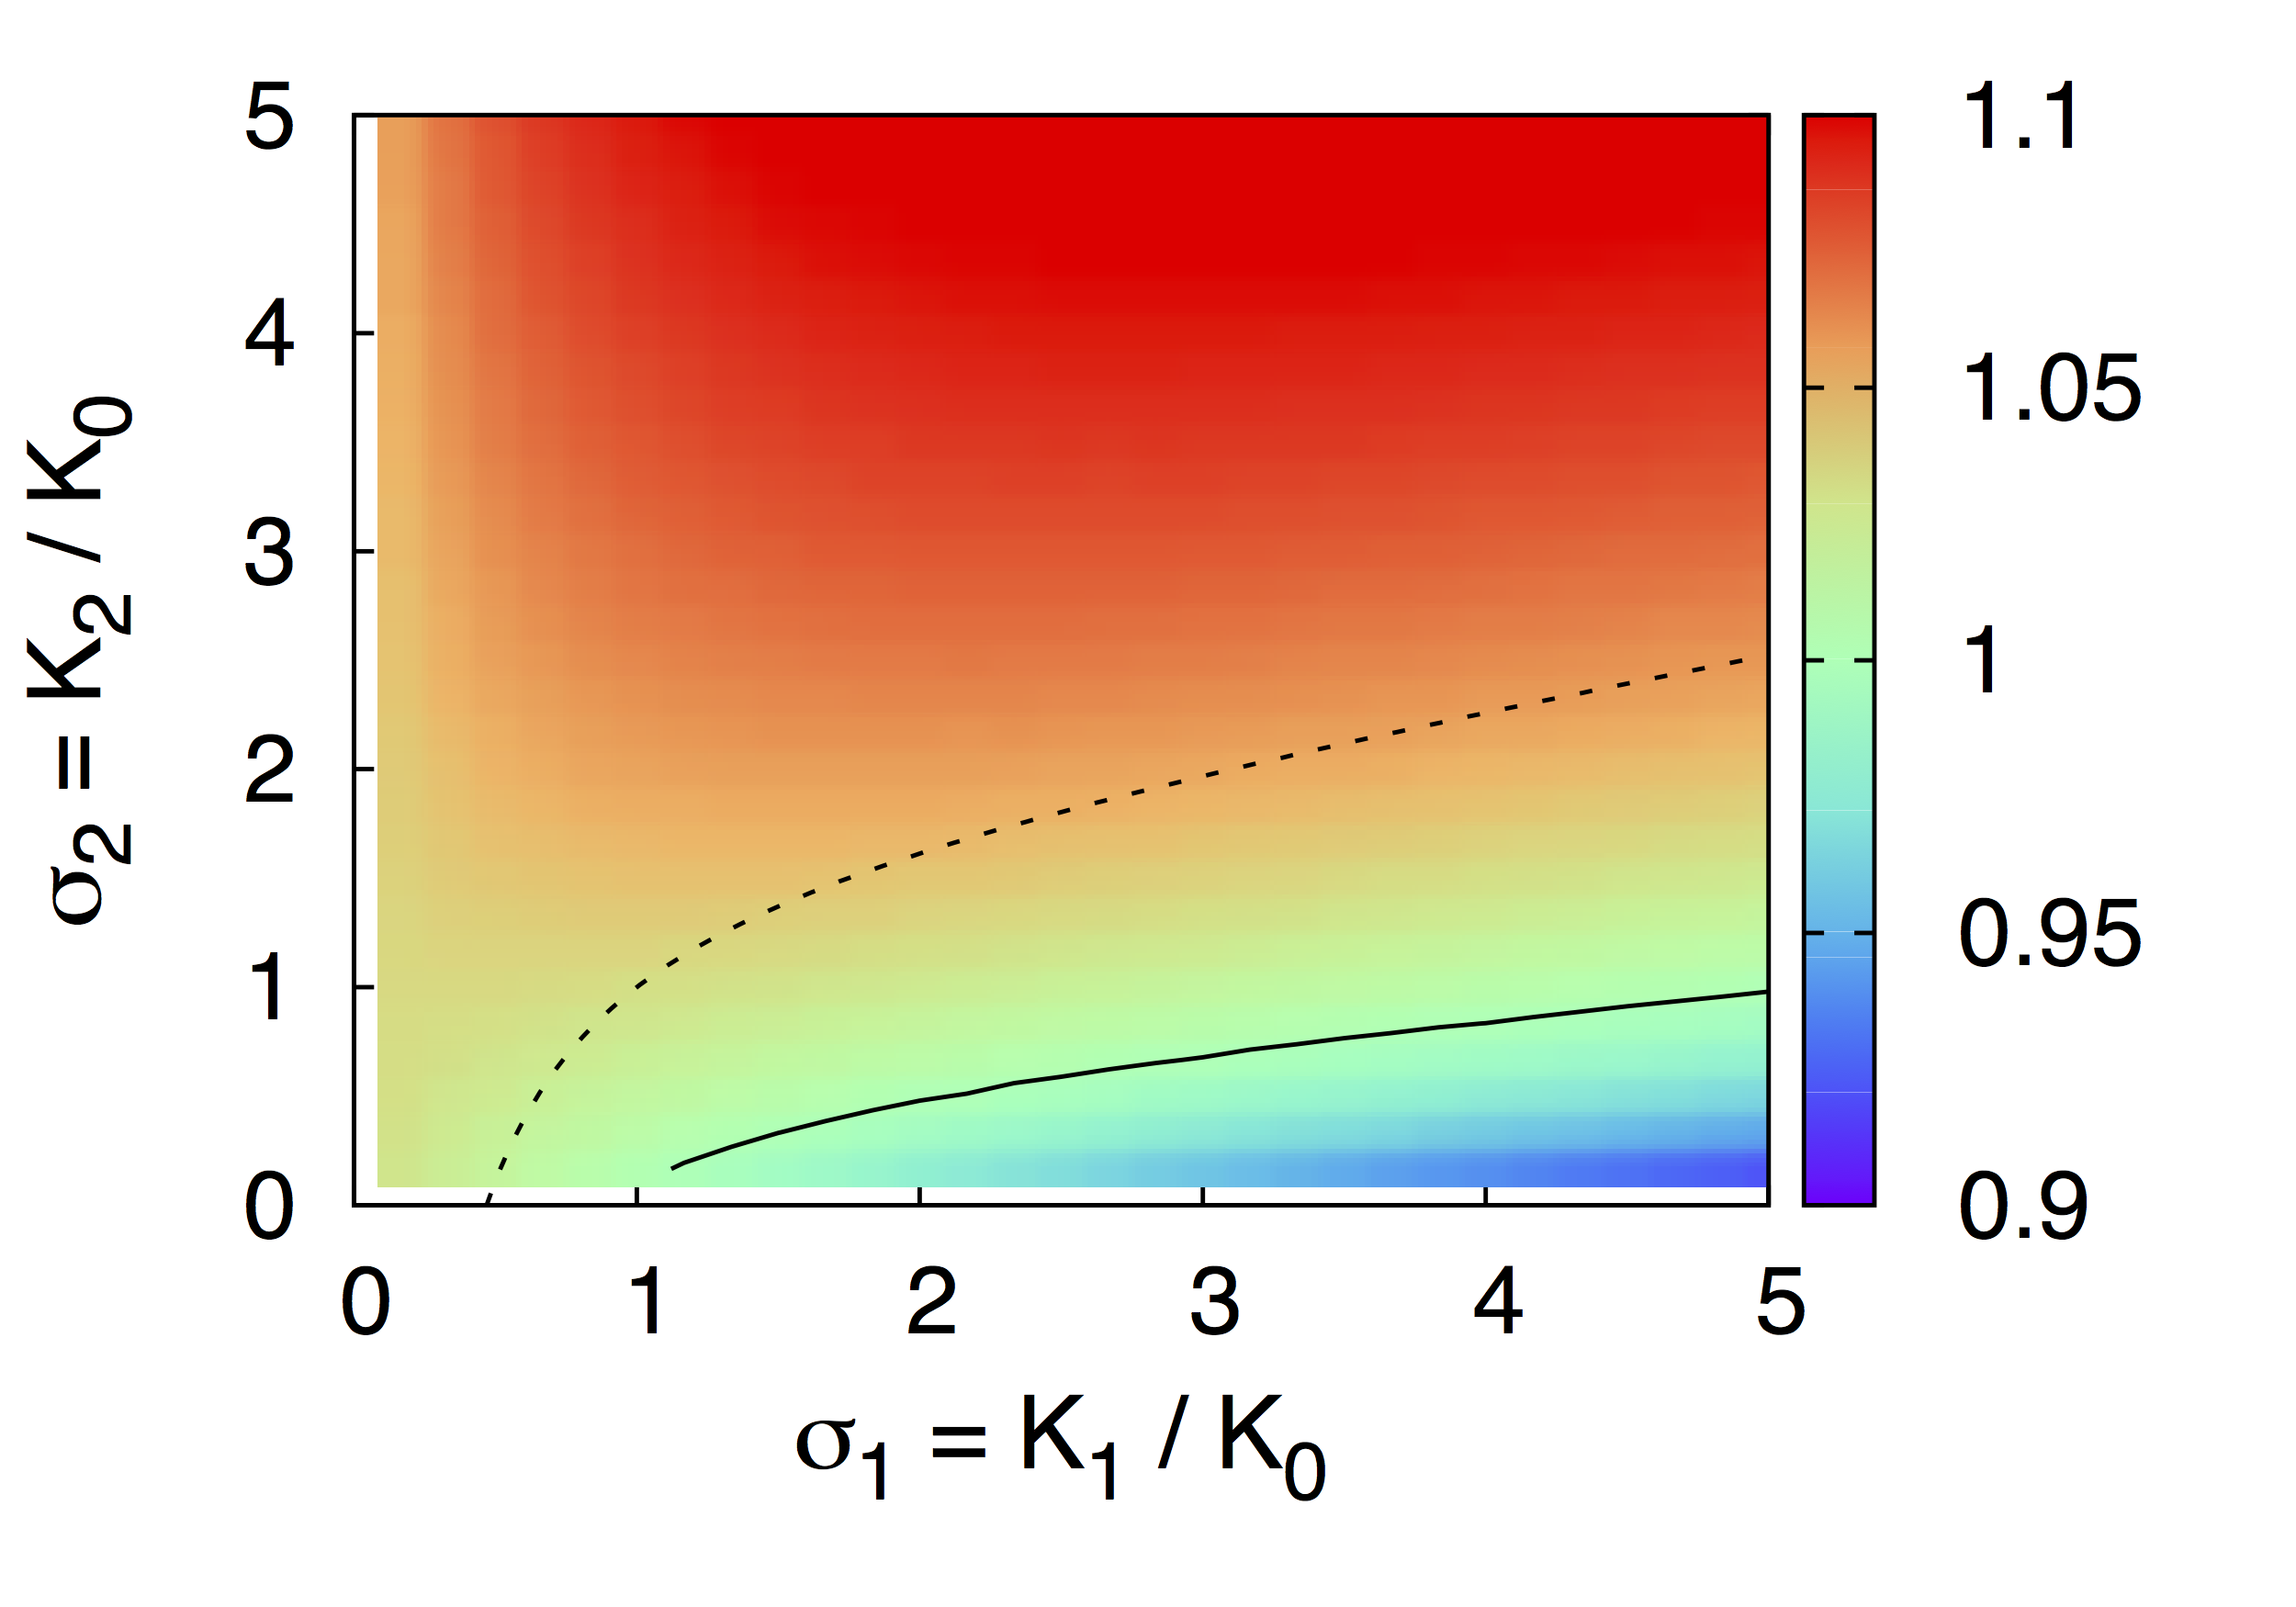
For a fixed , the best fit Hill coefficients of the monovalent model are mapped as a function of and . In Figure 3a the cooperativity mapping result is shown and compared with the WG condition given by Eq. (9). This comparison result clearly shows suppression of the negative cooperative region in the monovalent model, implying inconsistent cooperative responses between the monovalent model and the WG formulation.
Diagonalization. To see the cooperative effects that arise from the second-order interactions forming the higher-order oligomers in the bivalent model [see Eq. (5) and (6)], we diagonalize the lumped parameter matrix . Eigenvalues are given by
| (11) | |||||
where the dynamic range is .
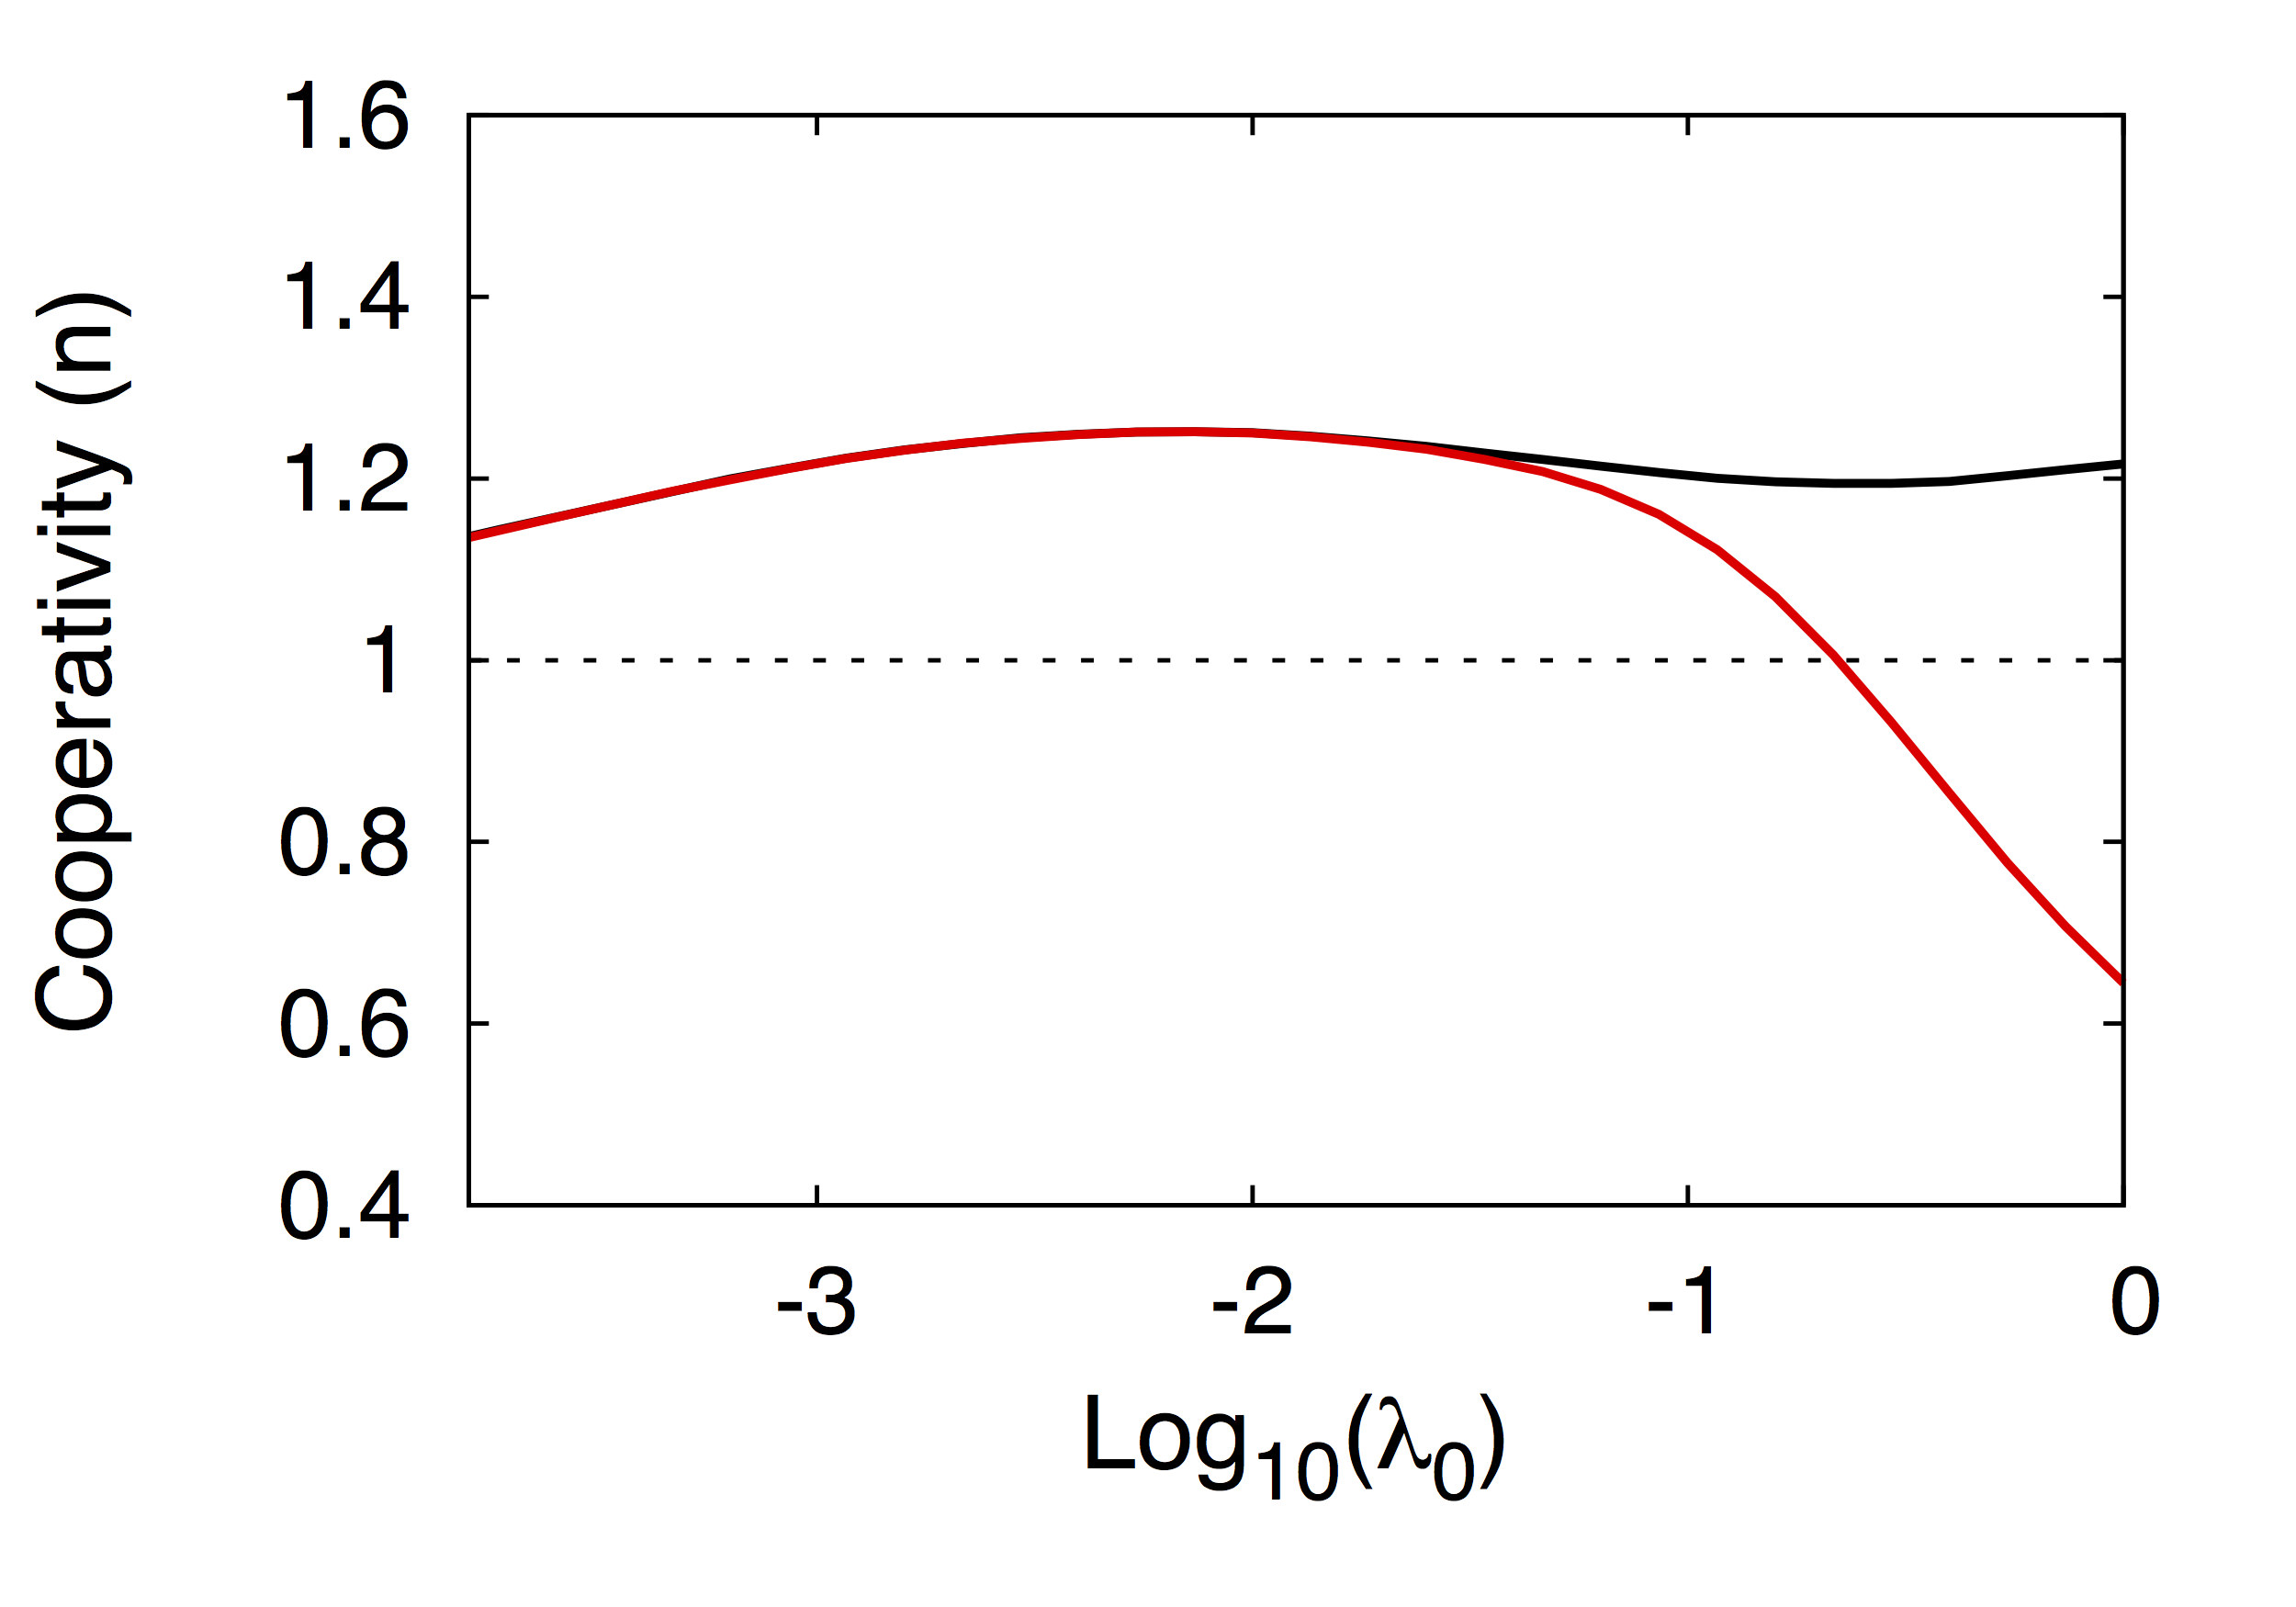
We compare cooperative responses between the monovalent and bivalent models when the eigenvalues of the lumped parameter matrix in the bivalent model are identical (). Figure 3b shows cooperativity transition of the bivalent model as a function of the component in Eq. (11). While cooperativity is always positive in the monovalent model (black line), cooperativity in the bivalent model is shifted from positive to negative through the increase of (red line). In the lower -range, the second-order couplings are weakly linked with cooperative responses, displaying identical cooperativity between the monovalent and bivalent models. The higher -values in the bivalent model can, however, increase the number of trimers () and tetramers () in the monomeric observable . Also, these higher-order oligomers are weakly linked with the fist-order couplings that represent ligand-dissociation (, ) and -association (, ). Because of these model parameter relations, the bivalent model exhibits the transition of cooperativity in the higher -range.
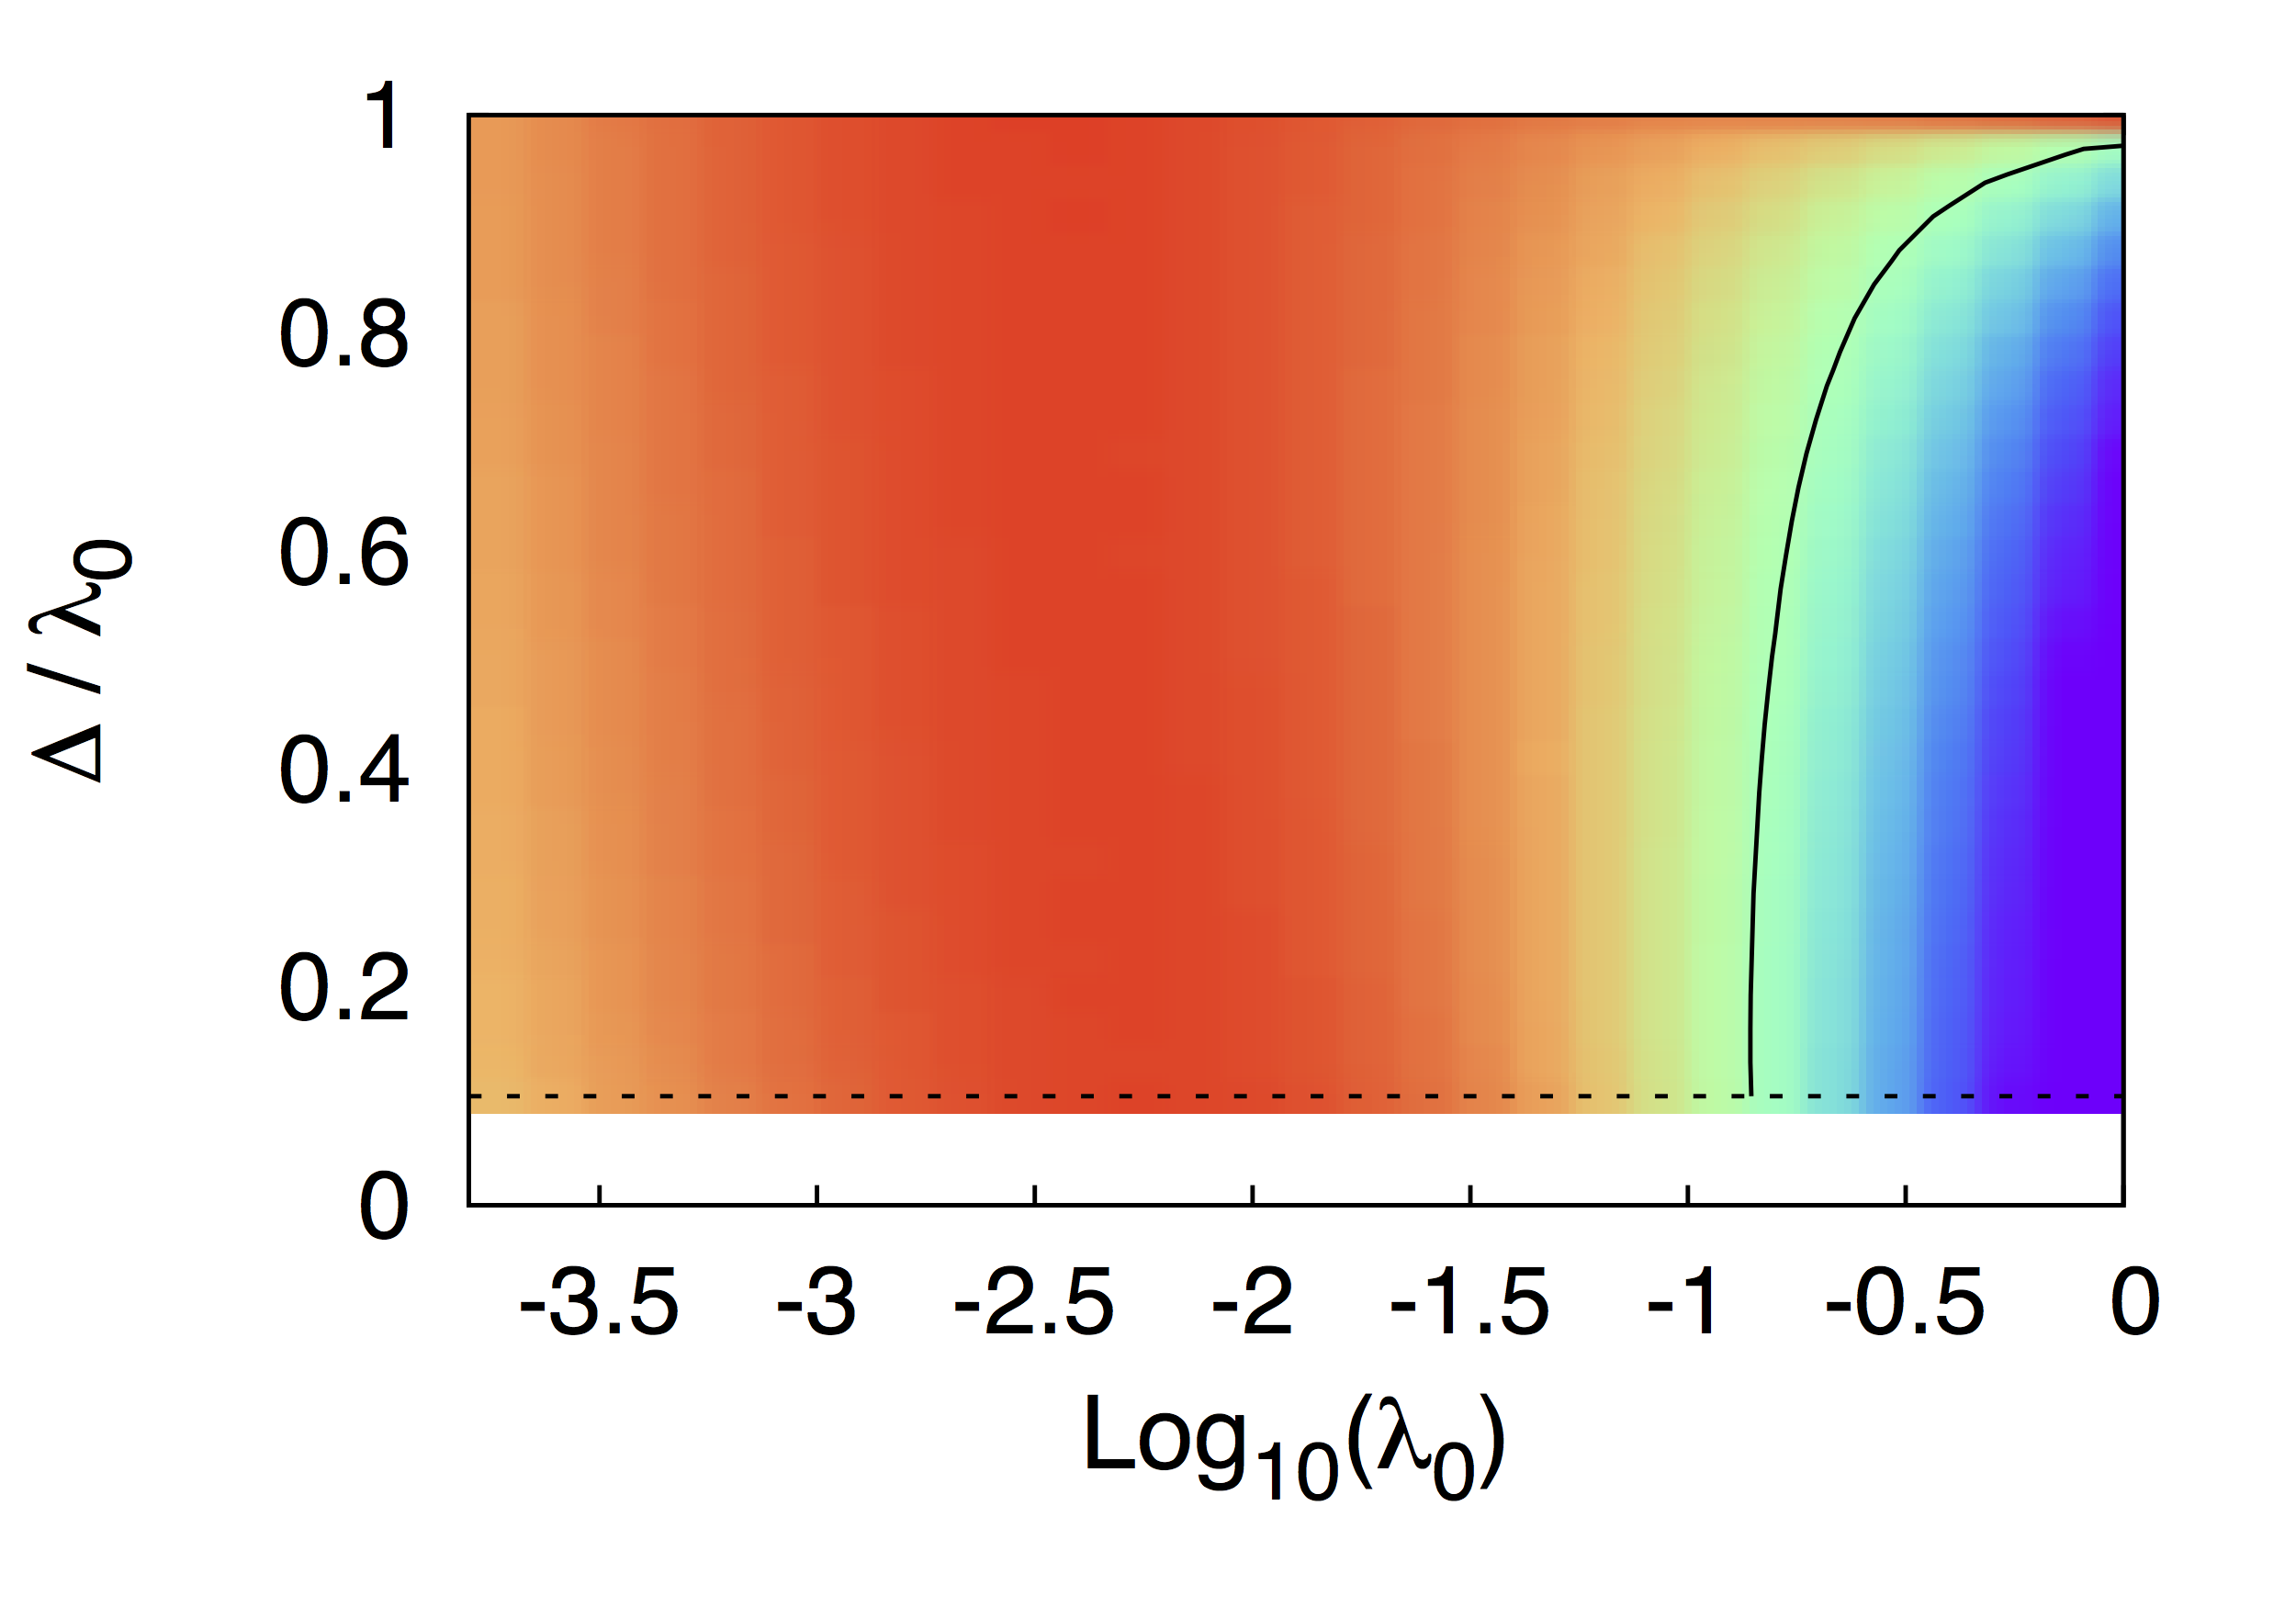
We also evaluate cooperative responses in the bivalent model in the case of differing eigenvalues (). Figure 3c shows cooperativity of the bivalent model as a function of the and components in Eq. (11). As the ratio of these components converges to unity (or ), the bivalent model becomes equivalent to the monovalent model, exhibiting positive cooperativity in the full -range. While cooperativity is always positive at (or ), the trimer and tetramer formations in the monomeric observable can change cooperativity from positive (red region) to negative (blue region) for (or ).
Our results may have biophysical implications in data-driven modeling approaches. Many biomolecular binding processes have been modeled under the scenario that the second-order couplings are weakly linked with cooperative effects. For example, the dimerization model that describes heregulin (HRG) binding with ErbB receptors in living cells was constructed using fluorescence microscopy images via HRG tagged with tetramethylrhodamine Hiroshima et al. (2012). In this model, the first-order coupling representing a conformational change of receptor complex in the monomeric observable () plays a key role that gives rise to negative cooperativity. Nevertheless, there exist various aggregated receptor-states hidden in the physical observables. These states are realistic but unobserved through the fluorescent imaging techniques. By incorporating the second-order interactions forming higher-order oligomers that can include unobserved receptors into the dimerization model, cooperativity may shift from positive to negative, and vice versa. Because of these transitions, the data-driven modeling approach is not a straightforward method to identify physical sources giving rise to negative cooperative effects in the receptor systems.
Conclusion. In this article, we explored the origin of negative cooperativity in dimer formations for equilibrium binding of ligands to cell-surface receptors, in terms of biochemical parameters for associations and dissociations. While receptor-receptor couplings in the ligand-induced receptor dimerization have been previously linked with cooperativity via minimal representations of physical observables, cooperative effects that arise from the mixture of various aggregated receptor-states hidden in each observed receptor-states have received less attention. In particular, we examined the cooperativity of monovalent and bivalent models. Our results from model simulations showed the suppression of negative cooperative regions in the monovalent model, thereby implying violation of parameter conditions expected from the WG formulation. We also demonstrated that the presence of higher-order oligomer formations in the bivalent model leads to the transition of cooperativity from positive to negative, thus affecting physical interpretations of the cooperativity extracted from data-driven modeling approaches. Furthermore, it is interesting to extend our state-vector representations to more general model frameworks by incorporating heterodimer formations of receptor-family members (e.g., dimerization of ErbB3 and EGF receptors Itano et al. (2018); Ito et al. (2019)).
Acknowledgments. We would like to thank Yasushi Okada, Tomonobu M. Watanabe, Jun Kozuka, Michio Hiroshima, Kozo Nishida, Suguru Kato, Toru Niina, Koji Ochiai, Keiko Itano, Kotone Itaya and Kaoru Ikegami for their guidance and support throughout this research work. We would also like to thank Kylius Wilkins for critical reading of the manuscript. This research work is supported by JSPS (Japanese Society for the Promotion of Science) KAKENHI Grant No. 15K12146.
References
- Strandburg-Peshkin et al. (2017) A. Strandburg-Peshkin, D. R. Farine, M. C. Crofoot, and I. D. Couzin, Habitat and social factors shape individual decisions and emergent group structure during baboon collective movement, eLife 6, e19505 (2017).
- Strandburg-Peshkin et al. (2015) A. Strandburg-Peshkin, D. R. Farine, I. D. Couzin, and M. C. Crofoot, Shared decision-making drives collective movement in wild baboons, Science 348, 1358–1361 (2015).
- Koshland and Hamadani (2002) D. E. Koshland and K. Hamadani, Proteomics and models for enzyme cooperativity, J. Biol. Chem. 277, 46841–46844 (2002).
- Ferrell (2009) J. E. Ferrell, Q & A : Cooperativity, J. Biol. 8 (2009).
- Stefan and Nove (2013) M. I. Stefan and N. L. Nove, Cooperative Binding, PLOS Comput. Biol. 9, e1003106 (2013).
- Phillips et al. (2013) R. Phillips, J. Kondev, J. Theriot, H. G. Garcia, and Orme, Physical Biology of the Cell., 2nd ed. (Garland Science, 2013).
- Monod et al. (1965) J. Monod, J. Wyman, and J. P. Changeux, On the nature of allosteric transitions: a plausible model., J. Mol. Biol. 12, 88–118 (1965).
- Koshland et al. (1966) D. E. J. Koshland, D. Nemethy, and G. Filmer, Comparison of Experimental Binding Data and Theoretical Models in Proteins Containing Subunits, Biochemistry 5, 365–385 (1966).
- Alan (1999) F. Alan, Structure and mechanism in protein science : a guide to enzyme catalysis and protein folding., 1st ed. (W. H. Freeman, 1999).
- Wofsy et al. (1992) C. Wofsy, B. Goldstein, K. Lund, and H. S. Wiley, Implications of epidermal growth factor (EGF) induced egf receptor aggregation., Biophys. J. 63, 98–110 (1992).
- Wofsy and Goldstein (1992) C. Wofsy and B. Goldstein, Interpretation of Scatchard plots for aggregating receptor systems., Math. Biosci. 112, 115–54 (1992).
- Klein et al. (2004) P. Klein, D. Mattoon, M. A. Lemmon, and J. Schlessinger, A structure-based model for ligand binding and dimerization of EGF receptors, Proc. Natl. Acad. Sci. U.S.A. 101 (2004).
- Mayawala et al. (2005a) K. Mayawala, D. G. Vlachos, and J. S. Edwards, Computational modeling reveals molecular details of epidermal growth factor binding, BMC Cell Biol. 6, 1–11 (2005a).
- Mayawala et al. (2005b) K. Mayawala, D. G. Vlachos, and J. S. Edwards, Heterogeneities in EGF receptor density at the cell surface can lead to concave up scatchard plot of EGF binding, FEBS Lett. 579, 3043–3047 (2005b).
- Ozcan et al. (2006) F. Ozcan, P. Klein, M. a. Lemmon, I. Lax, and J. Schlessinger, On the nature of low- and high-affinity EGF receptors on living cells, Proc. Natl. Acad. Sci. U.S.A. 103, 5735–5740 (2006).
- Macdonald and Pike (2008) J. L. Macdonald and L. J. Pike, Heterogeneity in EGF-binding affinities arises from negative cooperativity in an aggregating system, Proc. Natl. Acad. Sci. U.S.A. 105, 20147–20148 (2008).
- Lemmon (2008) M. A. Lemmon, Ligand-induced ErbB receptor dimerization, Experimental Cell Research 315, 638–648 (2008).
- Adak et al. (2011) S. Adak, D. DeAndrade, and L. J. Pike, The tethering arm of the EGF receptor is required for negative cooperativity and signal transduction, J. Biol. Chem. 286, 1545–1555 (2011).
- Pike (2012) L. Pike, Negative co-operativity in the EGF receptor, Biochem. Soc. Trans. 40, 15–19 (2012).
- Hiroshima et al. (2012) M. Hiroshima, Y. Saeki, M. Okada-Hatakeyama, and Y. Sako, Dynamically varying interactions between heregulin and ErbB proteins detected by single-molecule analysis in living cells., Proc. Natl. Acad. Sci. U.S.A. 109, 13984–9 (2012).
- Hiroshima and Sako (2013) M. Hiroshima and Y. Sako, Regulation Mechanism of ErbB-Heregulin Interaction Shown by Single-molecule Kinetic Analysis in Living Cells., Biophys. Physicobiol. 53, 317–318 (2013).
- Tomita et al. (1999) M. Tomita, K. Hashimoto, K. Takahashi, T. Shimizu, Y. Matsuzaki, F. Miyoshi, K. Saito, S. Tanida, K. Yugi, and J. Venter, E-CELL: Software environment for whole-cell simulation., Bioinformatics 15, 72–84 (1999).
- Arjunan and Tomita (2010) S. N. V. Arjunan and M. Tomita, A new multicompartmental reaction-diffusion modeling method links transient membrane attachment of E. coli MinE to E-ring formation, Syst. Synth. Biol. 4, 35–53 (2010).
- Itano et al. (2018) K. Itano, T. Ito, S. Kawasaki, Y. Murakami, and T. Suzuki, Mathematical modeling and analysis of ErbB3 and EGFR dimerization process for the gefitinib resistance, JSIM Letters 10, 33–36 (2018).
- Ito et al. (2019) T. Ito, Y. Kumagai, K. Itano, T. Maruyama, K. Tamura, S. Kawasaki, T. Suzuki, and Y. Murakami, Mathematical analysis of ge fi tinib resistance of lung adenocarcinoma caused by MET ampli fi cation, Biochem. Biophys. Res. Commun. 511, 544–550 (2019).