Jet-driven galaxy-scale gas outflows in the hyper-luminous quasar 3C 273
Abstract
We present an unprecedented view on the morphology and kinematics of the extended narrow-line region (ENLR) and molecular gas around the prototypical hyper-luminous quasar 3C 273 ( at ) based on VLT-MUSE optical 3D spectroscopy and ALMA observations. We find that: 1) The ENLR size of kpc implies a smooth continuation of the size-luminosity relation out to large radii or a much larger break radius as previously proposed. 2) The kinematically disturbed ionized gas with line splits reaching 1000 out to kpc is aligned along the jet axis. 3) The extreme line broadening on kpc scales is caused by spatial and spectral blending of many distinct gas clouds separated on sub-arcsecond scales with different line-of-sight velocities. The ENLR velocity field combined with the known jet orientation rule out a simple scenario of a radiatively-driven radial expansion of the outflow. Instead we propose that a pressurized expanding hot gas cocoon created by the radio jet is impacting on an inclined gas disk leading to transverse and/or backflow motion with respect to our line-of-sight. The molecular gas morphology may either be explained by a density wave at the front of the outflow expanding along the jet direction as predicted by positive feedback scenario or the cold gas may be trapped in a stellar over-density caused by a recent merger event. Using 3C 273 as a template for observations of high-redshift hyper-luminous AGN reveals that large-scale ENLRs and kpc scale outflows may often be missed due to the brightness of the nuclei and the limited sensitivity of current near-IR instrumentation.
1 Introduction
The quasi-stellar radio source (quasar) 3C 273 was found to have a redshift of (Schmidt, 1963), which revealed that quasars are of extra-galactic origin and cannot be stars. 3C 273 is one of the most luminous quasars at low redshift with an absolute brightness of mag (e.g. Hamilton et al., 2008) and a radio flux of Jy (Kellermann et al., 1969) corresponding to . 3C 273 is therefore a proto-typical active galactic nucleus (AGN) since only accretion by a super-massive black hole (SMBH) can produce the observed energy (Salpeter, 1964).
The enormous energy released by luminous AGN like 3C 273 is suspected to significantly affect the evolution of their host galaxies either through radiative AGN feedback (e.g Silk & Rees, 1998) or mechanical feedback via their jets (e.g. Pedlar et al., 1990). While the impact of jets on the hot halo gas around massive galaxies has already been confirmed (see Fabian, 2012, for a review), the capability of AGN radiation to accelerate and expel a large gas reservoir from AGN host galaxies is currently under intense investigation.
Large reservoirs of ionized gas on tens to hundreds kpcs scales have been detected around many luminous radio-loud and radio-quiet AGN at low redshifts (Stockton & MacKenty, 1983; Danziger et al., 1984; van Breugel et al., 1985; Stockton & MacKenty, 1987; Prieto et al., 1993; Shopbell et al., 1999; Tadhunter et al., 2000; Stockton et al., 2002; Villar-Martín et al., 2005, 2010; Husemann et al., 2010, 2011; Greene et al., 2012; Liu et al., 2013a, 2014; Hainline et al., 2014; Villar-Martín et al., 2017, 2018) as well as at high redshifts (e.g. Heckman et al., 1991; McCarthy, 1993; Christensen et al., 2006; North et al., 2012; Cantalupo et al., 2014; Hennawi et al., 2015; Borisova et al., 2016; Cai et al., 2017; Arrigoni Battaia et al., 2018; Husemann et al., 2018). These are often referred to as extended emission-line regions (EELRs) or extended narrow-line regions (ENLRs) in the literature without a clear distinction between the two. However, the largest ionized nebulae have predominantly been associated with radio-loud AGN hosting large-scale jets. The size and morphology of EELRs are therefore often interpreted as being redistributed material due to shock fronts created by the expanding radio jet (e.g. Tadhunter et al., 2000; Tremblay et al., 2018) or a signature of tidal debris from galaxy interactions (e.g. Villar-Martín et al., 2010, 2018). In this paper, we use the term EELR for ionized gas on 10 to several 100 kpc scales independent of the ionization mechanism and the term ENLR only for clearly AGN ionized gas out to several tens of kpc around luminous AGN.
Independent of the size of the ionized nebulae, the prevalence of kpc-scale outflows around AGN remains a key question to understand AGN feedback and its impact on host galaxies. Spectroscopic observations have therefore been crucial to map fast AGN-driven outflow from low-luminosity (e.g. Storchi-Bergmann et al., 1992; Crenshaw & Kraemer, 2000; Riffel & Storchi-Bergmann, 2011; Fischer et al., 2013; Venturi et al., 2018) to high-luminosity AGN (e.g. Greene et al., 2011; Liu et al., 2013b; Harrison et al., 2014; Carniani et al., 2015; McElroy et al., 2015; Kakkad et al., 2016; Karouzos et al., 2016) and AGN with powerful radio jets leading to jet-cloud interactions (e.g. Tadhunter et al., 1989; Emonts et al., 2005; Holt et al., 2008; Morganti et al., 2013; Mahony et al., 2016; Villar-Martín et al., 2017; Nesvadba et al., 2017; Santoro et al., 2018; Jarvis et al., 2019). Yet, the relative role of jets and AGN radiation as the main driver for fast outflows and their diverse properties among the overall AGN population still needs to be investigated.
3C 273 represents an ideal laboratory to study the relative impact on the radiation and the jet with the surrounding medium. While 3C 273’s radio jet has been studied in detail over the past 50 years, observations of its host galaxy remain difficult due to the overwhelmingly bright nucleus. The host galaxy was first detected from the ground by Wyckoff et al. (1980) and followed up with Hubble at high-angular resolution (Bahcall et al., 1995; Martel et al., 2003). Wyckoff et al. (1980) and Boroson et al. (1985) already noted evidence of extended emission lines a few arcsec away from the nucleus, but Stockton & MacKenty (1987) did not detect an EELR in [O III] using narrow-band imaging. Hippelein et al. (1996) presented the first map of the ENLR from Fabry-Perot imaging.
In this article, we present a combined study of deep optical integral-field unit (IFU) observations of 3C 273 with the Multi-Unit Spectroscopic Explorer (MUSE, Bacon et al., 2010) and CO(1-0) mapping with archival ALMA observations. The MUSE data reveal highly complex ionized gas motions in the host galaxy of 3C 273 and the ALMA observations highlight substantial amounts of molecular gas. We discuss our observations in the light of an expanding hot gas cocoon inflated by the radio jet which creates a fast outflow and shock front in the ISM. Furthermore, we explore the detectability of similar ENLRs around hyper-luminous () AGN at high-redshift as studied for example by the WISSH project (Bischetti et al., 2017). Throughout the paper we assume a concordance flat CDM cosmology with , and corresponding to 2.73kpc/″ at the redshift of 3C 273.
2 Observations & Analysis
2.1 MUSE observations
MUSE data of 3C 273 were obtained under ESO program 097.B-0080(A) on 31 March 2016 under gray moon, clear sky conditions and a seeing of 07. The data cover a field-of-view (FoV) at sampling and a wavelength range of 4750–9300Å at a spectral resolution of . Given the brightness of 3C 273 (mag), we split the observations into s exposures with a total integration time of 4500s. Small sub-arcsec dithering and standard rotations between exposures were applied to mitigate residuals of the flat-fielding. The data were fully reduced and calibrated using the standard ESO pipeline (Weilbacher et al., 2014).
The reconstructed MUSE color image is shown in Fig. 1 (panel a). The bright AGN point source and the optical jet of 3C 273 are both well visible. An important processing step is therefore the deblending of the unresolved AGN emission from the spatially-resolved emission of the host galaxy. We use the software qdeblend3D (Husemann et al., 2013, 2014) to estimate the point-spread function from the 2D intensity distribution of the H, H, He I, and H broad line wings originating from the unresolved AGN broad-line region. Afterwards we interpolate the wavelength-dependent PSF with a 2nd order polynomial on a spaxel-by-spaxel basis. The AGN spectrum from the central spaxels is then convolved with the PSF and subtracted from the original data. Since the H line is saturated at the peak of the PSF, we cannot use the central spaxel for the wavelength range around H. Hence, we rather use a region north-east of the AGN which shows a deficit in extended emission to create a “pure” AGN spectrum around H which we convolve again with the corresponding PSF and subtract it from the original data. Given the brightness of the AGN we still obtain a very high S/N spectrum of the AGN a few arcsec away from the center which does not leave strong residuals after subtraction. Nevertheless, the spaxels with 08 around the AGN position remain corrupted in H due to the saturation and need to be ignored completely.
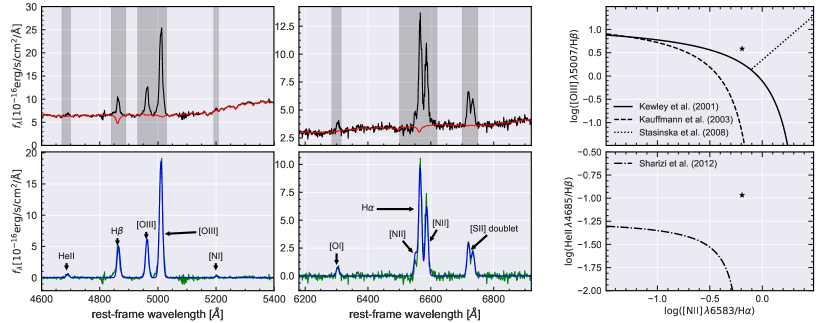
As shown in Fig. 1, we clearly recover spatially extended [O III] emission with complex kinematics even at an AGN-host galaxy contrast ratio of about 200 in the continuum. In addition, we also recover the stellar continuum of the host galaxy at high S/N within an annulus of 08–6″circular radii (Fig. 2 top panel). We modelled the stellar continuum by fitting stellar templates from the INDO U.S. library (Valdes et al., 2004) using the PyParadise software (Walcher et al., 2015; Weaver et al., 2018). From the stellar continuum fit we infer an accurate systemic redshift of and a stellar velocity dispersion within this larger aperture of . The integrated spectrum reveals line ratios of [O III ]/H, [N II ]/H, and He II /H, where He II is detected with 10 confidence. We show the corresponding emission-line diagnostic diagrams in Fig. 2 together with classical demarcation lines, which clearly show that star formation is not the dominant ionization mechanism of the ionized gas. Due to the complex kinematics and heavy blending of the [N II] and H lines we cannot robustly map this line ratio across the nebula. However, the [O III ]/H line ratio map can be constructed (Fig. 1 panel c) and reveals that the line ratio is even higher in most parts confirming that AGN and/or shock ionization is the main ionization mechanisms across the nebula.
2.2 ALMA observations
ALMA uses 3C 273 as a calibrator so that a large number of short observations of this source are available. We retrieved all data available for 3C 273 covering the red-shifted frequency of 12CO(1-0) with a spatial resolution between 05 and 10. This included 8 different tracks from 5 different ALMA projects, all of which observed 3C 273 for 5 minutes in order to use it as a bandpass calibrator. In all but one case a 2 GHz correlator window (with a raw spectral resolution of 15.625 MHz) was present over the redshifted frequency of CO(1-0). In one case a 1850 MHz correlator window was present, with a raw spectral resolution of 3.906 MHz. The other spectral windows present in each observation were used to detect continuum emission.
The raw ALMA data for each track were calibrated using the standard ALMA pipeline in the Common Astronomy Software Applications (CASA) package. Additional flagging was carried out where necessary to improve the data quality. Three iterations of self calibration were used to improve the phase and amplitude calibration of the data on the bright continuum in 3C 273. The data presented here were produced using natural weighting, yielding a synthesized beam of 078 075 at a position angle of 37∘ (a physical resolution of 2.1 kpc). We use data with a channel width of 30 km s-1, and pixels of 02 (resulting in approximately 3.5 pixels across the synthesized beam).
Bright point source continuum emission with a flux of 12.90.02 Jy was detected over the full line-free bandwidth. Based on the position of this point source we are able to register the relative AGN positions of the MUSE and ALMA data with a precision of at least one pixel size (02). We subtracted the continuum emission from the data in the plane using the CASA task uvcontsub. The continuum-subtracted dirty cubes were cleaned in regions of source emission (identified interactively) to a threshold equal to 1.5 times the RMS noise of the dirty channels. The clean components were then added back and re-convolved using a Gaussian beam of full-width-at-half-maximum (FWHM) equal to that of the dirty beam. This produced the final, reduced, and fully calibrated 12CO(1–0) data cube of 3C 273, with a RMS noise levels 0.18 mJy beam-1 in each 30 km s-1 channel.
CO(1-0) emission was detected from this source, with an integrated line width of 490 km s-1 (FWHM), and an integrated intensity of 1.820.02 Jy km s-1. This corresponds to an H2 mass of (1.70.3) M⊙ assuming an = 0.8 M⊙ (K km s-1pc2)-1 as typically used for compact luminous systems, such as starburst galaxies, SMGs and QSOs (e.g. Downes & Solomon, 1998; Scoville et al., 2003; Xia et al., 2012). If we were instead to use a Galactic then the derived H2 mass in this system would increase by a factor of 5.5.
Zeroth moment (integrated intensity), first moment (mean velocity), and second moment (velocity dispersion) maps of the detected line emission were created using a masked moment technique. A copy of the clean data cube was first Gaussian-smoothed spatially (with a FWHM equal to that of the synthesized beam), and then Hanning-smoothed in velocity. A three-dimensional mask was then defined by selecting all pixels above a fixed flux threshold of 1.5 , adjusted to recover as much flux as possible in the moment maps while minimizing the noise. The moment maps were then created using the un-smoothed cubes within the masked regions only. In Fig. 1 we show the zeroth and first moment maps in panel (d) and (e), respectively.
The morphology of the molecular gas is surprisingly asymmetric and appears as an “arc”-like feature about away from the nucleus towards the south-west almost exactly perpendicular to the jet axis. It seems consistent with the dust lane identified in coronagraphic images presented by Martel et al. (2003), but the significantly lower spatial resolution of the ALMA data does not allow a precise spatial comparison. Importantly, the molecular arc is significantly more extended along the south-west direction on both sides of the spiral continuum excess structure seen in the Hubble images. In particular, there is no corresponding feature in Hubble images at the location of the brightest molecular gas knot seen 2″ west of the nucleus. Since the ionized gas morphology is completely different and does not show a similarly prominent structure it is unclear whether the molecular gas is bound to a stellar over-density formed in a recent galaxy interaction or is currently forming in-situ due to a density wave and enhanced ambient pressure initiated by the expanding outflow.
2.3 Multi-phase gas kinematics
With MUSE we recover extended [O III] emission out to 20 kpc from the quasar. The [O III] emission is asymmetric towards the east side as shown in Fig. 1 panel (b). The [O III] surface brightness distribution confirms the results of the Fabry-Perot imaging (Hippelein et al., 1996), but MUSE achieves a much higher S/N and covers a larger velocity range. In the bottom panels of Fig. 1, we present two pseudo-slit spectra (slit width of 08) for two position angles, one along the radio jet axis (PA N to E) and one perpendicular to it (PA ). In both cases we see highly complex ionized gas motions, with amplitudes of as well as several broad and multiply-peaked lines over this large velocity range in the central 4 kpc.
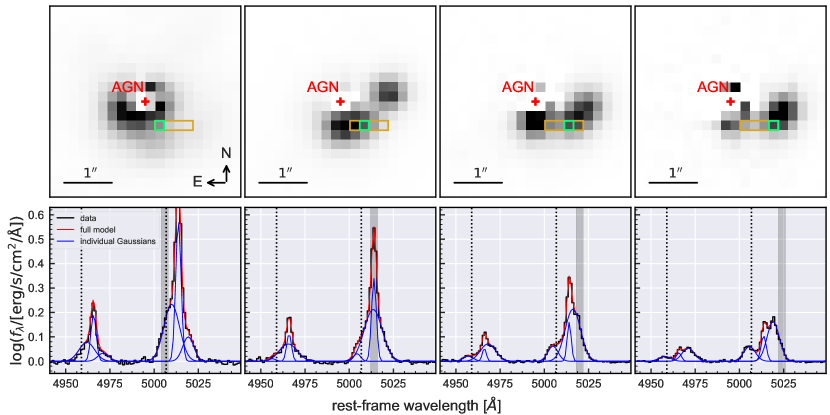
Figure 3 highlights the complexity of the [O III] line profiles which are difficult to model with a fixed number of Gaussians. It is highly desired to dissect the [O III] line profile into distinct components, which has been used to study individual physical conditions by correlating line ratios and kinematics (e.g. McElroy et al., 2015). We have tried this process but find that fitting [O III] line profiles separately for each spaxel violates the spatial correlation function imposed by the PSF as shown in Fig. 3. The [O III] line shape is significantly changing from spaxel to spaxel which have a size of 02, about a factor of 3 smaller than the FWHM of the seeing. While 3 Gaussians provide a good fit to the overall line profile in all cases, the spatial variation of the Gaussian parameters are unphysical as the PSF demands that individual spectral components only vary in flux on such small scales. A fully consistent solution would only be achieved when the line shapes are modelled directly in 3D taking the PSF into account as a constraint on the spatial flux distribution. Such a method, which is able to model the entire ENLR structure at once with the large number of components, still needs to be developed. For practical reasons, we rather map non-parametric line shape parameters such as the median velocity (), the peak velocity (), the FWHM and the width containing 80% of the line flux (), which has been previously used to to characterize ionized gas outflows in the [O III] line around luminous AGN (e.g. Harrison et al., 2014; Liu et al., 2013b; McElroy et al., 2015; Harrison et al., 2016; Sun et al., 2017). Since the method requires that the cumulative line flux distribution is monotonically increasing, i.e. no negative flux values across the line shape, we still need to generate a noise free model of the lines for each spaxel. Given the complex line shapes, we use a large spectral library of [O III] doublet lines to model the line profiles as a non-negative linear superposition which is not restricting the model to a fixed number of Gaussians. The library is constructed with a velocity range of at sampling and four line dispersions (, , , ), which are convolved with the instrumental resolution as inferred by Bacon et al. (2017) at the [O III] wavelength. During the fitting we discard components with a peak flux density S/N3 to avoid fitting noise features. We use a Monte Carlo approach to estimate errors for each parameter by re-fitting the noise-modulated data 50 times. In Fig. 1 panel f, g, h, and i we show the resulting kinematics maps with a velocity error less than and S/N5 for and FWHM.
The kinematics maps inferred from [O III] as shown in Fig. 1 are complex which are therefore best interpreted in conjunction with the molecular gas distribution and kinematics. The molecular gas corresponds to kinematically quiescent gas with a small line dispersion () and a smooth velocity gradient from blue to red-shifted motion of around the systemic velocity of the stellar body. The ionized gas shows the same smooth velocity gradient and radial velocity amplitude in and of at the location of the molecular gas with a small line width both in and FWHM. Furthermore, the ionized gas at even larger distance from the AGN exhibits the same direction of motion as the molecular gas which suggest that the large scale kinematics are dominated by gravitationally-driven rotational motion. These quiescent motions at radii define the global rotational pattern with red-shifted motion on the east and blue-shifted motion on the west side of the galaxy.
On the contrary, the ionized gas kinematics enclosed within the radius of the molecular gas arc is highly complex as demonstrated in Fig. 3. Nevertheless, the light-weighted bulk motion of the gas shows a bipolar velocity gradient along the radio jet axis with kinematics predominately red-shifted on the approaching jet side and blue-shifted on the opposite side. While the FWHM remains narrow with 400 across most of the ENLR it appears larger at the transition to the rotation-dominated region. This is likely a superposition effect due to the PSF smearing at the transition region. Likewise, the large width is not caused by individual clouds with high velocity dispersion but rather the spatial blending of many narrow emission lines with a broad distribution in radial velocities. While this complexity limits our ability to understand the interaction with ambient medium in detail, a key observation is that the radio jet axis is clearly aligned with the bipolar velocity gradient in the ionized gas indicative of a strong coupling between the expanding radio jet and the ambient gas in 3C 273. Although it is strange that the approaching side of the jet appears to push the gas backwards, we will outline a potential geometrical scenario in Sect. 3.2 based on the directly inferred relative orientation of the jet and gas disc.
3 Results & Discussion
3.1 ENLR size and kinematically disturbed region
A lot of different definitions have been adopted for the ENLR size, such as an effective radius (e.g. Husemann et al., 2014; Kang & Woo, 2018), the maximum detectable size (Bennert et al., 2002; Villar-Martín et al., 2010; Greene et al., 2012; Villar-Martín et al., 2018; Storchi-Bergmann et al., 2018) or the size till an intrinsic surface brightness limit corrected for cosmological dimming (e.g. Hainline et al., 2013; Liu et al., 2013a; Hainline et al., 2014; Sun et al., 2017). By design all those definitions are prone to different observational effects and their application is limited to specific science goals. The maximum detectable [O III] emitting region size is strongly dependent on the depth of observations and whether the ionization mechanisms can be ambiguously attributed to the AGN ionization. It is therefore not well suited to study scaling relations between AGN luminosity and the ENLR size. Additionally, the luminosity-weighted radius depends on whether the dominating NLR is included or excluded from the radius estimations.
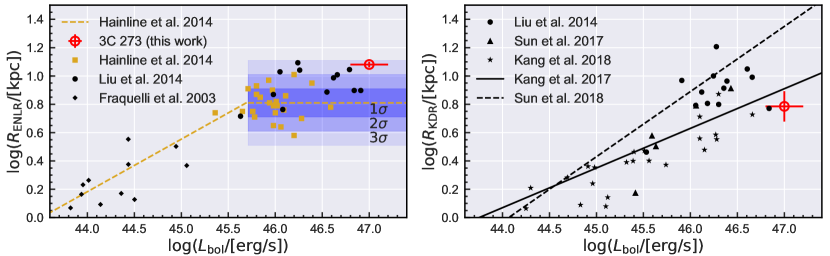
Several studies therefore adopted a characteristic ENLR size using a fixed intrinsic [O III] line flux surface brightness limit of to allow to construct a comparable ENLR size–luminosity relation at various redshifts. For 3C 273 we determine a characteristic ENLR size of kpc, which is robust given the good spatial resolution and the application of the PSF subtraction technique. In Fig. 4 (left panel) we compare this ENLR to literature measurements. Previously, a break in the – scaling relation has been reported to occur somewhere at 6–10 kpc (e.g. Liu et al., 2013a; Hainline et al., 2013, 2014). In order to mitigate the effect of beam smearing for their high-redshift targets, Hainline et al. (2014) applied a surface brightness profile fitting convolved with an approximate PSF to recover the intrinsic size of the ENLR. Considering that we were able to subtract the dominating AGN point source directly and that we can exclude a top-hat function as a radial light ENLR profile we compare our inferred ENLR size for 3C 273 with the Sersic profile measurements from Hainline et al. (2014). We find that the ENLR size of 3C 273 is larger than the proposed break radius and sample distribution reported by Hainline et al. (2014). This suggests that either the ENLR size–luminosity relation has no break radius at all, that the break in the ENLR size occurs at significantly larger radii, or that the ENLR is generically asymmetric at the chosen surface brightness limit so that the sizes are systematically underestimated in randomly orientied long-slit observations. Given that 3C 273 is an unobscured AGN, the intrinsic ENLR size may be even larger compared to the obscured AGN used in previous studies because the unified model predicts that the ionization cone of unobscured AGN should be more aligned towards the line-of-sight than for obscured AGN. This would mean that statistically a large correction factor needs to be applied to turn the measured projected ENLR sizes into intrinsic sizes. We can rule out that the ionization cone is directly aligned with our line of sight to explain the relatively round morphology, because the kinematic substructure and the known direction of the radio jet implies a significant inclination of the cone. In any case, those inclination effects would only strengthen our result as the intrinsic size of the ENLR would be even higher for 3C 273. Interestingly, we note that adopting a higher intrinsic [O III] surface brightness limit as proposed by Sun et al. (2018) would imply a size of kpc which is a factor 4 smaller than the corresponding – scaling relation reported by the authors. Hence, the choice of the surface brightness limit to measure the size has a great impact on the signatures of a ENLR break radius. Additionally, unaccounted systematic effects in the relation of Sun et al. (2018) may contribute to this discrepancy due to the use of broad-band imaging that still require spectroscopic confirmation.
A break in the size-luminosity relation would necessarily imply a transition from an ionization-bounded to matter-bounded region, e.g. running out of gas, as the radiation field smoothly decreased as . Hence, a transition may occur when the gas density drops faster than the radiation field at the edge of galaxies (Netzer et al., 2004; Hainline et al., 2013). The stellar body of 3C 273 can be traced out to a radius of 7″ (19 kpc) with an effective radius of (Martel et al., 2003). Hence, the ENLR does not reach beyond the host galaxy and is well covered within of the stellar distribution. A break in the ENLR size–luminosity relation may not occur at the chosen surface brightness limit simply because of the large size of 3C 273’s host galaxy. Alternatively, Dempsey & Zakamska (2018) proposed that the transition from ionization- to matter-bounded occurs because optically-thick clouds lead to a steeper decline of the radiation field than causing a break in the relation at small ENLR sizes. For 3C 273 we find the dense molecular gas to be located inside the characteristic ENLR radius so that dense gas shielding and filtering of AGN radiation may be responsible for the asymmetry of the ENLR and possibly reducing the ENLR brightness along the south-west direction but not towards the east side. Another scenario relevant for 3C 273 is the cooling of gas from the hot halo gas. According to the chaotic cold accretion (CCA) scenario, ionized gas filaments and clouds are condensing out of the hot phase within 10kpc (Gaspari et al., 2018, their Fig. 5). Due to CCA, the transition from ionization to matter-bounded ENLR clouds would be related to the cooling radius where a large portion of gas becomes neutral again to be ionized by the AGN radiation. While a fraction of the condensed gas will be funneled towards the SMBH, a residual part will settle onto a clumpy rotating structure within the central 10 kpc scale, which is in agreement with our observations.
Overall, none of the processes that have been proposed to reduce the ENLR break radius seems relevant for 3C 273. This is in agreement with our result that 3C 273 is inconsistent with the reported break radius in the ENLR size–luminosity relation. However, very large EELRs have been reported around luminous AGN at low surface brightness levels (e.g. Villar-Martín et al., 2010; Husemann et al., 2011; Kreimeyer & Veilleux, 2013; Villar-Martín et al., 2018) order of magnitude below the intrinsic surface brightness assumed for the characteristic ENLR radius here. Usually those EELR structures are in a matter-bounded regime far beyond the transition radius (e.g. Fu & Stockton, 2007; Kreimeyer & Veilleux, 2013; Storchi-Bergmann et al., 2018) and are therefore usually associated with gas density enhancements in the intergalactic medium due to tidal tails, ongoing galaxy interactions or ram pressure from an expanding radio jet. For 3C 273 we do not detect any [O III] emission beyond 23 kpc at our surface brightness detection limit of at level per 02 pixel. This suggests that 3C 273 has not been subject to a gas rich merger very recently and the expanding radio jet has not expelled gas beyond the 20 kpc scale.
The sizes of outflows have been measured by defining a kinematically disturbed region (KDR) either based on a fixed cut in line width, (Sun et al., 2017), or in relation to the stellar velocity dispersion, (Kang & Woo, 2018). For 3C 273 we measure , which is close to the expected value of 250 from the – relation (Kormendy & Ho, 2013) adopting (Kaspi et al., 2000), so that both KDR definitions are comparable. Indeed, previous measurements reveal a tight relation between and as shown in Fig. 4. For 3C 273 we measure kpc, adopting , significantly smaller than the extrapolated relations proposed by Sun et al. (2017), but close to that of Kang & Woo (2018). Interestingly, the relation by Sun et al. (2017) for predicts larger sizes than the at the high-luminosity end. As discussed in Husemann et al. (2016) it is possible that beam smearing leads to a systematic over-prediction of KDR sizes. This effect is minimized for 3C 273 due to the high physical resolution and application of the AGN-host deblending.
3.2 Wind-driven density wave due to expanding jet?
Interactions of jets with the ambient medium have been extensively studied in a wide variety of jet properties from compact to extended system (e.g. Tadhunter et al., 1989, 2000; O’Dea et al., 2002; Holt et al., 2008; Morganti et al., 2013; Mahony et al., 2016; Villar-Martín et al., 2017; Tremblay et al., 2018; Jarvis et al., 2019; Kolwa et al., 2019). In the vast majority of these cases, the most extreme gas motions have been associated with the head of the jets as they push through the ambient gas leaving turbulent gas behind their way. The impact of those outflows have been proposed to either suppress star formation (negative feedback) or even promote star formation (positive feedback). In the first case, the outflow is assumed to disrupt dense cold gas in the host galaxies and drag it outside the host so that less cold gas is able to form stars (e.g. Nesvadba et al., 2006; Schawinski et al., 2009; Fabian, 2012). In the second case, a density wave caused by the expanding shock front may allow to rapidly form molecular gas through enhanced cooling in a compressed dense gas phase. The second process has mainly been theoretically predicted (Silk, 2005; Gaibler et al., 2012; Ishibashi & Fabian, 2012; Zubovas et al., 2013), but some observational evidence for enhancement in star formation has been observed in the filament of Centaurus A (Crockett et al., 2012), in companion galaxies impacted by jets (e.g. Croft et al., 2006; Molnár et al., 2017), and nearby galaxies with strong outflows (e.g. Cresci et al., 2015; Maiolino et al., 2017).
3C 273 hosts a powerful jet and a bright optical nucleus, so that enough energy is released to provide strong feedback on the ambient gas. Given that there is no ionized gas detected on large scales associated with the head of the jet suggests that the jet axis is not going directly through the gas disk in the host galaxy. Still, there is a clear alignment of the kinematically disturbed ionized gas on kpc scales. Here, we refrain from computing gas outflow energetics to distinguish between a mechanically or radiatively-driven outflow, because neither the electron densities nor the actual velocities of individual clouds can be robustly measured with our current data. However, the well-constrained jet axis about away from our line-of-sight (e.g. Stawarz, 2004) helps us drawing a potential scenario for the evolution of the outflow. The jet axis provides an independent estimate of the 3D orientation of the primary AGN ionization cone axis which can otherwise be estimated from the ENLR morphology and kinematics (e.g. Fischer et al., 2013).
Surprisingly, we see preferentially receding gas motion on the approaching jet side and approaching gas motions on the opposite side. This is inconsistent with a purely radiatively-driven outflow which should lead to a radial gas acceleration if the ionization cone is roughly aligned with the jet axis. However, the expanding cocoon around the radio jet will lead to shocks propagating in all directions and create turbulent and bulk motion in the surrounding interstellar medium as it expands with time. Due to the inclination of the gas disk, the expanding jet-driven hot gas cocoon will accelerate the gas in transverse or even back-flow motion. Indeed, the presence of molecular gas with an arc-like structure just outside the kinematically disturbed region of the outflow may be interpreted as the consequence of a gas density wave generated by the expanding shock perpendicular to the jet. While the molecular gas may also be bound to the remnant of an infalling galaxy, we do not see such a well-defined structure in the ionized gas phase. The jet axis breaks the symmetry and exactly goes through the center of the molecular arc as shown in Fig. 1 panel (e) which is unlikely to be a pure coincidence. The motion of the cold gas is not too much affected by the outflow yet and predominantly traces the ordered gravitational motion like the kinematically quiescent ionized gas at the same location. Hence, we can estimate the inclination of the undisturbed rotation-dominated gas disk by comparing the dynamical mass with the expected enclosed mass. The stellar mass of 3C 273 is roughly according to the – relation of Häring & Rix (2004). This leads to an intrinsic rotational velocity of at 8 kpc distance whereas the observed maximum radial velocity in the ionized and cold gas phase is about . This implies an inclination of 20∘ of the gas disk.
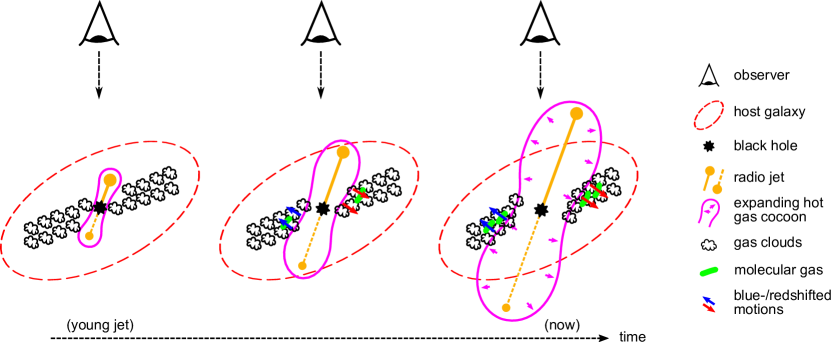
Our proposed scenario is illustrated as a cartoon in Fig. 5. As the jet has expanded close to the speed of light for yr in 3C 273 (Stawarz, 2004), it has already reached beyond the galaxy and is not directly interacting with the gas anymore. However, the continuously expanding cocoon of the jet still affects the gas disk and pushes it in the transverse direction over time. Those transverse and backflow motions from the expanding cocoon have been observed in hydro-dynamical simulations of expanding jets in a dense gas medium (Mukherjee et al., 2018). This transverse motion and shock-front generates a symmetric density wave in the pre-shock phase which allows formation of a significant reservoir of cold molecular gas through enhanced cooling. While a counter jet was recently detected in 3C 273 (Punsly & Kharb, 2016) and may also explain the disturbed kinematics on the other side of the AGN, it may be intrinsically less powerful and may fail to produce a shock-front in which molecular gas can form. Since the ionized emission line ratios do not show an enhancement of H with respect to [O III] at the location of the cold gas suggests that the cold gas is not actively forming stars. However, the factor is unknown and diffuse star formation may not be easily recognized due to the surrounding AGN-ionized region. All those measurements highlight the complex interplay between outflows and the multi-phase medium which depends on a lot of parameters.
While the kinematics may also be interpreted as inflow motion, the velocities of the gas clouds of up to 800 are too high to be driven purely by gravity. Nevertheless, the accelerated gas clouds will contribute to the turbulence in the system and likely enhance the inflow of some material towards the nucleus. Such a chaotic inflow of gas may account for the flicker-noise AGN variability which is predicted by the CCA model (Gaspari et al., 2017) and discovered in 3C 273 over a 80 yr light-curve monitoring (Press, 1978). A more detailed model of the ionized gas distribution and kinematics to overcome the current limitations of the seeing limited observations will be performed with future high-resolution observations granted with the new MUSE narrow-field mode.
3.3 Implications for high- AGN observations
It is well known that there is an anti-correlation between the Eddington ratio of an AGN and the strength of the [O III] line in the NLR (e.g. Boroson & Green, 1992; Boroson, 2002; Marziani et al., 2003). Due to selection effects, high Eddington ratios dominate the luminous AGN population at high redshift and it has been proposed that the NLR is disappearing in these AGN (e.g. Netzer et al., 2004). Indeed the ENLR on kpc scales remain undetected preferentially around high Eddington ratio AGN in a sample of luminous AGN at (Husemann et al., 2008). 3C 273 belongs to the high Eddington-ratio regime with (Husemann et al., 2013) and shows a weak [O III] line in the AGN spectrum. The ENLR was indeed reported to be undetected in initial IFU observations of this source (Husemann et al., 2013). We conclude from this work that the high contrast between the luminous AGN and the ENLR has apparently caused previous non-detections. It is simply more difficult to detect the ENLR underneath a beam-smeared point-like AGN signal and requires much higher S/N observations to detect the [O III] line for a given surface brightness limit. Several AGN surveys at high redshift have attempted to detect the ionized gas around AGN such as KASHz (Harrison et al., 2016), WISSH (Bischetti et al., 2017) or SUPER (Circosta et al., 2018). Our MUSE data provide an ideal data set to empirically constrain the distribution, kinematics and surface brightness of the emission lines around an hyper-luminous quasar. It is therefore instructive to simulate observations of 3C 273 at where [O III] is shifted into the band.
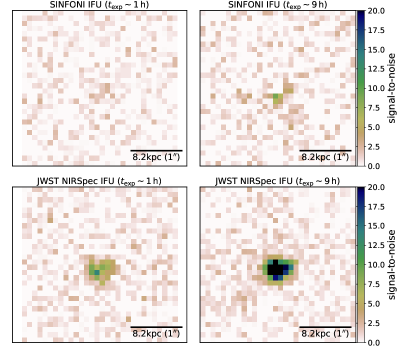
The angular scale at is 8.2 kpc/″ which is nearly a factor of 3 larger compared to the physical resolution at the redshift of 3C 273. In order to observe such a source at the same spatial resolution as provided by the MUSE data for 3C 273, the angular resolution would need to be 3 times better than our seeing (i.e. ). This matches the typical angular resolutions achieved with adaptive optics observations in the band. Furthermore, the spectral resolution of MUSE is almost the same as the one of the SINFONI -band grating or the high-resolution gratings of NIRspec aboard of JWST. Hence, we have to scale the integrated flux of the MUSE cube after redshifting the spectra by
| (1) |
and re-assign the pixel scale from to or for practical reasons to avoid sub-pixel resampling.
We then simulate realistic SINFONI observations at by binning pixels in the MUSE cube, scaling the fluxes according to Eq. 1 and redshifting the spectra. Empirical noise (without sky lines) is added for SINFONI for 1h and 9h of on-source time as directly inferred from real observations with a plate scale and a FoV. We also simulate data for the NIRspec IFU with the same on-source exposure times adopting the noise model of the official ETC (Pontoppidan et al., 2016). In Fig. 6 we show the narrow-band images after subtracting the QSO contribution with qdeblend3D in the same way as for the original MUSE data. Ground-based NIR spectrographs such as SINFONI are hardly able to detect the very brightest inner region of the ENLR even after 9h integration time which may explain the low detection rate of kpc-scale [O III] outflows around optically-bright AGN (Vietri et al., 2018). NIRSpec will be able to recover the brightest part of the ENLR, but likely miss the full ENLR extent. High-redshift QSO studies therefore need to be aware that a much higher S/N is needed to detect the diffuse extended outflows underneath the highly luminous AGN when designing observations.
4 Conclusions and outlook
In this article we presented the morpho-kinematic structure of the ionized and molecular gas around the low-redshift hyper-luminous quasar 3C 273 with VLT-MUSE and ALMA in unprecedented detail. We recover a large ENLR with kpc in size which implies that either the ENLR size-luminosity relation has no break or the break radius is much larger than previously reported. It is possible that CCA plays a relevant role in the formation and properties of 3C 273 ENLR. Within the ENLR, a kinetically disturbed region (KDR) is discovered within the central 6 kpc. This KDR is significantly smaller than predicted by literature scaling relations, which are possibly affected by beam smearing. Most strikingly, the KDR is aligned with the radio axis, but preferentially red-shifted on the approaching and blue-shifted on the receding side of the jet contrary to expectations. We interpret this as a signature for an expanding jet-driven hot gas cocoon where the transverse shock is pushing the gas of an inclined gas disk back on the approaching side and up on receding side. This scenario may also explain the presence and morphology of an intriguing molecular gas arc aligned perpendicular to the jet axis. This feature could be generated by a expanding shock front that leads to a putative density wave where the cooling time is significantly reduced. Whether the molecular gas is forming stars or not is difficult to address with the given MUSE data quality and confusion with the ENLR so that it is unclear whether the molecular gas arc is a long-lived feature or not. Hence, it is unclear if the outflow is leading to positive feedback as predicted for luminous AGN in some theoretical works and simulations.
We also show that current and upcoming near-IR instruments may be highly limited in recovering the morpho-kinematic structure of the ionized gas on galaxy scales around hyper-luminous quasars at due to the combined effect of surface brightness dimming and the overwhelmingly bright nucleus. The new narrow-field mode of MUSE providing resolution at optical wavelengths will allow us to study the ionized gas around 3C 273 and other luminous AGN in the future, while ALMA can provide details of the molecular gas properties and its excitation conditions. Both facilities together will provide an unprecedented view on the interactions of outflows with the surrounding gas to observationally address the issues raised by positive and negative AGN feedback scenarios.
ADS/JAO.ALMA#2015.1.00587.S
ADS/JAO.ALMA#2015.1.01012.S
ADS/JAO.ALMA#2016.1.00972.S
ADS/JAO.ALMA#2016.1.01308.S
ALMA is a partnership of ESO (representing its member states), NSF (USA) and NINS (Japan), together with NRC (Canada) and NSC and ASIAA (Taiwan) and KASI (Republic of Korea), in cooperation with the Republic of Chile. The Joint ALMA Observatory is operated by ESO, AUI/NRAO and NAOJ.
References
- Arrigoni Battaia et al. (2018) Arrigoni Battaia, F., Prochaska, J. X., Hennawi, J. F., et al. 2018, MNRAS, 473, 3907, doi: 10.1093/mnras/stx2465
- Bacon et al. (2010) Bacon, R., Accardo, M., Adjali, L., et al. 2010, SPIE Conf. Ser., 7735, 8, doi: 10.1117/12.856027
- Bacon et al. (2017) Bacon, R., Conseil, S., Mary, D., et al. 2017, A&A, 608, A1, doi: 10.1051/0004-6361/201730833
- Bahcall et al. (1995) Bahcall, J. N., Kirhakos, S., & Schneider, D. P. 1995, ApJ, 450, 486, doi: 10.1086/176159
- Bennert et al. (2002) Bennert, N., Falcke, H., Schulz, H., Wilson, A. S., & Wills, B. J. 2002, ApJ, 574, L105, doi: 10.1086/342420
- Bischetti et al. (2017) Bischetti, M., Piconcelli, E., Vietri, G., et al. 2017, A&A, 598, A122, doi: 10.1051/0004-6361/201629301
- Borisova et al. (2016) Borisova, E., Cantalupo, S., Lilly, S. J., et al. 2016, ApJ, 831, 39, doi: 10.3847/0004-637X/831/1/39
- Boroson (2002) Boroson, T. A. 2002, ApJ, 565, 78, doi: 10.1086/324486
- Boroson & Green (1992) Boroson, T. A., & Green, R. F. 1992, ApJS, 80, 109, doi: 10.1086/191661
- Boroson et al. (1985) Boroson, T. A., Persson, S. E., & Oke, J. B. 1985, ApJ, 293, 120, doi: 10.1086/163219
- Cai et al. (2017) Cai, Z., Fan, X., Yang, Y., et al. 2017, ApJ, 837, 71, doi: 10.3847/1538-4357/aa5d14
- Cantalupo et al. (2014) Cantalupo, S., Arrigoni-Battaia, F., Prochaska, J. X., Hennawi, J. F., & Madau, P. 2014, Nature, 506, 63, doi: 10.1038/nature12898
- Carniani et al. (2015) Carniani, S., Marconi, A., Maiolino, R., et al. 2015, A&A, 580, A102, doi: 10.1051/0004-6361/201526557
- Christensen et al. (2006) Christensen, L., Jahnke, K., Wisotzki, L., & Sánchez, S. F. 2006, A&A, 459, 717, doi: 10.1051/0004-6361:20065318
- Circosta et al. (2018) Circosta, C., Mainieri, V., Padovani, P., et al. 2018, ArXiv e-prints. https://arxiv.org/abs/1809.04858
- Crenshaw & Kraemer (2000) Crenshaw, D. M., & Kraemer, S. B. 2000, ApJ, 532, L101, doi: 10.1086/312581
- Cresci et al. (2015) Cresci, G., Marconi, A., Zibetti, S., et al. 2015, A&A, 582, A63, doi: 10.1051/0004-6361/201526581
- Crockett et al. (2012) Crockett, R. M., Shabala, S. S., Kaviraj, S., et al. 2012, MNRAS, 421, 1603, doi: 10.1111/j.1365-2966.2012.20418.x
- Croft et al. (2006) Croft, S., van Breugel, W., de Vries, W., et al. 2006, ApJ, 647, 1040, doi: 10.1086/505526
- Danziger et al. (1984) Danziger, I. J., Fosbury, R. A. E., Goss, M. W., Bland, J., & Boksenberg, A. 1984, MNRAS, 208, 589, doi: 10.1093/mnras/208.3.589
- Dempsey & Zakamska (2018) Dempsey, R., & Zakamska, N. L. 2018, MNRAS, doi: 10.1093/mnras/sty941
- Downes & Solomon (1998) Downes, D., & Solomon, P. M. 1998, ApJ, 507, 615, doi: 10.1086/306339
- Emonts et al. (2005) Emonts, B. H. C., Morganti, R., Tadhunter, C. N., et al. 2005, MNRAS, 362, 931, doi: 10.1111/j.1365-2966.2005.09354.x
- Fabian (2012) Fabian, A. C. 2012, ARA&A, 50, 455, doi: 10.1146/annurev-astro-081811-125521
- Fischer et al. (2013) Fischer, T. C., Crenshaw, D. M., Kraemer, S. B., & Schmitt, H. R. 2013, ApJS, 209, 1, doi: 10.1088/0067-0049/209/1/1
- Fraquelli et al. (2003) Fraquelli, H. A., Storchi-Bergmann, T., & Levenson, N. A. 2003, MNRAS, 341, 449, doi: 10.1046/j.1365-8711.2003.06397.x
- Fu & Stockton (2007) Fu, H., & Stockton, A. 2007, ApJ, 666, 794, doi: 10.1086/520530
- Gaibler et al. (2012) Gaibler, V., Khochfar, S., Krause, M., & Silk, J. 2012, MNRAS, 425, 438, doi: 10.1111/j.1365-2966.2012.21479.x
- Gaspari et al. (2017) Gaspari, M., Temi, P., & Brighenti, F. 2017, MNRAS, 466, 677, doi: 10.1093/mnras/stw3108
- Gaspari et al. (2018) Gaspari, M., McDonald, M., Hamer, S. L., et al. 2018, ApJ, 854, 167, doi: 10.3847/1538-4357/aaaa1b
- Greene et al. (2011) Greene, J. E., Zakamska, N. L., Ho, L. C., & Barth, A. J. 2011, ApJ, 732, 9, doi: 10.1088/0004-637X/732/1/9
- Greene et al. (2012) Greene, J. E., Zakamska, N. L., & Smith, P. S. 2012, ApJ, 746, 86, doi: 10.1088/0004-637X/746/1/86
- Hainline et al. (2013) Hainline, K. N., Hickox, R., Greene, J. E., Myers, A. D., & Zakamska, N. L. 2013, ApJ, 774, 145, doi: 10.1088/0004-637X/774/2/145
- Hainline et al. (2014) Hainline, K. N., Hickox, R. C., Greene, J. E., et al. 2014, ApJ, 787, 65, doi: 10.1088/0004-637X/787/1/65
- Hamilton et al. (2008) Hamilton, T. S., Casertano, S., & Turnshek, D. A. 2008, ApJ, 678, 22, doi: 10.1086/524182
- Häring & Rix (2004) Häring, N., & Rix, H.-W. 2004, ApJ, 604, L89, doi: 10.1086/383567
- Harrison et al. (2014) Harrison, C. M., Alexander, D. M., Mullaney, J. R., & Swinbank, A. M. 2014, MNRAS, 441, 3306, doi: 10.1093/mnras/stu515
- Harrison et al. (2016) Harrison, C. M., Alexander, D. M., Mullaney, J. R., et al. 2016, MNRAS, 456, 1195, doi: 10.1093/mnras/stv2727
- Heckman et al. (1991) Heckman, T. M., Miley, G. K., Lehnert, M. D., & van Breugel, W. 1991, ApJ, 370, 78, doi: 10.1086/169794
- Hennawi et al. (2015) Hennawi, J. F., Prochaska, J. X., Cantalupo, S., & Arrigoni-Battaia, F. 2015, Science, 348, 779, doi: 10.1126/science.aaa5397
- Hippelein et al. (1996) Hippelein, H., Meisenheimer, K., & Roeser, H. J. 1996, A&A, 316, 29
- Holt et al. (2008) Holt, J., Tadhunter, C. N., & Morganti, R. 2008, MNRAS, 387, 639, doi: 10.1111/j.1365-2966.2008.13089.x
- Husemann et al. (2014) Husemann, B., Jahnke, K., Sánchez, S. F., et al. 2014, MNRAS, 443, 755, doi: 10.1093/mnras/stu1167
- Husemann et al. (2010) Husemann, B., Sánchez, S. F., Wisotzki, L., et al. 2010, A&A, 519, A115+, doi: 10.1051/0004-6361/201014559
- Husemann et al. (2016) Husemann, B., Scharwächter, J., Bennert, V. N., et al. 2016, A&A, 594, A44, doi: 10.1051/0004-6361/201527992
- Husemann et al. (2011) Husemann, B., Wisotzki, L., Jahnke, K., & Sánchez, S. F. 2011, A&A, 535, A72, doi: 10.1051/0004-6361/201117596
- Husemann et al. (2008) Husemann, B., Wisotzki, L., Sánchez, S. F., & Jahnke, K. 2008, A&A, 488, 145, doi: 10.1051/0004-6361:200810276
- Husemann et al. (2013) —. 2013, A&A, 549, A43, doi: 10.1051/0004-6361/201220076
- Husemann et al. (2018) Husemann, B., Worseck, G., Arrigoni Battaia, F., & Shanks, T. 2018, A&A, 610, L7, doi: 10.1051/0004-6361/201732457
- Ishibashi & Fabian (2012) Ishibashi, W., & Fabian, A. C. 2012, MNRAS, 427, 2998, doi: 10.1111/j.1365-2966.2012.22074.x
- Jarvis et al. (2019) Jarvis, M. E., Harrison, C. M., Thomson, A. P., et al. 2019, MNRAS, doi: 10.1093/mnras/stz556
- Kakkad et al. (2016) Kakkad, D., Mainieri, V., Padovani, P., et al. 2016, A&A, 592, A148, doi: 10.1051/0004-6361/201527968
- Kang & Woo (2018) Kang, D., & Woo, J.-H. 2018, ApJ, 864, 124, doi: 10.3847/1538-4357/aad561
- Karouzos et al. (2016) Karouzos, M., Woo, J.-H., & Bae, H.-J. 2016, ApJ, 819, 148, doi: 10.3847/0004-637X/819/2/148
- Kaspi et al. (2000) Kaspi, S., Smith, P. S., Netzer, H., et al. 2000, ApJ, 533, 631, doi: 10.1086/308704
- Kauffmann et al. (2003) Kauffmann, G., Heckman, T. M., Tremonti, C., et al. 2003, MNRAS, 346, 1055, doi: 10.1111/j.1365-2966.2003.07154.x
- Kellermann et al. (1969) Kellermann, K. I., Pauliny-Toth, I. I. K., & Williams, P. J. S. 1969, ApJ, 157, 1, doi: 10.1086/150046
- Kewley et al. (2001) Kewley, L. J., Dopita, M. A., Sutherland, R. S., Heisler, C. A., & Trevena, J. 2001, ApJ, 556, 121, doi: 10.1086/321545
- Kolwa et al. (2019) Kolwa, S., Vernet, J., De Breuck, C., et al. 2019, arXiv e-prints. https://arxiv.org/abs/1904.05114
- Kormendy & Ho (2013) Kormendy, J., & Ho, L. C. 2013, ARA&A, 51, 511, doi: 10.1146/annurev-astro-082708-101811
- Kreimeyer & Veilleux (2013) Kreimeyer, K., & Veilleux, S. 2013, ApJ, 772, L11, doi: 10.1088/2041-8205/772/1/L11
- Liu et al. (2014) Liu, G., Zakamska, N. L., & Greene, J. E. 2014, MNRAS, 442, 1303, doi: 10.1093/mnras/stu974
- Liu et al. (2013a) Liu, G., Zakamska, N. L., Greene, J. E., Nesvadba, N. P. H., & Liu, X. 2013a, MNRAS, 430, 2327, doi: 10.1093/mnras/stt051
- Liu et al. (2013b) —. 2013b, MNRAS, 436, 2576, doi: 10.1093/mnras/stt1755
- Mahony et al. (2016) Mahony, E. K., Oonk, J. B. R., Morganti, R., et al. 2016, MNRAS, 455, 2453, doi: 10.1093/mnras/stv2456
- Maiolino et al. (2017) Maiolino, R., Russell, H. R., Fabian, A. C., et al. 2017, Nature, 544, 202, doi: 10.1038/nature21677
- Martel et al. (2003) Martel, A. R., Ford, H. C., Tran, H. D., et al. 2003, AJ, 125, 2964, doi: 10.1086/375205
- Marziani et al. (2003) Marziani, P., Zamanov, R. K., Sulentic, J. W., & Calvani, M. 2003, MNRAS, 345, 1133, doi: 10.1046/j.1365-2966.2003.07033.x
- McCarthy (1993) McCarthy, P. J. 1993, ARA&A, 31, 639, doi: 10.1146/annurev.aa.31.090193.003231
- McElroy et al. (2015) McElroy, R., Croom, S. M., Pracy, M., et al. 2015, MNRAS, 446, 2186, doi: 10.1093/mnras/stu2224
- Molnár et al. (2017) Molnár, D. C., Sargent, M. T., Elbaz, D., Papadopoulos, P. P., & Silk, J. 2017, MNRAS, 467, 586, doi: 10.1093/mnras/stx089
- Morganti et al. (2013) Morganti, R., Frieswijk, W., Oonk, R. J. B., Oosterloo, T., & Tadhunter, C. 2013, A&A, 552, L4, doi: 10.1051/0004-6361/201220734
- Mukherjee et al. (2018) Mukherjee, D., Bicknell, G. V., Wagner, A. Y., Sutherland, R. S., & Silk, J. 2018, MNRAS, 479, 5544, doi: 10.1093/mnras/sty1776
- Nesvadba et al. (2017) Nesvadba, N. P. H., De Breuck, C., Lehnert, M. D., Best, P. N., & Collet, C. 2017, A&A, 599, A123, doi: 10.1051/0004-6361/201528040
- Nesvadba et al. (2006) Nesvadba, N. P. H., Lehnert, M. D., Eisenhauer, F., et al. 2006, ApJ, 650, 693, doi: 10.1086/507266
- Netzer et al. (2004) Netzer, H., Shemmer, O., Maiolino, R., et al. 2004, ApJ, 614, 558, doi: 10.1086/423608
- North et al. (2012) North, P. L., Courbin, F., Eigenbrod, A., & Chelouche, D. 2012, A&A, 542, A91, doi: 10.1051/0004-6361/201015153
- O’Dea et al. (2002) O’Dea, C. P., de Vries, W. H., Koekemoer, A. M., et al. 2002, AJ, 123, 2333, doi: 10.1086/340076
- Pedlar et al. (1990) Pedlar, A., Ghataure, H. S., Davies, R. D., et al. 1990, MNRAS, 246, 477
- Pennell et al. (2017) Pennell, A., Runnoe, J. C., & Brotherton, M. S. 2017, MNRAS, 468, 1433, doi: 10.1093/mnras/stx556
- Perley & Meisenheimer (2017) Perley, R. A., & Meisenheimer, K. 2017, A&A, 601, A35, doi: 10.1051/0004-6361/201629704
- Pontoppidan et al. (2016) Pontoppidan, K. M., Pickering, T. E., Laidler, V. G., et al. 2016, in Proc. SPIE, Vol. 9910, Observatory Operations: Strategies, Processes, and Systems VI, 991016
- Press (1978) Press, W. H. 1978, Comments on Astrophysics, 7, 103
- Prieto et al. (1993) Prieto, M. A., Walsh, J. R., Fosbury, R. A. E., & di Serego Alighieri, S. 1993, MNRAS, 263, 10, doi: 10.1093/mnras/263.1.10
- Punsly & Kharb (2016) Punsly, B., & Kharb, P. 2016, ApJ, 833, 57, doi: 10.3847/1538-4357/833/1/57
- Riffel & Storchi-Bergmann (2011) Riffel, R. A., & Storchi-Bergmann, T. 2011, MNRAS, 417, 2752, doi: 10.1111/j.1365-2966.2011.19441.x
- Runnoe et al. (2012) Runnoe, J. C., Brotherton, M. S., & Shang, Z. 2012, MNRAS, 426, 2677, doi: 10.1111/j.1365-2966.2012.21644.x
- Salpeter (1964) Salpeter, E. E. 1964, ApJ, 140, 796, doi: 10.1086/147973
- Santoro et al. (2018) Santoro, F., Rose, M., Morganti, R., et al. 2018, A&A, 617, A139, doi: 10.1051/0004-6361/201833248
- Schawinski et al. (2009) Schawinski, K., Virani, S., Simmons, B., et al. 2009, ApJ, 692, L19, doi: 10.1088/0004-637X/692/1/L19
- Schmidt (1963) Schmidt, M. 1963, Nature, 197, 1040, doi: 10.1038/1971040a0
- Scoville et al. (2003) Scoville, N. Z., Frayer, D. T., Schinnerer, E., & Christopher, M. 2003, ApJ, 585, L105, doi: 10.1086/374544
- Shirazi & Brinchmann (2012) Shirazi, M., & Brinchmann, J. 2012, MNRAS, 421, 1043, doi: 10.1111/j.1365-2966.2012.20439.x
- Shopbell et al. (1999) Shopbell, P. L., Veilleux, S., & Bland-Hawthorn, J. 1999, ApJ, 524, L83, doi: 10.1086/312311
- Silk (2005) Silk, J. 2005, MNRAS, 364, 1337, doi: 10.1111/j.1365-2966.2005.09672.x
- Silk & Rees (1998) Silk, J., & Rees, M. J. 1998, A&A, 331, L1
- Stasińska et al. (2008) Stasińska, G., Vale Asari, N., Cid Fernandes, R., et al. 2008, MNRAS, 391, L29, doi: 10.1111/j.1745-3933.2008.00550.x
- Stawarz (2004) Stawarz, Ł. 2004, ApJ, 613, 119, doi: 10.1086/423022
- Stockton & MacKenty (1983) Stockton, A., & MacKenty, J. W. 1983, Nature, 305, 678, doi: 10.1038/305678a0
- Stockton & MacKenty (1987) —. 1987, ApJ, 316, 584, doi: 10.1086/165227
- Stockton et al. (2002) Stockton, A., MacKenty, J. W., Hu, E. M., & Kim, T.-S. 2002, ApJ, 572, 735, doi: 10.1086/340432
- Storchi-Bergmann et al. (1992) Storchi-Bergmann, T., Wilson, A. S., & Baldwin, J. A. 1992, ApJ, 396, 45, doi: 10.1086/171696
- Storchi-Bergmann et al. (2018) Storchi-Bergmann, T., Dall’Agnol de Oliveira, B., Longo Micchi, L. F., et al. 2018, ApJ, 868, 14, doi: 10.3847/1538-4357/aae7cd
- Sun et al. (2017) Sun, A.-L., Greene, J. E., & Zakamska, N. L. 2017, ApJ, 835, 222, doi: 10.3847/1538-4357/835/2/222
- Sun et al. (2018) Sun, A.-L., Greene, J. E., Zakamska, N. L., et al. 2018, MNRAS, 480, 2302, doi: 10.1093/mnras/sty1394
- Tadhunter et al. (1989) Tadhunter, C. N., Fosbury, R. A. E., & Quinn, P. J. 1989, MNRAS, 240, 225
- Tadhunter et al. (2000) Tadhunter, C. N., Villar-Martin, M., Morganti, R., Bland-Hawthorn, J., & Axon, D. 2000, MNRAS, 314, 849, doi: 10.1046/j.1365-8711.2000.03416.x
- Tremblay et al. (2018) Tremblay, G. R., Combes, F., Oonk, J. B. R., et al. 2018, ApJ, 865, 13, doi: 10.3847/1538-4357/aad6dd
- Valdes et al. (2004) Valdes, F., Gupta, R., Rose, J. A., Singh, H. P., & Bell, D. J. 2004, ApJS, 152, 251, doi: 10.1086/386343
- van Breugel et al. (1985) van Breugel, W., Miley, G., Heckman, T., Butcher, H., & Bridle, A. 1985, ApJ, 290, 496, doi: 10.1086/163007
- Venturi et al. (2018) Venturi, G., Nardini, E., Marconi, A., et al. 2018, A&A, 619, A74, doi: 10.1051/0004-6361/201833668
- Vietri et al. (2018) Vietri, G., Piconcelli, E., Bischetti, M., et al. 2018, A&A, 617, A81, doi: 10.1051/0004-6361/201732335
- Villar-Martín et al. (2018) Villar-Martín, M., Cabrera-Lavers, A., Humphrey, A., et al. 2018, MNRAS, 474, 2302, doi: 10.1093/mnras/stx2911
- Villar-Martín et al. (2005) Villar-Martín, M., Tadhunter, C., Morganti, R., & Holt, J. 2005, MNRAS, 359, L5, doi: 10.1111/j.1745-3933.2005.00022.x
- Villar-Martín et al. (2010) Villar-Martín, M., Tadhunter, C., Pérez, E., et al. 2010, MNRAS, 407, L6, doi: 10.1111/j.1745-3933.2010.00890.x
- Villar-Martín et al. (2017) Villar-Martín, M., Emonts, B., Cabrera Lavers, A., et al. 2017, MNRAS, 472, 4659, doi: 10.1093/mnras/stx2209
- Walcher et al. (2015) Walcher, C. J., Coelho, P. R. T., Gallazzi, A., et al. 2015, A&A, 582, A46, doi: 10.1051/0004-6361/201525924
- Weaver et al. (2018) Weaver, J., Husemann, B., Kuntschner, H., et al. 2018, A&A, 614, A32, doi: 10.1051/0004-6361/201732448
- Weilbacher et al. (2014) Weilbacher, P. M., Streicher, O., Urrutia, T., et al. 2014, in Astronomical Society of the Pacific Conference Series, Vol. 485, Astronomical Data Analysis Software and Systems XXIII, ed. N. Manset & P. Forshay, 451
- Wyckoff et al. (1980) Wyckoff, S., Gehren, T., Morton, D. C., et al. 1980, ApJ, 242, L59, doi: 10.1086/183403
- Xia et al. (2012) Xia, X. Y., Gao, Y., Hao, C.-N., et al. 2012, ApJ, 750, 92, doi: 10.1088/0004-637X/750/2/92
- Zubovas et al. (2013) Zubovas, K., Nayakshin, S., King, A., & Wilkinson, M. 2013, MNRAS, 433, 3079, doi: 10.1093/mnras/stt952