The Close AGN Reference Survey (CARS):
The [C ii]158m line is one of the strongest far-infrared (FIR) lines and an important coolant in the interstellar medium of galaxies that is accessible out to high redshifts. The excitation of [C ii] is complex and can best be studied in detail at low redshifts. Here we report the discovery of the highest global [C ii] excess with respect to the FIR luminosity in the nearby AGN host galaxy HE 13531917. This galaxy is exceptional among a sample of five targets because the AGN ionization cone and radio jet directly intercept the cold galactic disk. As a consequence, a massive multiphase gas outflow on kiloparsec scales is embedded in an extended narrow-line region. Because HE 13531917 is distinguished by these special properties from our four bright AGN, we propose that a global [C ii] excess in AGN host galaxies could be a direct signature of a multiphase AGN-driven outflow with a high mass-loading factor.
Key Words.:
Galaxies: Seyfert; Galaxies: star formation; ISM: jets and outflows; infrared: ISM1 Introduction

The [C ii] 157.74 m emission line arises from the fine-structure transition 2PP1/2 of the ground state of singly ionized carbon C+ (ionization potential of 11.2 eV). Working as a coolant in multiple phases of the interstellar medium (ISM), the [C ii] line is one of the brightest emission lines in the far-infrared (FIR); it contributes 0.1–0.3 % to the FIR luminosity.
The [C ii] line has been calibrated as a probe for the cold gas content and associated star formation rates (SFR) in galaxies (Stacey et al. 1991; Boselli et al. 2002; Herrera-Camus et al. 2015). However, using the [C ii] line as an SFR tracer is complex because of the multiple mixed excitation mechanisms of the line. In local star-forming galaxies, 66–82 % of [C ii] arises from the neutral gas of photodissociation regions (PDRs), and the rest comes from the ionized phase (Croxall et al. 2017). The mechanism of dust infrared emission, on the other hand, is rather simple: dust preferentially absorbs UV radiation from the stellar population and therefore is sensitive to the bright young stars. The infrared luminosity has been well calibrated as an SFR tracer at SFR 1 (Hirashita et al. 2003; Murphy et al. 2011) so that the [C ii] and FIR luminosity are expected to be correlated.
At the highest SFRs, luminous and ultra-luminous infrared galaxies (U/LIRGs) exhibit the so-called [C ii] line deficit (Helou et al. 2001; Malhotra et al. 2001; Luhman et al. 2003), where [C ii] becomes unreliable as an SFR indicator (Díaz-Santos et al. 2013). The origin of the line deficit is still debated and is directly connected to physical processes that are crucial for understanding the [C ii] excitation mechanisms.
Active galactic nuclei (AGN) are able to affect the [C ii]/FIR ratio in several ways: they can increase the infrared luminosity through dust heating (Herrera-Camus et al. 2018a); act as an additional source of the [C ii] excitation; or suppresses the [C ii] line through the overionization of C+ to C with their hard radiation field (Langer & Pineda 2015). Herschel surveys of nearby galaxies such as KINGFISH (Smith et al. 2017) and SHINING (Herrera-Camus et al. 2018b) found no link between the [C ii] line emission and AGN luminosity, but these AGN may be not luminous enough to outshine the star formation.
Given its brightness, the [C ii] line is the most important ISM diagnostic at high redshifts that can be observed with unprecedented spatial resolution and depth on submillimeter interferometers. The sample of the observed high-redshift objects includes starburst and AGN-dominated systems, with the [C ii]/FIR ratios spanning a wide range from 0.02 % to 5 % (e.g., Gullberg et al. 2015; Brisbin et al. 2015; Decarli et al. 2018). In order to provide an interpretation, we need to investigate the [C ii] emission in local galaxies and determine the effect of luminous AGN.
In this letter, we present [C ii] line observations with the Stratospheric Observatory For Infrared Astronomy (SOFIA, Temi et al. 2014) for five nearby (0.024 z 0.040) luminous Seyfert 1 AGN host galaxies from the Close AGN Reference Survey (CARS; Husemann et al. (2017); www.cars-survey.org) to investigate the impact of AGN on the global [C ii] luminosity.
Throughout the paper, we assume a flat cosmological model with km s-1 Mpc-1, , and .
2 Observations and analysis
2.1 SOFIA/FIFI-LS observations
We observed five CARS objects with the Far Infrared Field-Imaging Line Spectrometer (FIFI-LS; Klein et al. (2014)) on board SOFIA. The objects were picked to cover a broad range of SFRs (1–11 ) and avoid the strong atmospheric absorption in the redshifted [C ii] line wavelength region. The SFR estimates were initially based on the predictions calculated from the AGN-subtracted extinction-corrected H line from observations obtained with the Mulit-Unit Spectroscopic Explorer (MUSE, Bacon et al. 2010, section 2.2). The properties of the observed galaxies are listed in Table 1.
The observations were performed during SOFIA Cycle 4 (plan ID , PI: Husemann) and Cycle 5 (plan ID , PI: Husemann). FIFI-LS is a double-beam spectrometer that covers in the red channel (105–200 m) and in the blue channel (50–125 m), split up into spatial pixels. We tuned the setups to cover the [C ii] line in the red channel with spectral resolution of R (250 km s-1) and either [O iii] 88 m or [O i] 63 m in the blue channel, depending on atmospheric transmission.
The pipeline-processed data are provided by the FIFI-LS team. We used LEVEL_3 science-ready data, which consist of a number of 30 second exposures, to apply an additional selection (see Appendix A for details) and background subtraction, and constructed data cubes with sampling using the Drizzle algorithm (Fruchter & Hook 1997). To derive total [C ii] line fluxes from the FIFI-LS cubes, we summed the spectra within an aperture with diameter and fit the line shape with Gaussian profiles. The HE 11082813 and HE 22113903 spectra are well modeled by a single-Gaussian component, while the spectra of HE 04331028, HE 10291831 and HE 13531917 require two Gaussian components. The spectra and the fitting results together with the excluded wavelength ranges due to the strong atmospheric absorption regions111Based on the ATRAN tool by Steve Lord, https://atran.arc.nasa.gov/cgi-bin/atran/atran.cgi are shown in Fig. 1. In addition, we have analyzed the blue channel FIFI-LS data for HE 13531917 to estimate the upper limit of the [O iii] 88 m emission line flux . The [C ii] best-fit shape was used in the [O iii] upper limit estimation, taking into account the spectral resolution of R (450 km s-1) for the observed wavelengths.
2.2 VLT/MUSE observations
All five CARS targets were observed with MUSE at the Very Large Telescope (VLT) under ESO programs 094.B-0345(A) and 095.B-0015(A). The MUSE data cover FoV at a spatial sampling and a wavelength coverage of 4650–9300 Å with . Integration times range from 400 s–900 s split up into two or three exposures, which are rotated by against each other for cosmic-ray rejection and better image cosmetics. The data were reduced with the standard MUSE pipeline (version 1.6.0, Weilbacher et al. 2012, 2014).
As a first step in the post-processing, we subtracted the bright point-like AGN emission from the reconstructed datacube using QDeblend3D, as described in Husemann et al. (2013, 2014, 2019). Afterward we modeled the stellar continuum and ISM emission lines in the AGN-subtracted datacube with PyParadise (see Husemann et al. 2016; Weaver et al. 2018, for details).
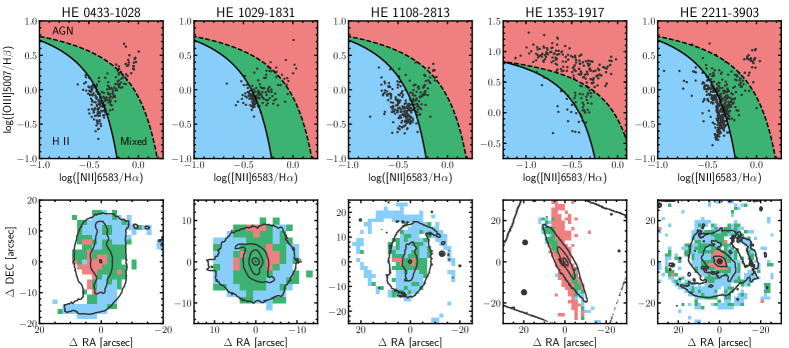
In Fig. 2 we show the classical Baldwin-Philips-Terlevich (BPT, Baldwin et al. 1981) diagrams and corresponding spatial maps for the targeted galaxies after binning 88 pixels. Essentially, the BPT diagnostic diagrams highlight different dominating ionization mechanisms. The face-on galaxies display line ratios that are mainly consistent with star formation or intermediate line ratios between star formation and AGN excitation. The edge-on galaxy HE 13531917 is instead dominated by AGN photoionization. The fraction of AGN excitation to the extinction-corrected H for HE 13531917 is 80%, whereas a fraction of 40% is found for all face-on galaxies.
| Object | DL | F | FFIR∗*∗*Integrated over 42.5–122.5 m |
|---|---|---|---|
| [Mpc] | [erg/s/cm2] | [erg/s/cm2] | |
| HE 04331028 | 156.4 | ||
| HE 10291831 | 177.7 | ||
| HE 11082813 | 104.7 | ||
| HE 13531917 | 154.0 | ||
| HE 22113903 | 175.2 |
2.3 SED fitting and FIR luminosities
We constructed spectral energy distributions (SEDs) for all targets using publicly available broad-band photometry from the following catalogs: the Herschel/SPIRE Point Source Catalogue (Schulz et al. 2017), the AKARI/FIS Bright Source Catalogue (Yamamura et al. 2009), the 2MASS Extended Source Catalog (Jarrett et al. 2000), and the GALEX Source Catalog (Bianchi et al. 2017). For the following datasets we applied aperture measurements on the survey images: Herschel/PACS images from the Herschel Science Archive222HSA, http://archives.esac.esa.int/hsa/whsa/, WISE Image Atlas (Cutri et al. 2011), optical grizy photometric images333available at http://ps1images.stsci.edu from the Pan-STARRS DR1 (Chambers et al. 2016), and Swift/UVOT images from the Barbara A. Mikulski Archive for Space Telescopes444MAST, http://archive.stsci.edu/.
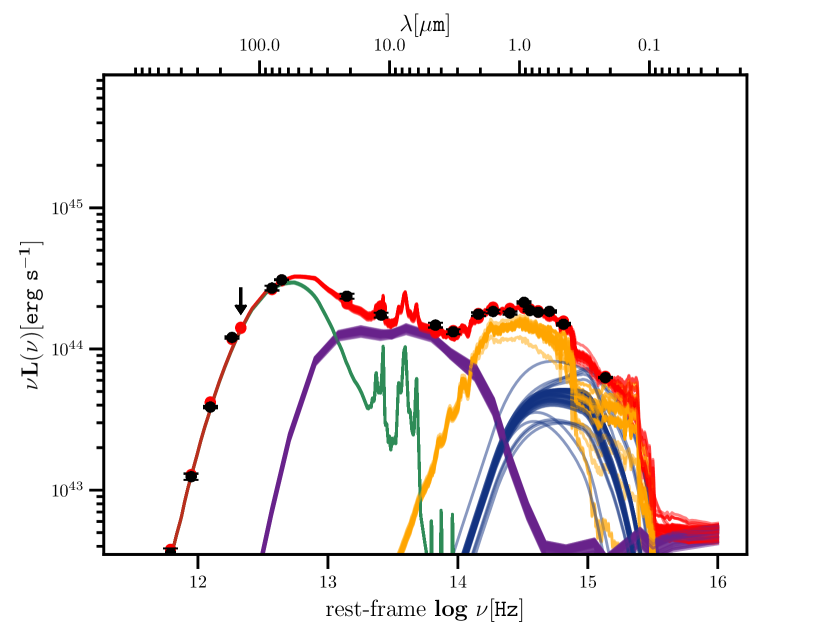
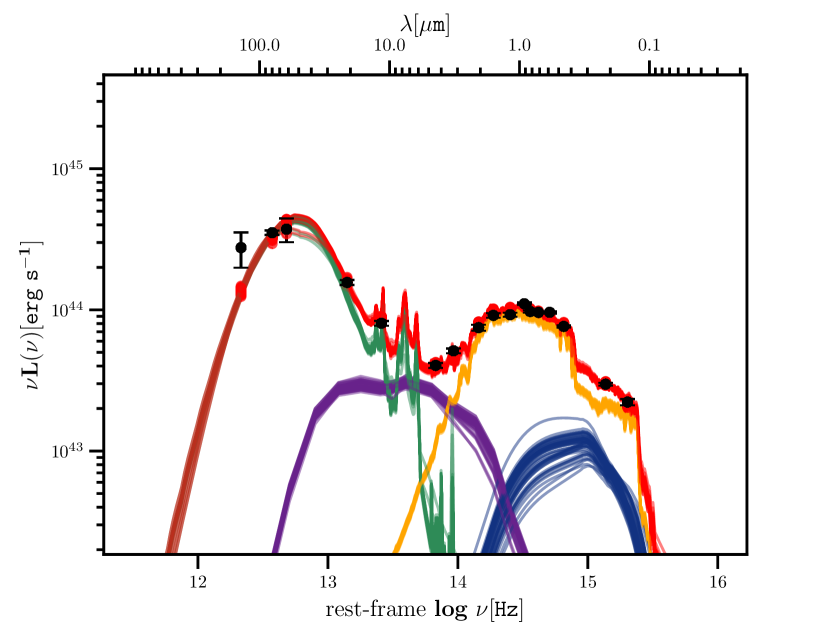
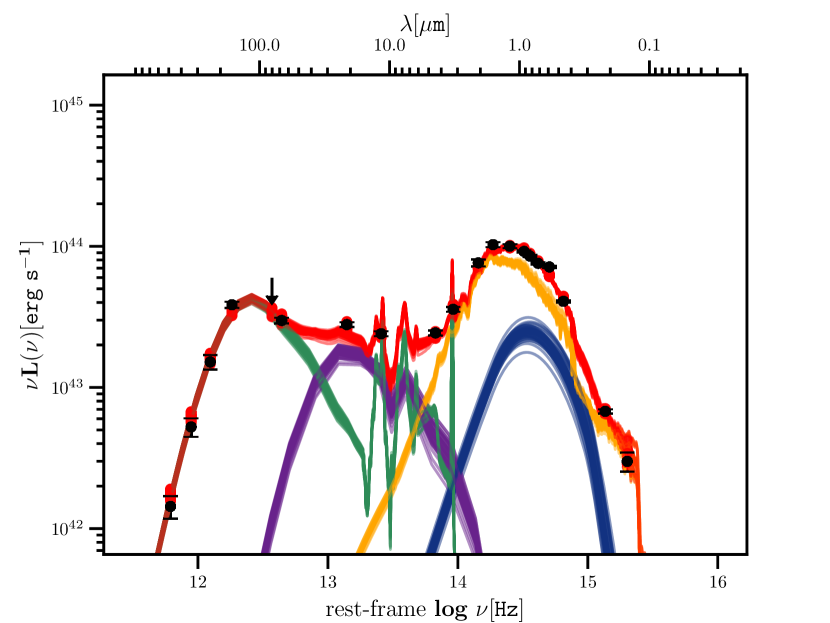
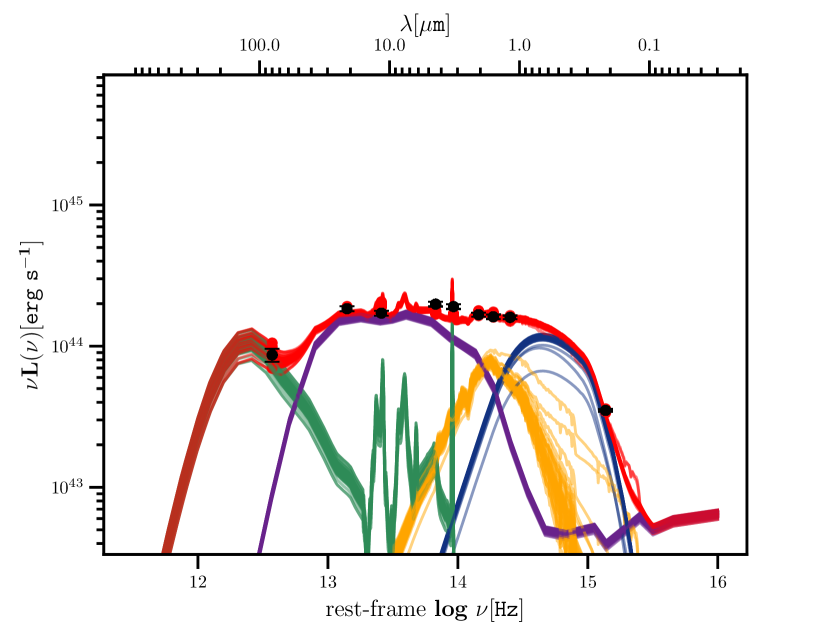
We obtained the FIR (42.5–122.5 m) luminosities through SED fitting with AGNfitter (Calistro Rivera et al. 2016). AGNfitter uses an MCMC approach and various template libraries to model the SED as a super-position of emission from an AGN accretion disk, a torus of AGN-heated dust, stellar light from the galaxies, and cold dust in star-forming regions. The AGNfitter output SED models are shown in Appendix B and the FIR (42.5–122.5 m) luminosities are listed in the Table 1.
3 Results and discussion
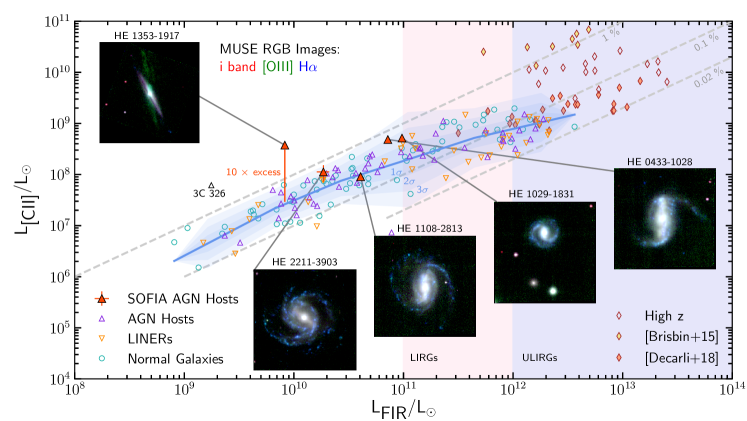
The [C ii] and FIR luminosities of our five targets are shown in Fig. 3 in comparison to a large literature compilation of low-redshift galaxies from Herrera-Camus et al. (2018a). Four of the CARS targets lie within the 3 region of the mean relation, while HE 13531917 lies above the relation with more than 7 significance. The outlier has the strongest deviation from the mean trend observed so far at low redshift, with an unprecedented global [C ii] line excess of an order of magnitude. AGN hosts and LINERs tend to be below the relation in the (U)LIRG regime L and more likely show [C ii] line deficits.
Based on the FIR and AGN-subtracted extinction-corrected H luminosity, we expected HE 13531917 to be the faintest target in [C ii], but it turned out to be the brightest source of our sample. While all galaxies have similar metallicities, stellar masses, and AGN bolometric luminosities, the obvious dissimilarity is the edge-on orientation of HE 13531917. When we consider the unobscured nature of this AGN, this means that the AGN ionization cone directly pierces the gas-rich disk of the galaxy. This leads to a large biconical extended narrow-line region (ENLR) that is oriented almost along the disk axis on kiloparsec scales, as clearly shown in Fig. 2. In addition, a massive multiphase outflow on kiloparsec scales with a mass outflow rate of 10–100 is detected in this galaxy, as discussed in detail by Husemann et al. (2019), while less prominent outflows are detected in the other four galaxies (Singha et al. in prep.). The global SFR of 2 implies an integrated mass-loading factor of 10 or more that has a similar scale as the observed [C ii] excess.
Several powering sources may contribute to the [C ii] line excess in HE 13531917, but the challenge is to distinguish the dominant [C ii] line excitation mechanism. As highlighted in Fig. 3, the [C ii] line luminosity of HE 13531917 cannot be powered by the star formation alone. The SFRs calculated from the extinction-corrected H ( ) and 42.5–122.5 m luminosity ( ) can account for only about 25% of the observed [C ii] line luminosity (SFR, Herrera-Camus et al. 2015). X-ray dominated regions (XDRs) produced by the hard X-ray photons from an AGN may contribute and even dominate the PDR [C ii] emission. From the scaling relation L L by Stacey et al. (2010), we estimate an XDR contribution of only given an X-ray luminosity of L (Husemann et al. 2019).
[C ii] emission can originate in any gas phase that is illuminated by UV photons. Using other line and continuum diagnostics, we can obtain some idea of which phases contribute to the [C ii] emission, for example, 66–82 % for the neutral phase and the rest for the ionized phase in local star-forming galaxies (Croxall et al. 2017). However, these fractions do not necessarily remain the same in the ENLR of an AGN. How much of the [C ii] emission originates from an ENLR has not been systematically explored so far. If the ionized gas phase produces more than 20–40 % of [C ii] as in PDR paradigm, then it can explain the observed [C ii] excess. In HE 13531917 only 20 % of H originates from star-forming regions and 80 % comes from the AGN-ionized regions. If we naively assume that 20 % of the [C ii] flux originates from star formation, the [C ii]SF of HE 13531917 falls within 3 of the [C ii]–FIR relation.
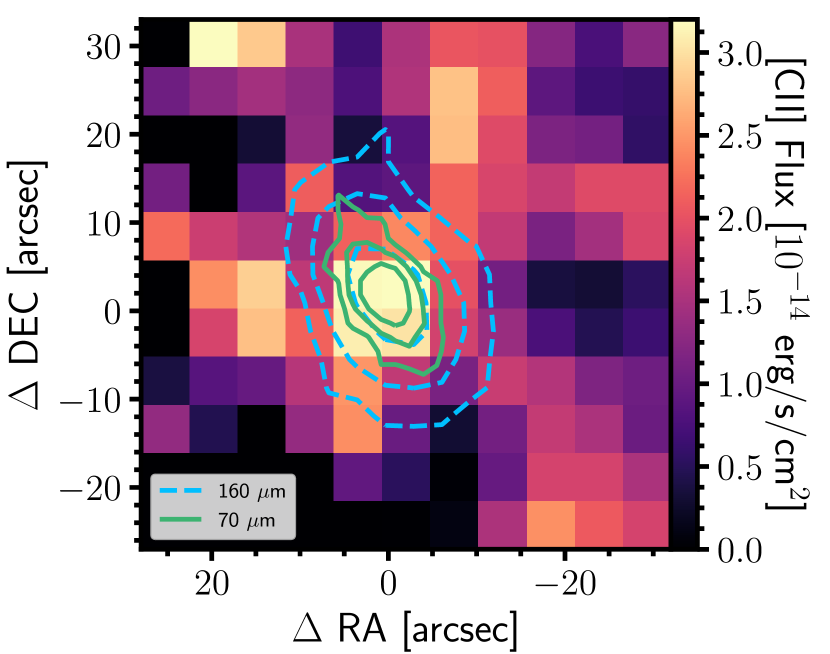
Dissipation of the kinetic energy of shocks and outflows can also have important consequences on the [C ii] emission, as theoretically explored by Lesaffre et al. (2013). [C ii]/FIR ratios of 3–7% are detected in between merging galaxies (Appleton et al. 2013; Peterson et al. 2018) and locally within galaxies (Appleton et al. 2018). On the global scale, the radio galaxy 3C 326 emits around of FIR in [C ii] line for which jet-driven turbulence is likely responsible (Guillard et al. 2015). Nesvadba et al. (2010) estimated an outflow rate in 3C 326 of 35 M, compared to the SFR0.1 (Ogle et al. 2007), brings a mass-loading factor of 10 similar to that found in HE 13531917. HE 13531917 has a global [C ii]/FIR ratio of and a radio-jet powering the multiphase gas outflow (Husemann et al. 2019). The [C ii] line width of km s-1 is broader than the CO(1-0) line for cold molecular gas outflow 210 km s-1, but narrower than the ionized gas outflow 1020 km s-1 (see Fig. 1). [C ii] therefore likely traces the interface between the warm and cold gas phase within the outflow. We can relate the region where the [C ii] excess occurs to the center of the galaxy (Fig. 4) where the brightest region of the ENLR and the kpc-scale multi-phase outflow are indeed located. The [O iii] upper limit implies a line ratio limit of [O iii]/[C ii] which suggests that the pure AGN ionization in the ENLR is not the primary cause for the [C ii] excess. Hence, the observations are firm evidence that the [C ii] line excess in HE 13531917 is related to the multiphase outflow initiated by the jet.
High-redshift galaxies span an entire range between [C ii] deficient and normal regimes with [C ii]/FIR ratios from 0.02 % to 5 %. The large scatter in the ratios may be caused by the order-of-magnitude difference in spatial resolutions, for instance, 18′′ for CSO, Brisbin et al. (2015) with average ratio of 1.8 % and 1′′ for ALMA, Decarli et al. (2018) with average ratio of 0.08 %, as low-resolution observations can include a larger fraction of intergalactic [C ii] emission. Several high-redshift QSO have shown a [C ii] enhancement (Maiolino et al. 2009; Wagg et al. 2010), which was interpreted as due to a low metallicity given the high [C ii]/FIR and [C ii]/CO() ratios in local dwarf galaxies. We measured [C ii]/FIR and [C ii]/CO() for HE 13531917, which can neither be explained by intergalactic [C ii] emission nor by a low metallicity.
4 Conclusion
We presented the discovery of a global [C ii] line excess in one out of five AGN host galaxies. Based on ancillary information from an extensive multiwavelength analysis of this galaxy as part of the CARS survey, we can directly connect the [C ii] line excess in HE 13531917 to the impact of the AGN that drives a massive multiphase outflow on kiloparsec scales embedded in an ENLR (Husemann et al. 2019). The detection of such a global [C ii] excess in AGN host galaxies is of crucial importance for the interpretation of [C ii] line observations and the detection of massive gas outflows in luminous high-redshift AGN host galaxies. Given the evidence of HE 13531917 and the similar outflow seen in 3C 326, we propose that a significant [C ii] line excess in luminous AGN, if detected, can be used as an inference for a multiphase AGN outflow with a high mass-loading factor even at high redshifts.
Acknowledgements.
We thank the anonymous referee for helpful comments that improved the quality of the manuscript. Based on observations made with the NASA/DLR Stratospheric Observatory for Infrared Astronomy (SOFIA). SOFIA is jointly operated by the Universities Space Research Association, Inc. (USRA), under NASA contract NNA17BF53C, and the Deutsches SOFIA Institut (DSI) under DLR contract 50 OK 0901 to the University of Stuttgart. Based on observations collected at the European Organization for Astronomical Research in the Southern Hemisphere under ESO programme 094.B-0345(A) and 095.B-0015(A). M.G. is supported by the Lyman Spitzer Jr. Fellowship (Princeton University) and by NASA Chandra GO7-18121X and GO8-19104X. MPT acknowledges support from the Spanish MINECO through grant AYA2015-63939-C2-1-P.References
- Appleton et al. (2018) Appleton, P. N., Diaz-Santos, T., Fadda, D., et al. 2018, ApJ, 869, 61
- Appleton et al. (2013) Appleton, P. N., Guillard, P., Boulanger, F., et al. 2013, ApJ, 777, 66
- Bacon et al. (2010) Bacon, R., Accardo, M., Adjali, L., et al. 2010, in Proc. SPIE, Vol. 7735, Ground-based and Airborne Instrumentation for Astronomy III, 773508
- Baldwin et al. (1981) Baldwin, J. A., Phillips, M. M., & Terlevich, R. 1981, PASP, 93, 5
- Bianchi et al. (2017) Bianchi, L., Shiao, B., & Thilker, D. 2017, ApJS, 230, 24
- Boselli et al. (2002) Boselli, A., Gavazzi, G., Lequeux, J., & Pierini, D. 2002, A&A, 385, 454
- Brisbin et al. (2015) Brisbin, D., Ferkinhoff, C., Nikola, T., et al. 2015, ApJ, 799, 13
- Calistro Rivera et al. (2016) Calistro Rivera, G., Lusso, E., Hennawi, J. F., & Hogg, D. W. 2016, ApJ, 833, 98
- Chambers et al. (2016) Chambers, K. C., Magnier, E. A., Metcalfe, N., et al. 2016, arXiv:1612.05560
- Croxall et al. (2017) Croxall, K. V., Smith, J. D., Pellegrini, E., et al. 2017, ApJ, 845, 96
- Cutri et al. (2011) Cutri, R. M., Wright, E. L., Conrow, T., et al. 2011, Explanatory Supplement to the WISE Preliminary Data Release Products, Tech. rep.
- Decarli et al. (2018) Decarli, R., Walter, F., Venemans, B. P., et al. 2018, ApJ, 854, 97
- Díaz-Santos et al. (2013) Díaz-Santos, T., Armus, L., Charmandaris, V., et al. 2013, ApJ, 774, 68
- Fruchter & Hook (1997) Fruchter, A. & Hook, R. N. 1997, in Proc. SPIE, Vol. 3164, Applications of Digital Image Processing XX, ed. A. G. Tescher, 120–125
- Guillard et al. (2015) Guillard, P., Boulanger, F., Lehnert, M. D., et al. 2015, A&A, 574, A32
- Gullberg et al. (2015) Gullberg, B., De Breuck, C., Vieira, J. D., et al. 2015, MNRAS, 449, 2883
- Helou et al. (2001) Helou, G., Malhotra, S., Hollenbach, D. J., Dale, D. A., & Contursi, A. 2001, ApJ, 548, L73
- Herrera-Camus et al. (2015) Herrera-Camus, R., Bolatto, A. D., Wolfire, M. G., et al. 2015, ApJ, 800, 1
- Herrera-Camus et al. (2018a) Herrera-Camus, R., Sturm, E., Graciá-Carpio, J., et al. 2018a, ApJ, 861, 94
- Herrera-Camus et al. (2018b) Herrera-Camus, R., Sturm, E., Graciá-Carpio, J., et al. 2018b, ApJ, 861, 95
- Hirashita et al. (2003) Hirashita, H., Buat, V., & Inoue, A. K. 2003, A&A, 410, 83
- Husemann et al. (2016) Husemann, B., Bennert, V. N., Scharwächter, J., Woo, J.-H., & Choudhury, O. S. 2016, MNRAS, 455, 1905
- Husemann et al. (2014) Husemann, B., Jahnke, K., Sánchez, S. F., et al. 2014, MNRAS, 443, 755
- Husemann et al. (2019) Husemann, B., Scharwächter, J., Davis, T., et al. 2019, A&A
- Husemann et al. (2017) Husemann, B., Tremblay, G., Davis, T., et al. 2017, The Messenger, 169, 42
- Husemann et al. (2013) Husemann, B., Wisotzki, L., Sánchez, S. F., & Jahnke, K. 2013, A&A, 549, A43
- Jarrett et al. (2000) Jarrett, T. H., Chester, T., Cutri, R., et al. 2000, AJ, 119, 2498
- Kauffmann et al. (2003) Kauffmann, G., Heckman, T. M., Tremonti, C., et al. 2003, MNRAS, 346, 1055
- Kewley et al. (2001) Kewley, L. J., Dopita, M. A., Sutherland, R. S., Heisler, C. A., & Trevena, J. 2001, ApJ, 556, 121
- Klein et al. (2014) Klein, R., Beckmann, S., Bryant, A., et al. 2014, in Proc. SPIE, Vol. 9147, Ground-based and Airborne Instrumentation for Astronomy V, 91472X
- Langer & Pineda (2015) Langer, W. D. & Pineda, J. L. 2015, A&A, 580, A5
- Lesaffre et al. (2013) Lesaffre, P., Pineau des Forêts, G., Godard, B., et al. 2013, A&A, 550, A106
- Luhman et al. (2003) Luhman, M. L., Satyapal, S., Fischer, J., et al. 2003, ApJ, 594, 758
- Maiolino et al. (2009) Maiolino, R., Caselli, P., Nagao, T., et al. 2009, A&A, 500, L1
- Malhotra et al. (2001) Malhotra, S., Kaufman, M. J., Hollenbach, D., et al. 2001, ApJ, 561, 766
- Murphy et al. (2011) Murphy, E. J., Condon, J. J., Schinnerer, E., et al. 2011, ApJ, 737, 67
- Nesvadba et al. (2010) Nesvadba, N. P. H., Boulanger, F., Salomé, P., et al. 2010, A&A, 521, A65
- Ogle et al. (2007) Ogle, P., Antonucci, R., Appleton, P. N., & Whysong, D. 2007, ApJ, 668, 699
- Peterson et al. (2018) Peterson, B. W., Appleton, P. N., Bitsakis, T., et al. 2018, ApJ, 855, 141
- Schulz et al. (2017) Schulz, B., Marton, G., Valtchanov, I., et al. 2017, arXiv [arXiv:1706.00448]
- Smith et al. (2017) Smith, J. D. T., Croxall, K., Draine, B., et al. 2017, ApJ, 834, 5
- Stacey et al. (1991) Stacey, G. J., Geis, N., Genzel, R., et al. 1991, ApJ, 373, 423
- Stacey et al. (2010) Stacey, G. J., Hailey-Dunsheath, S., Ferkinhoff, C., et al. 2010, ApJ, 724, 957
- Temi et al. (2014) Temi, P., Marcum, P. M., Young, E., et al. 2014, ApJS, 212, 24
- Wagg et al. (2010) Wagg, J., Carilli, C. L., Wilner, D. J., et al. 2010, A&A, 519, L1
- Weaver et al. (2018) Weaver, J., Husemann, B., Kuntschner, H., et al. 2018, A&A, 614, A32
- Weilbacher et al. (2012) Weilbacher, P. M., Streicher, O., Urrutia, T., et al. 2012, SPIE Conf. Ser., 8451
- Weilbacher et al. (2014) Weilbacher, P. M., Streicher, O., Urrutia, T., et al. 2014, in ASPCS, Vol. 485, Astronomical Data Analysis Software and Systems XXIII, 451
- Yamamura et al. (2009) Yamamura, I., Makiuti, S., Ikeda, N., et al. 2009, in ASPCS, Vol. 418, AKARI, a Light to Illuminate the Misty Universe, 3
Appendix A FIFI-LS time window selection
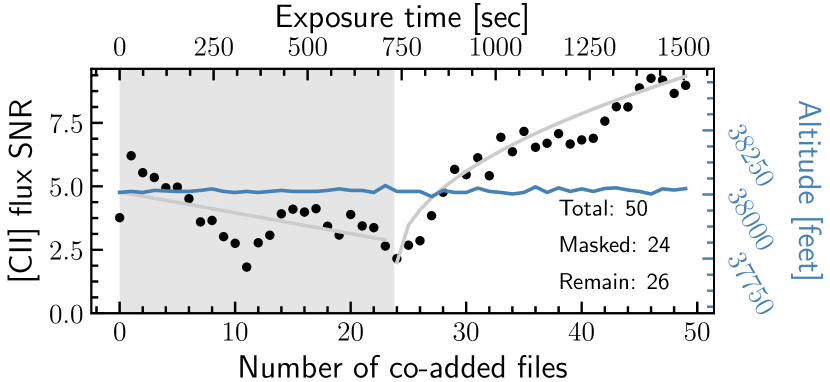
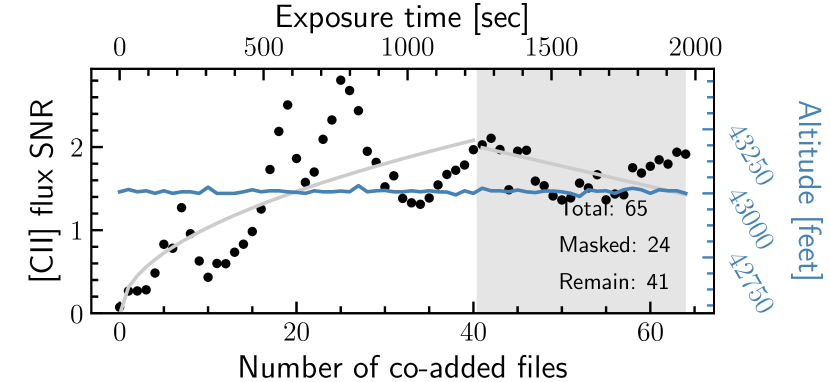
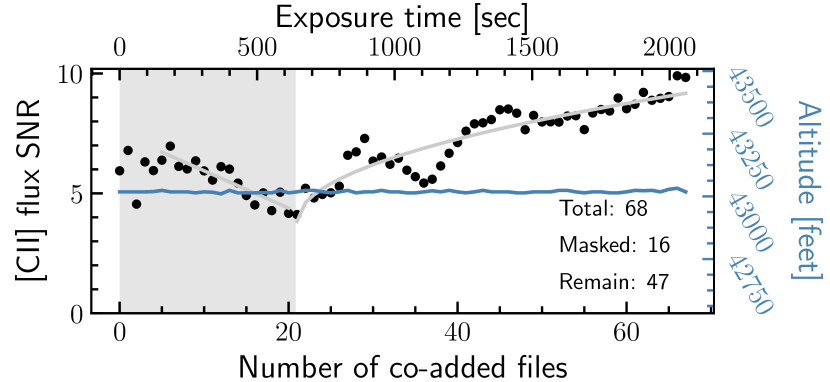
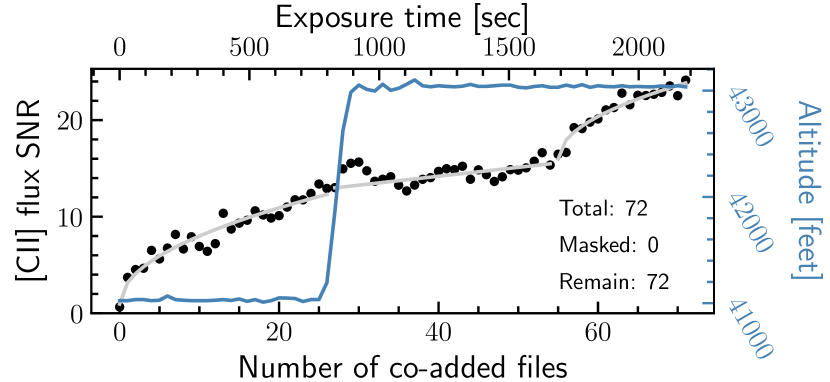
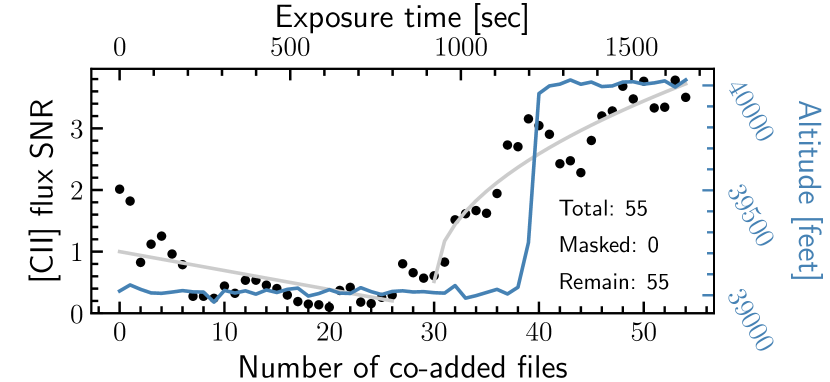
Although SOFIA reduces the water vapor absorption to 99% of the ground level, the atmospheric variations still play a perceptible role and affect the quality of the FIFI-LS data. To probe this effect, we used the science-ready LEVEL_3 pipeline output files. Each file corresponds to only seconds of exposure time and cannot be examined independently due to the high levels of noise. Calculating [C ii] line flux signal-to-noise ratio (S/N) of cumulatively summed files allows us to trace the trends of the S/N and therefore judge the atmospheric conditions. Ideally, the trend should rise as the square root function. If the S/N remains the same or even decreases when exposure time is added, we assume that an atmospheric variation degrades the quality and exclude those time windows from the analysis, as shown with the shaded areas in Fig. 5.
To calculate the S/N as a function of the exposure time, we fit a fixed Gaussian shape taken from the fitting result before the additional selection to the spectra, summed within the 36′′ diameter aperture. In the case of HE 13531917, when the line shape is not Gaussian, the procedure still works similarly because only relative trends are important in this analysis. Masking the spectral regions with strong atmospheric absorption lines is, conversely, very important for the flux estimations. The first few values of the S/N as a function of the coadded files are unreliable, but the overall trends remained when we performed the reverse-order coadding test.
The rapid altitude shifts also affect the S/N trends as seen in the case of HE 13531917 and HE 22113903. In the last 15 files for HE 22113903 the altitude is higher and of much better quality, but we decided not to exclude the majority of the files from the analysis and kept all of them.
Even though the selection due to atmospheric conditions is performed in the reduction pipeline, our additional selection technique helps to increase S/N of the detection by excluding the poor quality artifact-rich files.
HE 04331028
 HE 10291831
 HE 11082813
 HE 13531917
 HE 22113903
Appendix B SED fitting
As described in section 2.3, we used AGNfitter to analyze the observed galaxies. The SED plots are presented in Fig. 6–10.