Faraday Rotation Measure Dependence on Galaxy Clusters Dynamics
Abstract
We study the magnetic fields in galaxy clusters through Faraday rotation measurements crossing systems in different dynamical states. We confirm that magnetic fields are present in those systems and analyze the difference between relaxed and unrelaxed samples with respect to the dispersion between their inherent Faraday Rotation measurements. We found an increase of this RM dispersion and a higher RM overlapping frequency for unrelaxed clusters. This fact suggests that a large scale physical process is involved in the nature of unrelaxed systems and possible depolarization effects are present in the relaxed ones. We show that dynamically unrelaxed systems can enhance magnetic fields to large coherence lengths. In contrast, the results for relaxed systems suggests that small-scale dynamo can be a dominant mechanism for sustaining magnetic fields, leading to intrinsic depolarization.
keywords:
Hydrodynamics - Turbulence - Magnetic fields - Methods: statistics1 Introduction
The cosmological properties of magnetic fields (MF) and their influence in the evolution of the Universe have become a relevant topic nowadays (i.e. Kronberg, 2016; Beck, 2009; Stefani et al., 2017; Pakmor et al., 2014, 2017, among others). Extensive studies have been carried out (Vacca et al., 2016) in order to estimate and derivate limits and properties of cosmological magnetic fields. In a previous investigation, Stasyszyn et al. (2010) studied the relations between the cosmological large-scale structure (LSS) and the Faraday rotation measurements using simulations. They found that the LSS produces a signal that is below the current instrument’s sensitivity thresholds and noise. Nevertheless, with the next generation of instruments, it should be possible to apply statistical methods to detect signatures related with the large-scale structure (Vazza et al., 2015; Bonafede et al., 2015; Kale et al., 2016).
Galaxy clusters are one of the astrophysical objects where MF have been inferred without doubt (Carilli & Taylor, 2002; Feretti et al., 2012) and, although we have obtained much information about their intrinsic physical parameters (i.e. Böhringer & Werner, 2010; Kravtsov & Borgani, 2012), their role is still on debate. For typical electron densities in clusters of galaxies, the expected magnetic field should be able to generate a Faraday Rotation Measurement (RM) signal that can provide information about the physics of the embedded plasma (Stasyszyn et al., 2013; Marinacci et al., 2017; Vazza et al., 2018). For example, the RM magnitude and coherence length are related and give us information about the turbulence energy of the system, which helps us to infer the possible explanations about a dynamo effect preserving those fields.
One of the first studies to address a statistical study on the intra-cluster medium (ICM) is the one published by Clarke et al. (2001), where they probed the magnetic field strength over 16 galaxy clusters and found an excess of RM towards the center of the clusters. By simply modeling the electron column density from X-ray observations, they deduced an average magnetic field strength of . From this research to nowadays, both, the number of extragalactic RM observations and the information about clusters have been improved. Böhringer et al. (2016) studied the correlation of the observed RM with cluster properties using X-ray luminous galaxy clusters from CLASSIX. These clusters were identified down to a nominal lower flux-limit of in the energy band. In their analysis, they searched for the closer RMs to the center of each cluster. By modeling the electron column density from the clusters and assigning this RM measurement to it, they found an RM dispersion that characterizes the sample. They confirmed previous results and found that the RM dispersion increases with the column density, inferring a value of G.
Bonafede et al. (2011) made a similar analysis, but measuring lower values of polarization fraction towards the center of galaxy clusters, which can be explained by MF models with central values of G. In their research, they were able to subdivide the samples taking into account the presence of radio halos, cool core and high and low temperatures. They did not find any difference in the depolarization for the temperature and radio halos cases, but they did for the cool core and non-cool core samples.
In this paper, we use the statistics of RMs in the lines of sight of galaxy clusters to infer properties related to the magnetic field in clusters. Specifically, we use dynamical information that allows us to divide the sample into relaxed and unrelaxed clusters, and study the relations between their magnetic fields and their dynamical status.
The paper is organized as follows. In Section 2, we present the observational samples and the data that we use in our analysis. In Sections 3 and 4, we present the statistical analysis and the main results of the present work. Finally, in Section 5 and Section 6, we discuss some important aspects of our results and we present a few concluding remarks.
2 Observational samples
In this study we statistically infer the relation between the magnetic field properties and the dynamical status of different galaxy clusters samples. To this end, we correlate the positions of the clusters in the samples with the RMs around them and study the collision chance between a given Galaxy cluster and the RM distribution.
2.1 Galaxy cluster samples
Wen & Han (2013) studied galaxy clusters subsamples from the SDSS/DR8, and classified them into relaxed and unrelaxed using photometric information. The relaxed galaxy clusters refer to the ones that are not interacting and that should have a smooth symmetrical mass and light distribution, while the unrelaxed clusters are the ones that have important substructures that may come from strong interaction with other clusters of similar characteristics. It is well-known that strong interactions between clusters introduce very important modifications in all the components of the systems (galaxies, intra-cluster medium, dark matter distribution, etc.). This produces different signatures in all the electromagnetic spectrum (presence of radio halos, asymmetric X-ray distribution, etc.). Using this fact, Wen & Han (2013) calibrated their method with a sample of galaxy clusters using multiband information and a very well-known dynamical state.
They estimated 3 parameters that quantify different properties of the light distribution of clusters, namely 111For the exact definitions of these parameters, please read Wen & Han (2013).:
-
•
: This parameter quantifies the asymmetry of the galaxy distribution.
-
•
: The smoothed optical map of relaxed cluster has a steep surface brightness profile in all directions, while on the other hand, the presence of substructures imprints a ’ridge’ in a certain direction in the smoothed map. This parameter quantifies the difference in the light profile in the ridge direction compared to others.
-
•
: As relaxed clusters have a very similar light profile in all directions, their optical map can be fitted by two-dimensional elliptical King model, while, on the other hand, clusters with a lot of substructures would deviate more from this model. The normalized deviation quantifies the deviation of the optical map of the cluster from this two-dimensional King model.
Finally, by using these parameters and the clusters with well-known dynamical status, they defined the relaxation parameter as
| (1) |
and found that relaxed clusters have and unrelaxed clusters have .
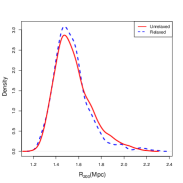
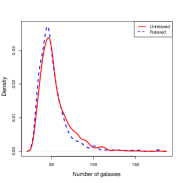
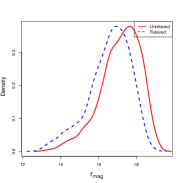
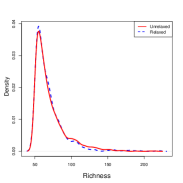
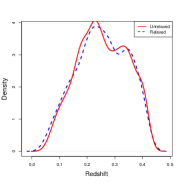
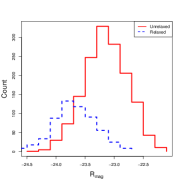
In the final sample, we found in the relaxed state () and unrelaxed clusters (). In figure 1, we show the distributions of the main properties of the two samples. We found that all the distributions are very similar with the exception of the , where the relaxed clusters are slightly more brilliant. This can be understood because, even if they have similar masses, the relaxed clusters already have formed stars. Meanwhile, in the unrelaxed or merging clusters, the star formation is just set up by the merger. Excluding the distribution, the two samples only differ in their dynamical state.
In Table 1 of Wen & Han (2013), they described the galaxy cluster dynamical information that they used as a known learning sample for their neural network. Additionally to the relaxed or unrelaxed state, they included information of whether they are known to have cool core, radio halo/relic or if they have confirmed merging signatures. It can be shown that the merging cases and the ones with radio halo/relic are always present in the case classified as unrelaxed. On the other hand, the cool core signature is present in both states, being a of the relaxed cases.
We also performed a cross-correlation between the relaxed an unrelaxed cluster with AGN catalogs of different bands. Specifically, we used the catalog of confirmed AGN of Véron-Cetty & Véron (2010), the WISE catalog of candidates to AGN (Assef et al., 2018), the -Ray AGN catalog of Abdo et al. (2010) and the radio AGN catalog of Horiuchi et al. (2004). In order to study the correlations between galaxy clusters and AGNs, we counted how many clusters have at least one AGN inside a radius of . In all the catalogs, we found that both clusters samples have the same ratios of systems with AGNs at all radii. We summarize these results in Table 1.
2.2 Faraday rotation measurements observations
The other ingredient for our study is the RM information. We used the catalog of Taylor et al. (2009) that contains Faraday rotations measures of polarized radio sources from the NRAO VLA Sky Survey (NVSS). Although this catalog is obtained using only two frequencies (which can lead to ambiguities for high values of RM), it has a large survey area that allows us to perform a better correlation of the distribution of galaxy clusters from catalogs.
It is worth to note that there are only two extreme RM in the area covered by our clusters sample. The ambiguities in the RM determination do not statistically contribute and, hence, have no influence on our following analysis. We took into account the foreground contribution of our Galaxy by subtracting the average RM value in degrees around each system, as done by Böhringer et al. (2016), Stasyszyn et al. (2010) and others.
In addition to Taylor et al. (2009), we also considered Xu & Han (2014) work and performed an analysis using their RM catalog. Although it is smaller, it has the advantage of having identified the extragalactic sources; therefore, having the redshift of the RM source. This allows us to analyze only the sources that are behind (or in front of) each cluster and so, to have more accurate inference of the Faraday depth. However, it does not guarantee that we drop sources that are just not identified with a cosmological counterpart.
3 Analysis
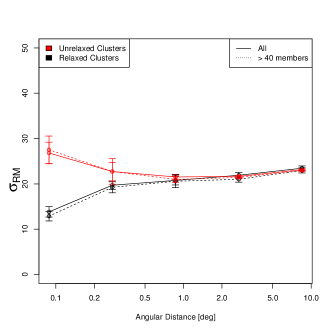
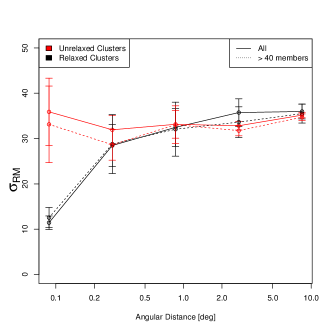
We started our analysis measuring the standard deviation of the RMs () of the relaxed and the unrelaxed clusters in radial bins around the direction of each cluster. In figure 2, we show the standard deviation of the RM as a function of the angular distance for the full samples (solid line). In order to check if this difference is dominated by smaller groups of galaxies, we performed the same calculation, but only with clusters with more than galaxies, and displayed this results in dashed lines. It can be seen that in both samples the unrelaxed clusters statistically have a larger RM dispersion and that the difference is larger when we impose more than members. This implies that the effect is mostly driven by the bigger galaxy clusters. To estimate the errors of our measurements, we used a bootstrapping technique that consist in estimating the removing one of the galaxy clusters each time, and then we calculate the dispersion of these measurements.
In order to avoid biases caused by the difference in the luminosity, and taking advantage of the fact that the unrelaxed clusters over count in a factor of 3 the relaxed ones (shown in figure 1), we decided to randomly subsample the unrelaxed clusters to follow the distribution and numbers density of the relaxed ones. As done previously, we estimated the standard deviation of the RM and found that the unrelaxed systems have larger RM dispersions. It is worth noting that this is the same trend found in the analysis of the full sample, indicating that the difference between the relaxed and unrelaxed clusters is not driven by the number of galaxy clusters neither by the distribution.
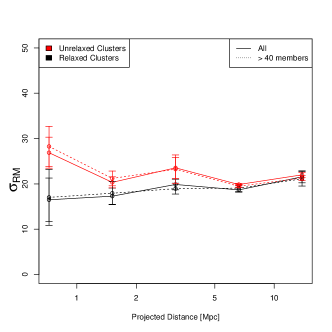
In figure 3, we show the same calculations but projecting to the physical distance of the central cluster. Again, the solid line corresponds to the full samples, while the dashed lines correspond to clusters with more than 40 galaxy members. We found the same trend as in the previous plot, the unrelaxed clusters have statistically a larger RM dispersion than the relaxed ones.
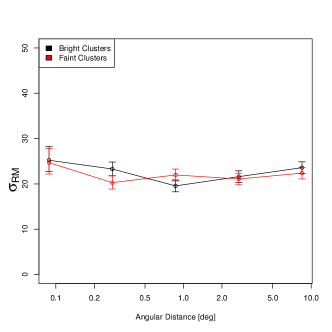
As it can be seen in all the plots, the difference between samples rises when we select clusters with more than members. This result can be understood because the small clusters do not really contribute to this effect, due to the fact that the small mass of those objects and the small intervening volume do not generate a relevant Faraday rotation effect. To continue the analysis of the samples, we divided the galaxy clusters into bright and faint (making the cut in ) without using the dynamical state information and performed the same calculation of the RM dispersion in both sub-samples. We displayed these results in figure 4, where we observe that there are no differences between these two samples, confirming that the difference displayed in previous plots is due to their dynamical state.
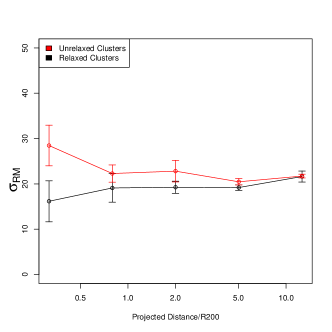
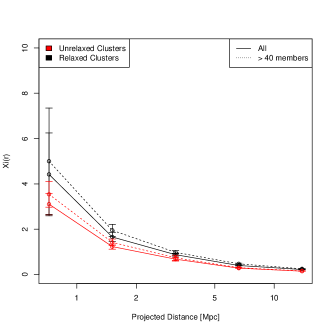
In figure 5, we renormalized the projected distance to the estimated by Wen & Han (2013). We can observe that the difference holds up to twice the physical radius, showing that it is inherent to the cluster themselves and their surrounding medium.
As the RM is an integrated effect along the line of sight that includes all the cosmic structures between the polarized source and the cluster, to not know the distance of the polarized sources is a strong source of uncertainties in our method. Xu & Han (2014) compiled a catalog of confirmed extragalactic RM sources, for which they also measured a redshift. Therefore, we performed our test discarding all the RM sources that are in front of the galaxy clusters. The result is shown in figure 6, where we show the standard deviation of the RM as a function of the projected distance to clusters centers. It can be seen that they follow the same trend as previous analysis. However, as the number of line of sights sources is drastically reduced (it is just of the Taylor et al. (2009) sample), the error bars are bigger.
4 Statistical density distributions
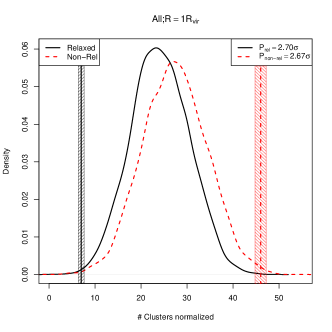
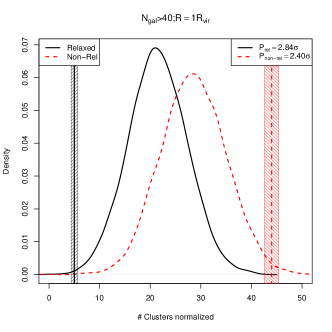
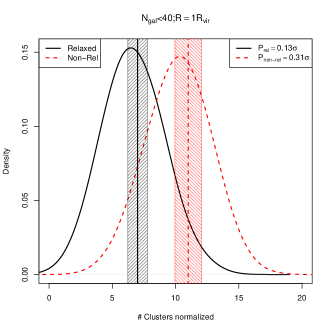
We studied the probability of line of sight overlapping galaxy clusters with the rotation measure positions. To achieve this, we generated catalogs randomly sorting the angular positions of the galaxy clusters and analyzed the probability of having at least one RM within one virial radius of each cluster. The results are shown in the figure 7. There, we compare the probability distribution of the random realizations with the results obtained in the relaxed (black solid line) and unrelaxed (red dashed line) samples. It can be seen that the relaxed and unrelaxed observations are almost off the random realizations and in opposite trends. To compare the distributions (that have different numbers of galaxy clusters), we subtracted to each of the dynamical samples the minimum RM line of sight numbers. We also estimated the error of the observational measurements using the bootstrapping method as in the previous section. This demonstrates that relaxed clusters have a smaller overlapping chance compared with a random distribution and the unrelaxed cases have a higher chance of having at least one RM crossing them. If we now only consider clusters with more (less) than members, we obtain the plots of figure 8. We show that galaxy clusters with more than members are also significantly different than the random samples, whereas those with less than members do not show a big difference compared with the random distributions.
This is consistent with previous sections in which we show that the RM dispersion increases and decreases for the same cases. We show that the frequency of having at least one RM crossing the clusters is higher for the unrelaxed clusters than for the random sample, and is smaller for the relaxed ones.
5 Discussion
Carilli & Taylor (2002) reviewed the possible origins of magnetic field. They described the variations that exist in field strengths and topologies, especially when comparing dynamically relaxed clusters to those that have recently undergone a merger. They pointed out that, in all cases, the MF has a significant effect on energy transport in the intracluster medium. Subramanian et al. (2006) extensively discussed analytical models for the origin of turbulence and magnetic fields in galaxy clusters, having good agreement in their estimations compared with observations. Recently, in Vazza et al. (2018), they were able to resolve small scale dynamos acting on the intercluster medium. All these studies, between others, help us to understand to some extent the complexity of galaxy clusters and the astrophysics involved. For the statistical nature of the present work we decided to take a rougher approach in these discussions, leaving the detailed modeling for further work.
As in other studies (Böhringer et al., 2016, i.e.), we can assume that the observed RM originates from the integration in the line of sight with different magnetic field orientations and ICM cells. The is diluted by the characteristic length of the ICM cell that passes through the observed line of sight by , where is the length of the ICM column electron density and is the characteristic length of the ICM cell with coherent magnetic field. From this, we are able to derive a relation between the , the electron density and the magnetic field as :
| (2) |
As a difference from Böhringer et al. (2016), we do not have a good estimator for the for each sample. Using as characteristic values , and , one can infer values of for the unrelaxed and for the relaxed systems. If one also assumes for the unrelaxed clusters and for the relaxed with the same cell size of , the outcome values for the magnetic fields are and , respectively. We used the same value because we did not find a significant difference in the distribution properties (figure 1). However, we expect that the turbulence will be higher for the unrelaxed sample, therefore implying a smaller . Note that if we consider different values for , we expect a larger difference between the samples, noting that it is proportional with this quantity. We also know that we expect the relaxed clusters or the ones with cooling cores having higher densities; therefore, there will be a decrease in the inferred MF. However, we empathize again that the way the cluster samples were selected does not guarantee that cooling core clusters are in one side of the set samples. Comparing with Böhringer et al. (2016), we have a difference of almost one order of magnitude in the values. This is related with the fact that the samples that we used are not the same (neither the RM sources nor the Galaxy clusters) and have different statistical properties compared with the ones used in their work.
One interesting aspect of our results is that if it is true that the RM dispersion is smaller in the relaxed cases, this can also be due to the depolarization effect from the intrinsic sources (Bonafede et al., 2011). This means that we are not able to observe the Faraday effect, but not that the MF is not present. It can also explain the results from section 4, where we found that it is less frequent to have an RM crossing the relaxed samples compared with random samples. We can justify this just by the fact that those clusters have just depolarized the rotation measures and we cannot observe them. However, as a difference with Bonafede et al. (2011), there are differences in the way we divided the samples (relaxed and unrelaxed). From the learning dataset, the unrelaxed are the only ones to have radio halos or relics, and about of the relaxed samples have cool core measured, while just an of the unrelaxed have been identified as cool cores.
Given the nature of the RM distribution (Taylor et al., 2009, which does not follow a Gaussian shape for example), we analyzed our results with a different statistical estimator to derive the relations between the cosmic structures and their magnetic component. In particular, we can define
| (3) |
which is averaging in projected distance bins of the absolute value of the rotation measurement. In figure 9, we show the result of this estimator. In this case, the relaxed systems show a higher RM absolute value averaged towards the center in comparison with the unrelaxed clusters. Meaning that even if they have a smaller number of lines of sight RMs, we can measure the high ones. Note that the errors shown in the plot are by bootstraping the sample; therefore, the higher error bars for the relaxed clusters only reflect the fact of small numbers of RMs. This information tells us about the nature of the distribution of RM in each radial bin, implying that the unrelaxed distribution is skewed and has a larger dispersion given the nature of the processes involved in the unrelaxed systems.
It is worth mentioning that, in order to build the catalog, Taylor et al. (2009) used data from the NVSS that was not designed for polarization studies and, given the beam size and sensitivity available, it suffered a depolarization effect. Nevertheless, the difference between the relaxed and unrelaxed clusters holds even using two different RM catalogs (Taylor et al., 2009; Xu & Han, 2014) with different RM intrinsic errors and information from the sources. It is also worth to remark that although it is most likely that the relaxed sample has clusters with a cool core component and thus a small-scale dynamo acting, our studies focus at larger scales than the cluster center.
6 Conclusions
Taking into account that the presence of magnetic fields in galaxy clusters is a very well-known fact, and that the structure formation proceeds in a hierarchical way giving rise to bigger structures through mergers, we studied the relation between RM measurements and the dynamical status of the galaxy clusters. In order to do so, we used the galaxy clusters catalog constructed by Wen & Han (2013) and correlated the position of each cluster with RM sources. We found that the unrelaxed clusters have a significant higher RM standard deviation than the relaxed ones. This difference can be interpreted as if the unrelaxed clusters have higher MF at megaparsec scales with kiloparsecs coherence lengths. These results can be understood if we consider the small-scale dynamo caused by minor and major mergers.
In order to see if this difference is really due to the dynamical state, we divided the cluster sample into bright and faint. We found that there is no difference between the MFs of these two samples. This suggests that the difference found in section 3 is really due to the dynamical status of the clusters.
The research that we present links properties of the Gas with two samples that rely on a numerical algorithm that takes into account optical features of the system relaxation. In section 2, we already mentioned the information available for the learning sample, which does not include the gas content in the analysis. However, we do observe that the relaxations state independently correlates with the gas and the MF evolution inside galaxy clusters.
We also found that the unrelaxed clusters are more likely to have a crossing RM in one virial radius than a random sample. For the case of the relaxed clusters, we found this less likely. Therefore, there should be a depolarization process for the rotations measurement in those systems.
We were able to estimate some typical MF values for those systems. This result is strongly dependent on some parameters, as well as the electron density , the coherence length of the ICM and the Faraday depth (Stasyszyn et al., 2010; Vacca et al., 2016). The selection process of the two samples is only photometric and, therefore, there are still a lot of uncertainties on the physical properties for each of the samples that should be addressed in the future. However, by using conservative values for those parameters, we infer characteristic values of for the unrelaxed clusters and for the relaxed ones. These amounts are lower limits to the absolute value for the MF in those samples and do not consider the fact that small-scale dynamo can be efficient (Vazza et al., 2018) but not measurable with this staking methods. Nevertheless, it is an evidence that unrelaxed systems could have a typical mechanism to enhance magnetic fields with large characteristic coherence lengths to be measured thought the Faraday rotation measurements.
Next generation of instruments, new catalogs and deeper studies of the dynamical samples will give us the detail to understand the nature of cosmological magnetic fields, their origin and their role in the large-scale structure.
Acknowledgements
We want to thank Franco Vazza and Annalisa Bonafede for the useful comments and discussions and Carolina Charalambous for extensive corrections. The authors wish to thank the anonymous referees for valuable comments which improve the paper. This research was partially supported by Consejo Nacional de Investigaciones Científicas y Técnicas (CONICET, Argentina) and Secretaría de Ciencia y Tecnología de la Universidad Nacional de Córdoba (SeCyT-UNC, Argentina).
References
- Abdo et al. (2010) Abdo A. A., et al., 2010, ApJ, 715, 429
- Assef et al. (2018) Assef R. J., Stern D., Noirot G., Jun H. D., Cutri R. M., Eisenhardt P. R. M., 2018, The Astrophysical Journal Supplement Series, 234, 23
- Beck (2009) Beck R., 2009, Astrophysics and Space Sciences Transactions, 5, 43
- Böhringer & Werner (2010) Böhringer H., Werner N., 2010, A&ARv, 18, 127
- Böhringer et al. (2016) Böhringer H., Chon G., Kronberg P. P., 2016, A&A, 596, A22
- Bonafede et al. (2011) Bonafede A., Govoni F., Feretti L., Murgia M., Giovannini G., Brüggen M., 2011, A&A, 530, A24
- Bonafede et al. (2015) Bonafede A., et al., 2015, Advancing Astrophysics with the Square Kilometre Array (AASKA14), p. 95
- Carilli & Taylor (2002) Carilli C. L., Taylor G. B., 2002, ARA&A, 40, 319
- Clarke et al. (2001) Clarke T. E., Kronberg P. P., Böhringer H., 2001, ApJ, 547, L111
- Feretti et al. (2012) Feretti L., Giovannini G., Govoni F., Murgia M., 2012, A&ARv, 20, 54
- Horiuchi et al. (2004) Horiuchi S., et al., 2004, ApJ, 616, 110
- Kale et al. (2016) Kale R., et al., 2016, Journal of Astrophysics and Astronomy, 37, 31
- Kravtsov & Borgani (2012) Kravtsov A. V., Borgani S., 2012, ARA&A, 50, 353
- Kronberg (2016) Kronberg P. P., 2016, Cosmic Magnetic Fields. UK: Cambridge University Press
- Marinacci et al. (2017) Marinacci F., et al., 2017, preprint, (arXiv:1707.03396)
- Pakmor et al. (2014) Pakmor R., Marinacci F., Springel V., 2014, ApJ, 783, L20
- Pakmor et al. (2017) Pakmor R., et al., 2017, MNRAS, 469, 3185
- Stasyszyn et al. (2010) Stasyszyn F., Nuza S. E., Dolag K., Beck R., Donnert J., 2010, MNRAS, 408, 684
- Stasyszyn et al. (2013) Stasyszyn F. A., Dolag K., Beck A. M., 2013, MNRAS, 428, 13
- Stefani et al. (2017) Stefani F., et al., 2017, preprint, (arXiv:1705.08189)
- Subramanian et al. (2006) Subramanian K., Shukurov A., Haugen N. E. L., 2006, Monthly Notices of the Royal Astronomical Society, 366, 1437
- Taylor et al. (2009) Taylor A. R., Stil J. M., Sunstrum C., 2009, ApJ, 702, 1230
- Vacca et al. (2016) Vacca V., et al., 2016, A&A, 591, A13
- Vazza et al. (2015) Vazza F., Ferrari C., Bonafede A., Brüggen M., Gheller C., Braun R., Brown S., 2015, Advancing Astrophysics with the Square Kilometre Array (AASKA14), p. 97
- Vazza et al. (2018) Vazza F., Brunetti G., Brüggen M., Bonafede A., 2018, MNRAS, 474, 1672
- Véron-Cetty & Véron (2010) Véron-Cetty M.-P., Véron P., 2010, A&A, 518, A10
- Wen & Han (2013) Wen Z. L., Han J. L., 2013, MNRAS, 436, 275
- Xu & Han (2014) Xu J., Han J.-L., 2014, Research in Astronomy and Astrophysics, 14, 942