100
![[Uncaptioned image]](/html/1905.09483/assets/x1.png)
![[Uncaptioned image]](/html/1905.09483/assets/x2.png)
Towards Generation and Evaluation of
Comprehensive Mapping Robot Datasets
\@IEEEauthorblockconfadjspace {@IEEEauthorhalign} Hongyu Chen1, Xiting Zhao, Jianwen Luo, Zhijie Yang, Zehao Zhao, Haochuan Wan,
Xiaoya Ye, Guangyuan Weng, Zhenpeng He, Tian Dong, and Sören Schwertfeger1
Accepted for:
IEEE Conference on Robotics and Automation (ICRA) 2019 workshop
Citation:
Hongyu Chen1, Xiting Zhao, Jianwen Luo, Zhijie Yang, Zehao Zhao, Haochuan Wan,
Xiaoya Ye, Guangyuan Weng, Zhenpeng He, Tian Dong, and Sören Schwertfeger1, ”Towards Generation and Evaluation of Comprehensive Mapping Robot Datasets”, IEEE Conference on Robotics and Automation (ICRA) 2019 workshop: IEEE Press, 2019.
This is a publication from the Mobile Autonomous Robotic Systems Lab (MARS Lab), School of Information Science and Technology (SIST) of ShanghaiTech University. For this and other publications from the MARS Lab please visit:
https://robotics.shanghaitech.edu.cn/publications
© 2019 IEEE. Personal use of this material is permitted. Permission from IEEE must be obtained for all other uses, in any current or future media, including reprinting/republishing this material for advertising or promotional purposes, creating new collective works, for resale or redistribution to servers or lists, or reuse of any copyrighted component of this work in other works.
Towards Generation and Evaluation of
Comprehensive Mapping Robot Datasets
Abstract
This paper presents a fully hardware synchronized mapping robot with support for a hardware synchronized external tracking system, for super-precise timing and localization. We also employ a professional, static 3D scanner for ground truth map collection. Three datasets are generated to evaluate the performance of mapping algorithms within a room and between rooms. Based on these datasets we generate maps and trajectory data, which is then fed into evaluation algorithms. The mapping and evaluation procedures are made in a very easily reproducible manner for maximum comparability. In the end we can draw a couple of conclusions about the tested SLAM algorithms.
I INTRODUCTION
Localization and mapping are essential robotic tasks and are often solved together in a Simultaneous Localization and Mapping (SLAM) system [1]. SLAM systems have to be evaluated regarding their performance. But this is not a trivial task.
Often, ground truth robot paths are used to measure the quality of the SLAM system, since it is assumed that a good localization will result in good maps. In [2] and [3] the ground truth paths are compared with the paths estimated by the SLAM algorithms. A metric for measuring the error of the manually corrected trajectory of datasets is available to the public in [4]. Recently, Zhang and Scaramuzza have provided a tutorial and software for quantitative trajectory evaluation [5].
If ground truth paths are not available, the maps can be used to evaluate the quality of the mapping system. For that image similarity methods [6] and pixel-level feature detectors [7, 8] can be applied to the maps, but have their limitations, because maps often have errors like structures appearing more than once due to localization errors. More high level features like barrels are used for evaluation in [9, 10] and also in 3D maps in [11].
Another approach is to capture the topology of the maps and use the matches for comparison [12]. There are also evaluation methods that don’t rely on ground truth data. In [13] suspicious and plausible arrangements of planes in 3D scans are detected and the map is evaluated accordingly.
Often, simulations are used for the evaluation of SLAM systems [14]. A great factor for errors in SLAM systems is the noise of the sensors. It is thus essential to accurately simulate the noise and errors in the simulation, a task which is not simple. Datasets of 3D sensor measurements and ground truth poses for benchmarking the performance of SLAM algorithms are provided in [15] and [16]. The ground truth information has been obtained using a tracking system and by creating the data in a simulation, respectively.
In this paper we propose to use an advanced mapping system with sensors that are hardware-synchronized to an external tracking system to collect data for benchmarking datasets. We believe this approach is a valuable supplement to SLAM evaluation using simulations, because it ensures real sensor noise and real locomotion, vibrations and other factors that are difficult to accurately simulate. Using the tracking system we gather ground truth localization information. But we believe that it is also important to evaluate the mapping performance, especially for visual SLAM. So we also collect ground truth map information using a professional, static 3D scanner (Faro Focus 3D).
We provide three datasets. One purely within the tracking system, especially also for evaluating mapping performance. Additionally we have two longer, very similar datasets, that start and end in the tracking system. One can do loop closing at the end, the other cannot (no overlapping sensor data). Using these datasets we aim to evaluate the loop-closing and scan-matching performance.
We provide ROS launch files to automatically generate the maps from the datasets and to evaluate them by comparison to ground truth. Our results are thus fully reproducible.
The key contributions of this paper are thus:
-
•
Presentation of a hardware-synchronized advanced mapping robot with external tracking.
-
•
Generation of three datasets for mapping and SLAM evaluation.
-
•
Providing reproducible evaluations of standard mapping software based on the datasets.
This work is work-in-progress and we will provide more mapping solutions and evaluation systems based on the datasets with the final version of this paper, if it gets accepted.
The reminder of the paper is organized as follows: Section II describes the mapping robot and the other hardware and procedures for dataset generation. In Section III we describe the three datasets we provide. The reproducible evaluation of those datasets explained in Section IV, followed by the conclusions in Section V.
II Mapping System
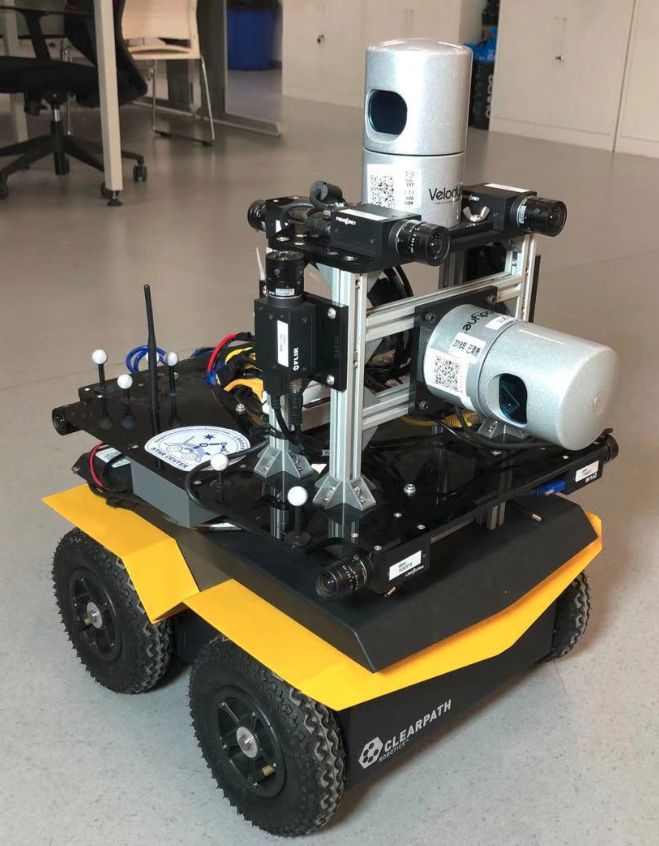
Our mapping system consists of a Clearpath Jackal robot with an upgraded power supply and computer (Intel Core i7-6770k CPU, Raid 0: 3x Samsung 850 EVO 500G). The mainboard supports eight independent USB 3.1 ports, which are mainly used for the cameras. The robot is collecting data from the following sensors:
-
•
Nine 5MP wide-angle color cameras (FLIR Grasshopper3 GS3-U3-51S5C-C) with wide-angle lenses (82∘ x 61∘), 10Hz (4 stereo pairs: front, left, right, up; one back-looking camera)
-
•
Two Velodyne HDL-32E 3D Laser scanners, 10Hz (one horizontal, one vertical; both in dual-return mode)
-
•
IMU Xsense MTi-300, 200Hz
-
•
Robot odometry
-
•
Optitrack tracking system (21 Prime 13 cameras, 30Hz)
We compress the camera images with JPEG quality 90. Due to CPU speed limitations we can not store much more than 10Hz for the 9 cameras, so we chose to collect the images with the same frequency as the Velodynes. This results in a total storage bandwidth of about 170 MB/s.
II-A Synchronization
Especially with respect to quality evaluation, but also for mapping systems in general, it is important to synchronize all the sensor data. We use an Asus Tinker Board with a quad core 1.8 GHz ARM Cortex-A17 processor to provide hardware synchronization. The Tinker Board serves as our reference time. It is triggering the cameras and the tracking system with 10 Hz and the Xsens IMU with 200Hz. But hardware triggering of sensors is only half of the job: Afterwards the data from the cameras arrives on PC in the Jackal robot at different times, due to USB and CPU scheduling issues. We thus need to be able to associate the hardware triggers with the actual data and make use of this info in the software. Thus, for every trigger it generates, the Tinker board also sends a ROS timestamp to the PC, which is collected in the bagfile. In a post-processing step we then match the sensor data with this time-stamp and then correct the time-stamps of the data. Afterwards all data (e.g. all images and the tracking data and the IMU information) that was triggered together will have exactly the same time-stamp.
The tracking system is also triggered by the Tinker board, but it is then increasing the frequency from 10Hz to 30Hz. For that the robot is physically connected to the tracking system via an ethernet cable when inside the systems camera view. Before leaving or entering the tracking system we manually (un)plugged this cable, briefly stopping the data-collection for this. To avoid having a second ethernet cable from the tracking system to the robot, we collect the tracking system’s (which is running on Windows) data on a separate Ubuntu PC and merge the bagfiles later. Before each run, the time of the PC, the Jackal PC and the Tinker Board are updated via NTP from the router of our lab.
Since the Velodyne is a rotating sensor, it cannot be triggered. Instead it time-stamps its messages using GPS pps and NMEA data. The Tinker Board is providing fake GPS data with its own time to the Velodynes, such that their data arrives at the Jackal PC already with the correct time stamp.
II-B Calibration
Our MARS Mapper robot (MARS is the acronym of our Mobile Autonomous Robotic Systems Lab) is fully calibrated. Intrinsic calibrations are acquired using the known methods. The extrinsic calibration of the sensors (i.e. their poses) are gathered by pair-wise calibration of various, also heterogeneous sensor pairs (4x stereo cameras, 32x non-overlapping cameras, 13x lidar to camera, 1x lidar to lidar, 9x tracking system to camera) and then minimizing the error using G2O [17]. Figure 3 shows a Velodyne scan where the points that are within the field of view of one of the 7 horizontal cameras are colored.
Because we calibrated the sensors with the tracking system, we can ready use the tracking system results as the pose of the robot. The tracking system reports an error of the collected poses of less than 1.5mm.
III Datasets
The datasets were collected in the Mobile Autonomous Robotic Systems Lab (MARS Lab) of ShanghaiTech University, and have thus MARS in their name:
-
•
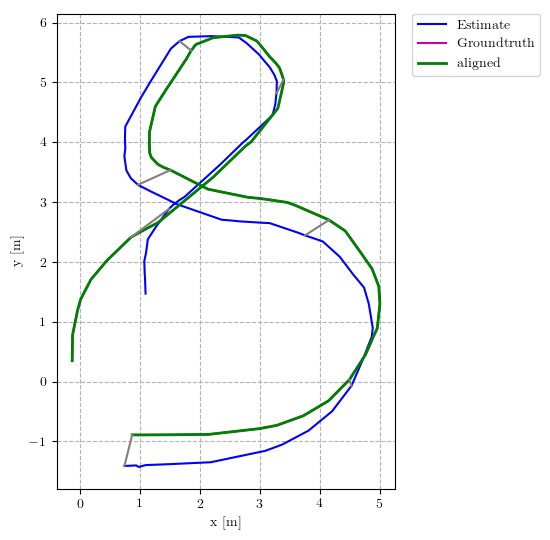
MARS-8: A short (23m) figure eight driven by the mapping robot with continuous tracking information. For basic SLAM evaluation and evaluation of mapping performance.
-
•
MARS-Loop: A medium length (77m) mapping run, starting in the tracking system in the MARS lab, leaving the lab and re-entering it through a different door, finally entering the tracking system again and finishing at the start pose. For evaluation of basic loop closing performance.
-
•
MARS-NoLoop: The MARS lab is devided into two parts by two curtains (10cm apart; along the center of the tracking system). The robot follows the same path as MARS-Loop, except that it stops a little earlier (because the curtains are in the way). The robot starts and ends in the same tracking system. No loop closing is possible between the start and end of the dataset, because there is almost no overlap between the areas.
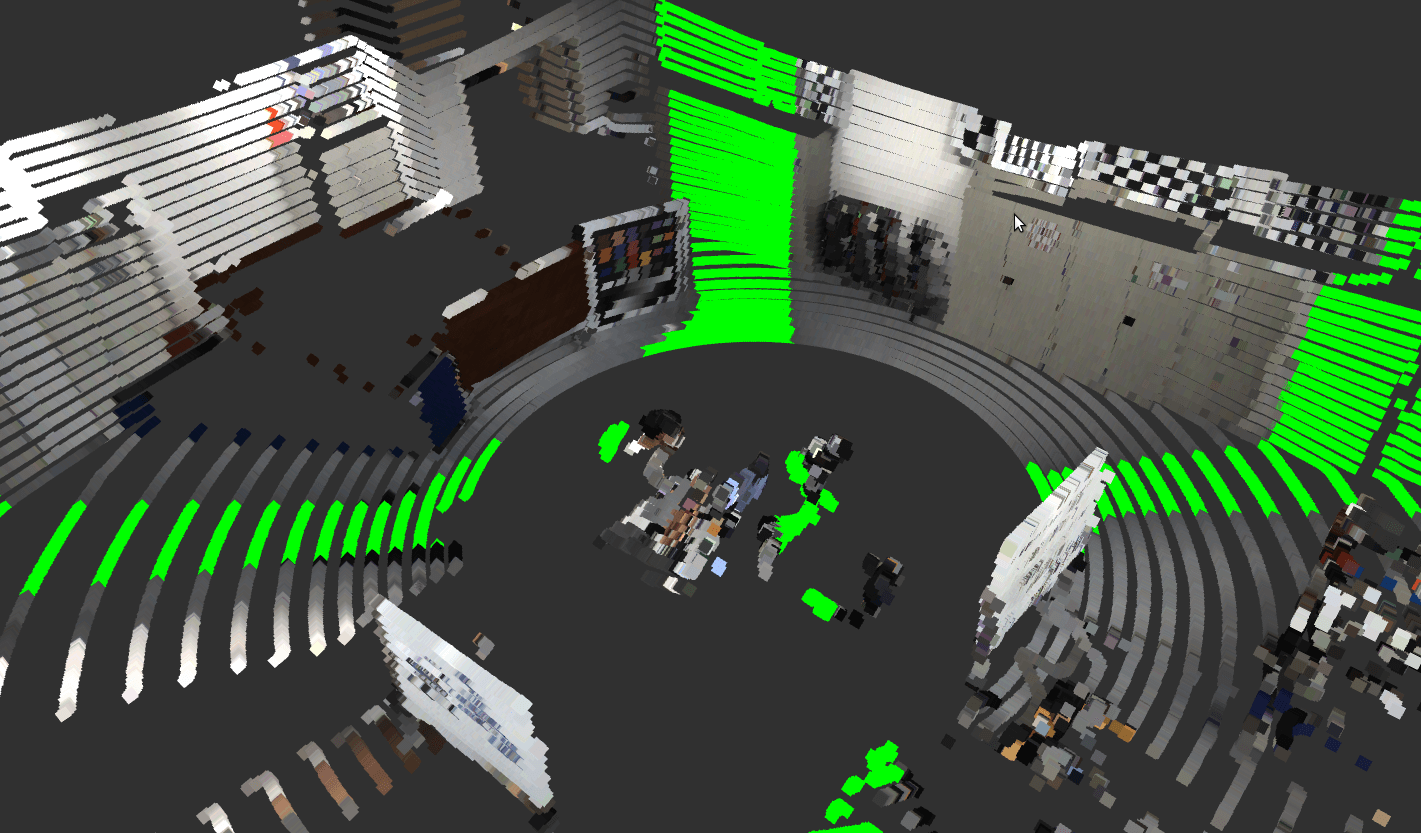
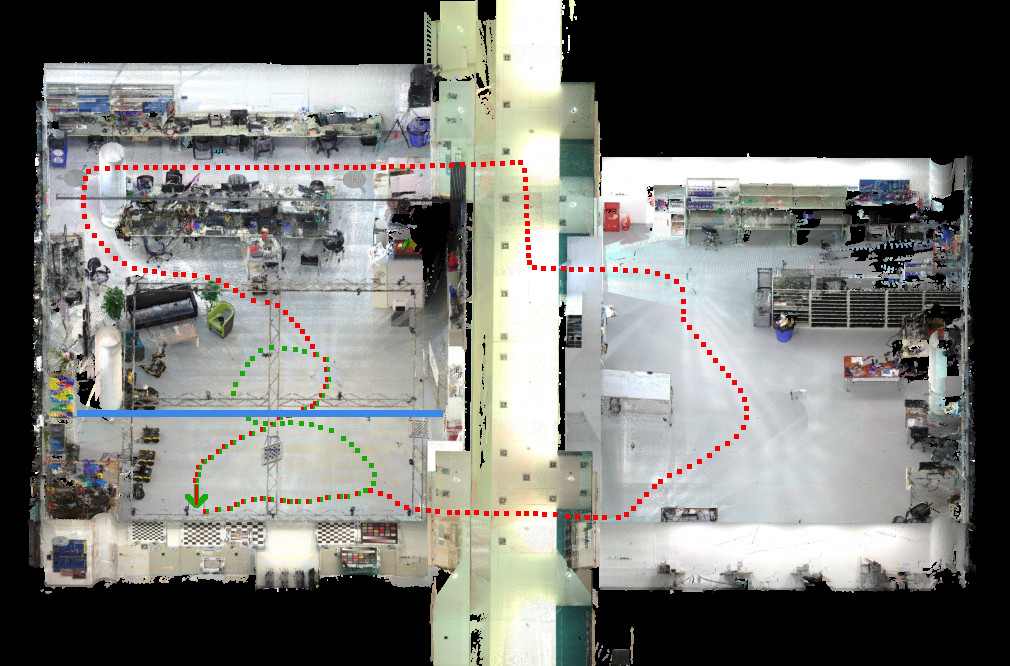
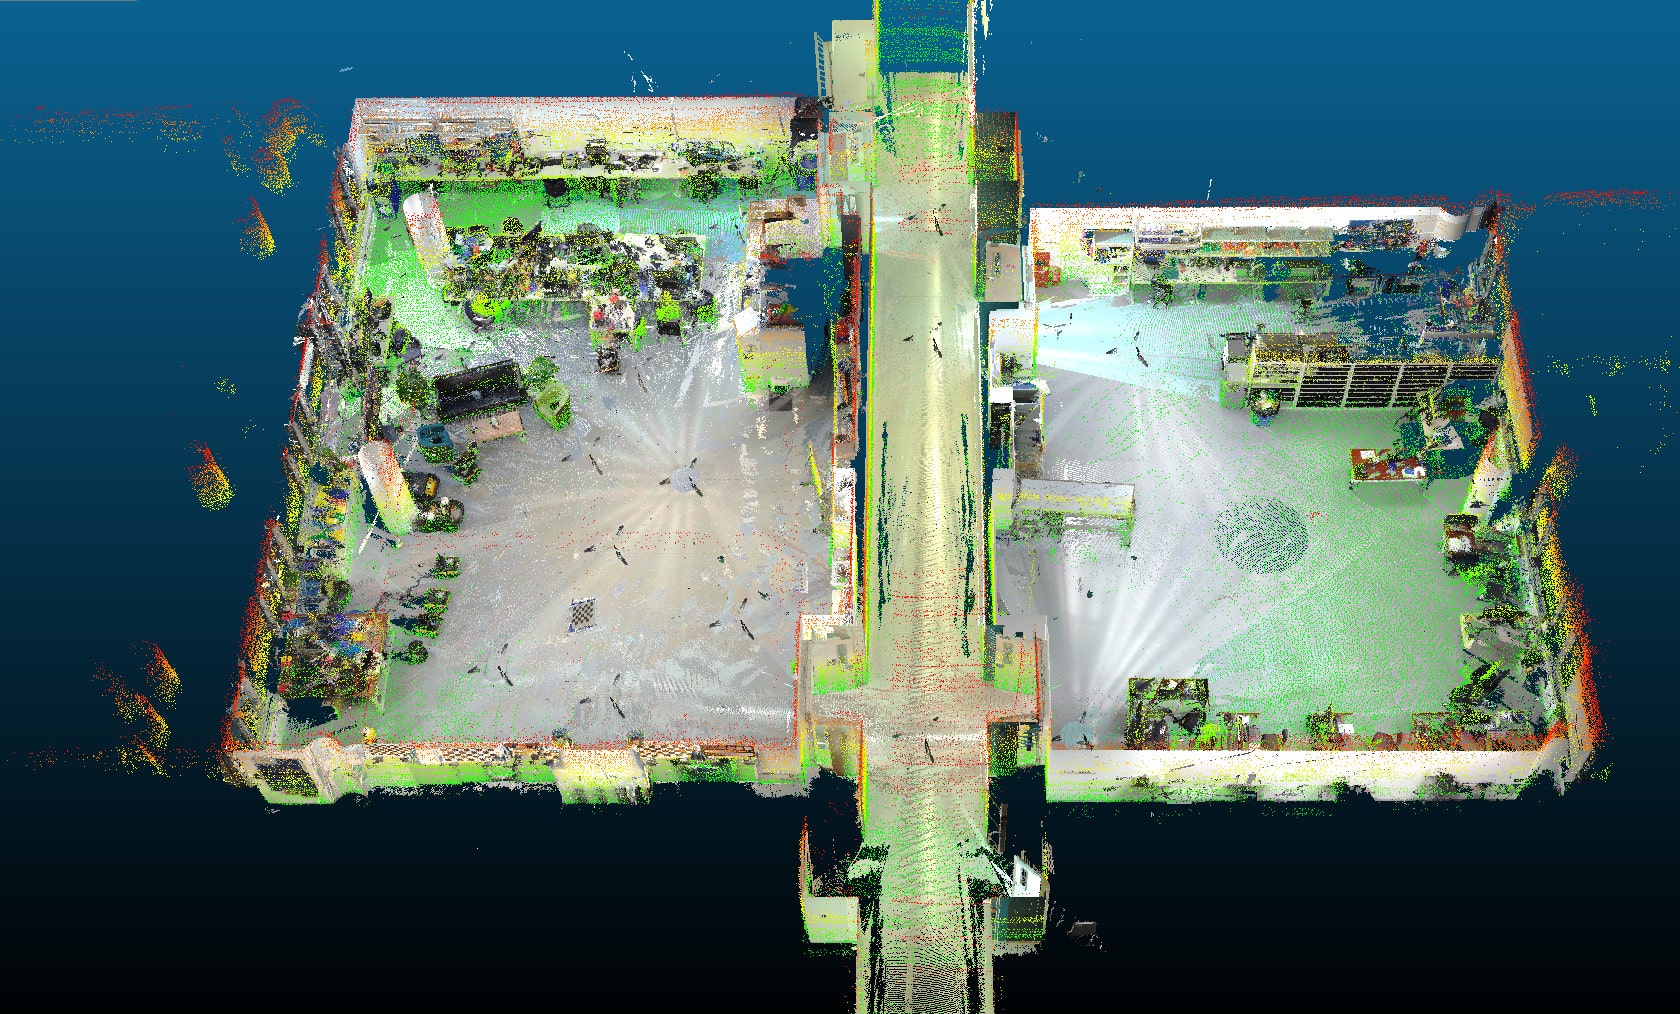
Figure 2 shows the paths of the robot in the different datasets: green for MARS-8 and red for MARS-Loop and MARS-NoLoop. The approximate paths we followed are also marked on the ground and are thus visible in some of the collected camera images (black for MARS-8 (and MARS-Loop where they overlap) and white for MARS-Loop). MARS-NoLoop is following MARS-Loop, except stopping earlier. Almost nothing in the environment was changed between the robot data collections nor for the Faro scans.
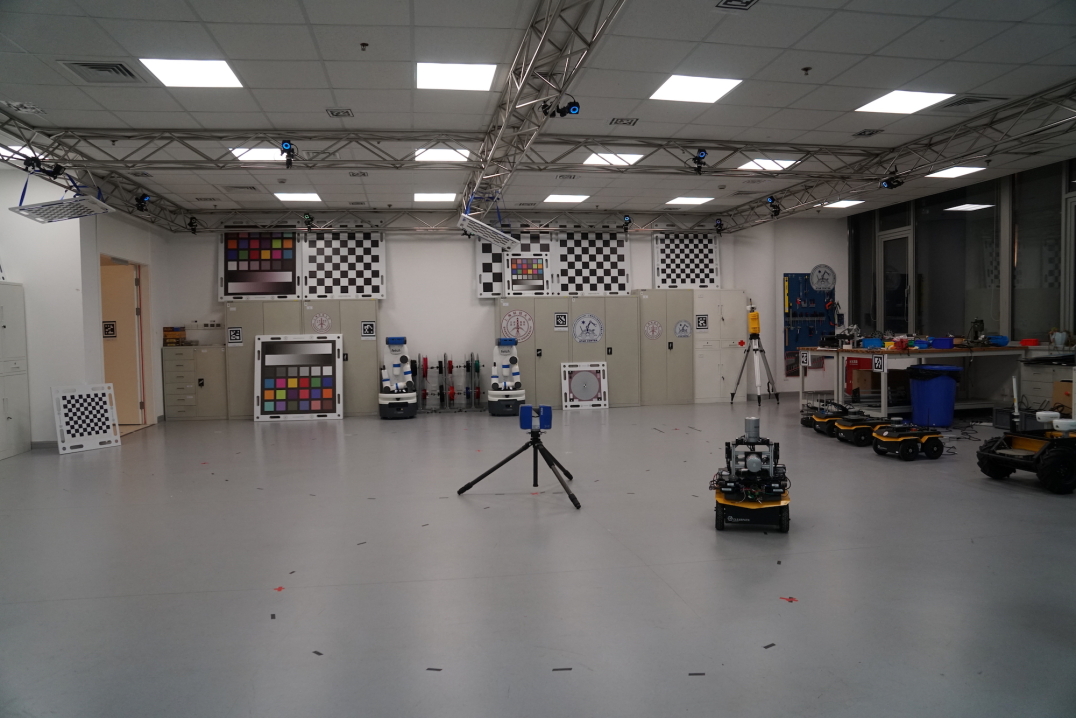
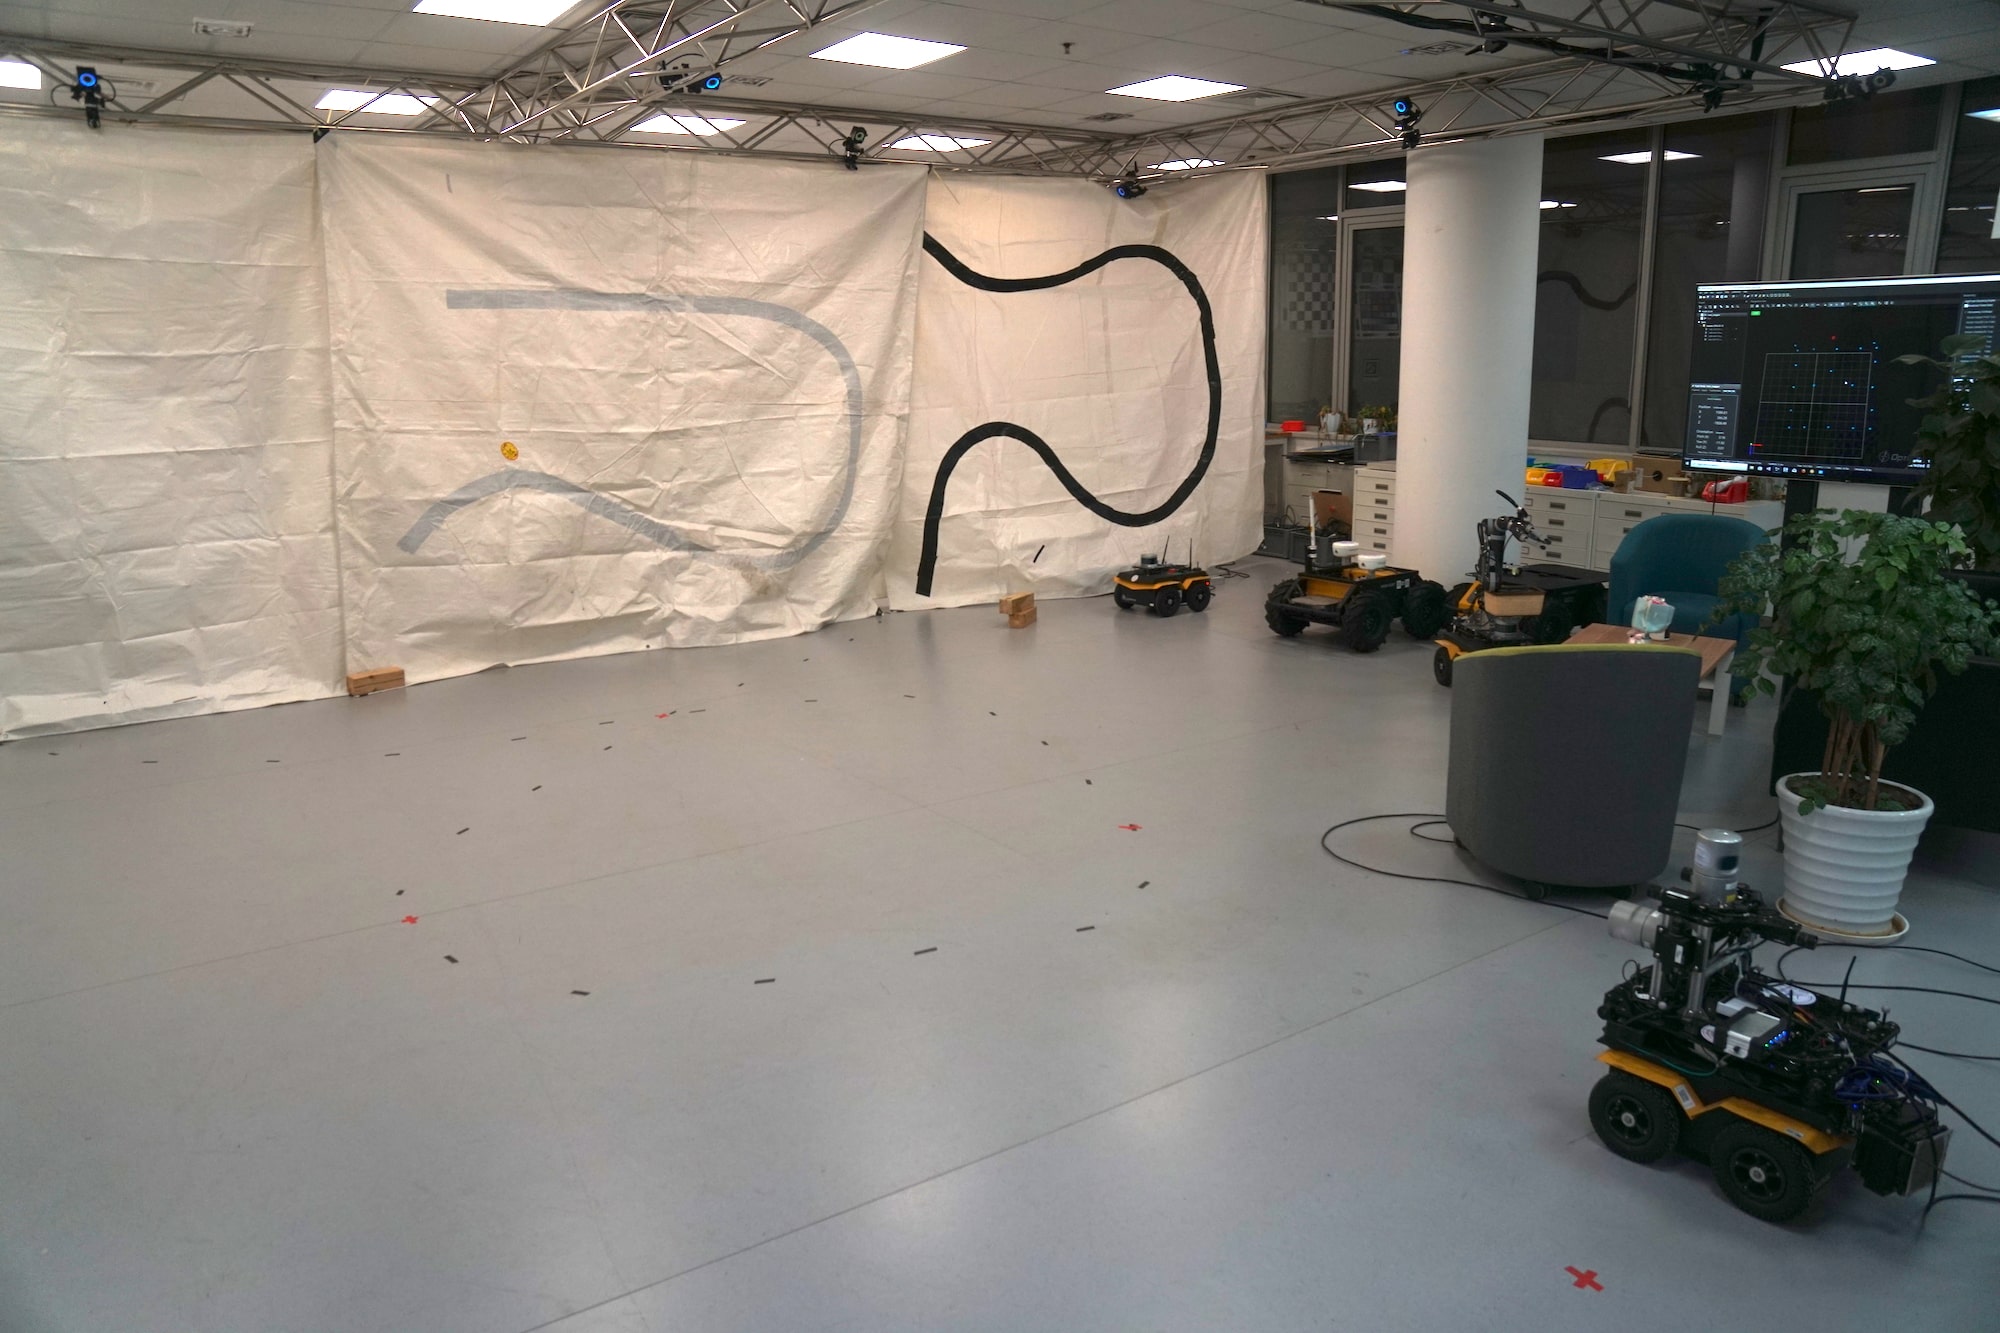
Figure 2 is actually the complete point cloud (480 million points) from the 18 FARO scans we collected (each about 27 million points). We used the FARO Scene software to register the scans. It reported an average error between the scan points of 1.2mm. This is an excellent value and much smaller than the expected sensor noise. The FARO data can thus serve as ground truth for map comparison. The approximate positions of the Faro scans are marked with red crosses on the ground. Most of the scans were taken at a hight similar to the horizontal Velodyne (61 cm). Figure 4 shows the MARS Lab with the markings on the floor, the Faro scanner and the robot. It also shows the curtain for MARS-NoLoop.
We also placed several checkerboards in the lab. Additionally we have many April tags distributed on the ceiling and, in the MARS Lab, also on the walls. In the future we plan to evaluate how well those can be used for localization evaluation of SLAM algorithms. For good measure we also placed other cool robots of the MARS Lab as well as a small living-room arrangement with sofa, plants and TV in the scene.
Dataset statistics:
-
•
MARS-8: 16.4GB; 99 seconds
-
•
MARS-Loop: 50.7GB; 290 seconds
-
•
MARS-NoLoop: 54.8GB; 315 seconds
-
•
MARS-8-Sample: 500MB, 3 seconds
The datasets are available online 111https://robotics.shanghaitech.edu.cn/datasets/MARS-Dataset. We also provide a very short and small sample dataset from within MARS-8.
IV Evaluation
Scientific results should be reproducible. Since we provide the dataset, we also want to give the reader the possibility to re-create the exact same map (barring differences caused by randomized SLAM algorithms). We are thus providing ROS launch files (start scripts) that generate the maps and other needed information (e.g. the path estimated by the SLAM algorithm). Furthermore, we also want to make it as easy as possible for the user to then evaluate the result, so we provide the according tools on the dataset website.
We apply the following mapping methods to our dataset:
- •
-
•
3D Point Cloud Mapping (with horizontal Velodyne):
-
–
BLAM 222https://github.com/erik-nelson/blam
-
–
BLAM with both Velodynes
-
–
Cartographer (for final version)
-
–
- •
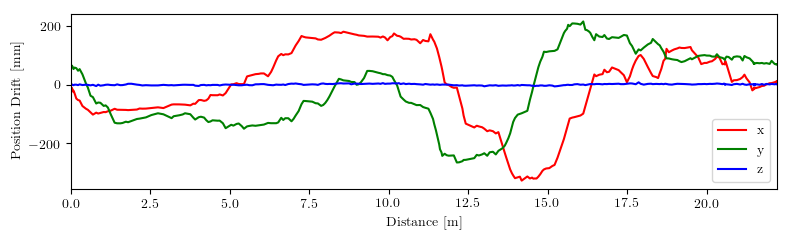
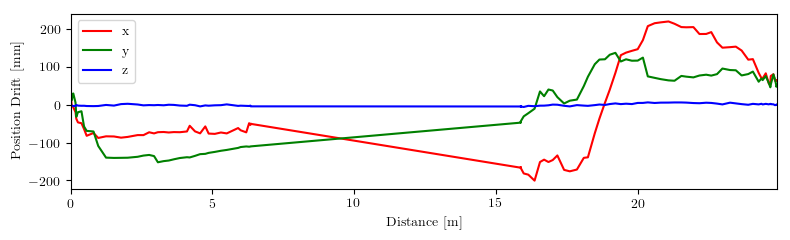
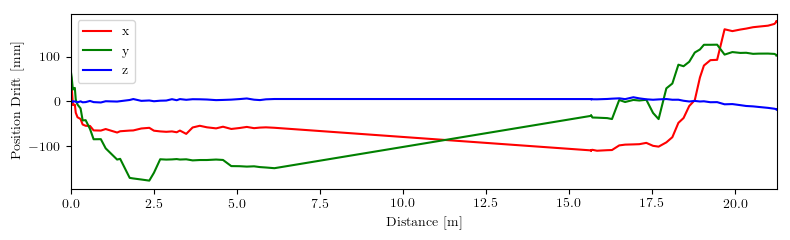
If needed we modify those algorithms to output the time-stamped path data as a text file. The trajectory estimated by the SLAM algorithms is then compared to the trajectory of the tracking system. Of course this only works for the parts of the datasets that were collected inside the tracking system - other parts are omitted (and ”jumped over”). We use the software provided by [5] for the evaluation.
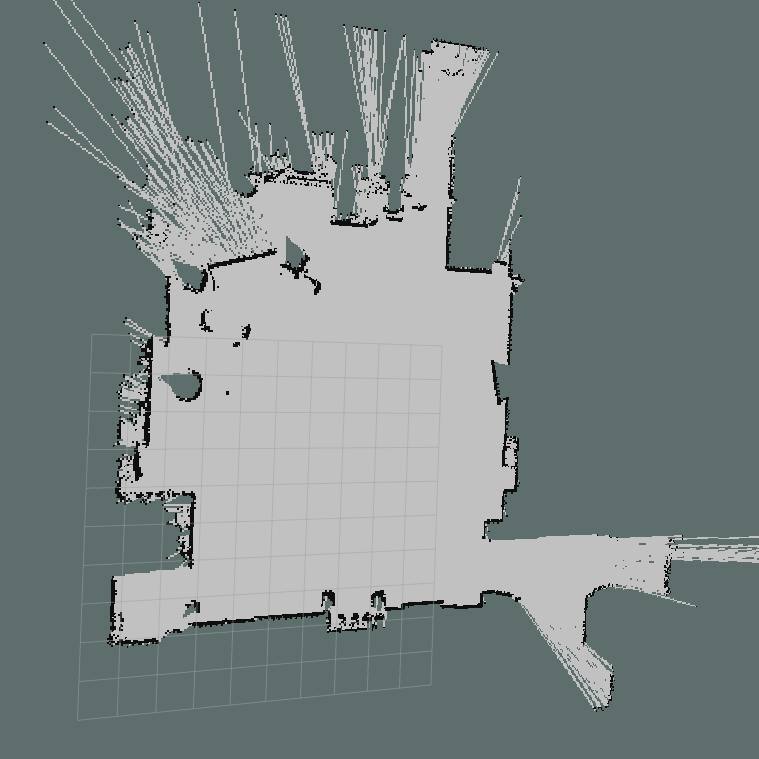
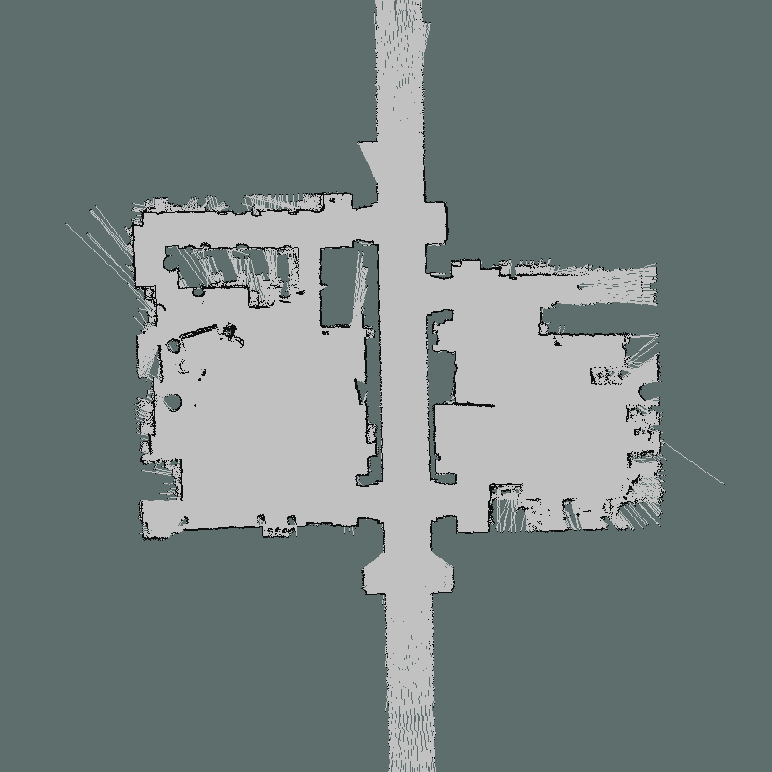
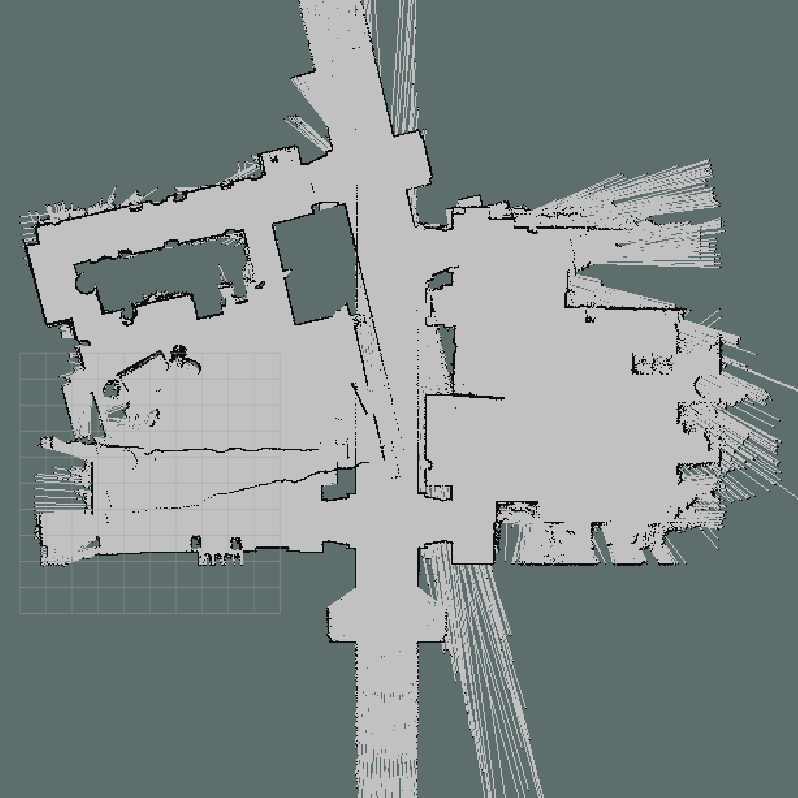
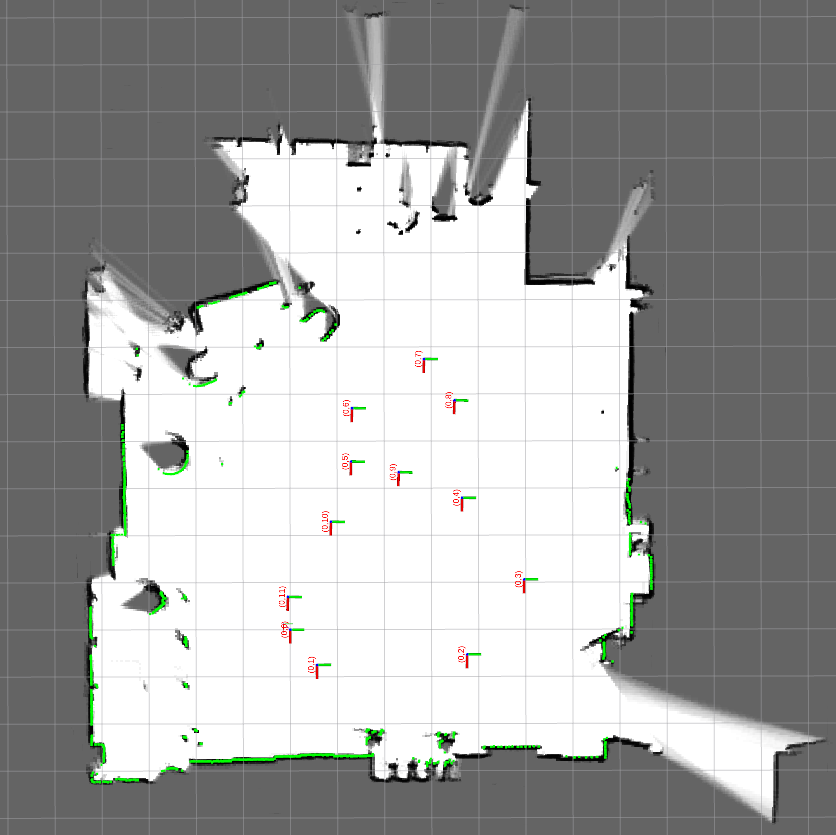
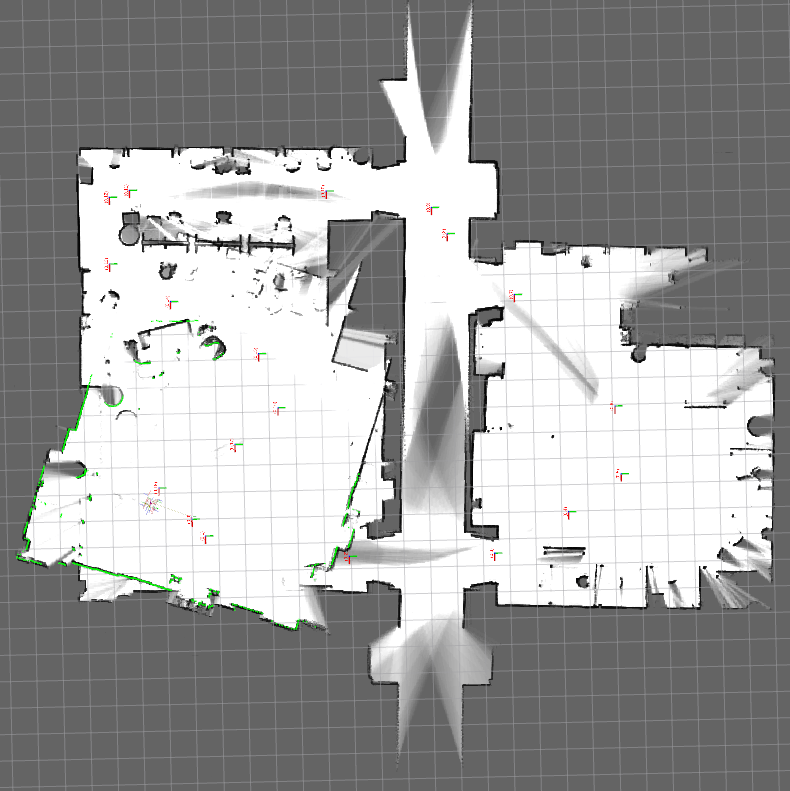
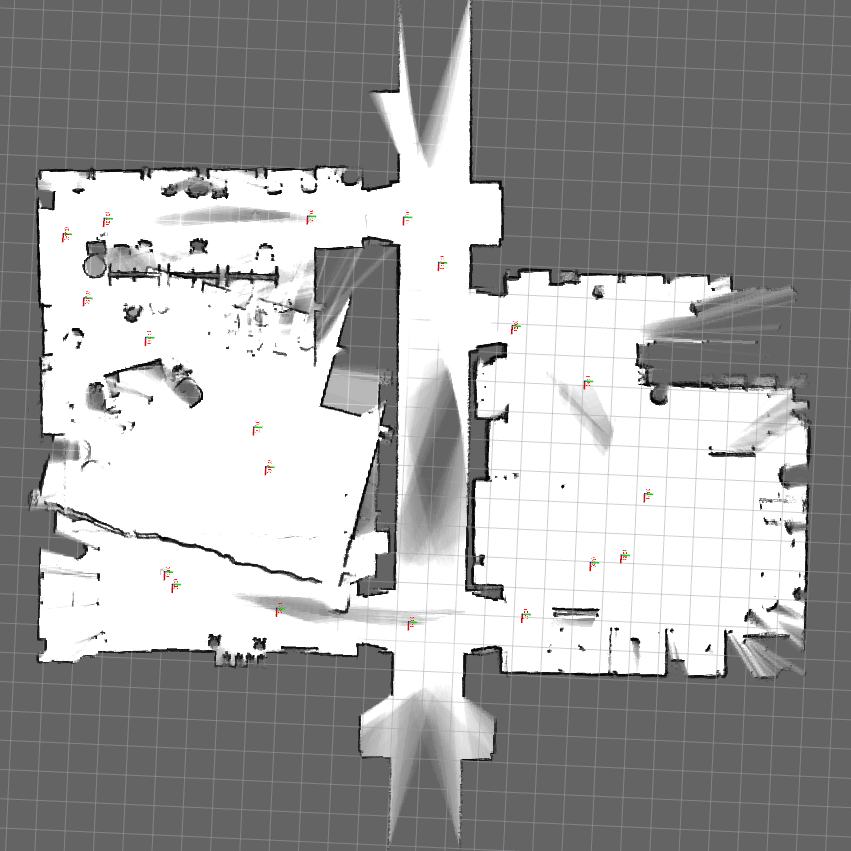
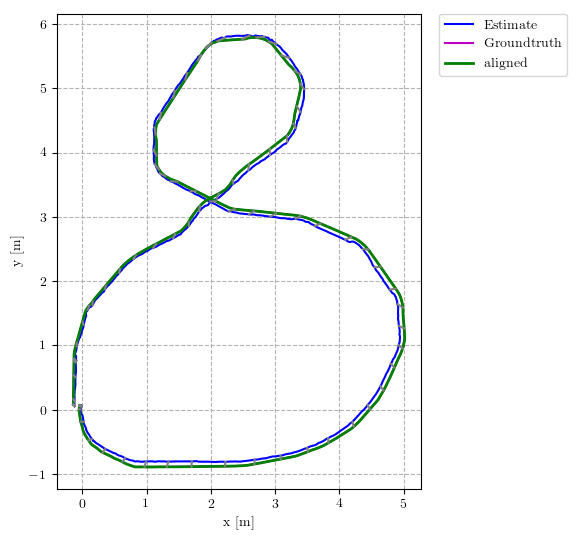
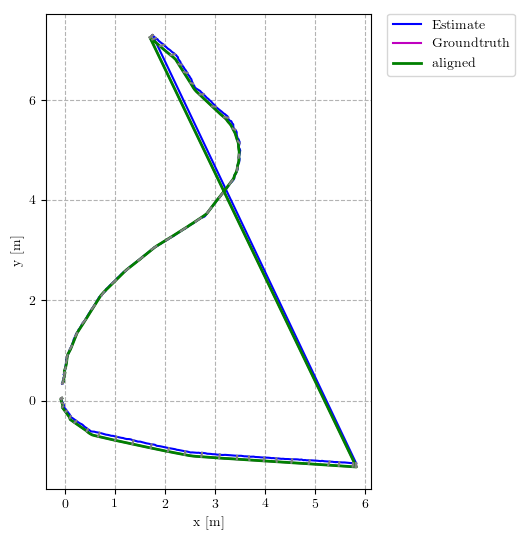
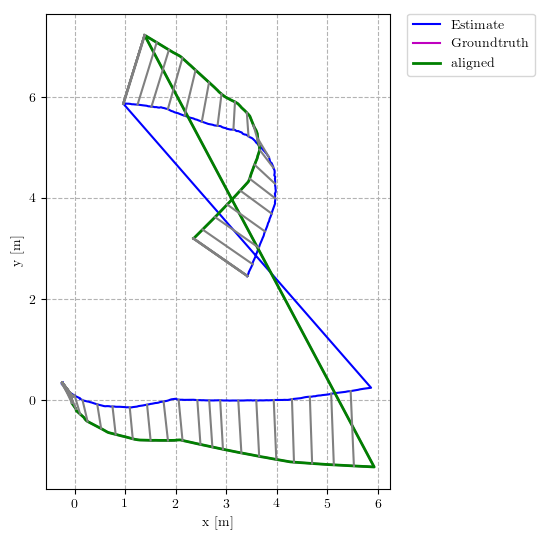
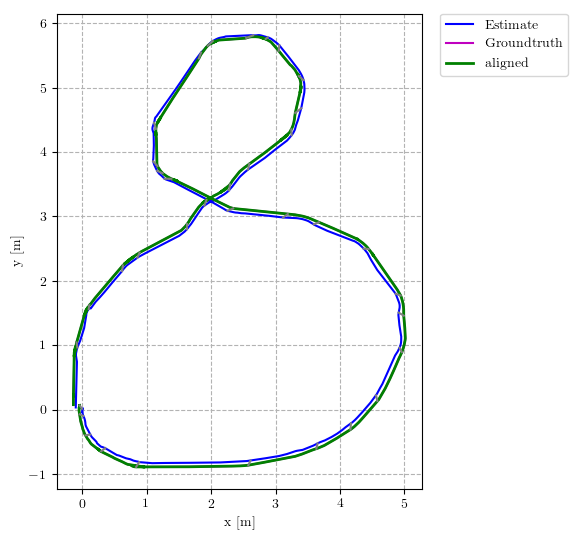
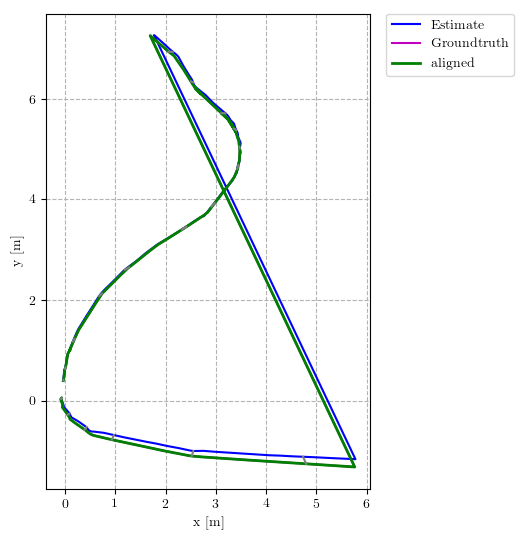
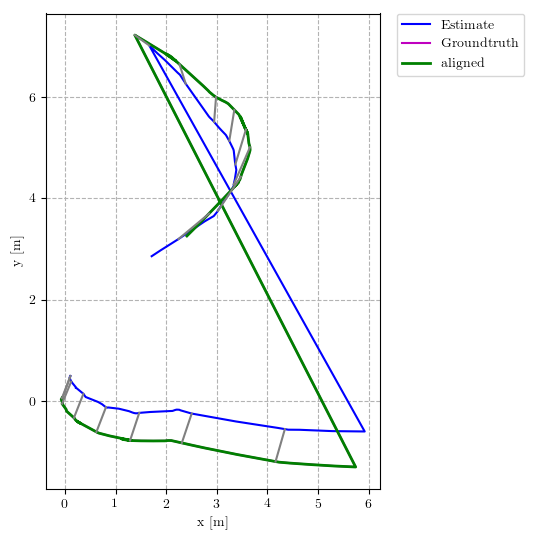
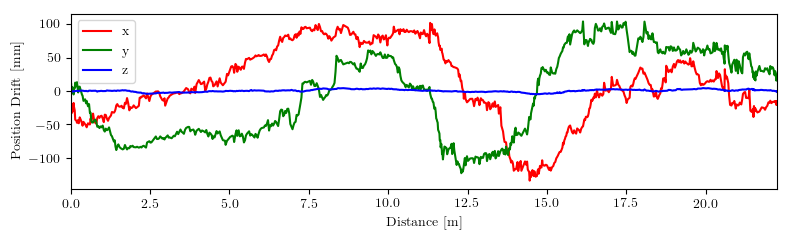
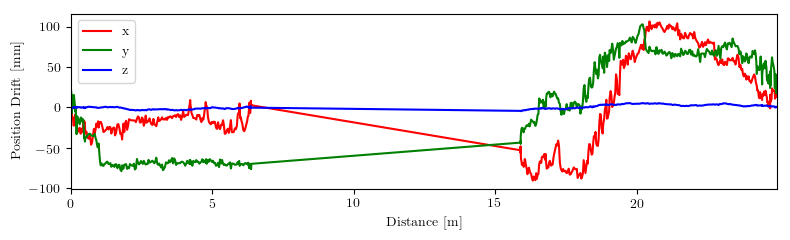
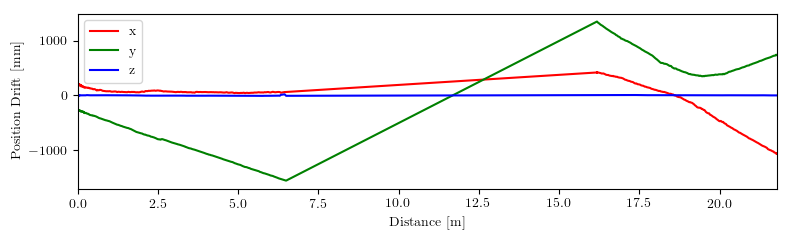
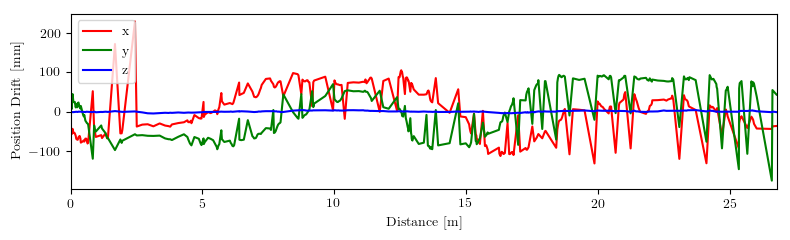
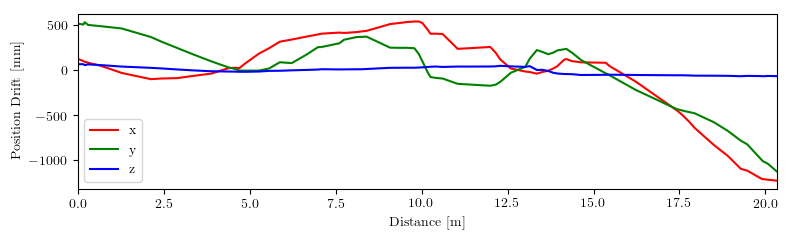
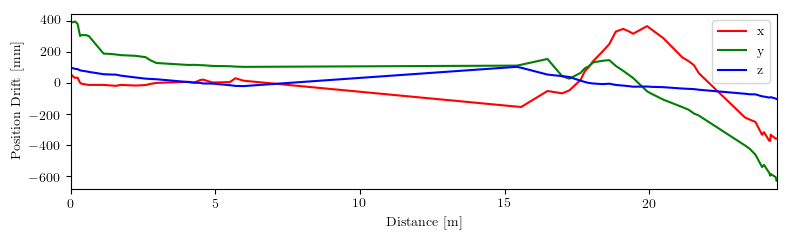
Figure 6 shows the 2D grid maps from Hector Mapping and cartographer. We see that both algorithms have problems when coming back into the MARS lab and no loop closing is possible. Cartographer even has a broken map in MARS-Loop. Figure 6 shows the error in the trajectories between Hector (top) and cartographer (bottom). Again, note the jump from the bottom right corner to the top left in MARS-Loop and MARS-NoLoop: This is where the robot left the tracking system and later re-entered it. We can see that the shown error correlates nicely with the perceived map quality of Figure 6. Figure 10 quantifies the error of Figure 6 in a diagram. It shows absolute errors of 10cm for Hector MARS-8 and -Loop, but values round 1m error for the broken MARS-NoLoop.
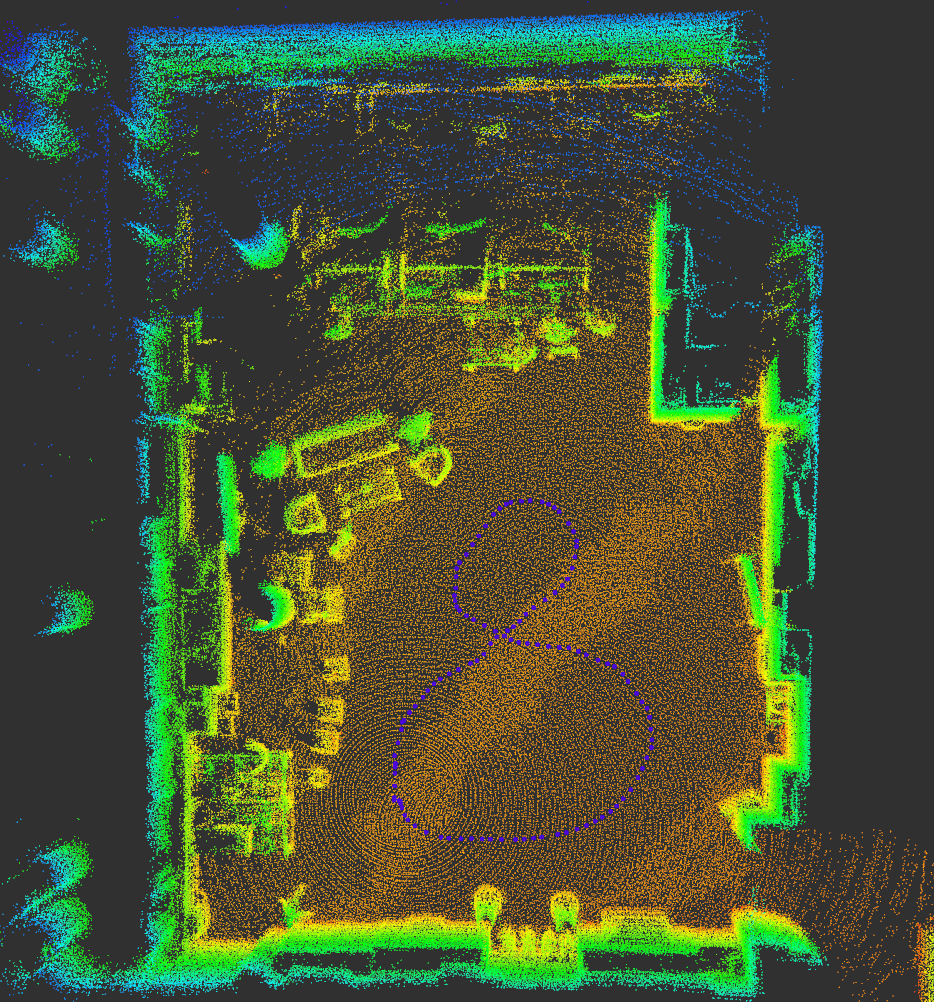
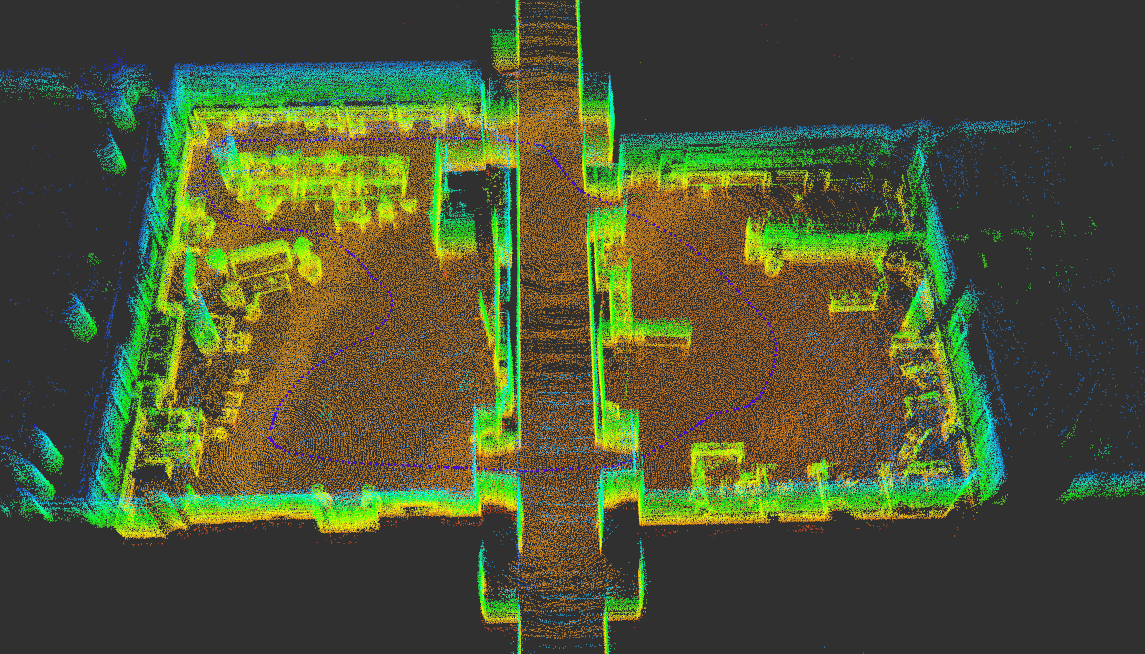
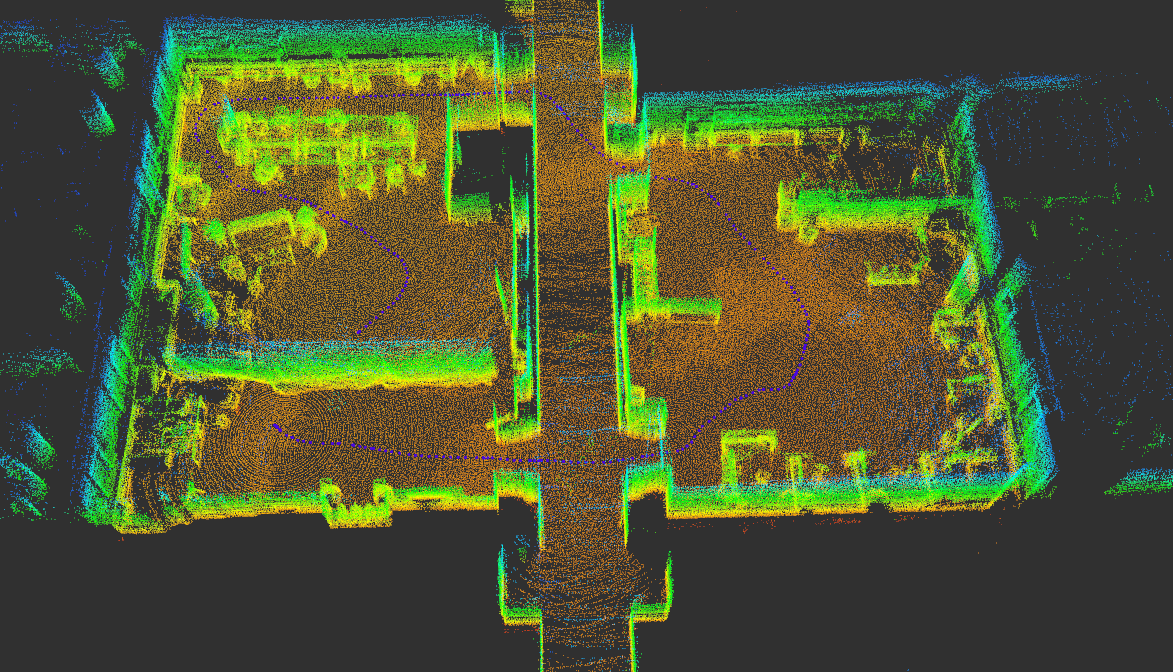
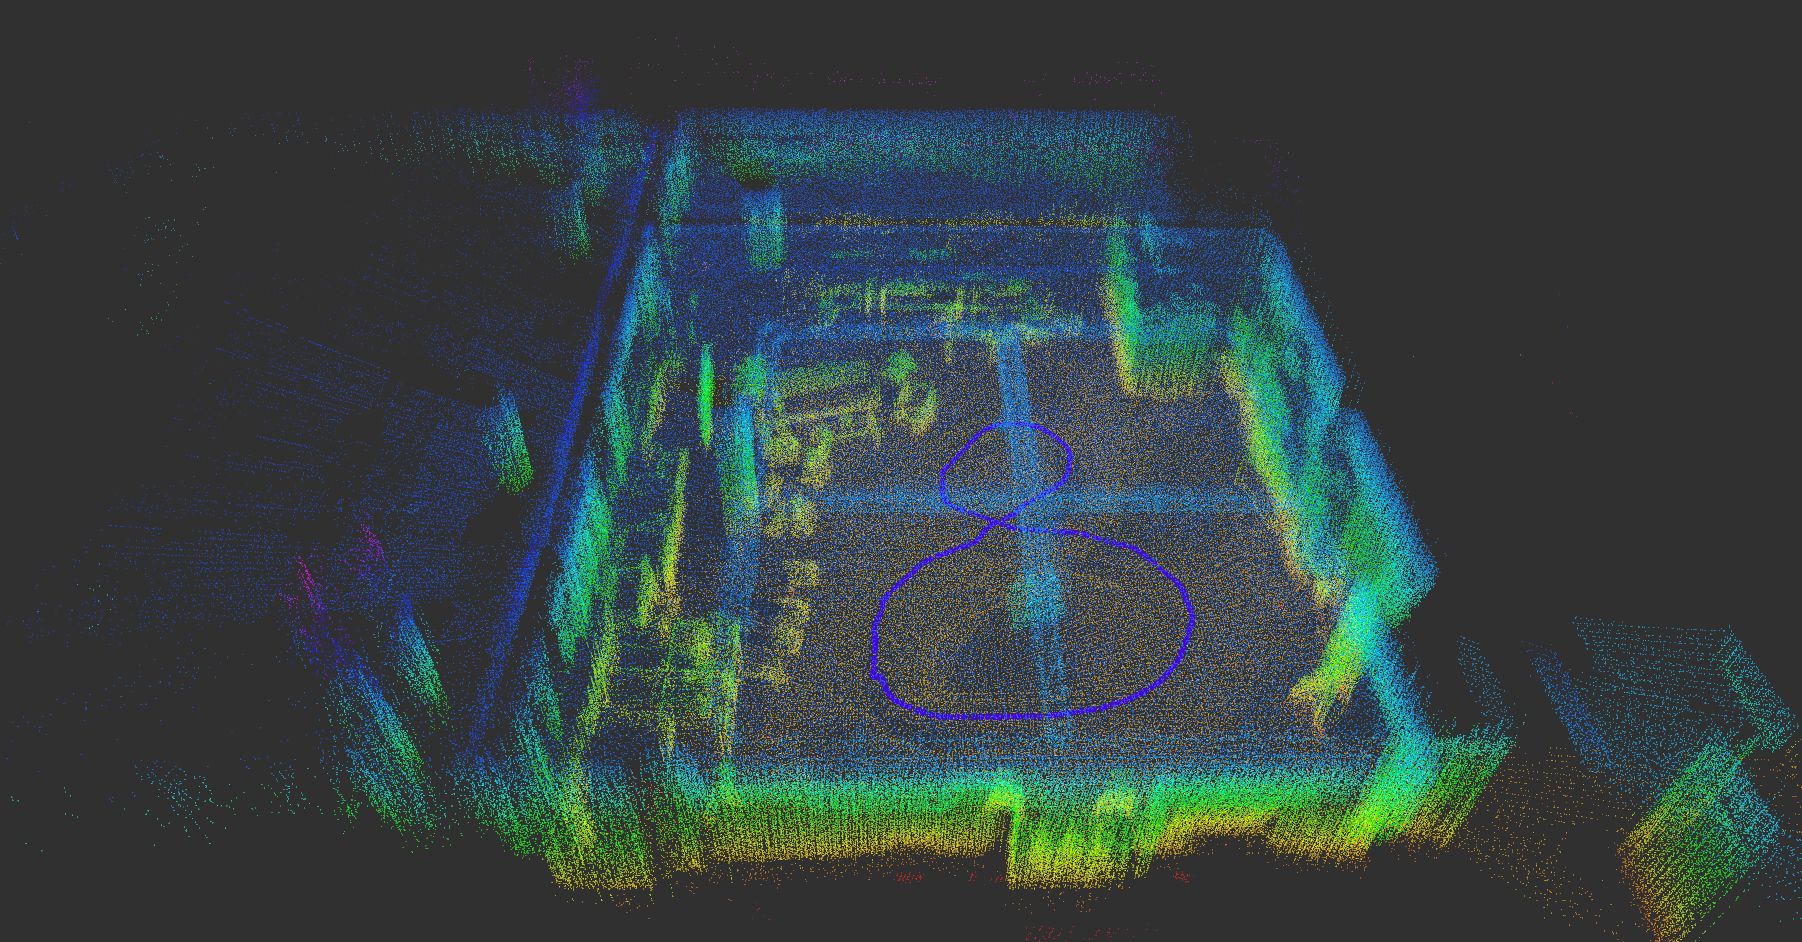
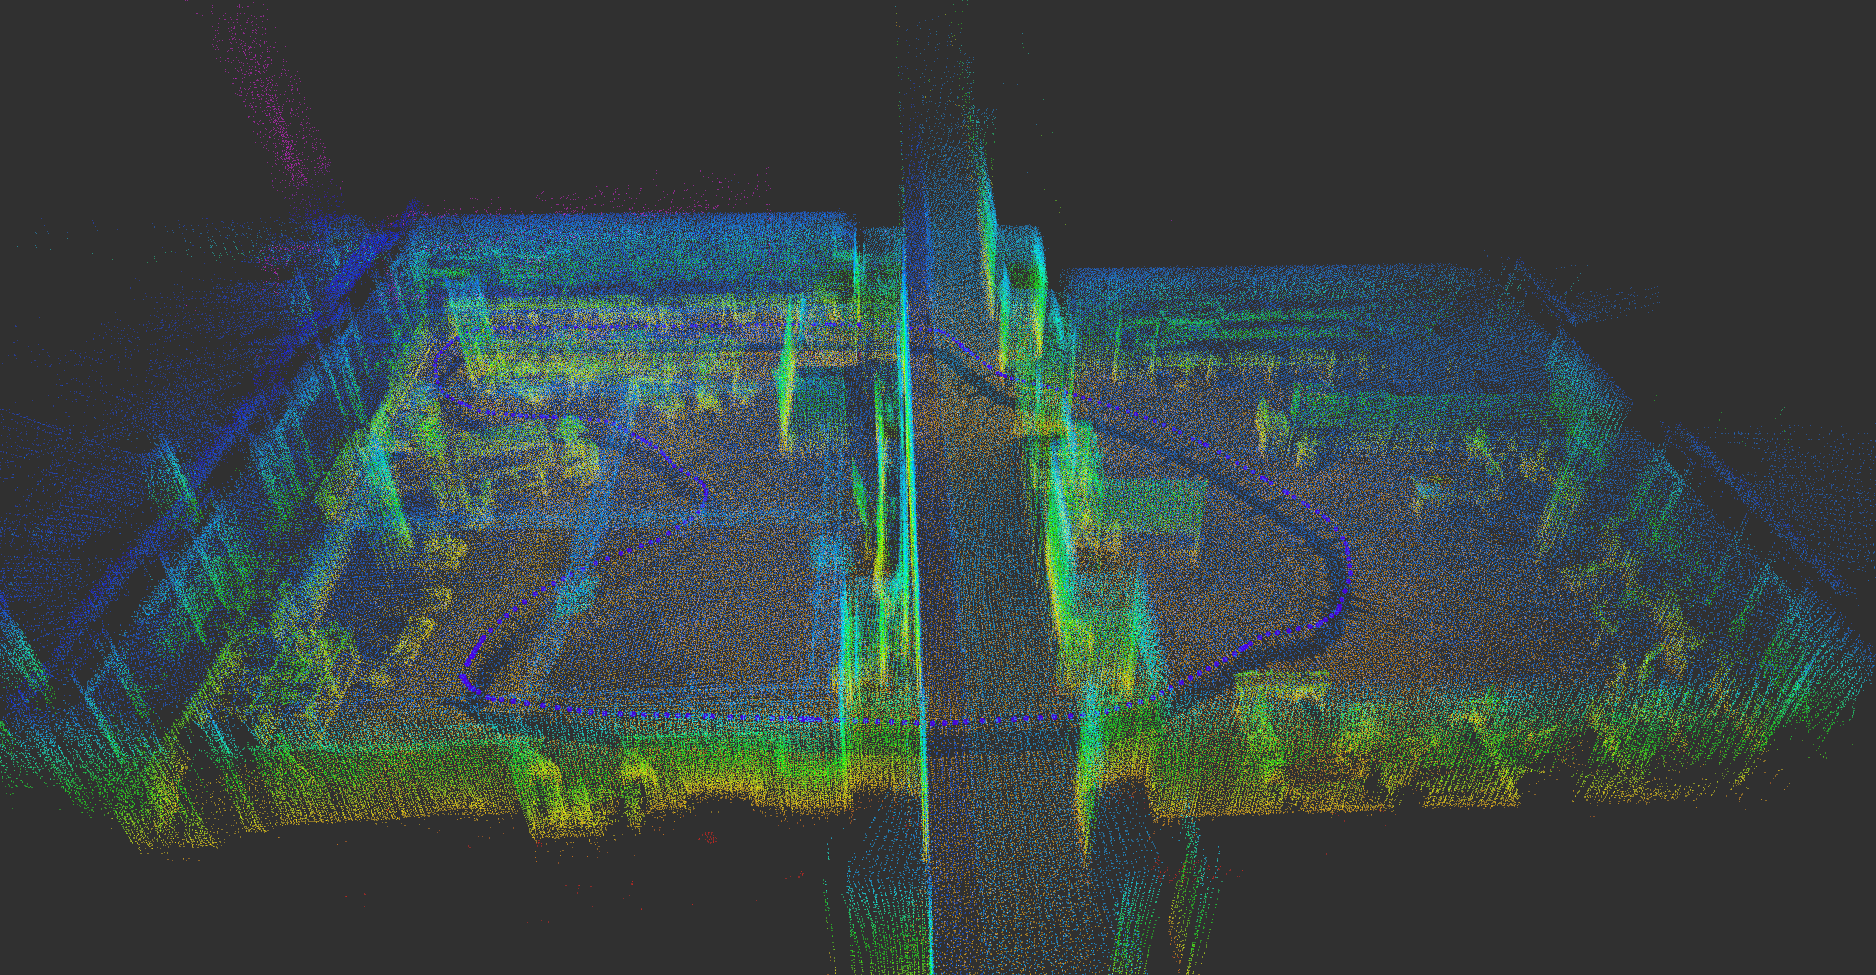
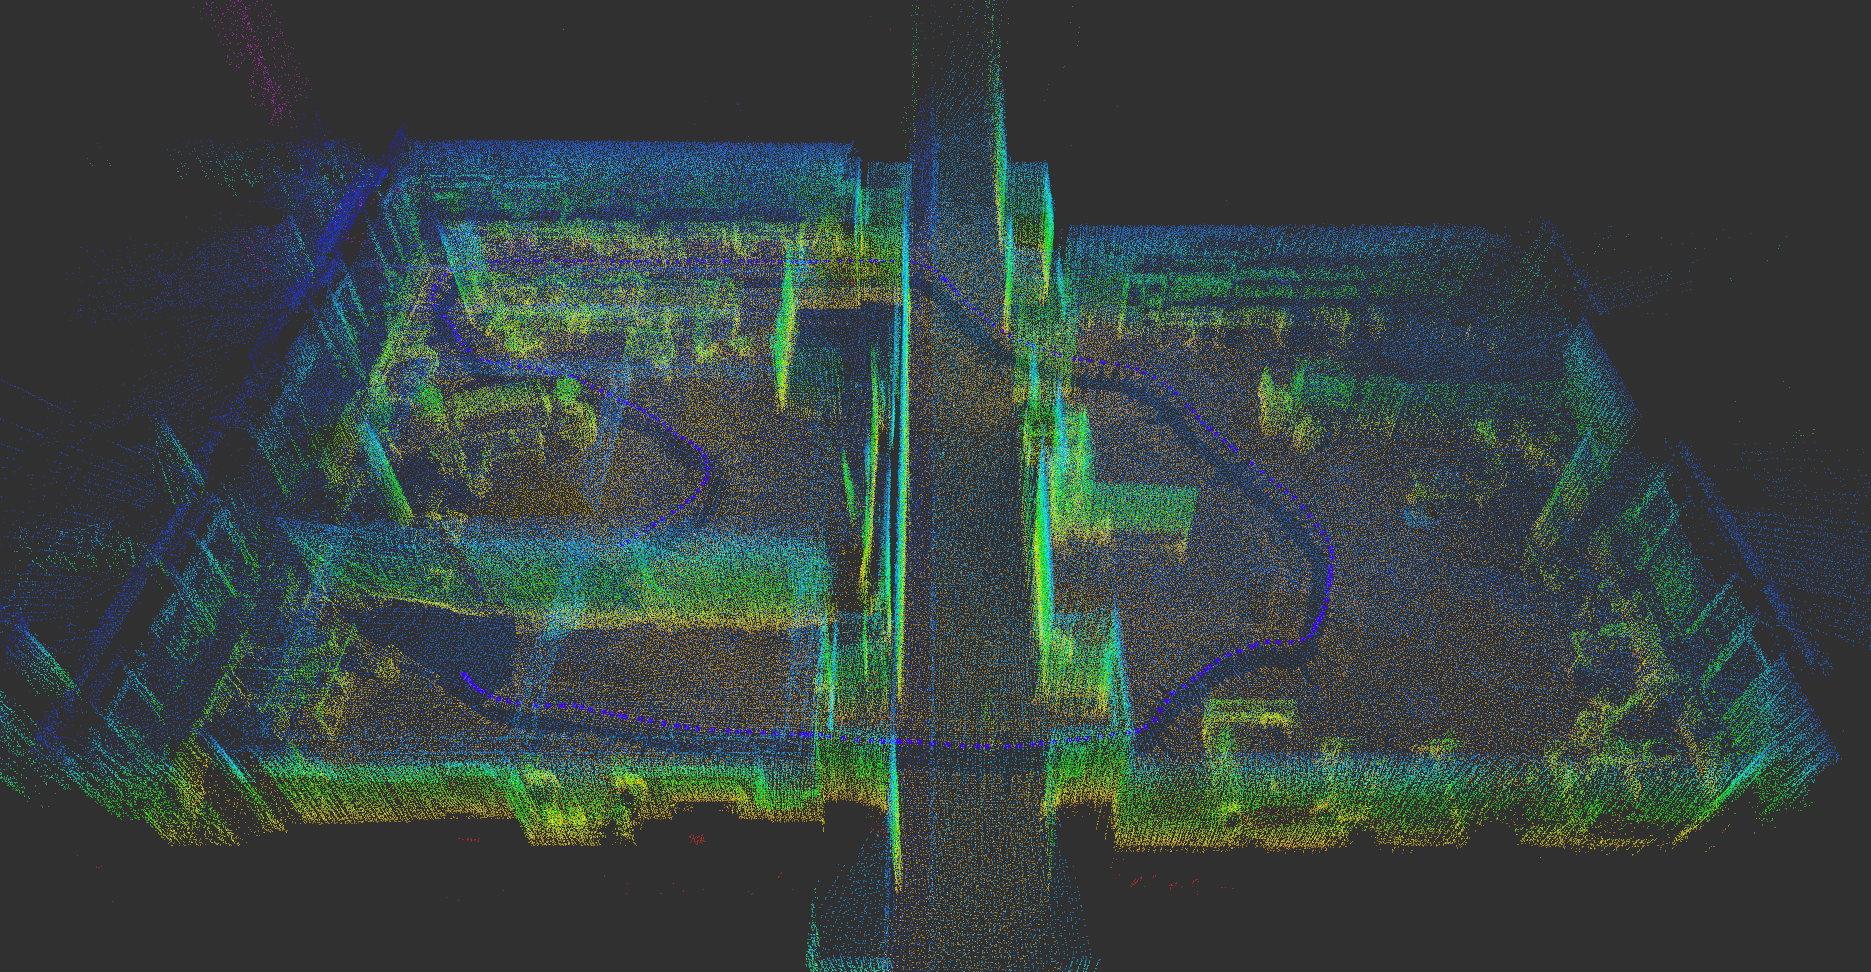
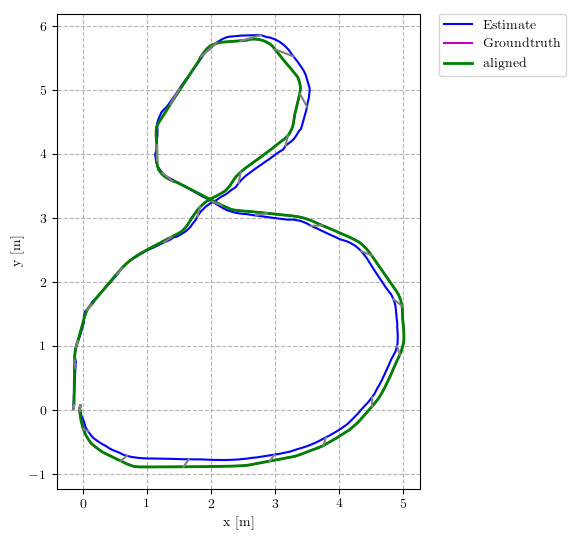
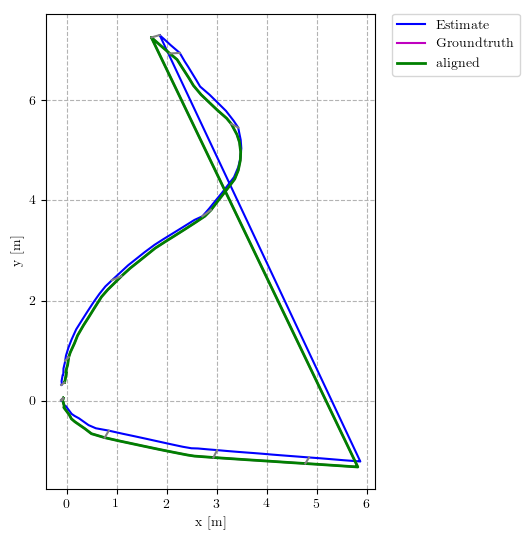
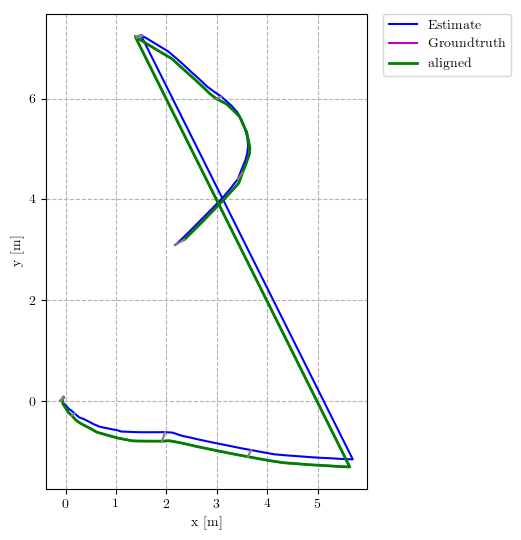
Figure 8 shows the 3D maps generated with BLAM and the horizontal Velodyne. For comparison we include Figure 8, which is generated using the localization estimate from the horizontal BLAM, but only rendering the vertical Velodyne. In the future we will color all the points using the cameras and then do colored point cloud mapping.
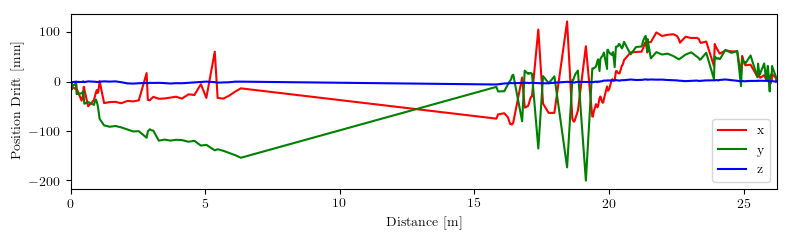
We can make use of the trajectory evaluation shown in Figure 9. We see that the error is low, but looking at Figure 10 we see that it is double the value of the good Hector maps. The pointclouds in Figure 8 are good and nicely the double curtain in MARS-NoLoop.
We have also employed cloudcompare333http://cloudcompare.org/ for quality measurement. We register the Faro point cloud with the robot point cloud and then calculate the RMS. The result is an RMS of 0.084 with a theoretical overlap of 90%. Figure 12 shows the two point clouds overlaid.
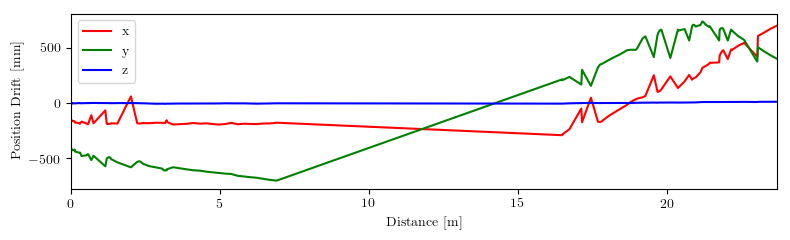
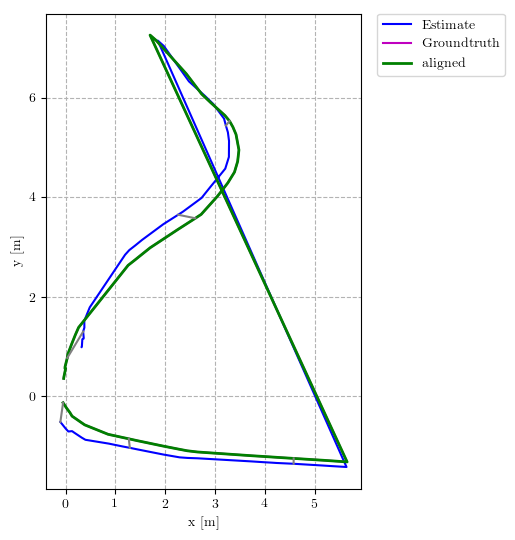
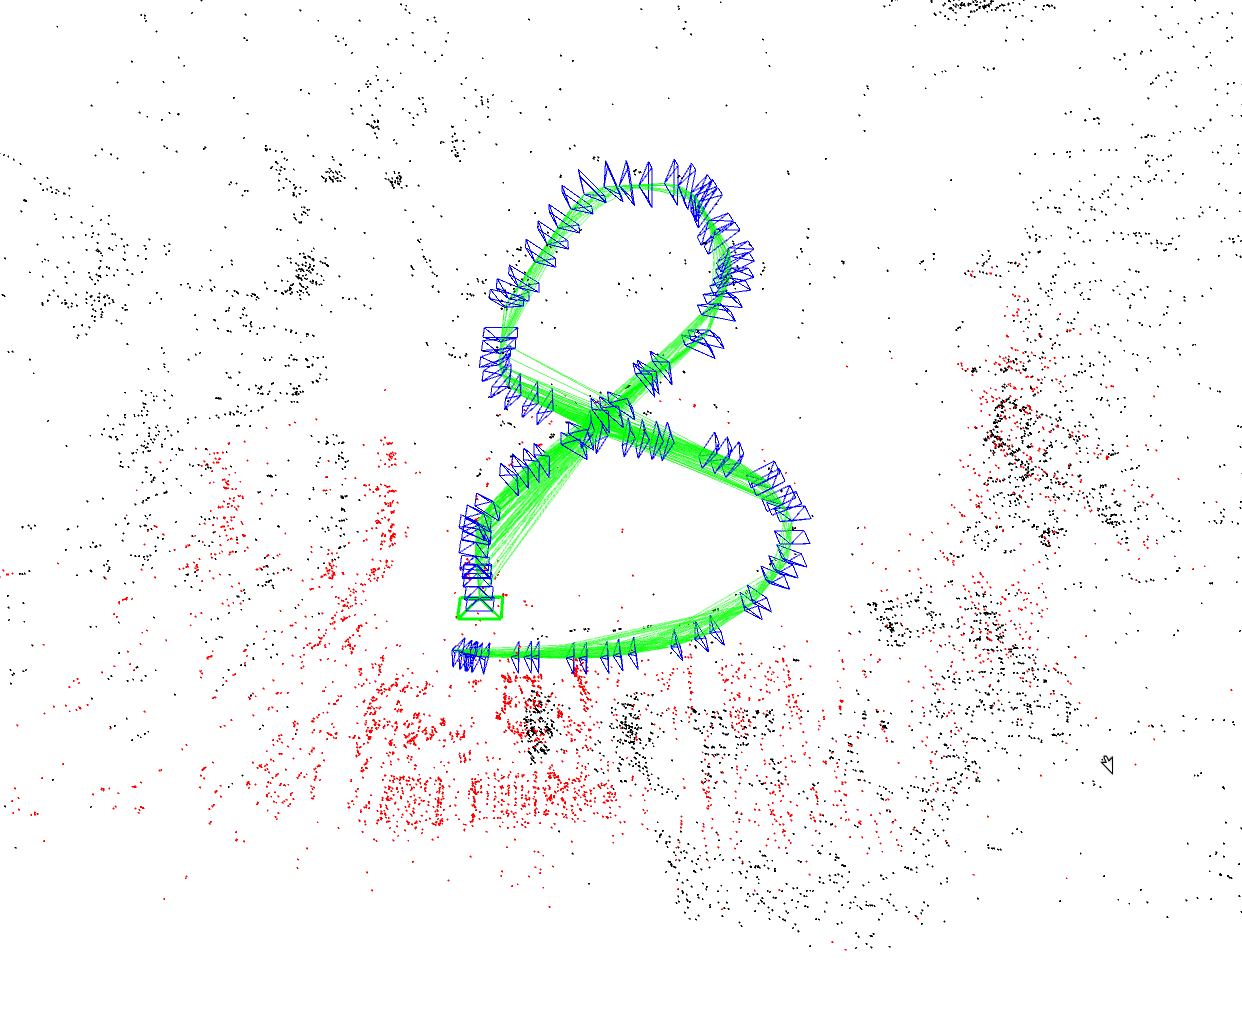
Finally, we see the results of visual SLAM using just one camera (forward-looking on the left side) in Figure 11. It also shows the feature map with camera poses and pose graph. The error shown is biggest compared to the laser based SLAM algorithms. We don’t show results for MARS-NoLoop, because ORB2 lost track already in the other lab.
We will use other visual SLAM algorithms on the dataset in the future, in the hope that they will perform better. Especially when using all 9 cameras we hope to see much improved results. Another option is to explicitly make use of the four stereo camera systems.
V CONCLUSIONS
In this paper we have presented our contributions in three areas: Firstly, we have described a fully hardware-synchronized advanced mapping robot for research on laser-based and visual SLAM. Secondly, we have collected three datasets for SLAM evaluation in short ranges. Thirdly, we provided repeatable evaluation procedures and compared a number of 2D, 3D and visual Simultaneous Localization and Mapping algorithms with each other, using our dataset. The results confirm the intuition, that using loop closures the error of maps can be reduced. We are also able to compare laser-based SLAM algorithms with visual SLAM algorithms and conclude, that, at least for our selection of algorithms, the laser based 3D solution outperforms visual SLAM.
This project is still ongoing. In the final version of this paper we hope to include a few more mapping algorithms (cartographer 3D, 3D SLAM including the vertical Velodyne, other visual SLAM algorithms). We will also improve the evaluation by also employing other algorithms.
References
- [1] C. Cadena, L. Carlone, H. Carrillo, Y. Latif, D. Scaramuzza, J. Neira, I. Reid, and J. J. Leonard, “Past, present, and future of simultaneous localization and mapping: Toward the robust-perception age,” IEEE Transactions on robotics, vol. 32, no. 6, pp. 1309–1332, 2016.
- [2] O. Wulf, A. Nüchter, J. Hertzberg, and B. Wagner, “Ground truth evaluation of large urban 6d slam,” oct. 2007, pp. 650 –657.
- [3] R. Kümmerle, B. Steder, C. Dornhege, M. Ruhnke, G. Grisetti, C. Stachniss, and A. Kleiner, “On measuring the accuracy of slam algorithms,” Autonomous Robots, vol. 27, no. 4, pp. 387–407, 2009.
- [4] W. Burgard, C. Stachniss, G. Grisetti, B. Steder, R. Kummerle, C. Dornhege, M. Ruhnke, A. Kleiner, and J. Tardos, “A comparison of slam algorithms based on a graph of relations,” in Intelligent Robots and Systems, 2009. IROS 2009. IEEE/RSJ International Conference on, 2009, pp. 2089–2095.
- [5] Z. Zhang and D. Scaramuzza, “A tutorial on quantitative trajectory evaluation for visual (-inertial) odometry,” in 2018 IEEE/RSJ International Conference on Intelligent Robots and Systems (IROS). IEEE, 2018, pp. 7244–7251.
- [6] I. Varsadan, A. Birk, and M. Pfingsthorn, “Determining map quality through an image similarity metric,” in RoboCup 2008: Robot WorldCup XII, Lecture Notes in Artificial Intelligence (LNAI), L. Iocchi, H. Matsubara, A. Weitzenfeld, and C. Zhou, Eds. Springer, 2009, pp. 355–365.
- [7] J. Pellenz and D. Paulus, “Mapping and Map Scoring at the RoboCupRescue Competition,” Quantitative Performance Evaluation of Navigation Solutions for Mobile Robots (RSS 2008, Workshop CD), 2008.
- [8] R. Lakaemper and N. Adluru, “Using virtual scans for improved mapping and evaluation,” Auton. Robots, vol. 27, no. 4, pp. 431–448, 2009.
- [9] S. Schwertfeger, A. Jacoff, C. Scrapper, J. Pellenz, and A. Kleiner, “Evaluation of maps using fixed shapes: The fiducial map metric,” in Proceedings of PerMIS, 2010.
- [10] S. Schwertfeger, A. Jacoff, J. Pellenz, and A. Birk, “Using a fiducial map metric for assessing map quality in the context of robocup rescue,” in International Workshop on Safety, Security, and Rescue Robotics (SSRR). IEEE Press, 2011.
- [11] S. Schwertfeger and A. Birk, “Using fiducials in 3d map evaluation,” in IEEE International Symposium on Safety, Security, Rescue Robotics (SSRR), IEEE Press. IEEE Press, 2015.
- [12] ——, “Map evaluation using matched topology graphs,” Autonomous Robots, pp. 1–27, 2015. [Online]. Available: http://dx.doi.org/10.1007/s10514-015-9493-5
- [13] M. Chandran-Ramesh and P. Newman, “Assessing map quality using conditional random fields,” in Field and Service Robotics, Springer Tracts in Advanced Robotics, C. Laugier and R. Siegwart, Eds. Springer, 2008.
- [14] C. Scrapper, R. Madhavan, and S. Balakirsky, “Stable navigation solutions for robots in complex environments,” in IEEE International Workshop on Safety, Security and Rescue Robotics (SSRR), 2007, pp. 1–6.
- [15] J. Sturm, N. Engelhard, F. Endres, W. Burgard, and D. Cremers, “A benchmark for the evaluation of rgb-d slam systems,” in Intelligent Robots and Systems (IROS), 2012 IEEE/RSJ International Conference on, Oct 2012, pp. 573–580.
- [16] A. Handa, T. Whelan, J. McDonald, and A. Davison, “A benchmark for rgb-d visual odometry, 3d reconstruction and slam,” in Robotics and Automation (ICRA), 2014 IEEE International Conference on, May 2014, pp. 1524–1531.
- [17] R. Kümmerle, G. Grisetti, H. Strasdat, K. Konolige, and W. Burgard, “g 2 o: A general framework for graph optimization,” in 2011 IEEE International Conference on Robotics and Automation. IEEE, 2011, pp. 3607–3613.
- [18] S. Kohlbrecher, J. Meyer, O. von Stryk, and U. Klingauf, “A flexible and scalable slam system with full 3d motion estimation,” in Proc. IEEE International Symposium on Safety, Security and Rescue Robotics (SSRR). IEEE, November 2011.
- [19] W. Hess, D. Kohler, H. Rapp, and D. Andor, “Real-time loop closure in 2d lidar slam,” in 2016 IEEE International Conference on Robotics and Automation (ICRA). IEEE, 2016, pp. 1271–1278.
- [20] G. Grisetti, C. Stachniss, W. Burgard et al., “Improved techniques for grid mapping with rao-blackwellized particle filters,” IEEE transactions on Robotics, vol. 23, no. 1, p. 34, 2007.
- [21] G. S. Blair, G. Coulson, N. Parlavantzas, K. Saikoski, A. Andersen, L. Blair, M. Clarke, F. Costa, H. Duran-Limon, T. Fitzpatrick et al., “The design and implementation of open orb 2,” IEEE Distributed Systems Online, no. 6, p. null, 2001.
- [22] M. Labbé and F. Michaud, “Rtab-map as an open-source lidar and visual simultaneous localization and mapping library for large-scale and long-term online operation,” Journal of Field Robotics, 2018.