A Pseudodisk Threaded with a Toroidal and Pinched Poloidal Magnetic Field Morphology in the HH 211 Protostellar System
Abstract
The HH 211 protostellar system is currently the youngest Class 0 system found with a rotating disk. We have mapped it at 50 au () resolution, studying its magnetic field morphology with dust polarization in continuum at 232 and 358 GHz and its kinematics in C18O J=2-1 line. A flattened envelope extending out to 400 au from the disk is detected in the continuum and C18O, slightly misaligned with the disk by 8∘. It is spiraling inwards and expected to transform into a rotating disk at 20 au, consistent with the disk radius estimated before. It appears to have a constant specific angular momentum and itself can result from an inside-out collapse of an extended envelope detected before in NH3. In the flattened envelope, the polarization is mainly due to the magnetically aligned dust grains, inferring a highly pinched poloidal field morphology there. Thus, both the kinematics and field morphology support that the flattened envelope is a pseudodisk formed as the infalling gas is guided by the field lines to the equatorial plane. Interestingly, a point symmetric polarization distribution is also seen in the flattened envelope, implying that the pinched field lines also have a significant toroidal component generated by the rotation. No significant loss of angular momentum and thus no clear magnetic braking are detected in the flattened envelope around the disk probably because of the large misalignment between the axis of the rotation and the axis of the magnetic field in the cloud core.
1 Introduction
Magnetic field can produce efficient magnetic braking that can affect star formation in the early phase. In particular, magnetic braking can reduce angular momentum efficiently from a collapsing and rotating envelope, preventing formation of a Keplerian rotating disk around a protostar, only allowing a pseudodisk to be formed (Allen, Li, & Shu, 2003; Mellon & Li, 2008). Fortunately, a misalignment between magnetic field axis and rotation axis (Hennebelle & Ciardi, 2009; Li et al., 2014; Väisälä et al., 2019; Hirano & Machida, 2019) and non-ideal MHD effects, e.g., ambipolar diffusion (Masson et al., 2016) and Ohmic dissipation (Machida & Matsumoto, 2011), can reduce magnetic braking, enabling formation of a Keplerian rotating disk. Recent observations at high angular resolutions have already detected Keplerian rotating disks as early as in Class 0 systems, e.g., L1527 (Tobin et al., 2012; Sakai et al., 2014; Ohashi et al., 2014), HH 212 (Lee et al., 2017a, b), and likely HH 211 (Lee et al., 2018c), supporting these possibilities. On the other hand, other observations have also shown a significant decrease of angular momentum in the HH 111 protostellar system (Lee, 2010; Lee et al., 2016), supporting a possible magnetic braking. However, the detection of a Keplerian rotating disk in that system (Lee, 2011) also suggested that the magnetic braking, if present, does not suppress formation of a disk, but may constrain the growth of the disk.
Dust polarization observations in millimeter and submillimeter wavelengths have been used to map the magnetic fields in young protostellar systems in order to determine the effect of the magnetic field on disk formation in the beginning of star formation. Early survey with 4 Class 0 systems showed that magnetic field axis in the envelopes is more or less aligned with the outflow axis (Chapman et al., 2013). However, with a larger sample of 16 Class 0 and I systems, Hull et al. (2013) found that the magnetic field axis in the envelopes is not necessarily to be aligned with the outflow axis at 1000 au scale. Assuming that the rotation axis in the envelope is aligned with the outflow axis at 1000 au scale, then the magnetic field axis in the envelopes is not necessarily to be aligned with the rotation axis of the envelopes. Since the amount of magnetic braking depends on the alignment of the magnetic field axis and the rotation axis in the cloud core/envelope (Joos et al., 2012), this suggests a different degree of magnetic braking in different systems, affecting the disk formation and growth in different levels. Moreover, detailed mapping toward a few young Class 0 systems, e.g., B335 (Maury et al., 2018) and L1448 IRS2 (Kwon et al., 2019), have detected a pinched poloidal or hour-glass field morphology from a 1000 au scale down to a 100 au scale, suggesting that magnetic field lines are affecting the infall motion and are dragged in more along the equatorial plane than in other directions. In these Class 0 systems, since the magnetic field axis in the envelopes is more or less aligned with the outflow axis, there should be significant magnetic braking. Since a presence of a small disk has been hinted at the center in L1448 IRS2 (with a radius au, Tobin et al., 2015) and B335 (with a radius au, Yen et al., 2015), non-ideal MHD effects may be needed in these systems to reduce the magnetic braking efficiency, allowing a small disk to be formed at the center, as suggested in the older system HH 111 (Lee et al., 2016).
Here, we report the dust polarization observations and envelope kinematics towards the HH 211 protostellar system, which is one of the youngest Class 0 systems with a rotating disk (Lee et al., 2018c), in order to determine the effect of the magnetic field on disk formation in the earliest phase. This system is located at 321 pc away from us (Ortiz-León et al., 2018). A collimated magnetized jet (Lee et al., 2018a) and a collimated outflow (Gueth & Guilloteau, 1999; Lee et al., 2007) are seen extending out from around the protostar, defining the rotation axis in the system. This system seems to have a dynamical collapsing radius of only 1000 au (Tanner & Arce, 2011), however, a detection of an infall motion in the envelope is needed to confirm it. A marginally resolved disk has been detected at the center with the Karl G. Jansky Very Large Array (VLA) (Segura-Cox et al., 2018). Observations with Atacama Large Millimeter/submillimeter Array (ALMA) at higher resolution have resolved it and found it to be rotating around the protostar, with a small radius of 20 au (after updated for the new distance, Lee et al., 2018c). Previous observations with JCMT towards its associated cloud core have revealed a uniform magnetic field morphology at a 10,000 au scale, with the field lines roughly north-south oriented and thus with an axis misaligned with the jet axis by 60∘ (Matthews et al., 2009). At a smaller scale of a 1000 au, the field lines are still aligned with those in the larger scale without any clear pinched field morphology (Hull et al., 2014), in agreement with the source having a small dynamical collapsing radius. Further observation within 400 au of the central source at 200 au resolution started to show a hint of a possible pinching and twisting of magnetic field due to infall and rotation (Lee et al., 2014b). Here we zoom in to the same inner region to examine the pinching and twisting at 50 au ( ) resolution and study the effect of the magnetic field on disk formation.
2 Observations
Polarization observations of HH 211 were executed in Cycle 4 with ALMA at 350 GHz in Band 7 and 230 GHz in Band 6. The project number was 2016.1.00017.S (PI: Chin-Fei Lee).
2.1 Band 7
HH 211 was observed in Band 7 with two executions on 2016 October 10, with 43 antennas in C40-7 configuration and a total time of 77 minutes. It was observed with one single pointing towards the central source. The primary beam had a size of . The projected baselines were 20-1570 m. The maximum recoverable scale was . There were 5 spectral windows in the correlator setup (see Table 1). Here, we only report the results in continuum for the envelope and disk.
We used the CASA package (versions 4.7) to calibrate the data. Quasars J0238+1636, J0237+2848 ( 0.833 Jy), J0336+3218 ( 0.517 Jy), and J03344008 ( 0.415 Jy) were used to calibrate the flux, the passband, the gain, and the polarization, respectively. In order to improve the map fidelity, we also did a phase-only self-calibration on the data with the continuum intensity (Stokes I) map. A visibility weighting with a robust factor of 0.5 was used to make the continuum maps (including Stokes I, Q, and U parameters). The resulting synthesized beam (resolution) has a size of . Since the envelope and disk were detected only within of the central source, we did not perform any primary beam correction on the maps. The Stokes I map has a noise level of 0.16 mJy beam-1. The Stokes Q and U maps have a noise level of 0.07 mJy beam-1.
2.2 Band 6
HH 211 was also observed in Band 6 with two executions on 2017 August 08, with 46 antennas in C40-8 configuration and a total time of 63 minutes. It was observed with one single pointing towards the central source. The primary beam had a size of . The projected baselines were 20-3270 m. The maximum recoverable scale was . There were 6 spectral windows in the correlator setup (see Table 2). Here, we only report the results in continuum and C18O for the envelope and disk.
We used the CASA package (versions 4.7) to calibrate the data. Quasars J0238+1636, J0237+2848 ( 1.219 Jy), J0336+3218 ( 0.823 Jy), and J05223627 ( 6.05 Jy) were used to calibrate the flux, the passband, the gain, and the polarization, respectively. In order to improve the map fidelity, we also did a phase-only self-calibration on the data with the continuum intensity (Stokes I) map. A visibility weighting with a robust factor of 0.5 was used to make the continuum maps (including Stokes I, Q, and U parameters) and the C18O channel maps. The resulting synthesized beam (resolution) has a size of in continuum and in C18O. Since the envelope and disk were detected only within of the central source, we did not perform any primary beam correction on the maps. For the continuum, the Stokes I map has a noise level of 0.030 mJy beam-1, while the Stokes Q and U maps have a noise level of 0.018 mJy beam-1. The velocity resolution and noise level in the C18O channel maps are 0.2 km s-1 per channel and 1.8 mJy beam-1, respectively.
2.3 Polarization Measurements
Polarization intensity is bias-corrected with , where is the noise in the unbiased polarization intensity. Thus, we consider it a detection if . Polarization degree (fraction) is defined as . Polarization orientations are given by the vectors. Based on the ALMA Cycle 4 Technical Handbook, we can achieve an accuracy better than 0.3% (3) in polarization detection within the inner 1/3 of the primary beam.
3 Results
In this system, the jet has a position angle (P.A.) of 116.6∘ (Lee et al., 2009) and is inclined at 9∘ to the plane of the sky, with its southeastern side tilted slightly away from it (Jhan & Lee, 2016). The outflow has roughly the same axis as the jet (Gueth & Guilloteau, 1999; Lee et al., 2007). The disk has a radius of 20 au and a major axis with a P.A. of 27.6∘ (Lee et al., 2018c). Thus, the disk is almost perpendicular to the jet axis and should be nearly edge-on with an inclination of 81∘ to the plane of the sky, with its nearside tilted slightly towards the northwest. The central protostar is located at and , as previously found at resolution (Lee et al., 2018c).
3.1 Continuum Intensity Maps
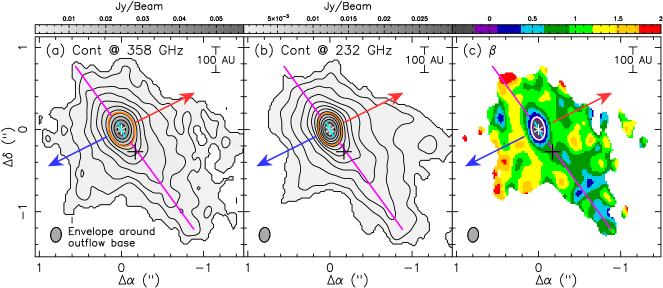
Figure 1 shows the continuum intensity maps toward the center at 358 and 232 GHz. The maps were made with the same range of 24 to 1850 and then convolved to the same angular resolution of for comparison and dust opacity index calculation below. The continuum emission is detected in roughly the same regions with a similar morphology at the two frequencies. It is highly peaked at the center due to the bright compact disk (Lee et al., 2018c). It extends to the northeast and to the southwest from the central source, tracing a flattened envelope with a major axis at a P.A. 36∘ (as indicated by the magenta lines), slightly rotated counterclockwise by 8∘ from the disk major axis (as indicated by the cyan lines). The envelope has a brightness temperature of less than 5 K, except for the central region inside the orange contours shown in Figures 1a and 1b. The flattened envelope is asymmetric, extending more to the southwest. It could be due to a secondary source (marked with a cross) previously detected at to the southwest in the flattened envelope with the Submillimeter Array (SMA) at a slightly lower resolution (Lee et al., 2009). However, this secondary source is not confirmed here and thus further observation is needed to check the existence of it. The continuum emission also traces the envelope material around the outflow base (as indicated in Figure 1a) previously detected in CO (Gueth & Guilloteau, 1999; Lee et al., 2007), forming a small U-shaped shell-like structure opening to the southeast around the jet axis. A possible similar shell-like structure is also seen extending to the northwest around the jet axis, especially at 232 GHz, but not as clear as that seen extending to the southeast.
3.2 Spectral Index and Dust Opacity Index
The morphology of the continuum emission is similar at the two frequencies, allowing us to derive the spectral index of the continuum with the following formula:
| (1) |
where is the specific intensity, GHz, and GHz. Then we estimate the dust opacity index with , assuming Rayleigh-Jean limits for the two frequencies. As shown in Figure 1c, within of the center (as marked by the white contour) because the disk there is optically thick (Lee et al., 2018c) and hence the dust opacity index can not be derived properly. In the envelope outside the disk region, we have 1 mostly. Similar values have also been found before in the envelopes of the Class 0 sources (Kwon et al., 2009) and the Class I sources (Agurto-Gangas et al., 2019), suggestive of some degree of grain growth in the envelopes.
3.3 Polarization Detections
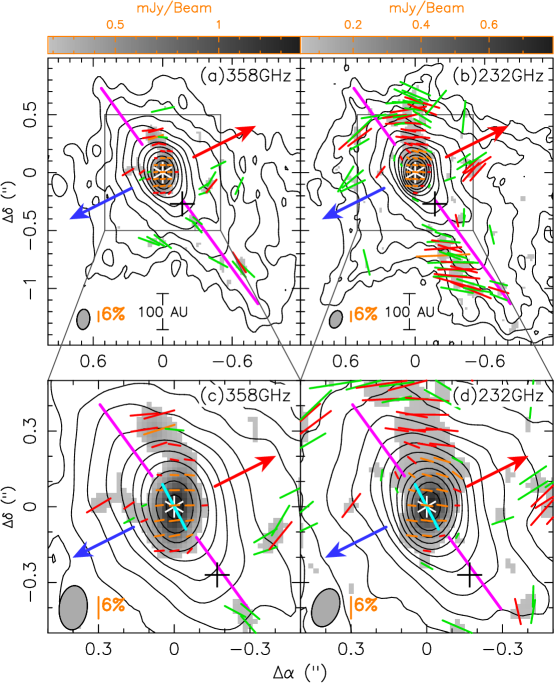
Polarized dust emission is detected at both frequencies, with more detections at 232 GHz because of a higher sensitivity (i.e., a lower noise level), arising roughly from the same regions, as shown in Figure 2. It is clearly detected towards the optically thick region within of the center, where the disk is located, and extends to the northeastern envelope. There are also patchy detections in the southwestern envelope and some other regions. The polarization degree is 2% at the center where the disk is located and it increases to more than 10% going away from the disk to the outer edges of the envelope. Such a rapid increase in polarization degree from the disk to the envelope has also been seen in a survey of 10 protostellar systems (Cox et al., 2018), and can be used to discriminate the polarization mechanism between the disk and the envelope. Comparing Figure 2c with Figure 2d, we find that the polarization orientations at the center are roughly the same at the two frequencies, oriented roughly in the east-west direction, with those at 358 GHz being slightly more aligned with the minor axis of the disk than those at 232 GHz by 8∘. Going away to the northeastern envelope from the center, the polarization orientations rotate counter-clockwise to be more perpendicular to the major axis of the flattened envelope. In the southwestern envelope, polarizations at 358 GHz are detected along the midplane, with their orientations roughly parallel to the major axis of the envelope. On the other hand, the polarizations at 232 GHz are slightly away from the midplane, with their polarizations roughly east-west orientated. Interestingly, there is a clear point symmetry in the polarization distribution at 232 GHz in the envelope along the equatorial plane, with fewer detections on the east side of the northeastern envelope and fewer detections on the west side of the southwestern envelope. In addition, there seems to be a polarization hole at both frequencies centered at the tentative secondary source. Moreover, almost no polarization is detected along the outflow axis more than above and below the central source.
3.4 Envelope Kinematics in C18O
In our observations at 232 GHz, C18O J=2-1 line was also observed simultaneously, allowing us to determine the kinematics of the envelope and how it affects the field morphology to be inferred from the polarizations. The systemic velocity was previously found to be km s-1 in Tanner & Arce (2011). It is refined slightly here to be km s-1 LSR in order to fit the C18O kinematics, as discussed later. In order to simplify our presentations, we define an offset velocity .
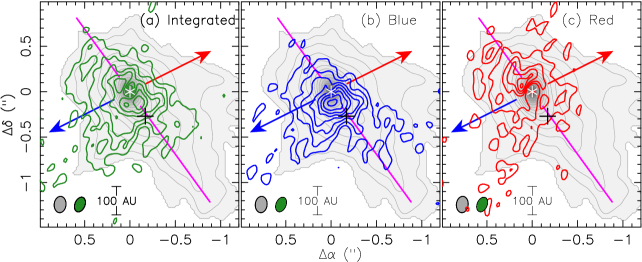
The integrated intensity, blueshifted, and redshifted maps of C18O are shown on top of the 232 GHz continuum map in Figure 3. As seen in Figure 3a, the integrated intensity map shows that the C18O emission, although less extended to the southwest probably because of an insufficient sensitivity, forms a similar structure to the continuum and thus traces the envelope reasonably well. Almost no emission is detected towards the central continuum peak because of a self-absorption against the bright and optically thick disk at the center, as previously seen in SO (Lee et al., 2018c). As seen in Figures 3b and 3c, the blueshifted emission and redshifted emission are mostly on the opposite sides of the flattened envelope, because of a rotation motion. The overlaps of the blueshifted and redshifted emission in the envelope is due to the presence of an infall motion.
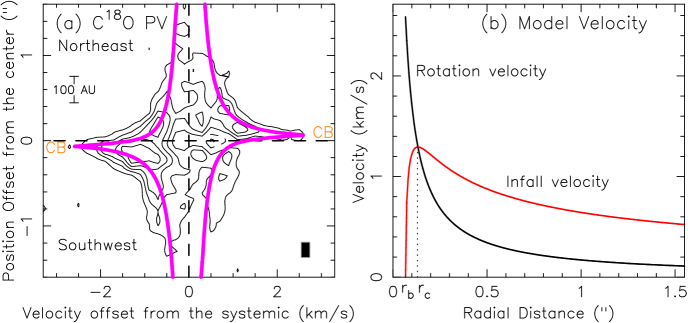
Position-velocity (PV) diagram along the major axis of the envelope is presented in Figure 4a to show the brightness temperature distribution as well as the infall and rotation motion in the envelope. As can be seen from the diagram, the envelope has a brightness temperature of 2030 K in the inner part and 10 K in the outer part, indicating that the envelope is warm. The blueshifted peak is higher than the redshifted peak and an absorption dip is seen on the redshifted side at 0.6 km s-1 due to the self-absorption against the bright disk at the center, as expected for an infalling envelope (Lee et al., 2014a). The PV structure can be roughly described as two triangular structures, with one on the blueshifted side and the other on the redshifted side, with their tips pointing away from each other, also expected for an infalling envelope (Ohashi et al., 1997). In addition, since the triangular structures are shifted slightly to the southwest on the blueshifted side and to the northeast on the redshifted side, the envelope also has a rotation motion.
This type of PV structure has been seen previously in older systems, e.g., HH 212 (Lee et al., 2014a, 2017b) and L1527 (Sakai et al., 2014). It has been well fitted by a simple ballistic infalling-rotating envelope model (Sakai et al., 2014; Lee et al., 2017b), in which the material is assumed to spiral inwards with constant specific angular momentum and total energy. In this model, only two parameters are needed, one is the specific angular momentum of the envelope, , and the other is the mass of the central protostar, (for the equations, please see Sakai et al., 2014; Lee et al., 2017b). The mass of the central protostar was previously estimated to be 0.08 (after updated with the new distance, Lee et al., 2018c), assuming a Keplerian rotation for the disk. With this mass, the outer boundaries of the PV structure can be fitted reasonably well with au km s-1, which is also well consistent with previous measurement of angular momentum in HCO+ (see the solid curve in Figure 4a in Lee et al., 2009). Notice that our model fitting is based mainly on the northeastern envelope because the southwestern envelope could have been affected by a tentative secondary source. In addition, the systemic velocity is refined slightly to be 9.10 km s-1 LSR. Our fitting result not only allows us to derive the infall and rotation velocities in the envelope, but also confirms the previously estimated mass of the central protostar.
The infall and rotation velocities of this model are shown in Figure 4b. As can been seen, the centrifugal radius, where the infall velocity is the same as the rotation velocity, is or 42 au. Thus, the infall velocity is larger than the rotation velocity outside this radius, but smaller than the rotation velocity inner to this radius. The centrifugal barrier, where the infall velocity becomes zero and a rotating disk is expected to form, has a radius of or 21 au, also well consistent with the radius of the dusty disk (Lee et al., 2018c). Thus, the model result also supports that the infalling and rotating flattened envelope has transformed into a rotating disk at 20 au.
3.5 Magnetic Field Morphology
In the envelope of this very young system, since the dust opacity index is mostly greater than 1 (see Figure 1c), the dust grains are likely to be too small to have significant dust self-scattering in our polarization observations, especially at the lower frequency of 232 GHz. Thus, the polarizations are likely due to magnetically aligned dust grains, as found in the envelopes in other Class 0 sources (Cox et al., 2018; Maury et al., 2018; Kwon et al., 2019). In addition, with a brightness temperature of less than 5 K and thus much less than that seen in C18O, the continuum emission is optically thin in the envelope. Hence the inferred magnetic field orientations are perpendicular to the polarization orientations, as shown in Figure 5. In this figure, the magnetic field orientations inferred from the polarization orientations at both 358 GHz and 232 GHz are plotted together to show a more complete picture of the field morphology. For comparison, the magnetic field orientations previously detected with SMA at 342 GHz at more than 2.5 and resolution (Lee et al., 2014b) are also included as orange lines. From the figure, it is clear that the previously detected magnetic fields with SMA are mostly located near the outer edges of the envelope and are roughly aligned with those detected here at 232 and 358 GHz with ALMA.
On the other hand, in the innermost region within of the center, where the optically thick disk is located, the polarization can be significantly affected by dust self-scattering, as seen in Class 0/I disks (Sadavoy et al., 2018; Lee et al., 2018b; Cox et al., 2018) and Class I/II disks (Stephens et al., 2017; Kataoka et al., 2017; Hull et al., 2018; Bacciotti et al., 2018), because the grains might have grown to submillimeter size in the disk. In particular, the observed polarization orientations are more aligned with the disk minor axis at higher frequency (358 GHz) than lower frequency (232 GHz) (comparing Figure 2c and Figure 2d), as expected if dust self-scattering did contribute partly to the dust polarization. In addition, since the innermost region is not spatially resolved, the polarization orientation is a combination of those in the optically thick disk and those in the optically thin innermost envelope. As a result, observations at higher resolution and longer wavelengths are needed to determine the origin of the dust polarization and infer the magnetic field there properly.
The envelope is the region at more than away from the center. The polarization orientations at 358 GHz are also slightly rotated counter-clockwise with respect to those at 232 GHz (comparing Figure 2c and Figure 2d), and thus could be slightly affected by dust self-scattering. Thus, we focus more on the detections at 232 GHz because it is less affected by dust self-scattering, if any. In the northeastern envelope, a pinched field morphology (as indicated by the white curves) is seen, with the field lines converging from the outer edge of the envelope down to the northeastern edge of the disk. Deeper polarization observations are needed to consolidate this pinched field morphology by detecting more polarization on the east side of the envelope. In the southwestern envelope, a pinched field morphology (as indicated by the white curves) is also seen extending from the outer edge of the envelope towards the disk down to within of the center. Again, deeper polarization observations are needed to consolidate this pinched field morphology by detecting more polarization on the west side of the envelope. In addition, since a polarization hole is seen further in around the tentative secondary source, deeper observations are needed to check if the pinched field morphology extends down to the disk. The field lines above and below the envelope midplane near the jet axis, although patchy, are roughly perpendicular to the jet axis and thus may trace toroidal fields in the envelope wrapped around the jet axis, as discussed later. The field lines at towards the southeast (as marked “P” in Figure 5a) are located in the envelope around the outflow base, likely tracing the poloidal fields there, as discussed later.
4 Discussion
4.1 Inside-Out Collapse
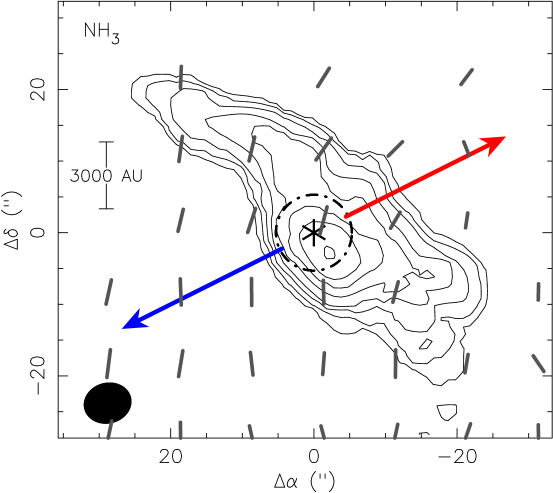
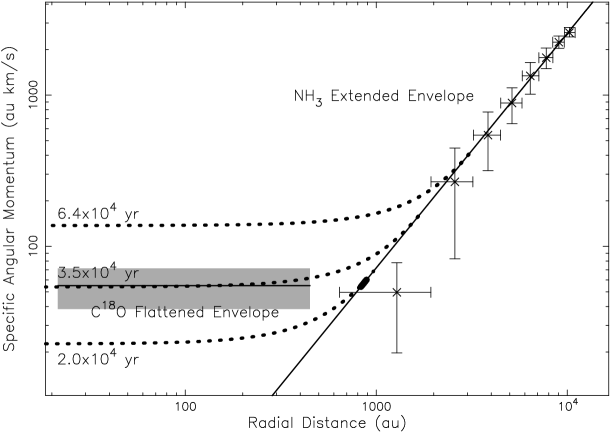
In HH 211, the flattened envelope detected here is deeply inside a rotating extended envelope, which has a size up to 104 au detected before in NH3 (Wiseman et al., 2001; Tanner & Arce, 2011), as shown in Figure 6. Interestingly, the extended envelope is flattened and warped, with the outer part (especially in the northeast) close to perpendicular to the large-scale magnetic field axis (as shown with the line segments) and the inner part close to perpendicular to the jet axis. Figure 7 presents the specific angular momentum distribution in the C18O flattened envelope (horizontal bar) in comparison to that in the NH3 extended envelope (data points with error bars) reported in Tanner & Arce (2011). As discussed earlier in Section 3.4, the C18O flattened envelope is found to have a roughly constant specific angular momentum of au km s-1 up to a radius of 400 au, with its PV structure well fitted with a ballistic infalling-rotating model. As can be seen, the extended envelope has a different distribution of specific angular momentum, with its specific angular momentum decreasing from the outer part to the inner part, down to the value roughly matching that in the flattened envelope. Since the extended envelope is gravitational stable (Tanner & Arce, 2011) and the flattened envelope is collapsing towards the center, this indicates that the inner part of the extended envelope has transformed into the collapsing flattened envelope, confirming the previous study (Tanner & Arce, 2011).
Inside-out collapsing model has been used to explain the collapse of a cloud core (Shu, 1977). It has an analytic self-similar solution and thus can be used to roughly estimate the collapsing age , collapsing radius , and other parameters. This model starts with a singular isothermal sphere. An expansion wave is initiated at the center and propagates outwards at the isothermal sound speed and then the material within the expansion wave collapses inside-out towards the center. The collapsing radius is the radius where the expansion wave has propagated to and where the material starts to fall in. The collapsing age is the time elapse since the wave is initiated at the center when the mass of the protostar is zero, and is thus the same as the age of the protostar. This model has a self-similar solution for the infall motion (see Equation 8 and Table 2 in Shu, 1977), allowing us to compute the radial position for each infalling material (and its specific angular momentum) at given .
Here, the NH3 extended envelope can be identified as the cloud core and the C18O flattened envelope can be identified as the collapsing envelope within the expansion wave. The NH3 extended envelope has a mean kinetic temperature of 15 K (Tanner & Arce, 2011), and thus an isothermal sound speed 0.23 km s-1. In this extended envelope, the distribution of specific angular momentum can be roughly fitted with
| (2) |
as shown by the solid curve in Figure 7. The power-law index here is almost the same as that found in the survey of NH3 cloud cores (Goodman et al., 1993). With this extended envelope as an input to the inside-out collapsing model, we have calculated the distribution of specific angular momentum in the collapsing envelope within the expansion wave at 3 collapsing ages, as shown by the 3 dotted curves in Figure 7. As can be seen, the model at an older age produces a larger specific angular momentum in the collapsing envelope. Interestingly, for a given age, the specific angular momentum in the inner part of the collapsing envelope appears almost constant. This is because the material in this part of the collapsing envelope comes from a thin shell (with a small range of radii) in the original extended envelope and thus has roughly the same specific angular momentum. For example, at yrs, the thin shell that forms this part of the collapsing envelope has a small range of radii around 830 au, as marked by the small thick line in the figure. This thin shell of the original extended envelope falls in and is spread across the inner part of the collapsing envelope because the inner part of the shell falls earlier and thus faster than the outer part (see Figure 3b in Shu, 1977). Since the inner radius of this thin shell is given by , the specific angular momentum in the inner part of the collapsing envelope is , and thus increasing with the collapsing age.
In this inside-out collapsing model, the C18O flattened envelope can be regarded as the inner part of the collapsing envelope where the specific angular momentum is roughly constant. As can be seen, the collapsing model here at yr fits the observed distribution of specific angular momentum in the C18O flattened envelope reasonably well. In this case, the expansion wave has propagated to 1700 au (as marked by the circle in Figure 6) and the flattened envelope comes from a thin shell originally located at au. The material with in the original extended envelope has already accreted to the central protostar. The accretion rate predicted in the inside-out model is yr-1. The observed mean accretion rate to form the central protostar is 2.25 yr-1, which is 80% of that predicted, probably because part of the material goes into the jet and outflow, carrying away excess angular momentum. With this observed accretion rate and a reasonable protostellar radius of , the accretion luminosity would be , about 60% of the bolometric luminosity observed before (Froebrich et al., 2003). Notice that since the inside-out collapsing model here is isothermal and does not include rotation and magnetic field, the estimates here should be considered as references.
We can estimate the infall rate in the flattened envelope around the disk at a radius au to cross check the accretion rate. The mass column density there can be estimated with the continuum emission at 232 GHz. For the flattened envelope near the disk, we assume a mass opacity of cm2 g-1, which is the mean value in protostellar cores (Ossenkopf & Henning, 1994) and protostellar disks (Beckwith et al., 1990). Assuming an excitation temperature of 40 K (judging from the high brightness temperature of 20 K there in C18O), the mass column density is estimated to be g cm-2. Dividing this column density by a path length of 100 au along the line of sight, we obtain a mass density g cm-3. The infall velocity there is 1.06 km s-1 (Figure 4b). Assuming that the flattened envelope subtends an angle of 10∘, then the infall rate is yr-1. Assuming that about 70% of this accretes to the central protostar, then the accretion rate would be yr-1. Considering the uncertainties in the mass opacity, temperature, and other parameters, the rough estimate here is consistent with the above.
4.2 Pseudodisk with a Toroidal and Pinched Field Morphology
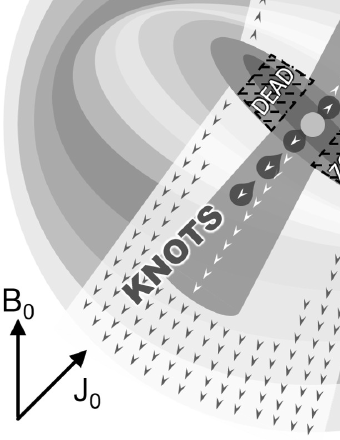
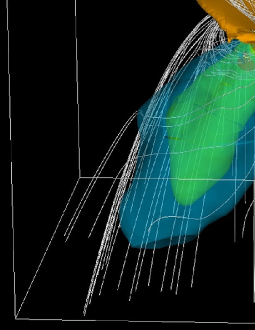
In order to understand the inferred field morphology and how it comes to be, we compare it to the simulated field morphology resulting from a collapse of a magnetized rotating cloud core. In HH 211, since there is a large misalignment of 60∘ between the magnetic field axis and the rotation axis in the cloud core, we compare our results to those in Hirano & Machida (2019), which assumed a misalignment of 45∘. Figure 8 shows a schematic view of their simulation result adopted from their paper. In their model, the field axis (B0) in the cloud core is initially north-south oriented, roughly the same as that in HH 211. The rotation axis J0 in the cloud core and thus in the resulting disk has a P.A. of 45∘, roughly parallel (although in opposite) to that of the jet axis observed in HH 211, which has a P.A. of 116.6∘. The cloud core is initially spherical and has a radius of au, similar to that of the NH3 extended envelope. It contracts along the magnetic-field lines towards the midplane (equatorial plane) and forms a flattened envelope (the so-called pseudodisk). The flattened envelope is warped because the contraction direction of the cloud core and thus the minor axis of the flattened envelope are changed gradually from parallel to the magnetic field axis in the outer region to parallel to the rotation axis in the inner region. The inner part of the flattened envelope is infalling towards the center and thus is threaded with an hourglass (poloidal) field morphology with a pinch in the midplane (see Figure 9 for the inner region within 400 au of the central source). This pinched field morphology also has a toroidal component generated by the rotation in the flattened envelope. In this inner part of the flattened envelope, rotation velocity increases towards the center. Thus, the innermost part of the flattened envelope, where the rotation dominates the dynamics and the Ohmic dissipation weakens the magnetic field, has transformed into a rotationally supported disk around the angular momentum vector (J0) surrounding the central protostar. Outflow, jet, and knots are seen coming out from the disk, with their axes varying with time. The details within the disk are ignored here because we only focus on the flattened envelope.
In HH 211, the NH3 extended envelope (which is more perpendicular to the large-scale magnetic field axis) and the C18O flattened envelope (which is more perpendicular to the rotation axis and falling towards the central source) can be identified respectively as the outer part and the inner part of the flattened envelope in the model. Moreover, the inferred field morphology in the C18O flattened envelope seems roughly consistent with the simulated field morphology in the inner part of the flattened envelope as shown in Figure 9. For example, a pinched field morphology is seen threading the flattened envelope, tentative toroidal fields are seen above and below the midplane around the outflow axis, and poloidal fields are seen in the envelope around the outflow base. As mentioned earlier, a point symmetry in the polarization distribution is seen in the flattened envelope at 232 GHz, with fewer detections on the east side in the northeastern envelope and fewer detections on the west side in the southwestern envelope. Such a point symmetry has also been seen in the simulated polarization degree map of the flattened envelope (Kataoka et al., 2012). Figure 10e in Kataoka et al. (2012) shows the simulated polarization degree map for their model 2 at a similar inclination of 80∘. In that model, the pinched field morphology also has a comparable toroidal field component generated by the rotation. Rotating the simulated map by 126∘ counterclockwise to match the observed major axis of the flattened envelope, we find that this point symmetry matches the observed point symmetry here in HH 211. As discussed in Tomisaka (2011), a magnetic field with both toroidal and hourglass poloidal components is point symmetric. When such a magnetic field is viewed at an inclination angle, the low polarization region has a point-symmetric distribution (Kataoka et al., 2012). In addition, the fact that almost no polarization is detected along the outflow axis slightly above and below the central source could also be due to a depolarization caused by the coexisting poloidal and toroidal fields, as shown in Figure 10e in Kataoka et al. (2012).
In summary, the C18O flattened envelope observed here in HH 211 can be considered as the inner part of a pseudodisk threaded with a pinched field morphology, with its material spiraling inwards towards the center. It is formed likely because the core material is guided by the field lines and falls towards the midplane. It is misaligned with the rotating disk likely due to the misalignment between the axis of the magnetic field and the axis of the rotation in the cloud core. It is not rotationally supported and its material is falling preferentially along the equatorial plane, producing the pinched (poloidal) field morphology. It is also rotating, generating the toroidal field component in the pinched field morphology, and thus the point-symmetric polarization distribution along the equatorial plane and almost no polarization detection along the outflow axis slightly below and above the source in the flattened envelope.
4.3 Disk Formation and Magnetic Braking
The kinematics in the flattened envelope can be well described by a ballistic infalling-rotating model. In this model, the material is assumed to have the same specific angular momentum. As discussed earlier, this is expected from the inside-out collapse, because the material in the flattened envelope comes from a thin shell in the extended envelope and thus has roughly the same specific angular momentum. In addition, in this ballistic infalling-rotating model, only a fraction ( 30%) of angular momentum is lost before the flattened envelope transforms into a rotating disk around the protostar (Sakai et al., 2014; Lee et al., 2017b). Thus, no significant magnetic braking is detected in HH 211. In this system, a large misalignment has already been seen between the magnetic field axis and rotation axis in the cloud core (Matthews et al., 2009), down to the inner part (Hull et al., 2014), thus the magnetic braking is indeed expected to be less efficient (Joos et al., 2012). This misalignment likely causes the misalignment between the flattened envelope axis and the disk axis, promoting the disk formation (Li et al., 2014; Väisälä et al., 2019; Hirano & Machida, 2019). Since the material in the flattened envelope needs to lose its angular momentum before joining the rotating disk, a wind or an outflow is expected to be launched near the centrifugal barrier. More observations are required to check this.
4.4 Comparison of disk sizes in HH 211 vs. other Class 0 protostars
HH 211 is one of the youngest sources found to host a rotating disk around the protostar (Lee et al., 2018c). In this source, the disk has a radius of 20 au, much smaller than that in HH 212 (44 au) and L1527 (54 au), likely because the flattened envelope has a much smaller specific angular momentum ( 55 au km s-1) than that in HH 212 ( 140 au km s-1) (Lee et al., 2017b) and L1527 ( 130 au km s-1) (Ohashi et al., 2014). This is in turn likely because this source is much younger, and thus only the inner part of the cloud core has collapsed towards the center, as shown in Figure 7. Based on the inside-out collapsing model, the flattened envelope has a specific angular momentum (see Section 4.1). Since the central protostellar mass grows with , the centrifugal radius (and thus the disk radius) will grow with . Notice that since this inside-out collapsing model is isothermal and does not include rotation and magnetic field, the growth rate here is only for a reference. The actual growth rate could be slower, as found in Lee et al. (2018c).
4.5 Misalignment between the Envelope and the Disk, and the Jet Axis
As described earlier, the major axis of the flattened envelope appears rotated counterclockwise by 8∘ from the major axis of the disk. This misalignment may cause a disk warping and the disk orientation to rotate counterclockwise when the envelope material joins the disk. Interestingly, the jet axis in this system has already been found to have rotated counter-clockwise by 3∘ in the past (Eislöffel et al., 2003), suggestive of a counter-clockwise rotation of the disk orientation in the past. Thus, the misalignment between the flattened envelope and the disk may cause the jet axis continue to rotate counter-clockwise.
4.6 Magnetic Field Strength
In the flattened envelope, a toroidal field component is required in the pinched field morphology to produce the observed point symmetric polarization distribution. Since the toroidal field is generated by the rotation in the envelope, the magnetic energy should be comparable to the rotation energy. Thus, by equating the magnetic energy to the rotation energy, we have the field strength to be . Here, we estimate the field strength in the envelope around the disk at a distance of 100 au from the center. The rotation velocity there is 0.55 km s-1 (Figure 4b) and the mass density there is g cm-3 (see Section 4.1). Thus, the field strength is estimated to be mG at a distance of 100 au from the central protostar. In spite of this strong field around the disk, there is no clear sign of an efficient magnetic braking, likely because of the large misalignment between the rotation axis and magnetic field axis in the cloud core.
Here we check if the field strength in HH 211 is reasonable by comparing it to that estimated recently in the Class 0 source L1448-IRS2. In that source, Kwon et al. (2019) has estimated a mean field strength of only 1 mG in the envelope, using the Davis-Chandrasekhar-Fermi relationship. This mean field strength was derived with a mean density of g cm-3 averaged over the whole envelope, which has a size of (i.e., 1930 au) in the major axis and (i.e., 963 au) in the minor axis. This density is a factor of 65 lower than that derived here in HH 211 around the disk. In the innermost envelope as that seen here in HH 211, the density and the field strength are both expected to be higher. If the density there is as high as that derived here in HH 211 and the magnetic field strength can scale with the square root of the density as found in molecular clouds (Crutcher, 2012), then the field strength could be 8mG, and thus similar to that derived here in HH 211 around the disk. Interestingly, the rotation velocity there could also be similar to that measured here in HH 211, judging from the previously reported rotation velocity in the envelope of L1448-IRS2 (Tobin et al., 2015).
5 Conclusions
We have mapped the central region of the HH 211 system in continuum and C18O line. A flattened envelope is seen in the continuum with a major axis slightly rotated counterclockwise from the disk major axis, extending out to 400 au from the outer edge of the disk. Based on our kinematic study in C18O with a ballistic infalling-rotating model, it is spiraling (infalling and rotating) inwards towards the center and is expected to transform into a rotating disk at 20 au, consistent with the disk radius estimated before. In this ballistic infalling-rotating model, the central protostar has a mass of 0.08 and the flattened envelope has roughly the same specific angular momentum of 55 au km s-1. This same specific angular momentum in the flattened envelope is expected if the flattened envelope came from a thin shell of the NH3 extended envelope through an inside-out collapse. Based on the inside-out collapse, the collapsing age is 35000 yrs in HH 211.
The polarization towards the disk is spatially unresolved and could be affected by dust self-scattering. In the flattened envelope, the polarization is likely due to the magnetically aligned dust grains, inferring a highly pinched poloidal field morphology threaded on both sides of the flattened envelope. Thus, both the kinematics and field morphology support that the flattened envelope is a pseudodisk formed as the infalling gas is guided by the field lines to the equatorial plane. In addition, a point symmetric polarization distribution is seen in the flattened envelope, implying that the pinched field lines also have a toroidal component generated by the rotation in the flattened envelope. No significant loss of angular momentum and thus no clear magnetic braking are detected in the flattened envelope around the disk probably because of the large misalignment between the axis of the magnetic field and the axis of the rotation in the cloud core. Such a misalignment also causes a misalignment between the flattened envelope axis and the disk axis, promoting the disk formation.
References
- Agurto-Gangas et al. (2019) Agurto-Gangas, C., Pineda, J. E., Szücs, L., et al. 2019, A&A, 623, A147
- Allen, Li, & Shu (2003) Allen, A., Li, Z., & Shu, F. H. 2003, ApJ, 599, 363
- Bacciotti et al. (2018) Bacciotti, F., Girart, J. M., Padovani, M., et al. 2018, ApJ, 865, L12
- Beckwith et al. (1990) Beckwith, S. V. W., Sargent, A. I., Chini, R. S., & Guesten, R. 1990, AJ, 99, 924
- Chapman et al. (2013) Chapman, N. L., Davidson, J. A., Goldsmith, P. F., et al. 2013, ApJ, 770, 151
- Cox et al. (2018) Cox, E. G., Harris, R. J., Looney, L. W., et al. 2018, ApJ, 855, 92
- Crutcher (2012) Crutcher, R. M. 2012, ARA&A, 50, 29
- Eislöffel et al. (2003) Eislöffel, J., Froebrich, D., Stanke, T., & McCaughrean, M. J. 2003, ApJ, 595, 259
- Froebrich et al. (2003) Froebrich, D., Smith, M. D., Hodapp, K.-W., & Eislöffel, J. 2003, MNRAS, 346, 163
- Goodman et al. (1993) Goodman, A. A., Benson, P. J., Fuller, G. A., & Myers, P. C. 1993, ApJ, 406, 528
- Gueth & Guilloteau (1999) Gueth, F. & Guilloteau, S. 1999, A&A, 343, 571
- Hennebelle & Ciardi (2009) Hennebelle, P., & Ciardi, A. 2009, A&A, 506, L29
- Hirano & Machida (2019) Hirano, S., & Machida, M. N. 2019, MNRAS,
- Hull et al. (2013) Hull, C. L. H., Plambeck, R. L., Bolatto, A. D., et al. 2013, ApJ, 768, 159
- Hull et al. (2014) Hull, C. L. H., Plambeck, R. L., Kwon, W., et al. 2014, ApJS, 213, 13
- Hull et al. (2018) Hull, C. L. H., Yang, H., Li, Z.-Y., et al. 2018, ApJ, 860, 82
- Jhan & Lee (2016) Jhan, K.-S., & Lee, C.-F. 2016, ApJ, 816, 32
- Joos et al. (2012) Joos, M., Hennebelle, P., & Ciardi, A. 2012, A&A543, A128
- Kataoka et al. (2017) Kataoka, A., Tsukagoshi, T., Pohl, A., et al. 2017, ApJ, 844, L5
- Kataoka et al. (2012) Kataoka, A., Machida, M. N., & Tomisaka, K. 2012, ApJ, 761, 40
- Kwon et al. (2009) Kwon, W., Looney, L. W., Mundy, L. G., Chiang, H.-F., & Kemball, A. J. 2009, ApJ, 696, 841
- Kwon et al. (2019) Kwon, W., Stephens, I., Tobin, J., et al. 2019, submitted.
- Lee (2010) Lee, C.-F. 2010, ApJ, 725, 712
- Lee (2011) Lee, C.-F. 2011, ApJ, 741, 62
- Lee et al. (2007) Lee, C.-F., Ho, P. T. P., Palau, A., Hirano, N., Bourke, T. L., Shang, H., & Zhang, Q. 2007, ApJ, 670, 1188
- Lee et al. (2009) Lee, C.-F., Hirano, N., Palau, A., et al. 2009, ApJ, 699, 1584
- Lee et al. (2014a) Lee, C.-F., Hirano, N., Zhang, Q., et al. 2014a, ApJ, 786, 114
- Lee et al. (2014b) Lee, C.-F., Rao, R., Ching, T.-C., et al. 2014b, ApJ, 797, L9
- Lee et al. (2016) Lee, C.-F., Hwang, H.-C., & Li, Z.-Y. 2016, ApJ, 826, 213
- Lee et al. (2017b) Lee, C.-F., Li, Z.-Y., Ho, P. T. P., et al. 2017b, ApJ, 843, 27
- Lee et al. (2017a) Lee, C.-F., Li, Z.-Y., Ho, P. T. P., et al. 2017a, Science Advances, 3, e1602935
- Lee et al. (2018a) Lee, C.-F., Hwang, H.-C., Ching, T.-C., et al. 2018a, Nature Communications, 9, 4636
- Lee et al. (2018b) Lee, C.-F., Li, Z.-Y., Ching, T.-C., Lai, S.-P., & Yang, H. 2018b, ApJ, 854, 56
- Lee et al. (2018c) Lee, C.-F., Li, Z.-Y., Hirano, N., et al. 2018c, ApJ, 863, 94
- Li et al. (2014) Li, Z.-Y., Krasnopolsky, R., Shang, H., & Zhao, B. 2014, ApJ, 793, 130
- Machida & Matsumoto (2011) Machida, M. N., & Matsumoto, T. 2011, MNRAS, 413, 2767
- Masson et al. (2016) Masson, J., Chabrier, G., Hennebelle, P., Vaytet, N., & Commerçon, B. 2016, A&A, 587, A32
- Matthews et al. (2009) Matthews, B. C., McPhee, C. A., Fissel, L. M., & Curran, R. L. 2009, ApJS, 182, 143
- Maury et al. (2018) Maury, A. J., Girart, J. M., Zhang, Q., et al. 2018, MNRAS, 477, 2760
- Mellon & Li (2008) Mellon, R. R., & Li, Z.-Y. 2008, ApJ, 681, 1356
- Ohashi et al. (1997) Ohashi, N., Hayashi, M., Ho, P. T. P., & Momose, M. 1997, ApJ, 475, 211
- Ohashi et al. (2014) Ohashi, N., Saigo, K., Aso, Y., et al. 2014, ApJ, 796, 131
- Ortiz-León et al. (2018) Ortiz-León, G. N., Loinard, L., Dzib, S. A., et al. 2018, ApJ, 865, 73
- Ossenkopf & Henning (1994) Ossenkopf, V., & Henning, T. 1994, A&A, 291, 943
- Sadavoy et al. (2018) Sadavoy, S. I., Myers, P. C., Stephens, I. W., et al. 2018, ApJ, 859, 165
- Sakai et al. (2014) Sakai, N., Sakai, T., Hirota, T., et al. 2014, Natur, 507, 78
- Segura-Cox et al. (2018) Segura-Cox, D. M., Looney, L. W., Tobin, J. J., et al. 2018, ApJ, 866, 161
- Shu (1977) Shu, F. H. 1977, ApJ, 214, 488
- Stephens et al. (2017) Stephens, I. W., Yang, H., Li, Z.-Y., et al. 2017, ApJ, 851, 55
- Tobin et al. (2012) Tobin, J. J., Hartmann, L., Chiang, H.-F., et al. 2012, Natur, 492, 83
- Tobin et al. (2015) Tobin, J. J., Looney, L. W., Wilner, D. J., et al. 2015, ApJ, 805, 125
- Tomisaka (2011) Tomisaka, K. 2011, PASJ, 63, 147
- Tanner & Arce (2011) Tanner, J. D., & Arce, H. G. 2011, ApJ, 726, 40
- Väisälä et al. (2019) Väisälä, M. S., Shang, H., Krasnopolsky, R., et al. 2019, ApJ, 873, 114
- Wiseman et al. (2001) Wiseman, J., Wootten, A., Zinnecker, H., & McCaughrean, M. 2001, ApJ, 550, L87
- Yen et al. (2015) Yen, H.-W., Takakuwa, S., Koch, P. M., et al. 2015, ApJ, 812, 129

| Spectral | Line or | Number of | Central Frequency | Bandwidth | Channel Width |
|---|---|---|---|---|---|
| Window | Continuum | Channels | (GHz) | (MHz) | (kHz) |
| 0 | SO | 480 | 346.533 | 117.187 | 244.141 |
| 1 | CO J=3-2 | 480 | 345.800 | 117.187 | 244.141 |
| 2 | SiO J=8-7 | 960 | 347.335 | 468.750 | 488.281 |
| 3 | HCO+ J=4-3 | 960 | 356.739 | 234.375 | 244.141 |
| 4 | Continuum | 960 | 358.005 | 1875.000 | 1953.125 |
| Spectral | Line or | Number of | Central Frequency | Bandwidth | Channel Width |
|---|---|---|---|---|---|
| Window | Continuum | Channels | (GHz) | (MHz) | (kHz) |
| 0 | SiO | 960 | 217.102 | 468.750 | 488.281 |
| 1 | 13CO | 480 | 220.407 | 58.593 | 122.070 |
| 2 | C18O | 480 | 219.569 | 58.593 | 122.070 |
| 3 | N2D+ | 480 | 231.328 | 58.593 | 122.070 |
| 4 | CO | 480 | 230.547 | 58.593 | 122.070 |
| 5 | Continuum | 960 | 232.521 | 1875.000 | 1953.125 |