Critical Review of BugSwarm for Fault Localization and Program Repair
Abstract
Benchmarks play an essential role in evaluating the efficiency and effectiveness of solutions to automate several phases of the software development lifecycle. Moreover, if well designed, they also serve us well as an important artifact to compare different approaches amongst themselves. BugSwarm is a benchmark that has been recently published, which contains 3,091 pairs of failing and passing continuous integration builds. According to the authors, the benchmark has been designed with the automatic program repair and fault localization communities in mind. Given that a benchmark targeting these communities ought to have several characteristics (e.g., a buggy statement needs to be present), we have dissected BugSwarm to fully understand whether the benchmark suits these communities well. Our critical analysis shows several limitations in the benchmark: only 112/3,091 (3.6%) are suitable to evaluate techniques for automatic fault localization or program repair.
I Introduction
Empirical software engineering focuses on gathering evidence, mainly via measurements and experiments involving software artifacts. The information collected is then used to form the basis of theories about the processes under study. Benchmarks, therefore, play an essential role in the empirical studies, as, in many situations, they are the only source of information to evaluate new approaches. In particular, benchmarks are used to evaluate approaches to testing (e.g., automatic test generation), automatic fault localization (FL), and automatic program repair (APR). These two research fields require benchmark of (behavioral) bugs to evaluate the precision of the fault localization and the ability to generate correct patches, respectively.
In the past year, the research community put a lot of effort to develop new benchmarks for those fields. Indeed, four new benchmarks have been presented in the past months: BUGSJS [1], Bears [2], Code4Bench [3] and BugSwarm [4]. They complement the existing benchmarks: Defects4J [5], IntroClass [6], ManyBugs [6], IntroClassJava [7], Bugs.jar [8], QuixBugs [9]. As the number of benchmarks grows, it is becoming more and more important to have a clear picture of the characteristics of each benchmark. This is important to ensure the quality of the evaluations that use such benchmarks and to guide researchers to the benchmarks that suit the best their needs.
In this paper, we present a critical review of the BugSwarm benchmark, recently published at the International Conference on Software Engineering (ICSE’19) [4]. BugSwarm is a benchmark of 3,091 pairs of failing and passing builds, designed for the automatic fault localization and program repair communities. They succeed to reproduce 3.05% (3,091/101,265) of the pairs of builds they considered. They ended up with 1,827 pairs of Java builds and 1,264 pairs of Python builds that are between one and four years old. Those builds are extracted from 108 Java projects and 52 Python projects, with an average of 19.3 pairs of builds per project.
In this paper, we characterize the human patches, the failures and the usage of BugSwarm. We then focus our analysis on the applicability of BugSwarm in evaluating state of the art automatic fault localization and program repair research.
In our analysis, we identify that an important number of pairs of builds are ill suited for automatic fault localization and program repair fields. Indeed, we observe that BugSwarm contains, e.g., duplicate commits and builds that fail due to non-behavioral problems. Our analysis shows that only 112/3,091 (a mere 3.6%) meet the criteria of those research fields. Reporting the suitable builds per programming language shows 50 entries for Java and 62 for Python only.
The difference of number is explained by the fact that BugSwarm is a benchmark of failing and passing builds and not a benchmark of bugs. Builds can fail for multiple others reasons than regression bugs. Automatic program repair and fault localization rely on bugs for their evaluation. Using all the builds in BugSwarm would result in bad repair and fault localization precision rate and misleading analysis.
The contributions of this paper are:
-
•
a critical review of the BugSwarm benchmark with respect to automatic fault localization and program repair;
-
•
a characterization of BugSwarm’s content in terms of build execution, diff analysis, failure type and patch type;
-
•
a set of lessons learned for designing future benchmarks for automatic program repair and fault localization;
-
•
the source code of the 3,091 BugSwarm pairs of builds, the TravisCI’s logs for each build and the diffs between the passing and failing builds;
-
•
an interactive website [10] to browse and filter BugSwarm’s pairs of builds.
This paper is an analysis of the content and usage of BugSwarm. This analysis provides guidelines for researchers on how to use BugSwarm and prevent misusage or incorrect recommendations.
The remainder of this paper is organized as follows. Section II presents the background of this paper: the BugSwarm benchmark and the requirements of automatic program repair and fault localization tools. Section III contains our analysis of the BugSwarm benchmark. Section IV discusses the lessons learned of this analysis and the threats to validity. Section V presents the related works and Section VI concludes this paper.
II Background
II-A What is BugSwarm?
BugSwarm is a benchmark of 3,091 pairs of builds that have been published by Dmeiri et al. at ICSE’19 [4].
The idea of BugSwarm is to collect pairs of failing/passing builds from a continuous integration service (in this case TravisCI). The failing build contains the incorrect behavior to fix and the passing build contains the oracle of the fix, e.i. the human modification that makes the failing build pass. This approach is also used by Bears benchmark [2] but differs from the benchmarks that are traditionally used by automatic program repair and fault localization fields such as Defects4J [5] and QuixBugs [9].
Each pair of builds is composed of a failing build and a passing builds that are encapsulated in a Docker image. The Docker image provides the source code and the scripts to reproduce the passing and failing execution. BugSwarm is accompanied with a command line interface that downloads and starts the Docker images as well as an infrastructure to execute scripts inside the Docker image.
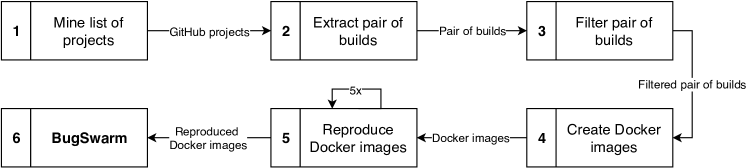
Figure 1 presents the six main steps that BugSwarm’s authors followed to create it.
-
1.
Mine a list of GitHub projects. The first step consists of collecting a set of GitHub projects that used TravisCI.
-
2.
Extract pair of builds. During the following step, they analyze the build history of each project and collect all pairs of failing/passing builds. The complexity of this task resides in the ability to recreate the correct history of the branches since Git history is a tree and TravisCI history is linear. They needed an additional step to match the git history with the TravisCI history.
-
3.
Filter pair of builds. The next step consists of keeping only the pairs of builds that have a chance to be reproducible. In this case, they only consider the builds where TravisCI uses a Docker image to run the build.
-
4.
Create Docker images. The fourth step is to create a new Docker image that contains the two builds (failing and passing) and the scripts that execute them.
-
5.
Reproduce Docker images. This fifth step is an important step. It consists of executing five times each Docker image that has been created at the previous step to ensure that the behaviors of the builds are consistent. They parsed the TravisCI logs and the logs produced by the new Docker image to extract the number of failing tests. They consider that the builds are reproduced when the number of failing test is identical.
-
6.
BugSwarm. The final step is to create an infrastructure that makes it possible to use the BugSwarm and its 3,091 pairs of builds.
Table I presents the main metrics that have been presented in BugSwarm’s paper. BugSwarm contains 3,091 pairs of builds, 1,827 from Java applications, 1,264 from Python applications. Those builds are coming from 160 different GitHub projects, 108 Java projects, 52 Python projects. The usage information is available on BugSwarm’s website: http://bugswarm.org and for further details, we recommend reading the BugSwarm paper [4].
| Java | Python | All | |
| # Pairs of Builds | 1,827 | 1,264 | 3,091 |
| # Projects | 108 | 52 | 160 |
II-B APR and FL Requirements
The current state of the art of automatic program repair and fault localization techniques have a set of requirements for the buggy programs that they receive as inputs. We identify two categories of requirements. The first category contains the requirements related to the execution itself and the second category is to ensure the fairness of empirical evaluations.
The requirements for automatic program repair and fault localization:
-
1.
Bug type. Current APR and FL techniques only target behavioral bugs that are present in the source code of the program. It means that bugs in configuration or external files are currently not compatible with APR and FL.
-
2.
Specification of the program. The test-suite of the application is currently being used as the main specification in APR and FL. The passing tests specify the correct behavior of the application and a failing test describes the incorrect behavior.
-
3.
Program setup. The execution setup of the program has to be known such as the path of the sources, path of the tests, path of the binary, the classpath (for Java) and version of the source.
-
4.
Uniqueness of the bug. The requirement is important to ensure that the technique does not overfit one specific bug and consequently introduce bias in the analysis of the results.
-
5.
Human patch. The human patch is currently being used in APR and FL evaluation as the perfect oracle. It provides the solution on how to fix the bug and provide the location of the bug.
Those requirements define the necessary conditions to be able to use and evaluate state-of-the-art APR and FL approaches on bugs.
III BugSwarm Analysis
This section contains our analysis of BugSwarm.
III-A Research Questions
In this study, we address the following three research questions:
-
RQ1.
What are the main characteristics of BugSwarm’s pairs of builds regarding the requirements for FL and APR? In this research question, we analyze the pairs of builds using three different axes: 1. failing builds, 2. the human patches, and 3. the failure reasons in order to identify pairs of builds that match APR and FL requirements.
-
RQ2.
What is the execution and storage cost of BugSwarm? In the second research question, we describe and analyze the usage of BugSwarm and we estimate the execution and storage cost of running an experiment with BugSwarm on Amazon cloud.
-
RQ3.
Which pairs of builds meet the requirements of Automatic Program Repair (APR) and Fault Localization (FL) techniques? In the final research question, we put in perspective BugSwarm’s pairs of builds with the state of the art automatic program repair and fault localization techniques and we identify which ones could be used by those fields.
III-B Protocol
In this section, we present the protocol that we followed to collect the artifacts used to answer our three research questions. We identify the following four artifacts that need to be collected:
-
1.
The source code of each pair of builds.
-
2.
The diff between the failing and passing build.
-
3.
The build information from TravisCI (including the execution logs).
-
4.
The Docker image information from DockerHub.
Figure 2 describes our protocol. We first get all the pairs of builds information using BugSwarm’s API.111BugSwarm’s API request to get the list of pairs of builds: http://www.api.bugswarm.org/v1/artifacts/?where={"reproduce_successes":{"$gt":4,"lang":{"$in":["Java","Python"]}}} and we iterate over it. For each build, we use the BugSwarm command line to run the Docker image. Inside the Docker image, we first prepare the buggy and passed version of the application by removing the temporary files that had been introduced during the creation of BugSwarm. The temporary files are duplicate versions of the repository. Then, we create a new Git repository where we commit the buggy and passed version. The repository is then pushed to our GitHub repository in its branch [11]. Then, we download the failing and passing log execution from TravisCI and the Docker manifest of the image via DockerHub.
Once all the pairs of builds are pushed on GitHub, we download the diffs between each failing/passing version using GitHub’s API. Finally, we compute the metrics on the collected artifacts such as the number of changed files, the number of changed lines, the types of file that have been changed or the time between the failing and passing commits. All the collected artifacts, the scripts to collect and analyze are publicly available on our GitHub repository [11]. The repository also offers the access of the source of each pair of build; this is a rather convenient when the execution of the builds is not require for the analysis. We also created a website that presents the human diffs and the collected metrics for each artifact [10].
III-C RQ1. Characteristics of BugSwarm’s Pairs of Builds
In this section, we analyze BugSwarm from three different angles: 1. a general analysis of the pairs of builds, 2. an analysis of the human patch and its diff, 3. and an analysis of the failures. The analyses used the data that is collected with the protocol described in Section III-B.
III-C1 Buggy Builds
For the first angle, we do a general analysis of the pairs of builds of BugSwarm. Table II presents the main metrics of this analysis. This table is divided into four columns. The first column presents the name of the metric, the second column contains the number for Java pairs of builds, the third for Python and the last one for Java and Python pairs of builds.
Our first observation is that the number of builds reported in this paper (2,949) and BugSwarm’s paper (3,091) are different (line one and two of Table II). Indeed, we considered all pairs of builds that are reproduced successfully five times like it is described in BugSwarm’s paper (see Section 4-B in [4]). Surprisingly, BugSwarm authors did not consider their criteria in their final selection of the pairs of builds and consequently the reported number is in contradiction with the paper. We observe that the number changes with the time between 2,042 and 2,949. It is possible that the API will not respond the same number in the future. We contacted to authors about this point and they told us that the property had been overwritten by mistake in the database and they fixed it manually.
Our second observation is that 40.08% ((2,949 1,767)/2,949) of the builds have a duplicate failing commit id. It means that those 40.08% should not be considered by the approaches that only consider the source code of the application otherwise it introduces misleading results (see requirement 4 in Section II-B). It also shows that Java pairs of builds are slightly more impacted by the duplicate commits compared to Python builds (41.26% vs. 38.48%). Finally, we observed that eight Docker images are unavailable: Adobe-Consulting-Services-acs-aem-commons-315891915, Adobe-Consulting-Services-acs-aem-commons-358605971, SonarSource-sonar-java-295863948, paramiko-paramiko-306104686,paramiko-paramiko-306104687, paramiko-paramiko-306104688, paramiko-paramiko-306104689, paramiko-paramiko-306104690. We provided this list to BugSwarm’s authors, we expect that the missing Docker images will be available in the following weeks.
By only considering the pairs of builds that are available, reproduced at least five times successfully and based on a unique commit we end up with 1,759 pairs of builds taken from 156 GitHub repositories and with builds that are 2.56 years old on average.
| Metrics | Java | Python | All |
| # Pairs of builds in BugSwarm’s paper | 1,827 | 1,264 | 3,091 |
| # Pairs of builds reproduced 5 times | 1,699 | 1,250 | 2,949 (95.41%) |
| # Pairs of builds with unique commit | 998 | 769 | 1,767 (57.17%) |
| # Docker images not available | 3 | 5 | 8 (0.26%) |
| Metrics | Java | Python | All |
|---|---|---|---|
| # Empty diffs | 1 | 1 | 2 (0.11%) |
| # Duplicate diffs | 101 | 97 | 198 (11.21%) |
| # Duplicate messages | 178 | 154 | 332 (18.79%) |
| # Diffs that change source | 827 | 445 | 1,272 (71.99%) |
| # Diffs that only change source | 305 | 161 | 466 (26.37%) |
| Metrics | Java | Python | All |
|---|---|---|---|
| Avg. fix time | 1 day, 10.5h | 1 day, 2.8h | 1 day, 7.1h |
| Med. fix time | 28:54 | 39:52 | 32:45 |
| Avg. execution time passing | 04:43 | 04:54 | 04:48 |
| Med. execution time passing | 03:55 | 02:57 | 03:27 |
| Avg. execution time failing | 02:55 | 04:30 | 03:36 |
| Med. execution time failing | 02:26 | 02:46 | 02:37 |
III-C2 Human Patches
For the second angle, we look at the human patches. We analyze the diffs between the buggy source code and patched source code and the time needed by the human to create a patch. For this analysis, we only consider the 1,767 builds that have a unique commit. Since the builds that have duplicate commits have the same diff, it would produce a bias if we consider them in this analysis.
Table III presents the main metrics on the diffs between the buggy and passing builds. The first row presents the number of empty diffs, i.e., no change between the buggy and the patched source. For one build web2py-web2py-61468453, the diff is empty because the modification consists of a change in the configuration of a submodule that does not result in a code changes. We did not find a reasonable explanation for the build checkstyle-checkstyle-211109551. The original diff in the project repository is not empty, but the diff generated inside the Docker image is. The second row contains the number of diffs that are duplicated, i.e., an exact match of the diff according to the md5 hash function. For the third row, we look at the commit messages of the passing builds and count how many of them are unique. The fourth row shows the number of diffs that change at least one source file, i.e., a Java or Python file. The following row contains the number of diffs that only change a source file, i.e., it does not change a configuration file for example.
Table IV presents metrics that are time-related, the first ones present the average and median time required by the developer to fix their builds. Then, the average and median execution time of the failing and passing builds.
The takeaways of those tables are that BugSwarm contains duplicate diffs (198) even when we only consider the pairs of builds that have different commit id. They also use frequently the same commit message (332). For example, the message “Added missing javadoc” occurs 34 times, “Added hint for findbugs.” 27 times, “Fixed test.” 19 times, “Fixed javadoc.” 17 times, “Fix build” 17 times. Most of the pairs of builds modify at least one source code file but it is less frequent that the developers do not also change a different type of file. This indicates that BugSwarm contains similar type of changes that could introduce APR and FL overfitting. It also shows that 73.63% (1,301) of the builds change at least one non-source file. Consequently, the techniques have to support multiple file types in order to be evaluated on BugSwarm.
The median time to fix a build is low at 33 minutes. Especially, when we consider the median time that is required to fix a bug like presented by Valdivia et al. [12]. They indicate that it takes for eight open-source projects between 35 and 204 days. This highlight, a big difference between build fixes and bug fixes. For example, we observe that some bug fixes consist of ignoring or commenting tests to make the build passes. This type of fix does not fix the regression in the application but keep the build status in the green. It is the case for example for the build petergeneric-stdlib-160464757. Figure 3 shows the distribution of the fixing time. It indeed shows that 58% (1,024/1,767) of the build are fixed within one hour and that 86.59% of the builds are fixed in less than one day. Only 54 builds are fixed after one week.
Finally, the failing execution are finishing faster than the passing build. It takes on average one minute and ten seconds less to execute (22.5%). This indicates that the changes between the buggy and passing builds are important. They impacts significantly the execution time of the failing builds. Therefore, BugSwarm is a challenging target for APR and FL.
We now focus our analysis on the diff itself. Table V and Table VI present respectively the total number of files changed and the total number of changed lines in the BugSwarm benchmark without considering duplicate commits.
It shows BugSwarm, as expected, that it is mostly existing files that are modified. Only a small number of files are added and modified. Figure 4 details this analysis by listing the top 10 modified file types. It shows that the main source files of are indeed the most frequently modified with 6,975 files for Java and 2,037 files for Python. It highlights the fact that Java projects are more likely to modify more files than Python projects.
Table VI shows that the number of added line vs. removed line in existing files are relatively similar in the total but differ for each language. Indeed, Java diffs contain more added lines than removed one, and it is the opposite for Python. It is a good and bad news for automatic program repair and fault localization. It means that the majority of the changes are in type of files that are handled by the tools but it also shows that the diffs are big. Most of the current approaches only handle changes in one location which is not the case in the majority of BugSwarm’s pairs of builds.
| Metric | Java | Python | All |
|---|---|---|---|
| # Modified files | 9,756 | 3,321 | 13,077 |
| # Added files | 1,086 | 470 | 1,556 |
| # Removed files | 872 | 49 | 921 |
| Avg. # changed files | 9.97 | 4.25 | 7.71 |
| Metric | Java | Python | All |
| # Added lines in modified files | 431,880 | 182,707 | 614,587 |
| # Removed lines in modified files | 410,086 | 326,831 | 736,917 |
| # Added lines in added files | 102,097 | 121,607 | 223,704 |
| # Removed lines in removed files | 235,225 | 2,551 | 237,776 |
| Avg. patch size | 1182 | 824 | 1026 |
| Failure type | Duplicate Commit | Unique Commit | ||||
|---|---|---|---|---|---|---|
| Java | Python | Total | Java | Python | All | |
| Test failure | 932 (54.86%) | 906 (72.48%) | 1,838 (62.33%) | 575 (57.62%) | 487 (63.33%) | 1,062 (60.1%) |
| Checkstyle | 320 (18.83%) | 8 (0.64%) | 328 (11.12%) | 149 (14.93%) | 5 (0.65%) | 154 (8.72%) |
| Compilation error | 263 (15.48%) | 33 (2.64%) | 296 (10.04%) | 167 (16.73%) | 16 (2.08%) | 183 (10.36%) |
| Doc generation | 0 | 171 (13.68%) | 171 (5.8%) | 0 | 170 (22.11%) | 170 (9.62%) |
| Missing license | 21 (1.24%) | 0 | 21 (0.71%) | 13 (1.3%) | 0 | 13 (0.74%) |
| Dependency error | 20 (1.18%) | 0 | 20 (0.68%) | 12 (1.2%) | 0 | 12 (0.68%) |
| API Regression | 4 (0.24%) | 0 | 4 (0.14%) | 2 (0.2%) | 0 | 2 (0.11%) |
| Unable to clone | 3 (0.18%) | 0 | 3 (0.1%) | 3 (0.3%) | 0 | 3 (0.17%) |
| Missing main file | 1 (0.06%) | 0 | 1 (0.03%) | 1 (0.1%) | 0 | 1 (0.06%) |
| Unknown | 132 (7.77%) | 129 (10.32%) | 261 (8.85%) | 74 (7.41%) | 89 (11.57%) | 163 (9.22%) |
Furthermore, we observe that the diffs from the Docker images are not always identical to the original diff generated by GitHub between the failing and passing commits. For example, for the build ansible-ansible-79500861, GitHub sees 494 changes in the file CHANGELOG.md222GitHub diff for ansible-ansible-79500861 builds: https://github.com/ansible/ansible/compare/c747109db9e6bcd7185a3e1e2d451494c035f402..e0a50dbd9287e7fc3d81bfe7fb49972cb4900599 but none is visible inside the BugSwarm image.333Generate the diff inside BugSwarm image bugswarm run --image-tag ansible-ansible-79500861 --pipe-stdin <<< "cd; cd build; diff -r failed passed" We did not manage to find an explanation that explains this difference.
III-C3 Reasons for Failures
For the final angle, we analyze the reasons of build failures. In this study, we analyze the failing execution log to extract the reasons for the failures. We identify nine different reasons that are presented in Table VII.
Based on this categorization, we observe that test failures are by far the most common reasons for failure with 1,838 builds that fail due to this reason. It is followed by checkstyle errors and compilations errors with respectively 328 and 296 occurrences. The following reason, Doc generation, is only present in one project: terasolunaorg-guideline. This project contains all the documentation for the TERASOLUNA Server Framework.
Answer to RQ1. What are the main characteristics of BugSwarm’s pairs regarding FL and APR requirements? BugSwarm is reported to have 3,091 pairs of builds however 142 of them are not reproduced five times which is in contradiction with BugSwarm’s paper. Consequently, we considered 2,949 pairs of builds from 156 projects. 63.3% of those builds contain a unique commit id and are on average 2.56 years old. 58% of the builds have been fixed within an hour. The human patches contain on average 7.71 files changes and a similar amount of addition and removal of lines. Moreover, 73.63% (1,301) of the builds change at least one non-source file. And the most frequent cause of failure is a failing test case that represents 62% of the case followed by checkstyle errors and compilation errors. Considering those numbers, it indicates that APR and FL need to be able to localize and handle multilocation faults and support multiple file types in order to be able to target most of the BugSwarm builds.
III-D RQ2. BugSwarm Execution and Storage Cost
In this second research question, we analyze the usage cost of BugSwarm with a specific focus on execution time and storage.
First of all, we present the workflow of BugSwarm usage.
-
1.
The first step is to list the available pairs of builds of BugSwarm to get the Docker Tag ID. This first step requires an access token to BugSwarm’s API.
-
2.
Select the builds to execute, for example, a build from a specific project that fails due to a checkstyle error.
-
3.
Download and extract the Docker image. This step is handled directly by Docker.
-
4.
Setup the experiment. This step is project dependent. BugSwarm provides a folder that is shared with the Docker image (/bugswarm-sandbox/ is mapped with /bugswarm-sandbox/ inside the Docker image) that is used copy files and tools from the local machine to the Docker image. This is the main infrastructure to run an experiment on BugSwarm.
-
5.
Start the Docker image. BugSwarm provides two different execution modes. The first mode is an interactive one, it creates an ssh connection between the host and the docker image where one can interact with builds using a command line interface. The second mode allows providing a command line that will be automatically executed when the image is started. The second execution mode is more appropriate for a large scale execution.
-
6.
The final step is the execution of the experiment itself.
| Metrics in GB | Java | Python | All |
|---|---|---|---|
| BugSwarm Docker layer size | 5,107 | 3,813 | 8,921 |
| BugSwarm unique Docker layer size | 1,327 | 919 | 2,246 |
| Avg. size | 3.01 | 3.05 | 3.03 |
| Download all layers (80 Mbits/s) | 6d, 7.8h | 4d, 17.3h | 11d, 1.16h |
| Download unique layers (80 Mbits/s) | 1d, 15.4h | 1d, 3.3h | 2d, 18.8h |
Based on the described workflow, we now present our analysis of BugSwarm usage in term of execution time and storage. We identify that step number three is the step that impacts the most the execution time and the storage required by the experiment. Table VIII presents the size of BugSwarm Docker images. The first line shows the total amount of data that has to be downloaded. According to our observations, the ratio between download size and disk storage is 2.48 x and drops to 0.41 x when considering the duplicate layers. For example, the image scikit-learn-scikit-learn-83097609 requires to download 3.40 GB and takes 7.06 GB space on the disk if stored alone but takes 1.394 GB if the shared layers are already downloaded. Based on this observation, we estimate the total disk space required to 3,680.45 GB. Note, that this ratio between download size and disk storage has been computed on OSX with Docker 18.09.2. The ratio can be different on different os and Docker version.
The second line of Table VIII presents the total amount of data to download BugSwarm if all the Docker layers are conserved. Each Docker image is divided into different layers, the layers are shared between the different images and consequently reduce the total amount of data that need to be downloaded. Unfortunately, we observe that above 350 GB of Docker images, Docker slows dramatically down the computer and the images have to be removed at a frequent interval to make the computer responsive again. However, it increases the total amount of data to download and to decompress, and therefore the execution time of the machine.
The third line presents the average image size, it shows that on average the Python images are slightly bigger than the Java ones. The fourth and fifth lines contain respectively the amount of time to download all the layers and the unique layers with a stable connection of 80 Mbits/s. With this connection, it takes between 2 and 11 days to download BugSwarm, depending on the number of Docker layers that need to be downloaded.
Based on those numbers, we estimate the cost to download BugSwarm on an Amazon Cloud Instance to be 45.24 USD. This estimation has been computed by selecting the cheapest virtual machine with 16 GB of RAM.444Amazon stockade pricing: https://aws.amazon.com/en/ec2/pricing/on-demand/ visited the 24 April 2019 This machine costs 0.166,4 USD per hour, the renting of the machine is 0.166,4 USD/h 2d, 18.8h 11.11 USD.
We now estimate the cost of the storage. The storage on AWS is 0.10 USD per GB per month.555Amazon stockade pricing: https://aws.amazon.com/en/ebs/pricing/ visited the 24 April 2019 There are 8,921.94 GB 0.41 3,680.45 GB to store which costs 368.05 USD per month or 0.51 USD per hour. Consequently, the storage costs 0.51 USD/h 2d, 18.8h 34.13 USD to download completely BugSwarm. Fortunately, there is no cost to download data from the internet (Docker images).
Those costs do not consider the time required to decompress the images and the execution of an experiment. If we consider a 20 minutes experiment per build, it would result on a total of 983 h of execution which represents an additional cost of 0.51 USD/h 0.166,4 USD/h 983 h = 666.06 USD. Consequently, we estimate that the starting cost of using BugSwarm on AWS is 11.11 USD 34.13 USD 666.06 USD 711.30 USD. This cost is the cost of a single execution and does not include the cost of transferring the data from AWS to a different machine (like transferring to final results to a local machine).
This costs and the execution time can significantly be reduced by selecting the pairs of builds to execute. This question of build selection is discussed in the following research question.
Answer to RQ2. What is the execution and storage cost of BugSwarm? The estimated cost to download BugSwarm’s pairs of builds on an Amazon Cloud Instance is 45.24 USD, plus an estimated additional cost of 711.30 USD to run an experiment of 20 minutes on each build. This cost is estimated by considering 3,680.45 GB of storage required by BugSwarm and the 2 days and 18.80 hours to download it. This cost is mostly due to the Docker images that improve the reproducibility of the pairs of builds. We consider that it is a reasonable overhead if an access to servers like AWS servers is possible but unpractical for consumer grade hardware.
III-E RQ3. BugSwarm for APR and FL
In this research question, we are looking at the usage of BugSwarm for the specific field of automatic program repair and fault localization.
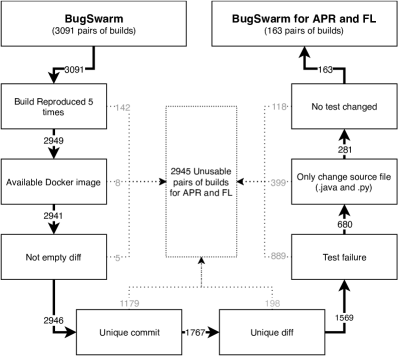
Based on the requirements presented in Section II-B, we identify seven filters to select the pairs of builds that are potentially compatible with automatic program repair and fault localization. Figure 5 presents the different filters and their impact on the number of pairs of builds.
-
1.
Build reproduced five times. This filter is presented in BugSwarm’s paper [4] to ensure that the pairs of builds are reproducible.
-
2.
Available docker image. We identify eight Docker images that are missing. We remove them since they cannot be used.
-
3.
Not Empty diff. We only consider the pairs of builds are not empty. Since the changes can be related to configuration. The current literature of automatic program repair and fault localization does not target this problem/
-
4.
Unique commit. 1,179 pairs of builds have a failing commit that is already present in BugSwarm. We remove those pairs of builds since all current approaches are currently working on the source code, the same bug will be the same on different pairs of builds which can lead to bias in the experiment.
-
5.
Unique diff. This filter is similar to the previous one but verifies that the diff of each pair of builds is unique.
-
6.
Test-case failure. The current approaches of automatic program repair and fault-localization rely on a failing test-case to expose the bug, without a failing test-case those approaches cannot be executed.
-
7.
Only change source file. This filter removes all the pairs of builds that modify files that are not source code (.py or .java). We apply this filter since to our knowledge no approach is able to handle non-source code files.
-
8.
No test changed. The final filter removes the pairs of builds that modify a test-case. We remove those builds since the modification of the test case change the oracle and therefore the buggy version of the application contain either an invalid oracle or not up-to-date one.
After applying the outlined filters on BugSwarm, we are reduced down to 163 pairs of builds, 65 for Java and 98 for Python. Intriguingly, 154 of the 163 pairs of builds have been fixed in less than 24 hours (94% of which have been fixed within one hour).
We then manually categorize those 163 pairs of builds into three categories of patches: 1. Bug fix is a patch that we identify as a bug fix 2. Non-bug fix is a patch that we identify as not a bug fix 3. Unknown is a patch that we did not succeed to categorize to due to a lack of domain knowledge. Figure 6 presents the results of our manual analysis. It shows that we identify 112 patches that fix a bug, 50 for Java and 62 for Python. 40 pairs of builds have been identified as not a fix for a bug and 11 others as unknown.
We provide the complete list of builds in our repository [11] and a website [10] that allows browsing, filtering and searching BugSwarm’s pairs of builds. The website illustrates the impact of the different builds nicely. We recommend the reader to check it to have the perspective of BugSwarm’s content.
Answer to RQ3. Which pairs of builds meet the requirements of Automatic Program Repair (APR) and Fault Localization (FL) techniques? We design eight filters to select the pairs of builds based on the requirements of APR and FL (see Section II-B). We identify 146 compatible pairs of builds, 81 for Java and 66 for Python which represent 4.72% of the BugSwarm benchmark. On those 146 pairs of builds, we identify manually 99 bug fix (3.2%), 48 for Java (2.62%), 51 for Python (4.03%).
IV Discussion
IV-A Failing builds vs. bugs
BugSwarm is a benchmark of pairs of builds, however, its name, BugSwarm, is misleading. It leads one to think that it is a benchmark of bugs. Only by analyzing the content of a benchmark that is possible to realize its true nature. Indeed, we showed in RQ1 (see Section III-C) that there are ten different reasons producing failing builds, such as test failures, checkstyle, compilation errors. Where only the test failures expose bugs, the other types of failures do not produce incorrect behavior and therefore should not be considered as bugs. For example, the build checkstyle-checkstyle-77722344 fails because of a checkstyle error: Redundant ‘public’ modifier, as visible in its execution log: https://travis-ci.org/checkstyle/checkstyle/jobs/77722344, SonarSource-sonar-java-74910602 fails because it is unable to clone one of its submodules: https://travis-ci.org/SonarSource/sonar-java/jobs/74910602.
The confusion between BugSwarm’s name and its actual content can lead to invalid recommendations from reviewers or, much worse, incorrect analysis of empirical evaluations that use BugSwarm blindly. We would like to bring to terms the importance of the name especially for artifacts that are designed to be used for other researchers.
IV-B Comparison between BugSwarm and existing benchmarks for APR and FL
There are a growing number of benchmarks for automatic program repair and fault localization, for example, Defects4J [5], Bears [2], IntroClass [6], ManyBugs [6], IntroClassJava [7], Bugs.jar [8], QuixBugs [9], BUGSJS [1]. BugSwarm shares with Bears [2] the modus operandi used to collect the data in the benchmark, they both use TravisCI builds as source.
BugSwarm and Bears are the most similar benchmarks, both of them use TravisCI to collect builds. Bears [2] focuses on bugs by reproducing the build and manually analyzed the human patch, whereas BugSwarm focuses on reproducible pairs of builds in a more generic way. BugSwarm’s infrastructure is unique: it is the only benchmark that encapsulated each artifact in a Docker image. This infrastructure comes with the advantage of an improved reproducibility. However, it will still suffer from unreproducible builds due to invalid dependencies, for example, a snapshot version can be updated with breaking changes that will break the compilation of a BugSwarm artifact. Indeed, the Docker image does not include the dependencies of the application which can lead to missing or invalid dependencies. This problem is the most frequent source of unreproducibility of builds according to BugSwarm’s authors. Docker images come also with disadvantages such as a considerable size and execution overhead, as shown in RQ2 (see Section III-D). For the readers’ reference, the repository [11] that contains all the sources of all the builds is less than 2GB, compared to 3,680.45GB of BugSwarm.
The BugSwarm diffs between the failing and passing version are also different from the existing benchmark. Sobreira et al. [13] observe that the average patch size in Defects4J is 4 lines. Madeiral et al. [2] report a patch size of 8 lines in Bears. In BugSwarm, we observe an average patch size of 1,026 lines. This difference of size highlights the difference of nature of BugSwarm compared to the other benchmarks.
To sum up, the difference between BugSwarm and the literature is threefold:
-
•
A benchmark of reproducible builds that can support new researches on build repair;
-
•
The diffs are much bigger than the literature;
-
•
A novel infrastructure to store and interact with bugs.
IV-C Lessons learned
| Lessons learned |
Defects4J |
Bugs.jar |
Bears |
QuixBugs |
iBugs |
ManyBugs |
IntroClass |
IntroClassJava |
BUGSJS |
BugSwarm |
| Target | ✓ | ✓ | ||||||||
| Exploration | ✓ | ✓ | ||||||||
| Dependencies | ✓ | |||||||||
| Access | ✓ | ✓ | ||||||||
| Documentation | ✓ | ✓ | ✓ | |||||||
| Versioning | ✓ |
Our analysis of BugSwarm allowed us to understand what constitutes a reasonable benchmark that is suited to fault localization and automatic program repair. In this section, we discuss several recommendations on how to build and make available benchmarks of bugs. Also, we draw some conclusions on how to improve BugSwarm.
-
1.
[Target] The first recommendation is to think of the requirements of the research fields that the benchmark target. In this case, APR and FL require bugs to be exposed by a failing test case as well as metadata about each bug such as the location of the source and/or the binaries. A benchmark that fails to provide such information is ill-suited to fault localization and automatic program repair;
-
2.
[Exploration] The second recommendation is to provide the diff of each artifact. The diff can be easily understood by humans and give a quick understanding of the content of the artifact. We also recommend providing a selection of artifacts for each research field if all the artifacts are not compatible with the research field. This ensures that the same selection is used across papers and guaranty a fair comparison between approaches;
-
3.
[Dependencies] The next recommendation is to improve the reproducibility of the benchmark by including the dependencies of your artifacts since it is the main reason for unreproducibility (as pointed out by the authors of BugSwarm);
-
4.
[Access] Provide full access to your benchmark and metadata. Benchmarks are by nature an artifact that should be used in different research works to compare against other related solutions. Furthermore, Offer the tools used to create the benchmarks as open source – it is required to ensure the representativeness of the benchmarks;
-
5.
[Documentation] Make sure to have proper documentation for your benchmark that explains how to checkout one single bug but also how to execute a large scale experiment on it. And avoid “coming soon” messages or at least provide an email address with that message.;
-
6.
[Versioning] When benchmarks evolve, it is important to version it, to be able to always point out a previous version that was used in a specific experiment. Indeed, without a version number it is difficult for authors to refer to which version of the benchmark and therefore readers cannot know which artifacts have been used. We recommend that each time a new artifact is added to the benchmark, a new version is created like it is done in Bears benchmark [2].
IV-D Threats to Validity
As any implementation, the scripts that we use to collect BugSwarm’s builds and the metrics are potentially not free of bugs. A bug might impact the results we reported in Section III. However, the script and the raw output are open-source and publicly available for other researchers and potential users to check the validity of the results.
Moreover, BugSwarm could also be impacted by potential bugs and the benchmark itself can be updated in the future. Therefore, the observed result can differ in the future. However, we provide all the scripts that are required to redo this analysis and update if needed. Moreover, the website and the repository can be updated to take into account the changes in BugSwarm.
This analysis focuses on the nowadays requirements of automatic program repair and fault localization techniques. Those requirements can evolve with the time, and therefore the bug selection presented in RQ3 (see Section III-E) can be inadequate in the future.
IV-E Discussion with BugSwarm’s Authors
We communicated our results with BugSwarm’s authors to get their feedback and opinion on it. It engendered a really interesting discussion about their vision and future directions for the benchmark. On the one hand, their feedback gave us the opportunity to improve and clarify the paper. On the other hand, our work allowed them to identify and fix issues in BugSwarm such as: duplicate artifact id, inconsistent number of pairs of builds, unavailable Docker images. We would like to thank them for their responsiveness and feedbacks.
V Related Works
V-A Benchmarks
We first present the benchmarks for automatic program repair and fault localization from the literature. The literature contains several benchmarks of Java bugs. Defects4J [5] is the most used benchmark for automatic program repair and fault localization. It contains 395 minimized bugs from six widely used open source Java projects. It has been created by mining Apache issue tracker. Bugs.jar [8] contains 1,158 bugs from eight Apache projects. It was created using the same strategy than Defects4J. IntroClassJava [7] contains 297 bugs from six different student projects. It is a transpiled version to Java of the bugs from the C benchmark IntroClass [6]. Bears [2] contains 251 bugs from 72 different GitHub projects. It was created by mining TravisCI builds. And iBugs [14] which contains 390 Java bugs.
The literature also contains benchmark of C programs such as: SIR [15] is a benchmark of seeded faults from nine small to medium-scale programs in C language. ManyBugs [6] contains 185 bugs from nine open-source C programs. IntroClass [6] contains 572 bugs from six student programs.
We decided to analyze BugSwarm instead of the other benchmark of the literature since BugSwarm is a new benchmark that will enjoy good visibility through ICSE conference and also because its creation process and its content are different from other benchmarks.
V-B Benchmark Analysis
The literature contains some studies on existing benchmarks of bugs. defect characteristics: defect importance, complexity, independence, test effectiveness, and characteristics of the human-written patch. Sobreira et al. [13] also analyze Defects4J but focus on the identification of repair actions and repair patterns. Madeiral et al. [16] automatize the extraction of repair actions and repair patterns from diff. Wang et al. [17] present a study that analyzes the impact of ignoring the project Mockito from empirical evaluations that use Defects4J. They show that automatic program repair techniques have poorer performance on Mockito and ignoring it can introduce misleading results. It highlights the importance of the selection of the artifacts from benchmarks.
Some benchmarks also include an analysis of their content. iBugs [14], Codeflaws [18] and Bears [2] contain annotated bugs with size and syntactic properties on their patches. ManyBugs [6] analyses the patches and annotate the bugs when functions, loops, conditional and function calls were added or when function signatures are changed. Those analyses are comparable to the analysis included in BugSwarm paper even if the results of the analysis a different like presented in Section IV-B.
This paper presents an analysis using different metrics such as fix time, size of the benchmark, execution time, cost, or failure type. Moreover, it also includes an analysis of the content of the benchmark regarding the research field that it targets.
VI Conclusion
This paper presents an analysis of the BugSwarm benchmark. We start off by analyzing the pairs of builds, the human patches, and failure reasons. We observed that 142 pairs of builds do not match BugSwarm’s including criteria (has to be reproduced five times), 1,182 pairs of builds contain duplicate commits, and 8 pairs of builds are no longer available. The human patches modify on average 1,026 lines in 7.71 files. The failing builds fails for 62.32% due to a test, 11.12% due to a checkstyle error and 10.03% for a compilation error.
We then analyzed the overhead introduced by the BugSwarm infrastructure compared to a traditional repository. We estimate the overhead as 45.24 USD, 2d, 18.8h and 3,680.45 GB. This is the costs of an improved reproductivity.
Finally, we analyzed BugSwarm with the optic to use BugSwarm for automatic program repair and fault localization. We identify six requirements that are needed in order to be able to use the pairs of builds in such domains: availability, uniqueness of the commit, uniqueness of the diff, source code based, test failure, test-suite not modified. We manually identified 163 potentially relevant pairs of builds, and we determined that 112 of them are bug fixes, 40 non-bug fixes and 11 unknowns.
BugSwarm has been presented as a benchmark of pairs of builds for automatically program repair and fault localization but only 112/3,091 (3.6%) are compatible with the current automatic program repair, and fault localization approaches — a number that falls short of other related benchmarks. Moreover, BugSwarm’s name is confusing, it makes one think that the benchmark contains bugs, but it is a benchmark of builds which is conceptually rather different.
During our study, we have collected a number of findings on the requirements that make a benchmark well suited for fault localization and program repair. We have discussed this in detail, paving the way for upcoming benchmark sets.
Acknowledgments
This material is based upon work supported by Fundação para a Ciência e a Tecnologia (FCT), with the reference PTDC/CCI-COM/29300/2017.
References
- [1] P. Gyimesi, B. Vancsics, A. Stocco, D. Mazinanian, A. Beszédes, R. Ferenc, and A. Mesbah, “Bugsjs: A benchmark of javascript bugs,” in Proceedings of the 12th International Conference on Software Testing, Verification, and Validation, ICST. To appear, 2019.
- [2] F. Madeiral, S. Urli, M. Maia, and M. Monperrus, “Bears: An Extensible Java Bug Benchmark for Automatic Program Repair Studies,” in Proceedings of the 26th IEEE International Conference on Software Analysis, Evolution and Reengineering (SANER ’19). Hangzhou, China: IEEE, 2019, pp. 1–11, to appear. [Online]. Available: https://arxiv.org/abs/1901.06024
- [3] A. Majd, M. Vahidi-Asl, A. Khalilian, A. Baraani-Dastjerdi, and B. Zamani, “Code4bench: A multidimensional benchmark of codeforces data for different program analysis techniques,” Journal of Computer Languages, 2019.
- [4] N. Dmeiri, D. A. Tomassi, Y. Wang, A. Bhowmick, Y.-C. Liu, P. Devanbu, B. Vasilescu, and C. Rubio-González, “Bugswarm: Mining and continuously growing a dataset of reproducible failures and fixes,” in Proceedings of the 41th International Conference on Software Engineering, 2019.
- [5] R. Just, D. Jalali, and M. D. Ernst, “Defects4J: A Database of Existing Faults to Enable Controlled Testing Studies for Java Programs,” in Proceedings of the 23rd International Symposium on Software Testing and Analysis (ISSTA ’14). New York, NY, USA: ACM, 2014, pp. 437–440. [Online]. Available: http://doi.acm.org/10.1145/2610384.2628055
- [6] C. Le Goues, N. Holtschulte, E. K. Smith, Y. Brun, P. Devanbu, S. Forrest, and W. Weimer, “The ManyBugs and IntroClass Benchmarks for Automated Repair of C Programs,” IEEE Transactions on Software Engineering, vol. 41, no. 12, pp. 1236–1256, Dec. 2015.
- [7] T. Durieux and M. Monperrus, “IntroClassJava: A Benchmark of 297 Small and Buggy Java Programs,” University of Lille, University of Lille, Tech. Rep. #hal-01272126, 2016.
- [8] R. K. Saha, Y. Lyu, W. Lam, H. Yoshida, and M. R. Prasad, “Bugs.jar: A Large-scale, Diverse Dataset of Real-world Java Bugs,” in Proceedings of the 15th International Conference on Mining Software Repositories (MSR ’18). New York, NY, USA: ACM, 2018, pp. 10–13. [Online]. Available: http://doi.acm.org/10.1145/3196398.3196473
- [9] D. Lin, J. Koppel, A. Chen, and A. Solar-Lezama, “QuixBugs: A Multi-Lingual Program Repair Benchmark Set Based on the Quixey Challenge,” in Proceedings of the 2017 ACM SIGPLAN International Conference on Systems, Programming, Languages, and Applications: Software for Humanity (SPLASH Companion 2017). New York, NY, USA: ACM, 2017, pp. 55–56. [Online]. Available: http://doi.acm.org/10.1145/3135932.3135941
- [10] Anonymous, “BugSwarm browsing website,” https://tqrg.github.io/BugSwarm/, 2019.
- [11] ——, “BugSwarm artifacts and scripts,” https://github.com/TQRG/BugSwarm, 2019.
- [12] H. Valdivia Garcia and E. Shihab, “Characterizing and predicting blocking bugs in open source projects,” in MSR’14. ACM, 2014, pp. 72–81.
- [13] V. Sobreira, T. Durieux, F. Madeiral, M. Monperrus, and M. de Almeida Maia, “Dissection of a bug dataset: Anatomy of 395 patches from defects4j,” in 2018 IEEE 25th International Conference on Software Analysis, Evolution and Reengineering (SANER). IEEE, 2018, pp. 130–140.
- [14] V. Dallmeier and T. Zimmermann, “Extraction of Bug Localization Benchmarks from History,” in Proceedings of the 22nd IEEE/ACM International Conference on Automated Software Engineering (ASE ’07). New York, NY, USA: ACM, 2007, pp. 433–436. [Online]. Available: http://doi.acm.org/10.1145/1321631.1321702
- [15] H. Do, S. Elbaum, and G. Rothermel, “Supporting controlled experimentation with testing techniques: An infrastructure and its potential impact,” Empirical Software Engineering, vol. 10, no. 4, pp. 405–435, 2005.
- [16] F. Madeiral, T. Durieux, V. Sobreira, and M. Maia, “Towards an automated approach for bug fix pattern detection,” arXiv preprint arXiv:1807.11286, 2018.
- [17] S. Wang, M. Wen, X. Mao, and D. Yang, “Attention please: Consider mockito when evaluating newly proposed automated program repair techniques,” in Proceedings of the Evaluation and Assessment on Software Engineering. ACM, 2019, pp. 260–266.
- [18] S. H. Tan, J. Yi, Yulis, S. Mechtaev, and A. Roychoudhury, “Codeflaws: A Programming Competition Benchmark for Evaluating Automated Program Repair Tools,” in Proceedings of the 39th International Conference on Software Engineering Companion (ICSE-C ’17). Piscataway, NJ, USA: IEEE Press, 2017, pp. 180–182. [Online]. Available: https://doi.org/10.1109/ICSE-C.2017.76