A definitive merger-AGN connection at 0 with CFIS: mergers have an excess of AGN and AGN hosts are more frequently disturbed.
Abstract
The question of whether galaxy mergers are linked to the triggering of active galactic nuclei (AGN) continues to be a topic of considerable debate. The issue can be broken down into two distinct questions: 1) Can galaxy mergers trigger AGN? 2) Are galaxy mergers the dominant AGN triggering mechanism? A complete picture of the AGN-merger connection requires that both of these questions are addressed with the same dataset. In previous work, we have shown that galaxy mergers selected from the Sloan Digital Sky Survey (SDSS) show an excess of both optically-selected, and mid-IR colour-selected AGN, demonstrating that the answer to the first of the above questions is affirmative. Here, we use the same optical and mid-IR AGN selection to address the second question, by quantifying the frequency of morphological disturbances in low surface brightness -band images from the Canada France Imaging Survey (CFIS). Only 30 per cent of optical AGN host galaxies are morphologically disturbed, indicating that recent interactions are not the dominant trigger. However, almost 60 per cent of mid-IR AGN hosts show signs of visual disturbance, indicating that interactions play a more significant role in nuclear feeding. Both mid-IR and optically selected AGN have interacting fractions that are a factor of two greater than a mass and redshift matched non-AGN control sample, an excess that increases with both AGN luminosity and host galaxy stellar mass.
keywords:
galaxies: active, galaxies: ISM, galaxies: Seyfert1 Introduction
It has long been understood that interactions between galaxies can cause a loss of angular momentum in the gaseous component of the interstellar medium (ISM), leading to inflows towards the galactic centre (e.g. Barnes & Hernquist 1991; but see Gabor et al. 2016 and Blumenthal & Barnes 2018 for a more contemporary perspective). The predicted effects of these gas inflows, that channel gas inwards from the galactic outskirts, include central boosts in the star formation rate and dilution of the central gas phase metallicity (e.g. Montuori et al. 2010; Perez et al. 2011; Torrey et al. 2012; Moreno et al. 2015). These predictions are well established observationally (e.g. Kewley et al. 2010; Scudder et al. 2012; Ellison et al. 2013; Patton et al. 2013; Thorp et al. 2019).
A further prediction of merger-triggered gas inflows is that they can provide fuel for accretion onto the central supermassive black hole (e.g. Cattaneo et al. 2005; Di Matteo et al. 2005; Capelo et al. 2015, 2017). However, in contrast to the predictions of the effect of mergers on star formation and the metallicity of the ISM, the observational connection between mergers and nuclear accretion has seen much controversy. There is an extensive literature both supporting (e.g. Keel et al. 1985; Alonso et al. 2007; Woods & Geller 2007; Koss et al. 2010, 2012; Ellison et al. 2011; Silverman et al. 2011; Bessiere et al. 2012; Cotini et al. 2013; Lackner et al. 2014; Satyapal et al. 2014; Weston et al. 2017; Goulding et al. 2018), and rejecting (Grogin et al. 2005; Li et al. 2008; Gabor et al. 2009; Reichard et al. 2009; Cisternas et al. 2011; Kocevski et al. 2012; Schawinski et al. 2015; Sabater et al. 2015; Mechtley et al. 2016; Marian et al. 2019) the link between mergers and the triggering of active galactic nuclei.
There are likely numerous reasons for the apparently conflicting observational results connecting AGN and mergers. The first is in the simple definition of what we mean by ‘AGN’ and how samples are selected. Accretion onto a supermassive black hole is a multi-wavelength phenomenon, with radiation emanating from the accretion disk, the dusty torus, the corona, jets and extended emission line regions, spanning the electromagnetic spectrum from the X-ray to the radio (e.g. Alexander & Hickox 2012 for a review). Not all AGN are simultaneously characterized by all of these phenomena (e.g. Trouille & Barger 2010; Mateos et al. 2013; Mendez et al. 2013; Azadi et al. 2017). Therefore, selecting AGN with different techniques leads to AGN (and host galaxies) with different properties (e.g. Hickox et al. 2009; Best & Heckman 2012; Mendez et al. 2013; Gurkan et al. 2014; Ellison et al. 2016). The impact of selecting AGN at different wavelengths on the interpretation of the merger-AGN connection was clearly demonstrated by Satyapal et al. (2014), who showed that mergers show a greater excess of mid-IR selected AGN, compared with AGN that are selected on the basis of their optical emission lines. Several other observational works have similarly connected mid-IR selected (or simply reddened) AGN with mergers (Urrutia et al. 2008; Glikman et al. 2015; Fan et al. 2016; Weston et al. 2017; Goulding et al. 2018; Donley et al. 2018). These studies indicate that merger triggered AGN tend to be obscured, and hence more readily identifiable in the mid-IR. Simulations have supported this hypothesis, showing that the high interstellar gas densities and high luminosities associated with merger-induced accretion lend themselves to identification using mid-IR colours (Blecha et al. 2018). That obscured AGN are connected with merger activity is also supported by studies of Compton thick AGN (Kocevski et al. 2015, Ricci et al. 2017; Koss et al. 2016, 2018). However, whilst both mid-IR selected and (to a lesser extent) optically selected AGN are more common in mergers than in isolated galaxies, low excitation radio galaxies appear to be secularly triggered (Ellison, Patton & Hickox 2015). The issue of a ‘merger-AGN connection’ therefore depends critically how one defines ‘AGN’.
Secondly, just as AGN are selected using different techniques, so are interacting galaxies. Mergers can variously be selected by using spectroscopic galaxy pairs (e.g. Alonso et al. 2004; Nikolic et al. 2004; Davies et al. 2015), which can be used effectively even at high redshifts (e.g. Lin et al. 2007; Wong et al. 2011), visual classifications (e.g. Darg et al. 2010; Kartaltepe et al. 2015), automated parametric morphology metrics (Lotz et al. 2004; Pawlik et al. 2016), or machine learning techniques (e.g. Ackermann et al. 2018; Walmsley et al. 2019). All of these methods have pros and cons. For example, in the era of large spectroscopic surveys, pair catalogs can be generated easily and contain large numbers, yet they often suffer from incompleteness (e.g. Patton & Atfield 2008). The human eye is a very effective search tool, but this method is subjective and time consuming. Parametric morphologies are quick to run, and reproducible, but are incomplete and likely sensitive to different stages in the merger sequence and different galaxy/interaction properties (e.g. Nevin et al. 2019). Machine learning is both reproducible, efficient and reaches beyond the parametric limitations of quantitative morphologies, but can be limited by the training set. Even for a given merger selection technique, identification will depend on the characteristics of the parent sample, such as depth and wavelength.
A third complication in the definition of AGN samples, and their connection with mergers, is the possibility of a luminosity dependence. Some of the earliest evidence for a connection between nuclear accretion and mergers came from observations of the very brightest members of the AGN family: quasars (Heckman et al. 1984; Hutchings et al. 1984, 1988; Stockton & MacKenty 1987). The most luminous radio-loud AGN are also dominated by mergers (Ramos-Almeida et al. 2011; 2012) and there is evidence that merger-induced AGN activity leads to more luminous AGN (e.g. Ellison et al. 2011; Liu et al. 2012; Satyapal et al. 2014; Alonso et al. 2018). However, there remains debate about whether there is a systematic dependence on the likelihood of a merger origin and the AGN luminosity (e.g. Treister et al. 2012, versus Hewlett et al. 2017; Villforth et al. 2017).
Finally, it is important to recognize that the issue of a merger-AGN connection is actually composed of two separate questions. The first is whether mergers can trigger AGN and the second is whether mergers are the dominant AGN trigger. The answer to the first question appears to have been definitively (at least at low ) answered by the clear statistical excess of AGN in merger (or close pair) selected samples (Woods & Geller 2007; Ellison et al. 2011, 2013, 2015; Khabiboulline et al. 2014; Satyapal et al. 2014; Weston et al. 2017). However, the fact that the frequency of morphological disturbances in the host galaxies of AGN is similar to that of non-AGN control galaxies has been used to argue that mergers are not the dominant AGN trigger (Gabor et al. 2009; Cisternas et al. 2011; Kocevski et al. 2012; Mechtley et al. 2016). Simulations have suggested the same, with mergers contributing to, but not necessarily dominating, the fuelling pathways of AGN (e.g. Draper & Ballantyne 2012; Bellovary et al. 2013; Menci et al. 2014; Steinborn et al. 2018).
Taken at face value, the above observations would seem to argue for a picture in which mergers are a possible, but not dominant mechanism for AGN triggering. However, as argued above, care must be taken when synthesizing the results from studies using different AGN selection techniques, in different luminosity regimes and also at different redshifts. Indeed, most of the studies that find no excess for morphological disturbances in AGN host galaxies are for X-ray selected AGN at , in contrast to the studies that find enhanced optical and mid-IR selected AGN fractions in mergers at . A more fair assessment of the merger-AGN connection requires using a single dataset to address both questions: 1) can mergers trigger AGN? 2) are most AGN triggered by mergers?
In previous work, we have used samples of close galaxy pairs, and recently coalesced post-mergers selected from the Sloan Digital Sky Survey (SDSS) to demonstrate that mergers can trigger optically selected AGN (Ellison et al. 2011, 2013; Satyapal et al. 2014), hence providing an affirmative answer to the first of the two questions above. In this paper, we present a complementary analysis in which we aim to answer the second question by quantifying how widespread AGN triggering is in the same SDSS sample. Therefore, whereas our previous work started with a merger sample and counted AGN, here we begin with an AGN sample and count the frequency of morphologically disturbed galaxies using deep -band imaging from the Canada-France Imaging Survey (CFIS).
The paper is laid out as follows. In Section 2 we describe our methods, including description of the AGN selection (both optical and mid-IR), compilation of the control samples, the CFIS imaging dataset and morphological classification schemes. Our results are presented in Section 3 with discussion in Section 4 and a summary in Section 5. We adopt a cosmology in which H0=70 km/s/Mpc, =0.3, =0.7.
2 Methods
2.1 The Canada-France Imaging Survey
CFIS is a Large Program, jointly led by Canada and France, currently on-going at the 3.6-metre Canada-France-Hawaii Telescope on Maunakea. The survey is conducted using the MegaCam wide-field optical imager, whose field of view covers a full square degree on the sky. The survey consists of observations in the and bands with 5 point-source depths of 24.85 and 24.4 mag in the and bands, respectively. During the lifetime of the survey (nominally 2017-2021) CFIS- will image 5000 sq. deg. above a declination of 30 degrees of which 3300 sq. deg. overlaps with the SDSS-Baryon Oscillation Spectroscopic Survey (BOSS) footprint. The -band observations will cover an even larger area – 10,000 sq. deg above a declination of 0 (for first results from the -band, see Ibata et al. 2017).
The CFIS observing strategy consists of three visits of one exposure each, with a third of the camera field of view offset in between each of the three exposures. This approach optimizes astrometric and photometric absolute calibration with respect to varying observing conditions, while ensuring any area on the survey footprint is covered by at least two exposures (the vast majority being naturally covered by three exposures). The large dithering allows a nocturnal sky background map to be derived on short time windows (30 minutes) and ensures a proper internal flattening of the background to restore the true flat nocturnal sky which in turns enables low surface brightness studies (Cuillandre et al., 2019, in prep).
The MegaCam images are processed at CFHT by the Elixir pipeline (Magnier & Cuillandre 2004) and delivered to CADC where they are calibrated against the Pan-STARRS PS1 survey (Magnier et al. 2016) for photometry, leading to a 0.4 percent absolute calibration, and Gaia DR2 (Brown et al. 2016) for astrometry with residuals just over 20 mas. CADC’s MegaPipe pipeline’s end products consist of optimized stacks and object catalogs.
As of May 2018, approximately 1900 sq. degrees of sky coverage had been obtained and processed and combined into 0.5 0.5 degree tiles in the -band; these are the CFIS data that are used for the present study. Approximately 110,000 galaxies with spectroscopic redshifts in the Main Galaxy Sample in the SDSS Data Release 7 (DR7) are covered by these -band tiles.
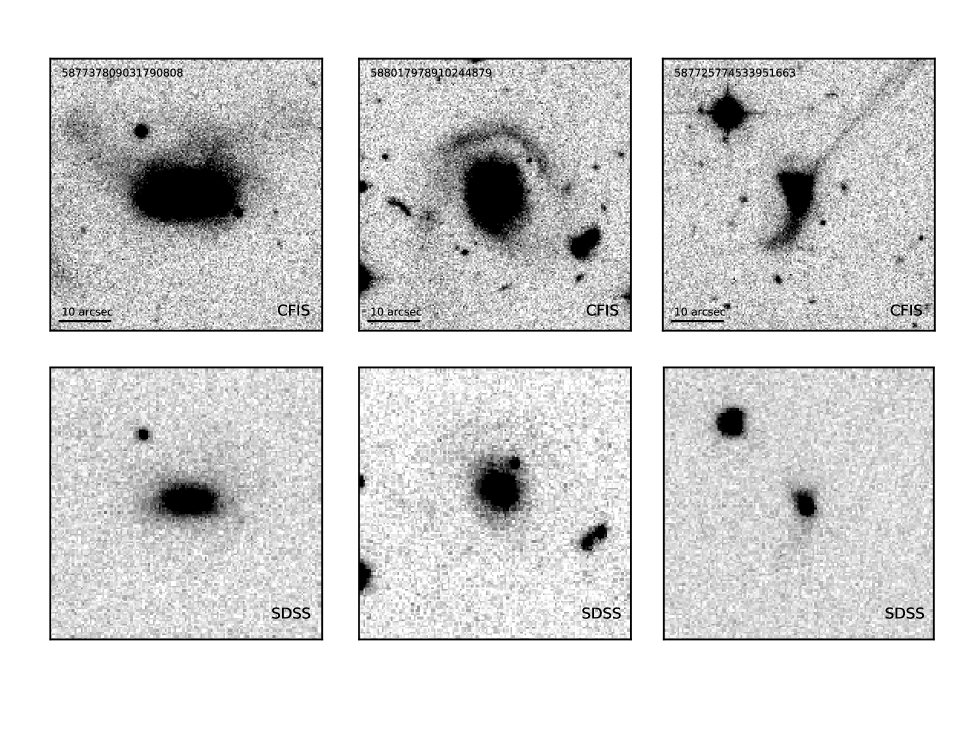
In Fig. 1 we demonstrate the quality of the CFIS -band images by comparing the CFIS image (top row) with SDSS -band image (bottom row) for 3 galaxies. A further selection of mergers identified in CFIS imaging is presented in the Appendix (Fig. 12). The superior quality of the CFIS -band images compared to the SDSS DR7 images is evident, a combination of the greater depth and better image quality of the former over the latter. Whereas the median -band seeing for the CFIS data is 0.65 arcsec (with a dispersion of only 0.1 arcsec), it is only 1.5 arcsec for the SDSS images. The pixel scale is also much finer for MegaCam than the SDSS CCDs: 0.18 arcsec compared to 0.4 arcsec. The postage stamps in Fig. 1 demonstrate that the CFIS images are able to reveal faint tidal features that are invisible on the SDSS images.
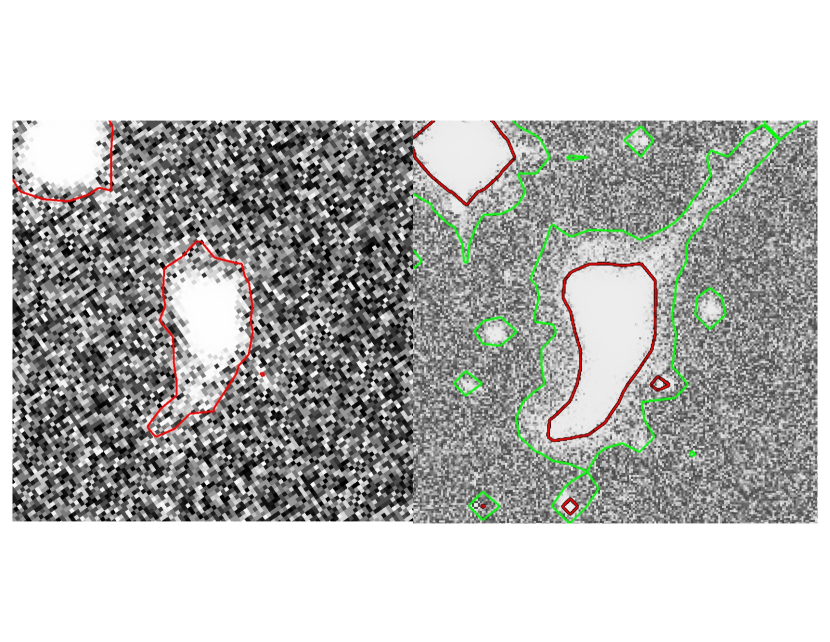
In order to provide a rough comparison between the surface brightness limits in SDSS and CFIS, we compared isophotes for the galaxy in the right hand column of Fig. 1 (SDSS objID=587725774533951663). The limiting isophote on the SDSS image (red outline in left panel of Fig 2) corresponds to 24.4 mag arcsec-2. For the CFIS image (right panel of Fig. 2) the limiting isophote (green contour) is almost 3 magnitudes deeper: 27.1 mag arcsec-2.
2.2 AGN sample selection
AGN are a multi-wavelength phenomena and the various selection techniques used to identify them target different structural components, such as the accretion disk, corona, jets or dusty torus. There is compelling observational evidence that selecting AGN in different wavelength regimes identifies different populations (e.g. Hickox et al. 2009; Mendez et al. 2013; Azadi et al. 2017). Although there is overlap between some of these detection techniques, some AGN are only identified at certain wavelengths, due either to the absence of certain components (e.g. radio jets or gas reservoirs), inclination effects or other observational biases. Importantly for this study, it has been argued that not all ‘flavours’ of AGN are likely to be triggered by mergers (e.g. Ellison et al. 2015), and that the fraction of AGN associated with mergers likely depends on the selection procedure (Satyapal et al. 2014; Blecha et al. 2018). We therefore identify AGN in our sample using two complementary techniques, using both optical emission line diagnostics and mid-IR colours.
2.2.1 Optical AGN sample
The optical AGN sample is based on galaxies in the SDSS DR7, as classified by the Kewley et al. (2001) scheme, which identifies galaxies strongly dominated by AGN emission. We require that a S/N 5 is achieved in all four of the emission lines on the AGN diagnostic diagram. This criterion largely excludes Low Ionization Nuclear Emission Line Regions (LINERs) from our sample, which is desirable given that many of these sources are not associated with AGN (e.g. Yan & Blanton 2012; Belfiore et al. 2016). Another advantage of using the Kewley et al. (2001) AGN classification is that the luminosity of the [OIII] emission line can be used as an indicator of AGN luminosity. However, we do not attempt to convert the [OIII] luminosity to a bolometric luminosity - the bolometric correction is both uncertain and would only result in a systematic shift to all our values. The [OIII] luminosity can therefore still be used as an indicator of relative AGN power within our sample.
Taken together, the Kewley et al. (2001) selection scheme and high S/N requirement yield a robust sample of galaxies whose emission lines are dominated by AGN. There are a total of 8419 AGN in the SDSS DR7 that fulfill these criteria. The positions of these 8419 DR7 AGN were cross-matched with the CFIS -band survey coverage, as of May 2018. The requirement of overlap with CFIS reduced the sample to 1269 AGN. However, upon visual inspection, 145 of these galaxies coincided with incomplete tiles, chip gaps or artefacts, leaving a sample of 1124 optical AGN. This relatively high fraction of ‘missing’ coverage is the result of the on-going nature of the survey, where not all tiles have yet had their observations completed. The distribution of stellar mass, redshift and the luminosity of the 5007 [OIII] line (taken from the MPA/JHU catalog, e.g. Kauffmann et al. 2003) for the optical AGN sample is presented in Fig. 3.

2.2.2 Mid-IR AGN sample
AGN can be identified from red mid-IR colours that result from radiation from the heated dust torus (e.g. Stern et al. 2005, 2012). We cross-match the Wide-Field Infrared Survey Explorer (WISE; Wright et al. 2010) to positions of galaxies in the SDSS DR7, requiring a match within 6 arcseconds (the full width at half maximum of the WISE point spread function in the W1 band). Various mid-IR colour cuts have been proposed in the literature, both for WISE and other mission band passes (e.g. Donley et al. 2007; Assef et al. 2013). The exact choice depends on several considerations, including the redshift range, balance of completeness versus purity, and the extent to which star formation may contribute (e.g. Hainline et al. 2016; Blecha et al. 2018). As was the case for the optical AGN sample described in the previous sub-section, for the purposes of our work it is preferable to select galaxies that are dominated by AGN emission in the mid-IR, with relatively little contribution from star formation or other ionizing processes. We therefore require a S/N 5 in both the and bands and impose a colour cut of (Stern et al. 2012) in order to identify the mid-IR AGN sample. There are 300 mid-IR AGN so selected.
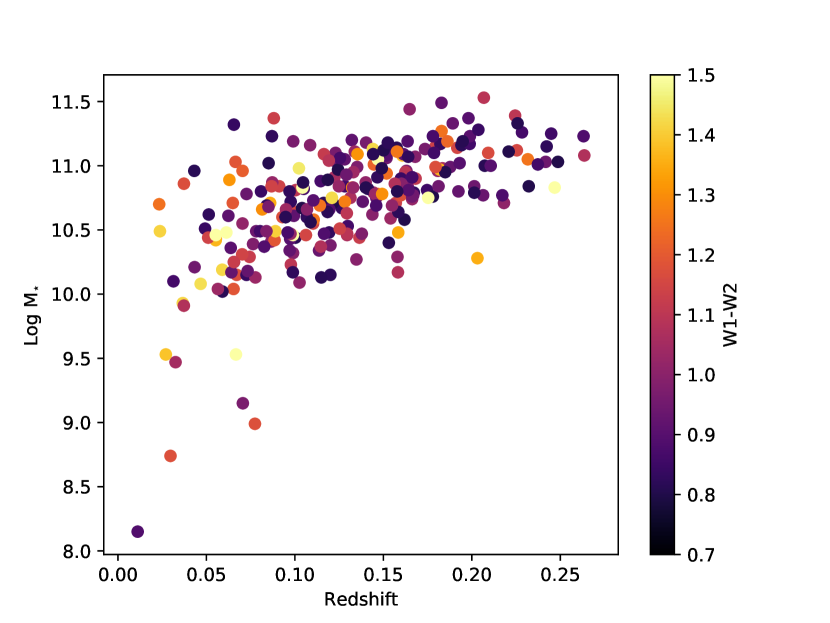
As was the case for the optical sample described in the previous sub-section, some of the mid-IR selected AGN fall on chip gaps, incomplete tiles or are otherwise affected by artifacts that render them unsuitable for visual classification. The final WISE AGN sample therefore contains 254 galaxies with CFIS coverage in the -band. The distribution of stellar mass, redshift and the colour for the mid-IR AGN sample is presented in Fig. 4.
2.3 Control matching
The control matching procedure is based on a ‘pool’ from which controls that are matched in stellar mass and redshift may be drawn. Control matching is done separately for the optical and mid-IR selected AGN samples, such that each of the two AGN samples has its own pool.
2.3.1 Optical AGN control pool
For the optically selected AGN sample, the control pool is taken to be any galaxy in the DR7 not classified to be an AGN according to the Kauffmann et al. (2003) emission line criterion. Note that although we used the Kewley et al. (2001) criterion to identify AGN, using the Kauffmann et al. (2003) demarcation for selecting non-AGN control galaxies conservatively removes from the control pool galaxies that have both star-forming and AGN contributions (commonly referred to as composites). The control pool for the optical AGN therefore contains galaxies classified as either star-forming according to Kauffmann et al. (2003), or with no emission line classification (i.e. they can be passive galaxies). Moreover, we relax the S/N criterion for the selection of the control pool; the S/N 5 threshold for AGN was chosen to aid the purity of the AGN sample against LINER contributions. The selection of non-AGN does not have this concern. The control pool is therefore composed of galaxies with S/N3 that are classified as star-forming by Kauffmann et al. (2003), as well galaxies with emission lines below this S/N threshold (essentially, non-star-forming galaxies). There are approximately 429,000 control pool galaxies in the SDSS DR7 that fulfill these criteria, of which 68,223 are in CFIS data coverage.
2.3.2 Mid-IR AGN control pool
For the mid-IR selected AGN sample, the control pool is taken to be any galaxy in the DR7 with . Note that, as was the case for the optically selected sample, we have put a buffer between our definition of AGN (selected to have ) and control galaxies. This is again to yield cleaner samples; whilst is generally accepted as a colour cut that identifies AGN dominated colours, obscured AGN may have bluer colours in the range (e.g. Blecha et al. 2018). The 0.5 criterion therefore provides a cleaner sample of non-AGN galaxies for the control pool. There are approximately 308,000 mid-IR control pool galaxies in the SDSS DR7, of which 50,994 are in the current CFIS data coverage.
2.3.3 Matching procedure
For both AGN (optical and mid-IR) samples, the single best match control galaxy for each AGN was selected from its respective control pool by simultaneously minimizing the difference in stellar mass and redshift. Although we do not expect much redshift evolution of physical properties within the range of our sample (Figs. 3 and 4), the redshift matching is important to ensure that the effective surface brightness imaging depth is consistent between the AGN and their controls. We required that the difference in log stellar mass between the AGN and the control could be no greater than 0.1 dex and the redshift must match within 0.005. If no control galaxy was found within these tolerances, the AGN was removed from the sample. However, in practice, we found that every AGN had an adequate control galaxy available in the pool, and that the typical difference between the stellar masses and redshifts was less than 0.02 dex and 0.001 respectively.
2.4 Visual morphological classification
Visual classifications of CFIS -band cutouts were carried out blindly, i.e. with no knowledge of whether the galaxy was an AGN or a control galaxy. The cutout was examined interactively, so that the classifier could change the dynamic range and scaling of the image in order to fully scrutinize the presence of morphological features. Typically, such features either manifested as faint extended tails/shells, or asymmetries (including double nuclei) within the half light radius of the galaxy. These two circumstances require very different dynamic ranges in image scaling in order to identify them, making manual manipulation a vital part of the classification process. The fiducial morphology flags used for our analysis (unless otherwise stated) are those by author Ellison (SLE), but we repeated our analysis with co-author Patton’s (DRP) classifications to check that the results were qualitatively similar.
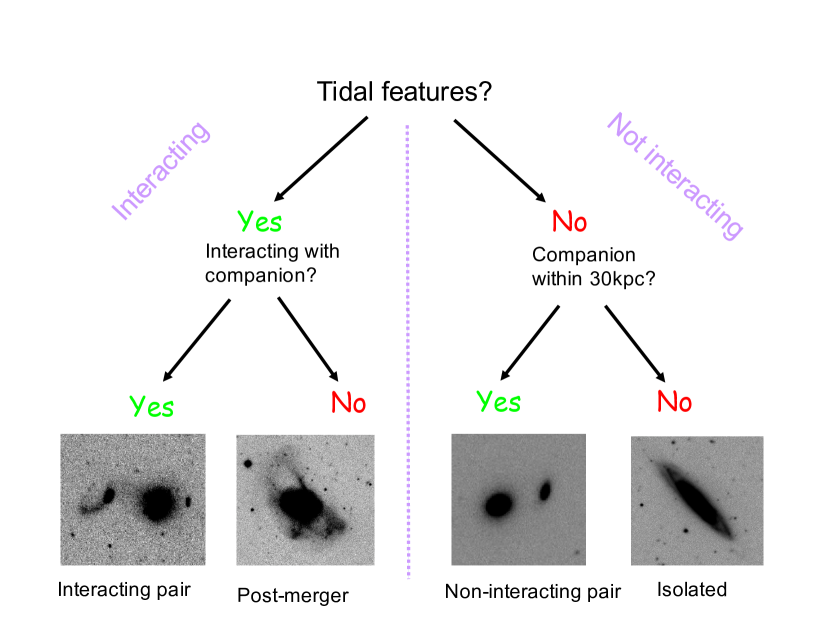
Many previous works have devised morphological classification schemes (e.g. Nair & Abraham 2010; Kocevski et al. 2012; Kartaltepe et al. 2015; Larson et al. 2016). In this work, we opted to keep the process simple, since the fundamental question we seek to address is whether the galaxy in question is (or has been) recently part of an interaction. We therefore do not attempt to break down the classification scheme into many different merger stages. Instead, we first assess simply whether a given galaxy shows convincing signs of morphological disturbance, such as tails or shells. If such features are present, the classifier next assesses whether there is an obvious companion that causes these disturbances. If a clear perturbing companion is present, the galaxy is classified as an interacting pair. The identification of a perturbing companion requires more than just proximity; there must be convincing evidence of a tidal interaction between the two galaxies. If no companion is present, or if there are nearby galaxies but no obvious tidal connection, the galaxy is labeled as a post-merger. In this scheme, a disturbed galaxy with a companion will be classified as a post-merger if that companion is not obviously participating in the perturbation. The interacting pair and post-merger categories together represent all galaxies that show clear morphological signs of some on-going, or past, interaction. We therefore refer to these categories combined as interacting galaxies.
| Total | Isolated | non-interacting pairs | interacting pairs | post-mergers | interacting (pairs + PM) | |
|---|---|---|---|---|---|---|
| # AGN | 1124 | 714 | 63 | 86 | 261 | 347 |
| # non-AGN | 1124 | 880 | 64 | 33 | 147 | 180 |
If there is no sign of morphological disturbance, we search the CFIS image for possible companion galaxies within 30 kpc (projected). If no companion is found, we label the galaxy as isolated. If a companion is located, the galaxy is categorized as a non-interacting pair. Although non-interacting pairs show no signs of visible disturbance, they may be galaxies on their first approach (i.e. pre-first pericentre), or galaxies whose internal properties or orbits are less likely to produce tidal features. A graphical summary of the classification process is shown in Fig 5.
Visual classification of galaxy morphologies is an inherently subjective and imperfect process. There will always be borderline cases where the classifier struggles to decide whether or not a given galaxy should be considered disturbed or not. Moreover, as is evident from Fig 1, the visibility of tidal features is clearly dependent on the depth of the imaging. Indeed, the paradigm of hierarchical growth implies that all massive galaxies are merger remnants and very deep imaging shows that faint tidal structures are extremely common, even in ‘normal’ galaxies (e.g. Tal et al. 2009). It is also well known that the visibility timescale of merger features is highly variable, depending on galaxy properties, galaxy orientation, time since pericentre and orbital parameters (e.g. Di Matteo et al. 2007; Lotz et al. 2010a,b; Ji & Peirani 2014). Therefore, any dataset and classification technique should not be trusted to yield the absolute frequency of interactions, but the comparison to a control sample can be used to more robustly measure an excess. In classifying interacting galaxies as those with convincing tidal features/morphological disturbances, we are erring on the side of purity, at the expense of completeness in our merger categories.
We also note two subtle differences between the classification procedure employed here and those commonly used. First, in contrast to the common practice of combining visual classifications from multiple expert astronomers (e.g. Kartaltepe et al. 2015; Larson et al. 2016) or citizen scientists (e.g. Lintott et al. 2008) into a single flag for a given galaxy, in our work, we consider the classification from each of the two classifiers (SLE and DRP) separately, repeating all of our analysis with each person’s merger flags. Whilst individual classifiers may differ in their opinion of a given galaxy with a different perceived level of asymmetry required by them in order for a galaxy to receive one of the ‘interacting’ flags, as long as they have classified consistently throughout the AGN and control sample, a comparison in morphologies of the two is still valid. Second, one of the benefits of our interactive (i.e. scaleable) classification process, over one that produces prescribed image cutouts is that automated image scaling is often not ideal for the identification of merger features. Many of the mergers identified in our sample would have been missed in the CFIS images without the ability to re-scale the contrast interactively.
3 Results
3.1 The optical AGN-merger connection

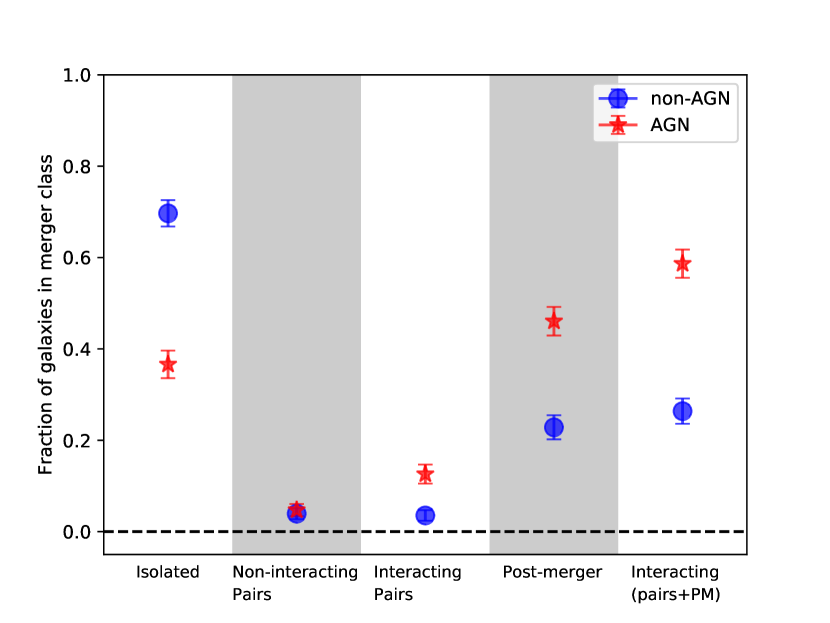
We begin our analysis by computing the fraction of optical AGN in each of the four basic morphology classes described in Sec. 2.4: isolated, non-interacting pair, interacting pair and post-merger. These statistics are listed in Table 1 and shown graphically in Fig. 6 as red stars, where error bars are the standard errors as computed from binomial statistics. In addition, a fifth ‘interacting’ category combines the interacting pairs and post-merger categories. For comparison, the fraction of the control sample in each classification category is shown as blue circles. From Fig. 6 we see that almost 80 per cent of non-AGN galaxies are classified as isolated, i.e. single galaxies lacking any obvious morphological disturbance. This is in stark contrast to the optical AGN sample in which only 63 per cent have been classified as isolated. Fig. 6 therefore convincingly demonstrates that optical AGN hosts are less likely to be in morphologically undisturbed and isolated systems. However, since up to 63 per cent of AGN are in isolated galaxies111This is an upper limit on the undisturbed fraction since deeper imaging or less conservative classification could classify weaker features as tidal distortions., it appears that recent interactions are not the dominant trigger for nuclear accretion in optically selected AGN.
Turning next to the non-interacting pair category. Figure 6 shows that both AGN and non-AGN have similar fractions of non-interacting pairs, of only 5 per cent. Several scenarios could lead to a galaxy being placed in the non-interacting pair category. First, chance projection of a background/foreground galaxy; AGN and non-AGN should be similarly susceptible to such ‘contamination’. Second, the two galaxies may be destined to interact, but have not yet completed their first pericentre passage. Since the gas inflows that feed the AGN are not expected to occur pre-pericentre, there should be no causal connection between AGN triggering, so we would again expect similar fractions of non-interacting pairs in the AGN and non-AGN samples. Finally, the pair may have completed a pericentric passage, but on an orbit, or with galaxy orientations that are not conducive to tidal disruption. In this case, the gas flows should be inefficient, again leading to ineffective AGN triggering. Therefore, the similarity in the non-interacting pair fractions between AGN and non-AGN is not surprising.
The deficit in isolated AGN hosts (compared with non-AGN hosts) is made up by higher fractions of AGN in the two interacting categories. The interacting pairs and post-mergers represent 8 and 23 per cent (respectively) of the AGN sample, i.e. a total of 31 per cent of optical AGN hosts have been classified as exhibiting convincing morphological disturbances. We stress that this should be considered as a lower limit to the true fraction of disturbed AGN hosts, due both to the conservative nature of our classification and also the limited sensitivity of the CFIS imaging. In contrast, only 16 per cent of non-AGN are classified as interacting. Our results therefore show that optical AGN are twice as likely to be found in interacting galaxies than non-AGN, but that the majority of optical AGN are in non-interacting galaxies at .
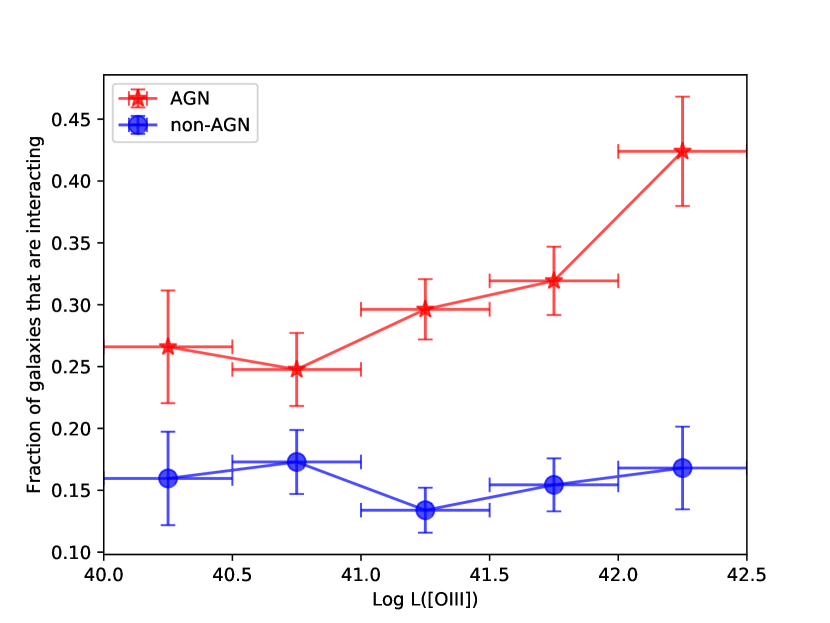
Fig. 6 indicates that up to 60 per cent of optical AGN in the local universe may be triggered by processes other than galaxy interactions. Although luminous quasars frequently seem to be associated with mergers, there remains debate about whether or not there is a correlation between AGN luminosity and merger incidence (e.g. Treister et al. 2012 vs. Villforth et al. 2014). In the upper panel of Fig. 7 we investigate whether the more luminous AGN in our sample are more likely to be triggered by mergers. Since we have selected optical AGN based on the Kewley et al. (2001) diagnostic, the [OIII] luminosity is a good indicator of AGN luminosity, with minimal contamination from star formation.
In bins of log L([OIII]), we count the number of AGN that are classified as interacting (interacting pairs and post-mergers). We similarly count the number of controls matched to the AGN in each log L([OIII]) bin that are interacting. Therefore, although the controls do not have an (AGN relevant) L([OIII]) luminosity themselves, we can still assess the AGN morphologies relative to the controls to which they were matched.
In the upper panel of Fig. 7 we plot the fraction of interacting AGN as a function of L([OIII]) as red stars. For comparison, we plot as blue circles the fraction of interacting controls (non-AGN) in the L([OIII]) bins that correspond to their matched AGN. That is, the fraction of interacting AGN in a given L([OIII]) bin is compared to the interacting fraction of those same galaxies’ controls. The upper panel of Fig. 7 shows that the interacting fraction of AGN exceeds that of the non-AGN sample at all values of L([OIII]). However, whereas the fraction of interacting controls remains constant with log L([OIII]), the fraction of interacting AGN steadily increases from 25 per cent at log L([OIII]) 40.5 erg/s, to 45 per cent at log L([OIII]) 42.5 erg/s. The visual impression of an increasing interaction fraction in AGN with L([OIII]) is confirmed with a Pearson correlation test, which yields a correlation coefficient of 0.89. In order to account for the uncertainties on each data point, fractions in the upper panel of Fig. 7 are re-sampled 10,000 times drawing at random from a gaussian distribution with standard deviation set by the error bars on each point. The correlation coefficient is found to be 0.75 in 65 per cent of re-samplings and 0.65 in 80 per cent of re-samplings.
Although it has long been predicted that mergers will lead to high AGN luminosities due to the high accretion rates thus triggered (e.g. Di Matteo et al. 2005), the dependence of merger triggering on AGN luminosity has been challenged by some recent simulations. For example, although Steinborn et al. (2018) find an excess of mergers amongst AGN selected from their cosmological simulations (in agreement with our findings), they find no correlation of the merger fraction and AGN luminosity at 0, in contrast with our observational results. Moreover, the fraction of merging AGN at 0 in these simulations is only 10 per cent, in clear contradiction with our results. Although subtleties such as methods for selecting AGN, and identifying merger features affect these absolute numbers, it appears that merger triggered AGN are much more common in reality than in some simulations.
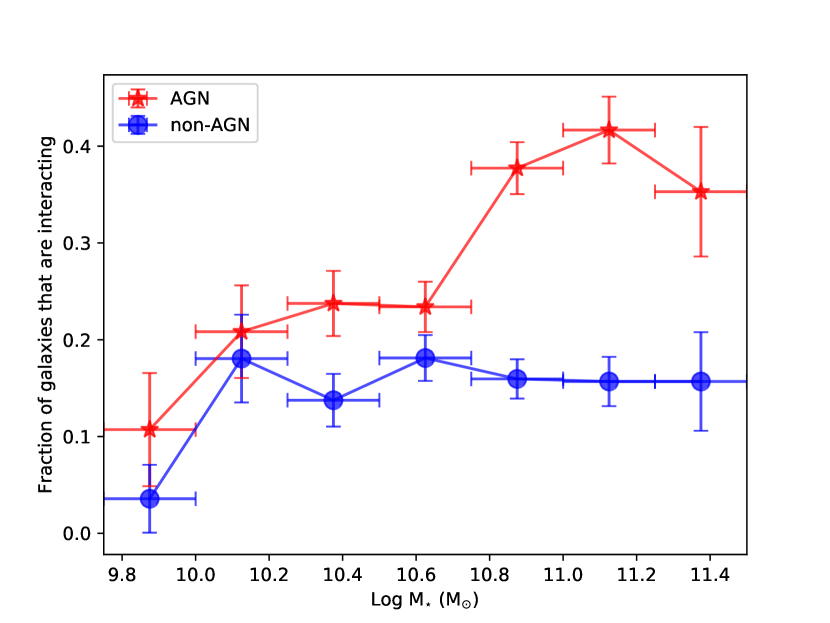
In the lower panel of Fig. 7 we investigate whether the fraction of morphologically disturbed optical AGN depends on the stellar mass of the host galaxy. Once again, the AGN and control samples are shown as red stars and blue circles respectively. As we saw for the dependence on L([OIII]) in the upper panel, the control sample shows no dependence on disturbed fraction with stellar mass. The fraction of interacting AGN again exceeds that of the controls at all stellar masses, but increases by a factor of two, from approximately 20 to 40 per cent from log (M⋆/M⊙) 10.4 to 11.2. The visual impression of an increasing interaction fraction with stellar mass is confirmed with a Pearson correlation test, which yields a correlation coefficient of 0.91. The data points in the lower panel of Fig. 7 are re-sampled 10,000 times drawing at random from a gaussian distribution with standard deviation set by the error bars on each point. The correlation coefficient is found to be 0.75 in 79 per cent of re-samplings and 0.65 in 90 per cent of re-samplings. We conclude that morphologically disturbed fraction of optical AGN host galaxies is significantly greater for higher AGN luminosities and larger host galaxy masses.
The dependence of merger-related AGN triggering on host galaxy stellar mass might be caused by the correlation of inflow efficiencies on internal galaxy properties. For example, high gas fractions, larger gas disks and higher bulge fractions have all been demonstrated to yield lower rates of star formation rate enhancement and/or gas infall rates (e.g. Di Matteo et al. 2007; Cox et al. 2008; Scudder et al. 2015; Fensch et al. 2017; Blumenthal & Barnes 2018). The inefficiency of gas inflows in the presence of a bulge works counter to the trend seen in the lower panel of Fig 7, since the typically higher bulge fractions found in high mass galaxies might be expected to suppress the nuclear fuelling in high mass interactions. Conversely, the low gas fractions in high mass galaxies could potentially explain the trend for increasing interaction frequency in AGN hosted by high mass galaxies.
We also investigated whether there is any trend of specific L([OIII]) (L([OIII])/M⋆) with merger fraction, but found no correlation with the fraction of AGN that are interacting.
3.2 The mid-IR AGN-merger connection
| Total | Isolated | non-interacting pairs | interacting pairs | post-mergers | interacting (pairs + PM) | |
|---|---|---|---|---|---|---|
| # AGN | 254 | 93 | 12 | 32 | 117 | 149 |
| # non-AGN | 254 | 117 | 10 | 8 | 58 | 66 |
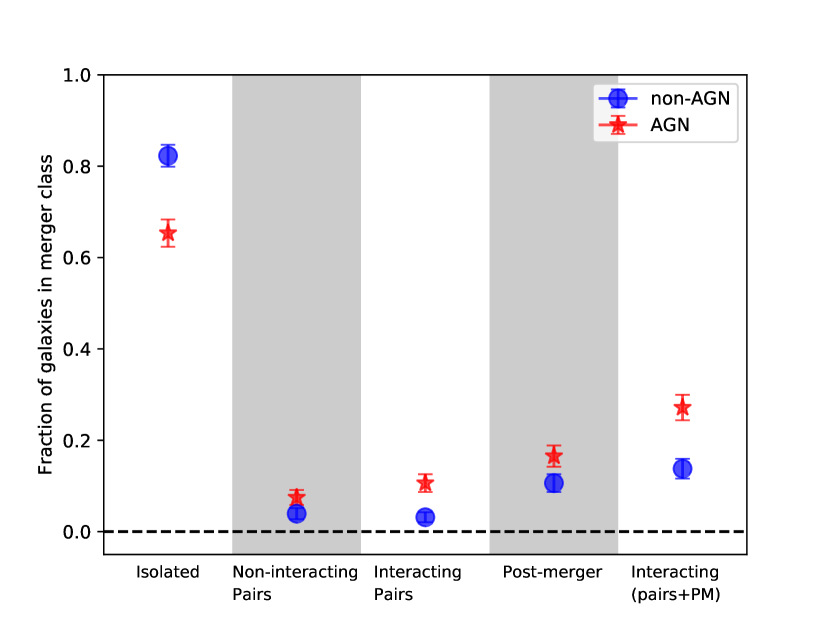
In Table 2 and Figure 8 we show the fraction of mid-IR AGN and control galaxies in the different morphological classes. The results for mid-IR AGN in Figure 8 shows several of the same qualitative characteristics that we saw for optical AGN in Figure 6: a lower fraction of isolated AGN hosts compared with controls, similar fractions of non-interacting pairs and elevated fractions of disturbed morphologies amongst AGN hosts. However, the interacting fractions are quite different between the optical and mid-IR selected AGN samples. Although we re-iterate our caution that absolute fractions depend on image depth and the subjectivity of the classifier, a relative comparison between samples is justified. Whereas 31 per cent of optical AGN hosts were classified as interacting, the interacting fraction is 59 per cent for mid-IR selected AGN. The majority of mid-IR selected AGN are therefore in morphologically disturbed hosts. Whereas we concluded from Fig. 6 that most of the optically selected AGN had not experienced a recent interaction, Figure 8 shows that interactions may be the dominant triggering mechanism for low mid-IR selected AGN.
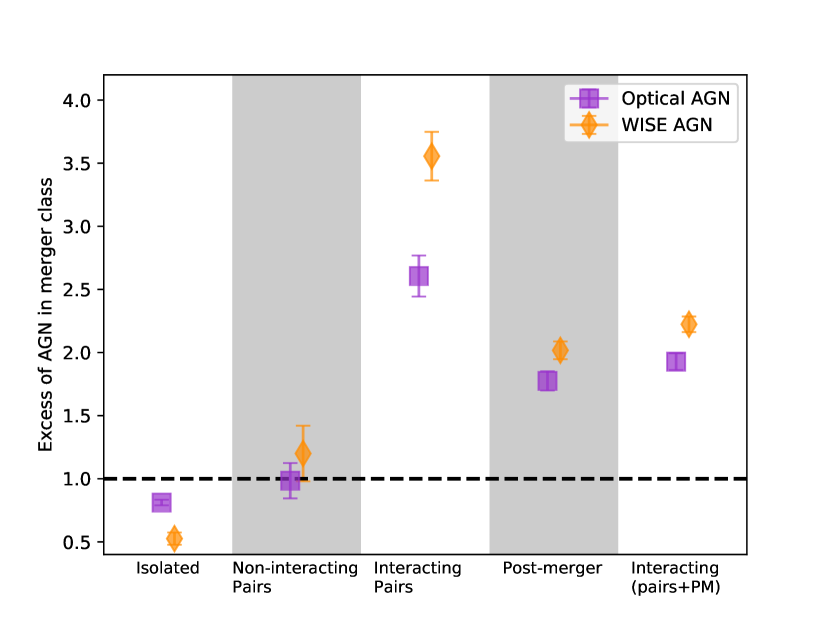
In Fig. 9 we compare the ratio of AGN-to-control fraction in each morphological class, for both the optical (square symbols) and mid-IR (diamonds) AGN samples. Broadly speaking, both optical and mid-IR selected AGN are approximately twice as likely to be interacting. However, the excess of interactions is greater in the mid-IR selected AGN, compared with the optically selected AGN. Although this effect is modest for the post-mergers, it is highly significant for interacting pairs. Optically selected AGN are a factor of 2.5 more likely to be in an interacting pair, compared to a non-AGN, whereas WISE selected AGN show an interacting pair excess of 3.5. These results add further support to an enhanced connection between obscured AGN and mergers (e.g. Satyapal et al. 2015; Koss et al. 2016, 2018; Weston et al. 2018).
We note that all of the above results are qualitatively similar if we use the classifications from the secondary classifier (DRP), instead of those of SLE. Although only approximately 50 per cent of galaxies had agreement on absolute merger category, the relative excess between AGN and controls is very similar between classifiers. This consistency highlights that regardless of the different perceived classifications for about half of the sample, as long as the classifier is consistent, then the same results are achieved.
4 Discussion
Our previous work on galaxy pairs and post-mergers has found an elevated incidence of optical and mid-IR selected AGN compared to non-interacting galaxies (Ellison et al. 2011; Ellison et al. 2013; Satyapal et al. 2013; Khabiboulline et al. 2014; Ellison 2015), demonstrating that mergers are capable of triggering nuclear activity. Conversely, many works that have searched for morphological signatures of disturbances, or companions, have found a similar fraction of interacting galaxies amongst AGN and control galaxies (e.g. Grogin et al. 2005; Cisternas et al. 2011; Kocevski et al. 2012). How can these apparently conflicting results be reconciled?
One possible explanation that is often cited is that whilst mergers are capable of triggering AGN, most AGN are triggered by other mechanisms. Hence, experiments that search for an excess of merger features in an AGN sample may come to a different conclusion to studies that measure more AGN in a merger sample. Whilst this scenario offers a reconciliation of the current set of observational findings, it is predicated on combining samples from very different redshifts and AGN selected with different methods and with different luminosities. In the work presented here, we assess the morphologies of AGN and control samples selected analogously to our previous work on mergers, in order to provide a fair assessment of this scenario. We have shown that the morphological disturbances are seen (at least) twice as often in AGN hosts, and that this excess is seen for both optical and mid-IR selected AGN (Fig 9). Therefore, at z 0 the AGN-merger connection is clearly detectable regardless of whether the experiment searches for an excess of AGN in mergers (Ellison et al. 2011; Ellison et al. 2013; Satyapal et al. 2013; Khabiboulline et al. 2014; Ellison, Patton & Hickox 2015), or whether we search for an excess of morphological disturbances in AGN host galaxies (this work). Moreover, we have shown that the majority of mid-IR selected AGN are interacting galaxies, and that the excess of interacting hosts is greater for mid-IR selected AGN than for optically selected AGN.
What are the alternative explanations for the conflicting results published in the literature? An obvious possibility is that most of the papers that find no merger-AGN connection are at higher redshift, implicating either redshift evolution of triggering mechanisms or the observational limitations of detecting tidal features at high .
For reference, the observational bias of bolometric surface brightness dimming leads to 3 magnitudes reduction in sensitivity from to . Although many high studies use high quality Hubble Space Telescope data, many of the interaction features seen in our low sample are very faint (e.g. Fig 1). In order to test the impact of image quality, we repeat the morphological classification of the WISE AGN sample (and its control) using SDSS -band images, which is both shallower (by approximately 3 mag arcsec -2) and of poorer spatial resolution than CFIS.
The SDSS classification results are shown in Fig 10, which can be compared to Fig. 8 for the same WISE AGN and control sample, but using CFIS imaging. There is a dramatic reduction in the fraction of WISE AGN that are classified as interacting: whereas 60 per cent of mid-IR selected AGN show morphological disturbances in CFIS imaging, only 25 per cent have detectable features in the SDSS imaging. The poorer quality imaging therefore would have definitely affected our ability to conclude that mergers are dominant amongst WISE AGN. In their comparison of SDSS Legacy imaging with the deeper Stripe 82 data, Bottrell et al. (2019) have recently demonstrated that quantitative morphologies, as measured by the asymmetry parameter, are also affected by image depth. However, the controls are also affected by the degraded image quality and Fig. 10 shows that morphological disturbances are still more common in WISE AGN than their controls.
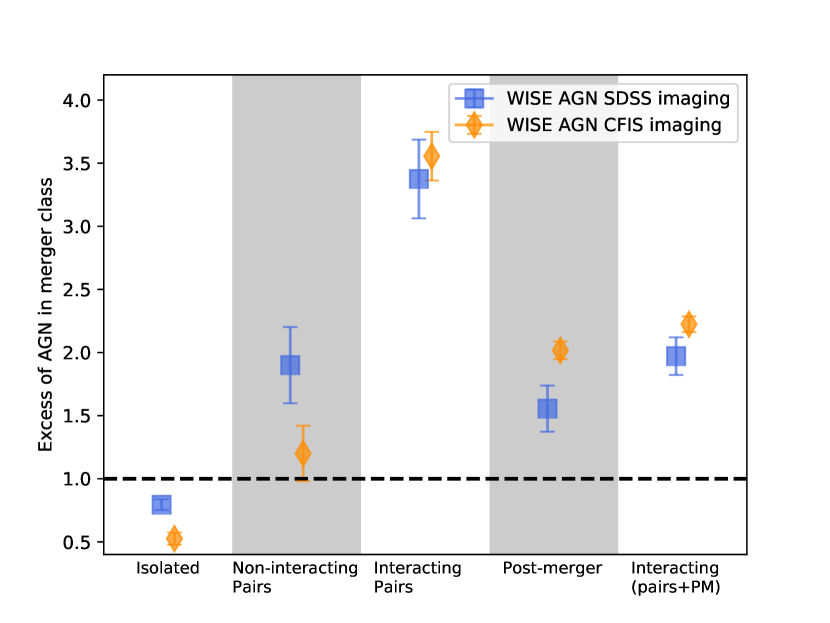
In Fig. 11 we compare the relative frequencies of AGN and controls in different morphology classes. The orange diamonds show the same WISE AGN fractions in the CFIS data as shown before in Fig. 9. In addition, the blue squares show the results for the same galaxy sample in SDSS imaging. Despite the very different absolute fractions of morphologically disturbed galaxies in the SDSS and CFIS images (Fig. 10), the excess of interacting pairs and post-mergers in Fig. 11 is broadly similar between the two surveys. Only the post-mergers (characterized predominantly by faint shells) seem to show any significant drop in frequency compared with controls in the SDSS imaging. However, the final column of Fig 11 indicates that the relatively poor SDSS imaging would not have prevented us from concluding a factor of 2 excess in interacting hosts for AGN.
The ‘interacting’ category in the right-most column includes interacting pairs and post-mergers and hence encompasses all galaxies with discernable tidal features/disturbances. In contrast to the classifications based on CFIS images (Fig 8) the majority of WISE selected AGN appear to be undisturbed in SDSS imaging.
Although the above experiment indicates that image quality may not explain the lack of interacting galaxies hosting AGN in high observations, there may be real redshift evolution effects. Since gas flows in interacting galaxies are sensitive to their internal properties, such as bulge and gas fractions (e.g. Di Matteo et al. 2007; Cox et al. 2008; Fensch et al. 2017; Blumenthal & Barnes 2018), it is plausible that the efficiency of inflow evolves with redshift, as these properties are also evolving. A further factor may be that high studies typically select AGN at X-ray wavelengths. We have performed our study using optical and mid-IR AGN selection only, since a suitable X-ray dataset is not available. A complete assessment of the redshift evolution of the merger-AGN connection and impact of X-ray selection is beyond the scope of this paper (whose data are at ), but we conclude that this remains a possible explanation for observational results in the literature.
Another point of conflict in the literature is whether or not the fraction of merger triggered AGN increases with AGN luminosity. The results presented in the upper panel of Fig. 7 support such a correlation, indicating that higher accretion rates may be preferentially afforded by interactions. Lower luminosity AGN may still be triggered by interactions, but may have an increasing contribution from other more ‘gentle’ processes. Indeed, Ellison, Patton & Hickox et al. (2015) have shown that the radiatively inefficient (low excitation) radio galaxies seem to be triggered entirely by secular processes. Although some other works (e.g. Treister et al. 2012) have also found a dependence of merger fraction on AGN luminosity, our results are compiled from a single dataset and methodology, making the interpretation less susceptible to some selection biases. Nonetheless, the dependence of merger fraction on AGN luminosity is highly controversial. For example, several works focusing specifically on high luminosity (or accretion rate) AGN have failed to find an excess of mergers (Mechtley et al. 2016; Villforth et al. 2017; Marian et al. 2019). The reason for this conflict remains unclear; it may be associated with the higher redshifts of these other works ( for Villforth et al. 2017 and for Mechtley et al. 2016 and Marian et al. 2019), although the simulations of Steinborn et al. 2018 find that a luminosity dependence becomes more (not less) pronounced at higher . Alternatively, it may be an issue of sample size. The samples of Mechtley et al. (2016), Villforth et al. (2017) and Marian et al. (2019) are all quite small ( 20 AGN). If we bootstrap sample our optical AGN sample taking only 20 AGN and their matched controls, we recover the factor of approzimately two excess seen for the full sample with convincing significance (the typical error on the factor of two excess is 0.18) in each of 1000 iterations. We conclude that sample size is not the reason for disagreement with previous studies, and again are left with AGN selection method and redshift as possible culprits.
The statistics in Tables 1 and 2 have demonstrated that AGN are more frequently associated with mergers than non-AGN, leading to our conclusion that there is a connection between the two phenomena at low redshift. Indeed, the results in Figs. 6 and, even more so, Fig. 8 indicate that mergers may play a significant role in triggering moderate luminosity AGN at . However, the quantification of precisely what fraction of AGN are merger triggered, and understanding whether all mergers lead to an AGN remains a challenge. One obvious limitation, that is demonstrated with our comparison to SDSS imaging (see also Bottrell et al. 2019) is that even with the high quality CFIS imaging it is not possible to detect all merger features. Secondly, as we discussed in the Introduction, AGN manifest at a range of wavelengths, and thus a complete assessment of the merger-AGN connection requires a panchromatic census of the accretion phenomena. Whilst both of these current limitations are, in theory, tractable with improved observations and large multi-wavelength samples, a further impediment that is harder to address, is that of timescales.
If the observability timescale of the merger features and the AGN lifetimes were the same, the fractions of AGN/non-AGN in mergers/non-mergers would allow a straightforward calculation of the fraction of AGN triggered by mergers, as well as the fraction of mergers that trigger AGN. However, AGN lifetimes may be orders of magnitude shorter than the merger timescale, 105 years (e.g. Schawinski et al. 2015), compared with hundreds of Myr. Therefore even if all mergers lead to an AGN at some point during the interaction, that AGN may not be actively accreting at the time of observation. These complicating factors mean that an accurate quantification of the fraction of AGN that are triggered by mergers requires both improved data, as well as assumptions about the merger observability and AGN timescales, which will always be inherently uncertain.
We conclude this discussion with a reminder that numerous non-merger origins have also been proposed for fuelling AGN accretion, including bars, stellar winds, disk instabilities and halo cooling (e.g. Hopkins & Hernquist 2006; Menci et al. 2014; Robichaud et al. 2017). Ultimately, the black hole is not fussy about where its meal is coming from, hence it seems likely that mergers are one of several mechanisms that provide effective delivery. In this paper, we have demonstrated that, regardless of whether one looks for a merger excess in a sample of AGN, or an excess of AGN in a merger sample (e.g. Ellison et al. 2011, 2013), there is a clear AGN-merger connection at low . However, our results are not inconsistent with other observational works that have inferred links to other phenomena (e.g. Bournaud et al. 2012; Cisternas et al. 2015; Ellison et al. 2015).
5 Summary
In previous work, we have shown that galaxy mergers in the SDSS show elevated fractions of both optical and mid-IR selected AGN (Ellison et al. 2011; Ellison et al. 2013; Satyapal et al. 2013; Khabiboulline et al. 2014; Ellison, Patton & Hickox 2015). However, other work that has quantified the morphologies of (higher redshift, X-ray selected) AGN has failed to find an enhanced fraction of disturbed galaxies (e.g. Gabor et al. 2009; Cisternas et al. 2011; Kocevski et al. 2012; Metchley et al. 2016; Hewlett et al. 2017). These results have been previously reconciled by considering the two different experimental approaches that have been used. The first experiment measures an excess frequency of AGN in a merger sample, demonstrating that interactions can trigger AGN. The second experiment finds no enhanced morphological disturbances in an AGN sample, indicating that the majority of AGN are not initiated by mergers. However, the different redshift regimes, AGN selection techniques and AGN luminosities potentially undermines attempts to synthesize the various results into a single physical picture. To fully understand the impact of the two experimental approaches on the statistical connection between mergers and AGN requires that both experiments be conducted on the same sample.
In this paper, we select low AGN from the SDSS using the same optical and mid-IR selection as our previous work and quantify the frequency of companions and disturbed morphologies in deep -band imaging from the Canada-France Imaging Survey. Combined with our previous work, this study represents a thorough assessment of the merger-AGN connection at .
Our main conclusions are as follows:
-
•
63 per cent of optically selected AGN show no compelling signs of visual disturbance, nor have a companion within a projected separation of 30 kpc (Fig 6), indicating that the majority of optically selected AGN at are not triggered by a recent interaction.
-
•
In contrast, at least 59 per cent of mid-IR selected AGN are visually disturbed in CFIS -band images (Fig 8) indicating that galaxy interactions may be the dominant trigger for mid-IR selected AGN.
-
•
Compared to a stellar mass and redshift matched control sample of non-AGN host galaxies, both the optically selected and mid-IR selected AGN sample show an increased frequency of both interacting pairs and post-mergers (Fig 9). Low redshift AGN are (at least) twice as likely as non-AGN to show features of a recent interaction.
-
•
The excess of disturbed morphologies is enhanced for mid-IR selected AGN compared to optically selected AGN (Fig 9), indicating that obscured AGN are preferentially associated with merger triggering.
-
•
To investigate the effect of image quality, the morphological classification is repeated for the mid-IR sample using SDSS imaging, which is 3 mag arcsec-2 shallower than CFIS. Although the disturbed fraction of mid-IR AGN drops to 25 percent, a similar drop in sensitivity to merger features in the control sample means that the factor of two excess in disturbed morphologies for mid-IR AGN is still seen in SDSS imaging (Fig. 11).
-
•
The fraction of optical AGN that show features of an interaction increases with the AGN luminosity (as measured by the [OIII] line luminosity, upper panel of Fig 7), consistent with a scenario in which higher luminosity AGN are more frequently triggered by mergers.
-
•
The fraction of optical AGN that show features of an interaction increases with the host galaxy mass (lower panel of Fig 7) consistent with a scenario in which merger-triggered nuclear accretion occurs more readily at higher masses. We speculate that this may be due to higher gas fractions in lower stellar mass galaxies.
Combined with our previous work, we have now demonstrated that the merger-AGN connection is evident at low for experiments that both assess the AGN fraction in mergers, as well as the merger fraction amongst AGN. We conclude that there is definitive evidence for a connection between mergers and AGN triggering at low for optical and mid-IR selected AGN.
Acknowledgements
SLE and DRP gratefully acknowledge support from an NSERC Discovery Grant. AV gratefully acknowledges the receipt of a Mitacs Globalink Award, hosted at the University of Victoria, which funded her contribution to this work. AV thanks Trystyn Berg, Maan Hani, Guillaume Thomas and Mallory Thorp for help in the preliminary stages of this project.
This work is based on data obtained as part of the Canada France Imaging Survey, a CFHT large program of the National Research Council of Canada and the French Centre National de la Recherche Scientifique. Based on observations obtained with MegaPrime/MegaCam, a joint project of CFHT and CEA Saclay, at the Canada-France-Hawaii Telescope (CFHT) which is operated by the National Research Council (NRC) of Canada, the Institut National des Science de l’Univers (INSU) of the Centre National de la Recherche Scientifique (CNRS) of France, and the University of Hawaii. This research used the facilities of the Canadian Astronomy Data Centre operated by the National Research Council of Canada with the support of the Canadian Space Agency.
Funding for the SDSS and SDSS-II has been provided by the Alfred P. Sloan Foundation, the Participating Institutions, the National Science Foundation, the U.S. Department of Energy, the National Aeronautics and Space Administration, the Japanese Monbukagakusho, the Max Planck Society, and the Higher Education Funding Council for England. The SDSS Web Site is http://www.sdss.org/.
The SDSS is managed by the Astrophysical Research Consortium for the Participating Institutions. The Participating Institutions are the American Museum of Natural History, Astrophysical Institute Potsdam, University of Basel, University of Cambridge, Case Western Reserve University, University of Chicago, Drexel University, Fermilab, the Institute for Advanced Study, the Japan Participation Group, Johns Hopkins University, the Joint Institute for Nuclear Astrophysics, the Kavli Institute for Particle Astrophysics and Cosmology, the Korean Scientist Group, the Chinese Academy of Sciences (LAMOST), Los Alamos National Laboratory, the Max-Planck-Institute for Astronomy (MPIA), the Max-Planck-Institute for Astrophysics (MPA), New Mexico State University, Ohio State University, University of Pittsburgh, University of Portsmouth, Princeton University, the United States Naval Observatory, and the University of Washington.
References
- [Ackermann et al. (2018)] Ackermann, S., Schawinski, K., Zhang, C., Weigel, A. K., Turp, M. D., 2018, MNRAS, 479, 415
- [Alexander & Hickox (2012)] Alexander, D. M., Hickox, R. C., 2012, NewAR, 56, 93
- [Alonso et al. (2018)] Alonso, M. S., Coldwell, G., Duplancic, F., Mesa, N. Lambas, D. G., 2018, A&A, 618, 149
- [Alonso et al. (2007)] Alonso, M. S., Lambas, D. G., Tissera, P. B., Coldwell, G., 2007, MNRAS, 375, 1017
- [Alonso et al. (2004)] Alonso, M. S., Tissera, P. B., Coldwell, G., Lambas, D. G., 2004, MNRAS, 352, 1081
- [Assef et al. (2013)] Assef, R. J., et al., 2013, ApJ, 772, 26
- [Azadi et al. (2017)] Azadi, M., et al., 2017, ApJ, 835, 27
- [Barnes & Hernquist (1991)] Barnes, J. E., & Hernquist, L., 1991, ApJ, 370, L65
- [Belfiore et al. (2016)] Belfiore, F., et al., 2016, MNRAS, 461, 3111
- [Bellovary et al. (2013)] Bellovary, J., Brooks, A., Volonteri, M., Governato, F., Quinn, T., Wadsley, J., 2013, ApJ, 779, 136
- [Bessiere et al. (2012)] Bessiere, P. S., Tadhunter, C. N., Ramos Almeida, C., Villar Martin, M., 2012, MNRAS, 426, 276
- [Best & Heckman (2012)] Best, P. N., Heckman, T. M., 2012, MNRAS, 421, 1569
- [Blecha et al. (2018)] Blecha, L., Snyder, G. F., Satyapal, S., Ellison, S. L., 2018, MNRAS, 478, 3056
- [Blumenthal & Barnes (2018)] Blumenthal, K. A., & Barnes, J. E, 2018, MNRAS, 479, 3952
- [Bottrell et al. (2019)] Bottrell, C., Simard, L., Mendel, J. T., Ellison, S. L., 2019, MNRAS, submitted
- [Bournaud et al. (2012)] Bournaud, F., Juneau, S., Le Floch, E., Mullaney J., Daddi, E., Dekel, A., Elbaz, D., Salmi, F., Dickinson, M., 2012, ApJ, 757, 81
- [Brown et al. (2016)] Brown, A., 2016, A&A, 595, 2
- [Capelo et al. (2015)] Capelo, P. R., Volonteri, M., Dotti, M., Bellovary, J. M., Mayer, L., Governato, F., 2015, MNRAS, 447, 2123
- [Capelo et al. (2017)] Capelo, P. R., Dotti, M., Volonteri, M., Mayer, L., Bellovary, J. M., Shen, S., 2017, MNRAS, 469, 4437
- [Cattaneo et al. (2005)] Cattaneo, A., Combes, F., Colombi, S., Bertin, E., Melchior, A.-L., 2005, MNRAS, 359, 1237
- [Cisternas et al. (2011)] Cisternas, M., et al. 2011, ApJ, 726, 57
- [Cisternas et al. (2015)] Cisternas, M., Sheth, K., Salvato, M., Knapen, J. H., Civano, F., Santini, P., 2015, ApJ, 802, 137
- [Cotini et al. (2013)] Cotini, S., Ripamonti, E., Caccianiga, A., Colpi, M., Della Ceca, R., Mapelli, M., Severgnini, P., Segreto, A., 2013, MNRAS, 431, 2661
- [Cox et al. (2008)] Cox, T. J., Jonsson, P., Somerville, R. S., Primack, J. R., Dekel, A., 2008, MNRAS, 384, 386
- [Darg et al. (2010a)] Darg, D. W., et al., 2010, MNRAS, 401, 1552
- [Davies et al. (2015)] Davies, L. J. M., et al., 2015, MNRAS, 452, 616
- [Di Matteo et al. (2007)] Di Matteo, P., Combes, F., Melchior, A.-L., Semelin, B., 2007, A&A, 468, 61
- [Di Matteo et al. (2005)] Di Matteo, T., Springel, V., Hernquist, L., 2005, Nature, 433, 604
- [Donley et al. (2007)] Donley, J. L., Rieke, G. H., Perez-Gonzalez, P. G., Rigby, J. R., Alonso-Herrero, A., 2007, ApJ, 660, 167
- [Donley et al. (2018)] Donley, J. L., et al., 2018, ApJ, 853, 63
- [Draper & Ballantyne (2012)] Draper, A. R., Ballantyne, D. R., 2012, ApJ, 751, 72
- [Ellison et al. (2019)] Ellison, S. L., Brown, T., Catinella, B., Cortese, L., 2019, MNRAS, in press
- [Ellison et al. (2013)] Ellison, S. L., Mendel, J. T., Patton, D. R., Scudder, J. M., 2013, MNRAS, 453, 3627
- [Ellison, Patton & Hickox (2015)] Ellison, S. L., Patton, D. R., Hickox, R. C., 2015, MNRAS, 451, L35
- [Ellison et al. (2011)] Ellison, S. L., Patton, D. R., Mendel, J. T., Scudder, J. M., 2011, MNRAS, 418, 2043
- [Ellison et al. (2016)] Ellison, S. L., Teimoorinia, H., Rosario, D. J., Mendel, J. T., 2016, MNRAS, 458, L34
- [Fan et al. (2016)] Fan, L., et al., 2016, ApJ, 822, L32
- [Fensch et al. (2017)] Fensch, J., et al., 2017, MNRAS, 465, 1934
- [Gabor et al. (2016)] Gabor, J. M., Capelo, P. R., Volonteri, M., Bournaud, F., Bellovary, J., Governato, F., Quinn, T., 2016, A&A, 592, 62
- [Gabor et al. (2009)] Gabor, J. M., et al., 2009, ApJ, 691, 705
- [Glikman et al. (2015)] Glikman, E., Simmons, B., Mailly, M., Schawinski, K., Urry, C. M., Lacy, M., 2015, ApJ, 806, 218
- [Goulding et al. (2018)] Goulding, A. D., et al., 2018, PASJ, 70, 37
- [Grogin et al. (2005)] Grogin, N. A., et al. 2005, ApJ, 627, L97
- [Gurkan et al. (2014)] Gurkan, G., Hardcastle, M. J., Jarvis, M. J., 2014, MNRAS, 438, 1149
- [Hainline et al. (2016)] Hainline, K. N., Reines, A. E., Greene, J. E., Stern, D., 2016, ApJ, 832, 119
- [Heckman et al. (1984)] Heckman, T. M., Bothun, G. D., Balick, B., Smith, E. P., 1984, AJ, 89, 958
- [Hewlett et al. (2017)] Hewlett, T., Villforth, C., Wild, V., Mendez-Abreu, J., Pawlik, M., Rowlands, K., 2017, MNRAS, 470, 755
- [Hickox et al. (2009)] Hickox, R. C., et al., 2009, ApJ, 696, 891
- [Hopkins & Hernquist (2006)] Hopkins, P. F., & Hernquist, L., 2006, ApJS, 166, 1
- [Hutchings et al (1984)] Hutchings, J. B., Crampton, D., Campbell, B.,
- [Hutchings et al (1988)] Hutchings, J. B., Johnson, I., Pyke, R., 1988, ApJS, 66, 361
- [Ibata et al. (2017)] Ibata, R. A., et al., 2017, ApJ, 848, 128
- [Ji, Peirani & Yi (2014)] Ji, I., Peirani, S., & Yi, S. K., 2014, A&A, 566, 97
- [Kartaltepe et al. (2015)] Kartaltepe J. S., et al., 2015, ApJS, 221, 11
- [Kauffmann et al. (2003)] Kauffmann, G., et al., 2003, MNRAS, 341, 33
- [Keel et al. (1985)] Keel, W. C., Kennicutt, R. C., Jr., Hummel, E., van der Hulst, J. M., 1985, AJ, 90, 708
- [Kewley et al. (2001)] Kewley, L. J., Dopita, M. A., Sutherland, R. S., Heisler, C. A., Trevena, J., 2001, ApJ, 556, 121
- [Kewley et al (2010)] Kewley, L. J., Rupke, D., Jabran Z. H., Geller, M. J., Barton, E. J., 2010, ApJ, 721, L48
- [Khabiboulline et al. (2014)] Khabiboulline, E. T., Steinhardt, C. L., Silverman, J. D., Ellison, S. L., Mendel, J. T., Patton, D. R., 2014, ApJ, 795, 62
- [Kocevski et al. (2015)] Kocevski, D. D., et al., 2015, ApJ, 814, 104
- [Kocevski et al. (2011)] Kocevski, D., et al. 2012, ApJ, 744, 148
- [Koss et al. (2016)] Koss, M., et al., 2018, ApJ, 825, 85
- [Koss et al. (2018)] Koss, M., et al., 2018, Nature, 563, 214
- [Koss et al. (2012)] Koss, M., Mushotzky, R., Treister, E., Veilleux, S., Vasudevan, R., Trippe, M., 2012, ApJ, 746, L22
- [Koss et al. (2010)] Koss, M., Mushotzky, R., Veilleux, S., Winter, L., 2010, ApJ, 716, L125
- [Lackner et al. (2014)] Lackner, C. N., et al., 2014, ApJ, 148, 137
- [Larson et al. 2016] Larson, K. L., et al., 2016, ApJ, 825, 128
- [Li et al. (2008b)] Li, C., Kauffmann, G., Heckman, T. M., White, S. D. M., Jing, Y. P., 2008, MNRAS, 385, 1915
- [Lin et al. 2007)] Lin, L., et al. 2007, ApJ, 660, L51
- [Lintott et al. (2008)] Lintott, C. J., et al., 2008, MNRAS, 389, 1179
- [Liu et al. 2012] Liu, X., Shen, Y., Strauss, M. A., 2012, ApJ, 745, 94
- [Lotz et al. (2010)] Lotz, J. M., Jonsson, P., Cox, T. J., Primack, J. R., 2010a, MNRAS, 404, 590
- [Lotz et al. (2010)] Lotz, J. M., Jonsson, P., Cox, T. J., Primack, J. R., 2010b, MNRAS, 404, 575
- [Lotz et al. (2004)] Lotz, J., Primack, J., Madau, P., 2004, AJ, 128, 163
- [Magnier & Cuillandre (2004] Magnier, E. A.; Cuillandre, J.-C., 2004, PASP, 116, 449
- [Magnier et al., (2016)] Magnier, E. A., et al., arXiv:1612.05242
- [Marian et al. (2019)] Marian, V., et al., 2019, ApJ, submitted
- [Mateos et al. (2013)] Mateos, S., Alonso-Herrero, A., Carrera, F. J., Blain, A., Severgnini, P., Caccianiga, A., Ruiz, A., 2013, MNRAS, 434, 941
- [Mechtley et al. (2016)] Mechtley, M., et al., 2016, ApJ, 830, 156
- [Mendez et al. (2013)] Mendez, A. J., et al., 2013, ApJ, 770, 40
- [Menci et al. (2014)] Menci, N., Gatti, M., Fiore, F., Lamastra, A., 2014, A&A, 569, 37
- [Montuori et al. (2010)] Montuori, M., Di Matteo, P., Lehnert, M. D., Combes, F., Semelin, B., 2010, A&A, 518, 56
- [Moreno et al. (2015)] Moreno, J., Torrey, P., Ellison, S. L., Patton, D. R., Bluck, A. F. L., Bansal, G., Hernquist, L., 2015, MNRAS, 448, 1107
- [Nair & Abraham (2010)] Nair, P. B., & Abraham, R. G., 2010, ApJS, 186, 427
- [Nevin et al. (2019)] Nevin, R., Blecha, L., Comerford; J., Greene, J, 2019, ApJ, in press
- [Nikolic, Cullen & Alexander (2004)] Nikolic, B., Cullen, H., Alexander, P., 2004, MNRAS, 355, 874
- [Patton & Atfield (2008)] Patton, D. R., & Atfield, J. E., 2008, ApJ, 685, 235
- [Patton et al. (2013)] Patton, D. R., Torrey, P., Ellison, S. L., Mendel, J. T., Scudder, J. M., 2013, MNRAS, 433, L59
- [Pawlik et al. (2016] Pawlik, M. M., et al., 2016, MNRAS, 456, 3032
- [Perez et al. (2011)] Perez, J., Michel-Dansac, L., Tissera, P. B., 2011, MNRAS, 417, 580
- [Ramos Almeida et al. (2011)] Ramos Almeida, C., Tadhunter, C. N., Inskip, K. J., Morganti, R., Holt, J.; Dicken, D., 2011, MNRAS, 410, 1550
- [Ramos Almeida et al. (2013)] Ramos-Almeida, C., et al., 2013, MNRAS, 436, 997
- [Ramos Almeida et al. (2012)] Ramos Almeida, C., et al., 2012, MNRAS, 419, 687
- [Reichard et al. (2009)] Reichard, T. A., Heckman, T. M., Rudnick, G., Brinchmann, J., Kauffmann, G., Wild, V., 2009, ApJ, 691, 1005
- [Robichaud et al. (2017)] Robichaud, F., Williamson, D., Martel, H., Kawata, D., Ellison, S. L., 2017, MNRAS, 469, 3722
- [Ricci et al. (2017)] Ricci, C., et al., 2017, MNRAS, 468, 1273
- [Sabater et al. (2015)] Sabater, J., Best, P. N., Heckman, T. M., 2015, MNRAS, 447, 110
- [Satyapal et al. (2014)] Satyapal, S., Ellison, S. L., McAlpine, W., Hickox, R. C., Patton, D. R., Mendel, J. T., 2014, MNRAS, 441, 1297
- [Schawinski et al. (2015)] Schawinski, K., Koss, M., Berney, S., Sartori, L. F., 2015, MNRAS, 451, 2517
- [Schawinski et al. (2012)] Schawinski, K., Simmons, B. D., Urry, C. M., Treister, E., Glikman, E., 2012, MNRAS, 425, 61
- [Scudder et al. (2015)] Scudder, J. M., Ellison, S. L., Momjian, E., Rosenberg, J. L., Torrey, P., Patton, D. R., Fertig, D., Mendel, J. T., 2015, MNRAS, 449, 3719
- [Scudder et al. (2012b)] Scudder, J. M., Ellison, S. L., Torrey, P., Patton, D. R., Mendel, J. T., 2012, MNRAS, 426, 549
- [Silverman et al. (2011)] Silverman, J. D., et al., 2011, ApJ, 743, 2
- [Steinborn et al. (2018)] Steinborn, L. K., et al., 2018, MNRAS, 481, 341
- [Stern et al. (2005)] Stern, D., et al., 2005, ApJ, 631, 163
- [Stern et al. (2012)] Stern, D., et al., 2012, ApJ, 753, 30
- [Stockton & MacKenty (1987)] Stockton, A., MacKenty, J. W., 1987, ApJ, 316, 584
- [Tal et al. (2009)] Tal, T., van Dokkum, P. G., Nelan, J., Bezanson, R., 2009, AJ, 138, 1417
- [Thorp et al. (2019)] Thorp, M. D., Ellison, S. L., Simard, L., Sanchez, S. F., Antonio, B., 2019, MNRAS, 482, L55
- [Torrey et al. (2012)] Torrey, P., Cox, T. J., Kewley, L. J., Hernquist, L., 2012, ApJ, 746, 108
- [Treister et al. (2012)] Treister, E., Schawinski, K., Urry, C. M., Simmons, B. D., 2012, ApJ, 758, L39
- [Trouille & Barger (2010)] Trouille, & Barger, A. J., 2010, ApJ, 722, 212
- [Urrutia et al. (2008)] Urrutia, T., Lacy, M., Becker, R. H., 2008, ApJ, 674, 80
- [Villforth et al. (2017)] Villforth, C., 2017, MNRAS, 466, 812
- [Walmsley et al. 2019)[wal19] almsley, M., Ferguson, A. M. N., Mann, R. G., Lintott, C. J., 2019, MNRAS, 483, 2968
- [Weston et al. (2017)] Weston, M. E., McIntosh, D. H., Brodwin, M., Mann, J., Cooper, A., McConnell, A., Nielsen, J. L., 2017, MNRAS, 464, 3882
- [Wong et al. (2011)] Wong, K. C., et al., 2011, ApJ, 728, 119
- [Woods & Geller (2007)] Woods, D. F., Geller, M. J., 2007, AJ, 134, 527
- [Wright et al. (2010)] Wright, E. L., et al., 2010, AJ, 140, 1868
- [Yan & Blanton (2012)] Yan, R., & Blanton, M. R., 2012, ApJ, 747, 61
Appendix A Further CFIS image examples
A further selection of mergers identified in CFIS images is presented in Fig. 12, in order to appreciate the image quality of the survey.
