Spatially-resolved stellar populations and kinematics with KCWI: probing the assembly history of the massive early-type galaxy NGC 1407
Abstract
Using the newly commissioned KCWI instrument on the Keck-II telescope, we analyse the stellar kinematics and stellar populations of the well-studied massive early-type galaxy (ETG) NGC 1407. We obtained high signal-to-noise integral-field-spectra for a central and an outer (around one effective radius towards the south-east direction) pointing with integration times of just 600s and 2400s, respectively. We confirm the presence of a kinematically distinct core also revealed by VLT/MUSE data of the central regions. While NGC 1407 was previously found to have stellar populations characteristic of massive ETGs (with radially constant old ages and high alpha-enhancements), it was claimed to show peculiar super-solar metallicity peaks at large radius that deviated from an otherwise strong negative metallicity gradient, which is hard to reconcile within a ‘two-phase’ formation scenario. Our outer pointing confirms the near-uniform old ages and the presence of a steep metallicity gradient, but with no evidence for anomalously high metallicity values at large galactocentric radii. We find a rising outer velocity dispersion profile and high values of the 4th-order kinematic moment – an indicator of possible anisotropy. This coincides with the reported transition from a bottom-heavy to a Salpeter initial mass function, which may indicate that we are probing the transition region from the ‘in-situ’ to the accreted phase. With short exposures, we have been able to derive robust stellar kinematics and stellar populations in NGC 1407 to 1 effective radius. This experiment shows that future work with KCWI will enable 2D kinematics and stellar populations to be probed within the low surface brightness regions of galaxy halos in an effective way.
1 Introduction
Early-type galaxies (ETGs) are a well-studied family of galaxies that tend to follow very tight relations between their key properties. Such correlations are powerful tools to understand the formation mechanism and evolution through cosmic time of ETGs and as such, must be reproduced by any valid theoretical model. A currently favored formation mechanism for ETGs is the so-called ‘two-phase’ model (e.g Naab et al. 2009; Oser et al. 2010; Hilz et al. 2013). In the first phase, the core of the galaxy forms ‘in-situ’, in a fast and violent event with extremely high star formation rates (at ). This dissipative phase creates a compact, massive galaxy sometimes referred to as a ‘red nugget’ (e.g. Damjanov et al. 2009; Glazebrook 2009). This is then followed by an accretion phase, where the galaxy suffers random encounters with in-falling lower mass satellites. The majority of those encounters are dry mergers that place most of the newly accreted material at the periphery of the ‘red nugget’. This will add some stellar mass and significantly increase its size, but will leave the central properties largely unchanged. This scenario can explain many of the main phenomena seen in ETGs, such as their strong size evolution with cosmic time (e.g Daddi et al. 2005; Trujillo et al. 2007). Within this scenario, one would expect to be able to differentiate between the ‘in-situ’ and accreted (‘ex-situ’) material via spatially-resolved stellar populations and kinematics, perhaps even determining the transition radius. This transition is predicted to occur at distances smaller than the effective radius (Re) for the most massive ETGs, owing to their very active accretion histories.(e.g Rodriguez-Gomez et al. 2016).
Over the past decade, a huge step forward in understanding the formation and evolution of ETGs has been made by integral field spectroscopy (IFS) surveys (e.g. ATLAS3D Cappellari et al. 2011, CALIFA Sánchez et al. 2012, MaNGA Bundy et al. 2015, SAMI Croom et al. 2012). These surveys have explored the main properties of ETGs, although most of the findings are limited to the central regions of the galaxies. However, spatially-resolved studies covering the low surface brightness outer regions of ETGs are still scarce owing to limitations of instrument sensitivity and thus the large amounts of time required for such studies.
Recently, two new IFS instruments have been installed on the Keck (Keck Cosmic Web Imager, KCWI; Morrissey et al. 2018) and the VLT (Multi Unit Spectroscopic Explorer, MUSE; Bacon et al. 2010) telescopes. Both instruments are designed for high sensitivity over long (stacked) total integration, and therefore are ideally suited to open up new avenues of study in the halos of ETGs. MUSE operates with a larger and longer wavelength coverage (480-930 nm) than KCWI, which currently operates with bluer coverage (350-560 nm, though with a planned future upgrade path for a red channel covering 530-1050 nm). The bluer coverage of KCWI is, however, arguably better suited to the study of stellar populations which have more diagnostic lines at blue wavelengths, as well as taking advantage of lower background contributions from night sky emission. MUSE has the advantage of a larger field-of-view (1’1’, compared to the 33”20” corresponding to the largest FOV of KCWI), though the finer spatial sampling of MUSE (0.2″ square spaxels vs. KCWI’s in its largest field mode) is not necessarily an advantage for studying the extended envelopes of nearby galaxies, which can cover arcminute scales.
In this paper, we present new KCWI observations of a well-observed ETG, NGC 1407, allowing us to test the performance of this instrument for measuring stellar kinematics and populations in different surface brightness regimes, as well as providing a comparative study with MUSE (in addition to other studies). Although too far south to be part of the ATLAS3D survey (Cappellari et al., 2011), NGC 1407 was still included in the SLUGGS survey111http://sluggs.swin.edu.au (Brodie et al., 2014) as a prime example of a massive and relatively nearby ETG. Recently Johnston et al. (2018) ( J+18 hereafter) probed NGC 1407’s central kinematics using two different MUSE datasets from the ESO archive. They totaled 4500s and the data reached out to 30” (0.47 Re). Therefore it did not reach the outer regions where Pastorello et al. (2014) (hereafter P+14) inferred a few locations to have super-solar metallicities using DEIMOS multi-slit spectroscopy of the Calcium II triplet (CaT). Such anomalies in the outer parts are difficult to reconcile within the ‘two-phase’ scenario presented above, and therefore need to be understood.
With this aim, we present here new data from the recently commissioned KCWI of both the galaxy centre and a pointing covering the anomalous region. We are thus in a position to directly compare and contrast the capabilities of KCWI with MUSE and to investigate the claimed outer metallicity peaks in NGC 1407. We first describe our KCWI observations and data reduction in Section 3. Next we derive both stellar populations and kinematics from our new data (Section 4), and compare our values with those from the literature and the results in Section 5.
2 NGC 1407
Located at the centre of the massive Eridanus group (Gould 1993), NGC 1407 is the brightest group galaxy, classified as an E0. Its stellar mass is log(M∗/M⊙) 11.60 (Forbes et al., 2017)) and its total halo mass is log(Mh/M⊙) 13.2 (Wasserman et al., 2018). Here we take the distance to NGC 1407 (26.8 Mpc) and its effective radius (Re = 63.4”) from P+14 to enable direct comparison.
The galaxy has been extensively studied both with classical long-slit spectroscopy and with IFS. It has a recession velocity of =1779 km s-1 and shows a well defined kinematically distinct core (KDC). This was first reported in Spolaor et al. (2008a) using long-slit spectroscopy, although the data were not sufficient to determine if it was a true feature. Since then, its kinematics in the central parts have been followed up by Proctor et al. (2009); Rusli et al. (2013); Arnold et al. (2014) and Foster et al. (2016). More recently, a new attempt to measure the size ( 5 arcsec or 0.6 kpc) and amplitude of the KDC was performed with MUSE by (J+18). While they quote an amplitude of 10 km s-1, this is lower than that Rusli et al. (2013). Because the MUSE data was more coarse and seeing-limited, no conclusive results were reached.
Using long-slit data along the major axis, Spolaor et al. (2008b) (S+08b hereafter) showed that NGC 1407 is very old with a flat age gradient but a steep metallicity gradient. Also using long-slit spectroscopy along the major axis, but of much higher signal-to-noise (S/N), Conroy et al. (2017) and van Dokkum et al. (2017) (vD+17 hereafter) studied its stellar populations and initial mass function (IMF). Their results are consistent with S+08b and in addition, they also found evidence for a very bottom-heavy IMF within the central 0.3 Re. Although the main focus in J+18 was on the kinematic features of NGC 1407, they also performed a tentative stellar population analysis with similar results. In all three works, the authors found high values of [/Fe] at all radii, indicative of fast formation timescales in ETGs (Thomas et al., 2005).
Given the above, NGC 1407 seems to be a rather typical massive ETG. However, an IFS study of the stellar populations in the outer regions of NGC 1407 has been carried out only by the SLUGGS survey using the pseudo-IFS method called SKiMS. Because it uses the CaT absorption lines, stellar metallicities can be inferred but there is no information on the stellar ages. Intriguingly, P+14 claimed that the smooth radial decrease in metallicity showed several locations of super-solar metallicity ([Z/H]0.8 dex) around 45” (0.8 Re) south-east of the galaxy centre. If correct, they could represent dynamically unmixed stars from a previous major merger. It is therefore important to confirm or refute these claimed off-centre metallicity peaks with new IFS data. One aim of this paper is to further investigate these anomalous metallicity peaks, while providing the first 2D maps of a massive ETG out to 1 Re with KCWI.
3 Observations and data reduction
Observations were carried during the night of 2017 September 19th as part of the first public run of the newly commissioned instrument KCWI on the Keck-II telescope. NGC 1407 was a filler object in a larger program, aimed at testing the capability of obtaining good IFS data in the outer regions of an ETG with a modest amount of time in dark time conditions. The weather conditions were irregular with clouds and a typical seeing of 1.5”.
We employed the large slicer (33” 20”) with a position angle of 0 deg. It was used with the blue BM grating centered at =4800Å, which gives a usable wavelength range of 4300–5200 Å. While this is an excellent regime to perform studies of stellar population age and metallicity, the Mgb index is not available as it falls at the limit of our spectra, and therefore we cannot derive any alpha-element information for use the Mgb absorption line to derive the total metallicities ([Z/H]). This configuration delivers a nominal spectral resolution of 2.5 Å ( 64 km s-1) at 5000Å. However, measuring the spectral resolution from the arc lamps gives a virtually constant higher resolution of 2.0 Å ( 55 km s-1; R2300) throughout the wavelength range. This is marginally better than the MUSE resolution of 2.7 Å ( 69 km s-1; at 5000Å; J+18).
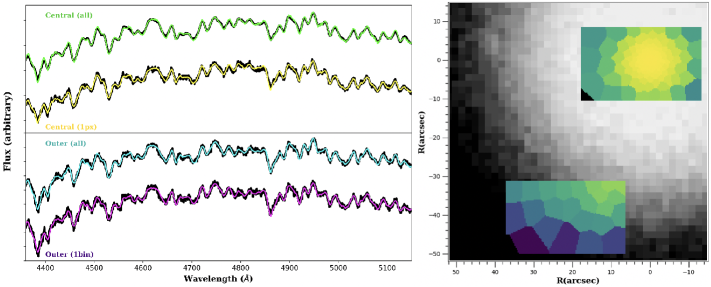
We integrated for 600s for the central pointing and obtained 4 exposures of 600s (2400s total) for the outer pointing at =20”, =40”, i.e., to the south-east, as shown in Figure 1. With this we reach roughly 1 Re, which corresponds to a surface brightness of 22 mag per sq. arcsec. No nod-and-shuffle was applied, but we observed instead a nearby patch of sky for 600s to later perform sky subtraction, and a standard star was observed for flux calibration purposes.
The data were reduced using the KCWI pipeline KDERP222github.com/Keck-DataReductionPipelines/KcwiDRP, which performs a full data reduction, delivering flux calibrated datacubes. For the sky subtraction we tested both options of the pipeline. One subtracts the pure sky frames from the science targets, whereas the second option, available in a later updated version of the pipeline, applies a 1–sigma clipping to remove light from non-sky photons. However, this second method is limited by needing enough sky pixels for the clipping procedure, which is not the case in our central pointing. We therefore choose the outputs from applying the initial technique of dedicated sky frames during the observations.
4 Analysis
Once the science datacubes are complete we perform a Voronoi tessellation (e.g Cappellari & Copin 2003) to spatially bin the spectra and optimize the S/N in each bin to 30. We note that we have also tested lower quality thresholds, down to S/N10. While the trends described below are reproduced in these lower S/N binnings, finer trends are diluted by the higher uncertainties in some of the bins.
These high S/N tessellated maps are fed into pPXF (Penalized Pixel Fitting; Cappellari & Emsellem 2004) in order to obtain the stellar kinematics (radial velocity, velocity dispersion, and the higher-order moments and ), together with the stellar populations (age, metallicity, and alpha-enhancement). For both the kinematics and the stellar populations, we employ the E-MILES SSP library (Vazdekis et al., 2016), considering templates that range from metallicities of 2.42 to 0.40 dex and that cover ages from 0.03 to 14 Gyr.
We have also investigated the results from using different approaches. For example, we tested different alpha-element models, as NGC 1407 is known to have a high [Mg/Fe] dex ratio (e.g. vD+17; J+18). We have also used a varying IMF, as NGC 1407, like most massive ETGs (e.g. Martín-Navarro et al. 2015), shows a strong radial IMF gradient, going from a very bottom-heavy IMF in the central parts to a universal Kroupa-like IMF at around 0.4 Re (vD+17). This is relevant as the use of a non-universal IMF has been shown to affect the stellar populations analysis (Ferré-Mateu et al., 2013). We note, however, that such tests show only a small impact on the mean mass-weighted ages and leave the total metallicity values largely unchanged. Therefore, due to the lack of both alpha enhanced and IMF sensitive features in our spectral range, and to allow for direct comparison with the literature, we present hereafter the results utilizing the Basti Base SSP models and a Kroupa IMF.
4.1 Kinematics
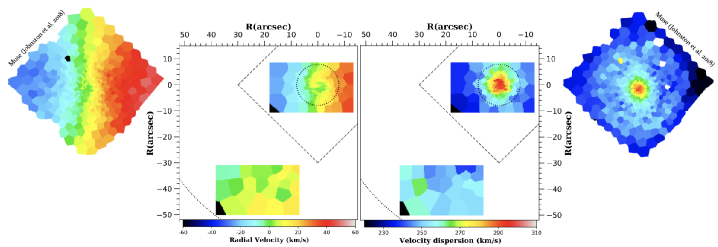
We present briefly our kinematic results to show how they compare with published data. However, we encourage the reader to refer to J+18 for a more comprehensive study of the stellar kinematics of NGC 1407, in particular their discussion on the nature of NGC 1407’s KDC. Overall we find an excellent agreement in the kinematic features of the central parts of NGC 1407 with those in J+18, as seen by the 2D kinematic maps in Figure 2. The left panel shows a slow rotational velocity of 40 km s-1 and the small KDC is clearly seen. We note that the amplitude of the KDC we observe is similar to the one in J+18 (10 km s-1), as opposed to the larger value of 40 km s-1 from Rusli et al. (2013). However, we could be suffering from the same effects as J+18 owing that both KCWI and MUSE have a similar resolution, which is coarser than the one of SINFONI (Rusli et al., 2013), and that they are both seeing-limited. In fact, there is a peculiar small feature in the KDC that after inspection in the different S/N bins disappears as we increase the S/N threshold. This indicates that it is most likely a noise feature rather than a real feature. Nonetheless, it has no impact in our results, as shown in the following section.
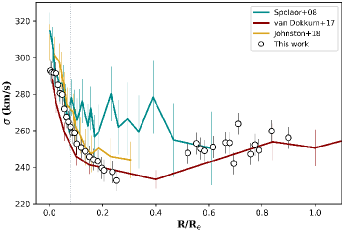
The right panel of Figure 2 presents a peaked velocity dispersion of 300 km s-1 at the centre that decreases to 240 km s-1 at 0.3–0.4 Re. However, beyond that point the profile begins to rise, reaching values of 260 km s-1 at 1 Re. This rising profile is better seen in Figure 3. Our declining velocity dispersion part is well-matched to the major axis profiles of Spolaor et al. (2008a) and vD+17, with the latter also showing the rising beyond 0.4 Re.
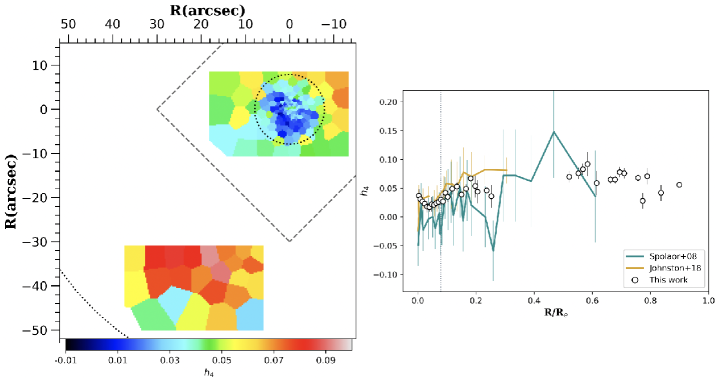
Such outwards rising profiles can only be revealed when reaching large galactocentric distances, as shown by the MASSIVE survey (Ma et al., 2014). Although NGC 1407 was not included in that survey, it would lie at the lower mass limit (log(M∗/M⊙) 11.6) of their sample. Veale et al. (2018) found that around 15 of the MASSIVE galaxies presented this rising profile (see also Ene2019). However, Veale et al. (2018) also found that massive galaxies with such a rising profiles also have increasing values of the 4th Gauss-Hermite coefficient () with radius. As shown in Figure 4, the 2D map of NGC 1407’s and its radial gradients show this increase up to 0.6Re (also reported in J+18). However, it then hints at a possible decrease or flattening of the values, which was also found in the pseudo-IFS maps of Arnold et al. 2014 (although this latter found lower values of on average). We discuss the implications of these kinematics profiles together with the outcome from the stellar populations in Section 5.
4.2 Stellar Populations
We also use pPXF to obtain the main stellar population parameters (mean age and total mean metallicity [Z/H]) and the star formation history (SFH) of NGC 1407. In the following we present the results of using pPXF with regularization. The regularization value was derived following the procedure described in McDermid et al. (2015) and Cappellari (2017). Using such regularization provides a trade-off between a smoother SFH and a good fit that is still consistent with the observations. Note that a fit without regularization in the case of a massive ETG like NGC 1407 would provide a result that is more similar to the single stellar population approach (i.e. using a line index analysis) presented in the literature. As mentioned above, due to the lack of a reliable Mgb index value, we are not able to measure our own [Z/H] from the line indices, hence compare it directly to the literature values. However, we do perform a line-index analysis to derive the iron metallicity [Fe/H] that will be later discussed in Section 5, using the pair of indices Hβ–Fe5015.
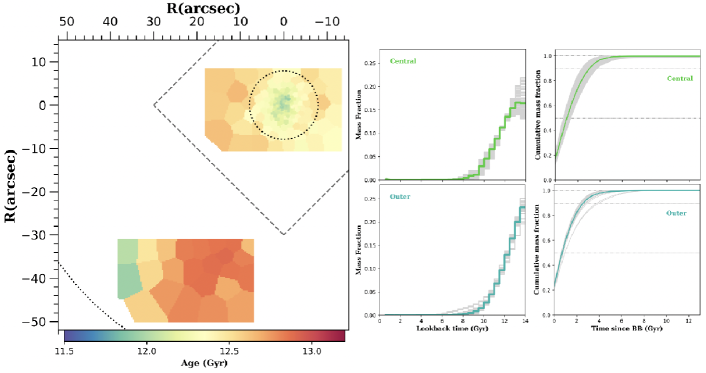
The derived SFHs for all bins (see Figure 5, right panels) are fairly similar in terms of the timescales: they all show that the galaxy created stars very early on with fast star-forming rates, being assembled in a timescale of less than 3 Gyr. This fits well into the general scheme of formation for massive ETGs (Thomas et al., 2005), where such short formation timescales are translated into elevated alpha-abundances (e.g Thomas et al. 2005; de La Rosa et al. 2011, McDermid et al. 2015). Indeed, NGC 1407’s [/Fe] was previously reported to be constantly high at all radii ([/Fe]0.35 dex; e.g vD+17; J+18). NGC 1407 is consistently old on average (12–13 Gyr) at all the radii covered by our two pointings, which is in agreement with other literature studies (e.g S+08b; vD+17). The 2D stellar age map shows a hint of slightly younger central ages (similarly to J+18). Although the difference in age is compatible with the associated error, the region roughly corresponds to the coverage of the KDC, indicating that both phenomena might be related and that those young ages are a real feature and not systematics of the SSP models. Such slightly younger ages could hint towards a more recent event of star formation, such the occurrence of a gas-rich major merger.
We find that NGC 1407 shows a strong metallicity gradient towards the outer pointing. In Figure 6 we show the 2D metallicity map of NGC 1407. It has a super-solar central metallicity of [/H] 0.27 dex that decreases to dex at 1Re. We compare our metallicity gradient of NGC 1407 with those in the literature (see Figure 6, right panel). This includes the long-slit gradients of S+08b and vD+17, both of whom oriented their long-slit along the major axis of the galaxy at 40∘ (our outer pointing lies closer to the minor axis). We also show the metallicity profiles from J+18 (adapted from their fig. 5) and from the 2D pseudo-IFS of P+14 (adapted from their fig. 13). We measure a metallicity log-gradient of [/H]0.20 dex per dex like vD+17. S+08b and J+18 found a steeper gradient of [/H]0.35 dex per dex, albeit over a more limited radial range.
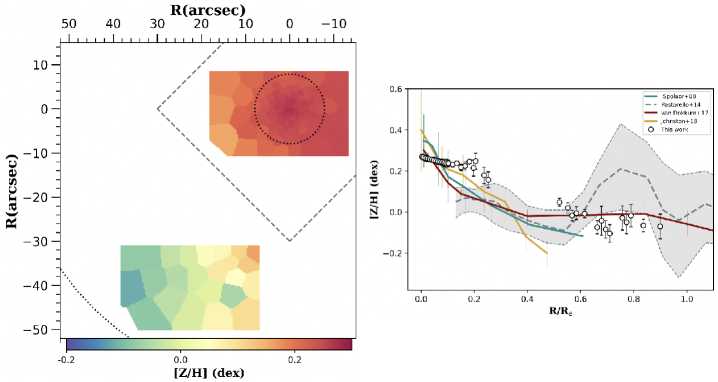
We note that the central metallicities of the literature studies tend to be higher than ours and thus show steeper metallicity gradients. There are two main contributors to this effect. From one side, the use of the line index technique tends to provide slightly higher metallicities (uses one single SSP) as opposed to the full-spectral-fitting technique (which provides a combination of SSPs that better fit the spectra; see e.g Ferré-Mateu et al. 2014). From the other side, the use of a regularization parameter creates a smoother (and thus less SSP-like) SFH. These effects will be most prominent at the center-most parts, where the galaxy behaves more like a single-burst dissipative event, whereas the outer regions are expected to have a more extended SFH as the result of the accretion phase. Therefore, a non regularized fit or the use of line indices can provide a slightly higher metallicity in the center parts, thus producing steeper gradients. In fact, our non-regularized test recover the higher metallicities shown in the central parts of the galaxy. However, the regularization parameter employed here is the one that provides the best balance between a good fit that is consistent within the errors and a smoother SFH (McDermid et al., 2015).
Furthermore, it is worth emphasizing that regardless of which SSP models we employ (scaled solar, with varying alphas, different IMF, etc.) or regularization value, we find that the metallicities in the outer pointing are always less than solar, and thus the overall results and conclusions remain unchanged. That is, we do not find the super-solar metallicities ([/H]0.80.15 dex) inferred by P+14 around 0.8 Re. The main reason for this discrepancy can be explained by the methodology employed. While CaT is a good metallicity indicator, it is highly dependent on the assumed IMF and additionally, it relies on an empirical transformation from the measured CaT index to an inferred metallicity. In the case of the high CaT values reported by P+14 they are extrapolated well above the empirical relation. Thus we conclude that the anomalous metallicities reported by P+14 are not most likely over-estimated, and therefore NGC 1407’s stellar population properties are similar to other ETGs of similar mass.
5 Discussion
We have explored the stellar populations and kinematics of NGC 1407 covering two different regions of interest: the center-most and an outer region in the south-east, claimed to have atypically high metallicities that are hard to reconcile within a ‘two-phase’ formation paradigm. However, the overall results show that NGC 1407 is rather a normal ETG. Nonetheless, much more information can be revealed from these new data, completing the puzzle of the formation and assembly of NGC 1407.
NGC 1407’s relevant kinematic features can be closely linked to its past formation events. The presence of a KDC in NGC 1407 suggests that this galaxy may have experienced either a major merger at some point in the past (e.g. Hernquist & Barnes 1991; Jesseit et al. 2007; Bois et al. 2011) or a series of colissionless events (e.g. Holley-Bockelmann & Richstone 2000). McDermid et al. 2006 showed that for the SAURON (Bacon et al., 2001) galaxies with a KDC, those with large KDCs (diameters larger than 1 kpc) were all typically old (10 Gyr) and slow rotators. J+18 reported the radius of the KDC in NGC 1407 to be around 5 arcseconds (0.6 kpc), therefore NGC 1407 would fall into this category as it is a slow rotator. In addition, although NGC 1407 is on average old (13 Gyr) the region of the KDC coincides with the physical region in the center revealing slightly younger ages (see Figure 5). This indicates that such young ages are real and linked to the KDC and are not systematics related to the SSP models. The most plausible explanation is the occurrence of a gas–rich major merger at slightly later times than the formation of the host galaxy. This can deliver younger stars and/or any gas left in the core of the host galaxy, producing further star formation and therefore revealing the slightly younger ages seen in the center. Interestingly, Forbes & Remus (2018) presented a simulated ETG from Magneticum (Remus et al., 2017) that was created to reproduce a NGC 1407-like ETG precisely. As shown in their figure 5, the model galaxy is a mixture of a major, and some minor, merger events at later times. In the simulation, the major merger event took place at 1.1 (around 8 Gyr ago). Since our SFHs seem to be all complete around 9 Gyr ago, this indicates that such a major merger event must have occurred earlier for the real NGC 1407, but it is compatible with the scenario of an early major merger event indicated by the younger central ages.
The other kinematics orders of NGC 1407 also provide key information about the formation of this massive ETG. For example, the value of NGC 1407 is found to be positive and increasing up to 0.6Re. A decrease is then hinted, which was already shown in Arnold et al. 2014. An increase of the is associated with radial velocity anisotropy, whereas a decrease of it is related to a tangential anisotropy (e.g Gerhard et al. 1998; Dekel et al. 2005; Thomas et al. 2007). Previously, Pota et al. (2015) and Wasserman et al. (2018) showed that the orbits of NGC 1407’s globular clusters were radial for the red subpopulation and tangential for the blue one. Because red globular clusters are thought to track the stellar light of the galaxy (e.g. Brodie & Strader 2006; Peng et al. 2006; Forbes & Remus 2018), our results from the stellar kinematics seem to reproduce the same behavior as the red globular clusters of NGC 1407. Typically, red globular clusters are concentrated in the central parts of the galaxies, being mostly associated with the first phase of formation (e.g. Brodie & Strader 2006; Beasley et al. 2018). Blue globular clusters are instead found at all radii and are mostly associated with the accretion phase. Furthermore, Greene et al. (2019) investigated structural parameters such as that could correlate directly with the amount of ‘ex-situ’ (accreted) material. They found that galaxies from the MASSIVE survey with high [/Fe] and low [Fe/H] in the outskirts tend to have positive values. Using a line index analysis we find a gradient of [Fe/H] = dex per dex in NGC 1407, which is fully consistent with the quoted mean value of [Fe/H] = 0.04 dex per dex for ETGs of NGC 1407’s stellar mass and velocity dispersion in Greene et al. (2019). Therefore, NGC 1407, with an average positive 0.07, high [/Fe] 0.35 dex and low [Fe/H]0.47 dex at the outermost regions of our data, shows the same features of the MASSIVE galaxies in Greene et al. (2019). As mentioned above, positive values of with a rising profile might be indicative of radial anisotropy, which can be created by accretion events (e.g Hilz et al. 2012; Amorisco 2017). This means that the accretion of satellites may have also played an important role in the second phase of the assembly of NGC 1407. Again, in the Magneticum simulation (Forbes & Remus, 2018), their NGC 1407-like galaxy was a mixture of both a major merger event and a series of minor mergers, further supporting our results. We note, however, that a full understanding of the orbital structure requires a complete dynamical modelling, along the lines of van den Bosch et al. (2008).
One final clue for the formation of NGC 1407 is revealed by the location where the changes in the profiles are seen. For example, the transition from a decreasing to an outwards rising profile occurs around 0.3–0.4Re, and the metallicity gradients also seem to flatten around that region, which also corresponds to the rising part of the profile. This region interestingly coincides with the location where the IMF of NGC 1407 transitions from a very bottom-heavy IMF to a Kroupa-like one (see Figure 17 from vD+17). IMF variations within a single galaxy make sense under the ‘two-phase’ formation scenario, where the initial physical conditions at the beginning of each phase were completely different (which has recently been reproduced by simulations; e.g Barber et al. 2019). Vaughan et al. (2018) suggested that this change in the IMF (in that case for the giant elliptical NGC 1399) also coincided with the light profile transitioning from an ‘inner’ Sérsic component to a component suggested to be attributed to the ‘accreted’ stars (Spavone et al., 2017).
In fact, Huang2013 showed that the light profile of massive ETGs can generally be fitted by three physically distinctive components rather than by a Sérsic function. At small scales there is an innermost compact component ( 1 kpc), a fossil-record of the dissipation processes that occurred very early on. They suggested that combined with an intermediate region (3 kpc), together they account for up to 40 of the galaxy’s luminosity. In the case of high-luminosity ETGs such as NGC 1407, this region highly resembles the high redshift ‘red nuggets’, which are thought to be the result of the first, dissipative phase (e.g. Damjanov et al. 2009; Glazebrook 2009). They have typical sizes of 2 kpc and stellar masses of 1011M⊙ (e.g. Trujillo et al. 2007; Buitrago et al. 2008; Carrasco et al. 2010). These compact sizes have been further confirmed by the few untouched massive relics of such ‘red nuggets’ found in the nearby Universe (e.g. Trujillo et al. 2014; Ferré-Mateu et al. 2017; Buitrago et al. 2018). In particular, Huang2013 found that such transition regions occur in NGC 1407 at 0.16Re and 0.36Re, containing 23 of the light in the galaxy. This coincides with our transition region (0.3–0.4Re), which corresponds to a physical size of 2–3 kpc and that contains about 20 of the stellar mass of the galaxy (M 81010M⊙). Adding all this to the above results, we therefore suggest that we might be witnessing the transition in NGC 1407 from the ‘in-situ’ region, corresponding to the ‘red nugget’, into the accreted region of this massive galaxy directly through its galaxy kinematics and stellar populations features.
6 Conclusions
Using two short exposure Keck/KCWI pointings, located centrally and at 1 Re, we find NGC 1407 to have the kinematical features typical of a massive early-type galaxy, i.e., a slow rotator with an inner kinematically distinct core, a centrally peaked velocity dispersion, and high values of anisotropy. Our stellar population analysis is also consistent with that of massive ETGs, i.e., a very old age with short formation timescales of less than 3 Gyr. The central parts of the galaxy show slightly younger ages that would indicate the effect of a gas-rich major merger at early epochs. These younger ages coincide with the region covered by the small KDC of NGC 1407. This massive ETG also shows the characteristic strong negative metallicity gradient expected under the ‘two-phase’ scenario.
Overall, our stellar populations are thus all consistent with those reported in the literature and are compatible with a recently simulated mock-NGC 1407 galaxy. We have also investigated the claims of some outer locations of having anomalously high inferred metallicities. This effect is hard to explain within the ‘two-phase’ scenario. Our 2D metallicity map in this region shows a smooth metallicity gradient with no evidence for the anomalous peaks.
Putting together the kinematic and stellar population results, we suggest that we are probing the transition region from the ‘in-situ’ phase (equivalent to the ‘red nugget’ formed during the first phase) to the accretion-dominated one. The change from a bottom-heavy to a normal IMF, the rise in velocity dispersion, and the increasing anisotropy, all coincide at around 0.3–0.4Re (2–3 kpc).
This pilot study has shown that KCWI can efficiently obtain accurate kinematic and stellar population properties of ETGs in their central (600s integration, surface brightness mag per sq. arcsec) and outer (s integration, , surface brightness mag per sq. arcsec) regions, probing the transition from central ‘in-situ’ dominated formation to accretion dominated. From our investigation, the sensitivity and accuracy of KCWI for such observations appears very comparable to those of the popular MUSE spectrograph on the VLT. We therefore expect that larger surveys of ETGs, and in particular their low surface brightness outer halos, will soon become available using this facility, probing the assembly histories of the most massive galaxies in the Universe.
Acknowledgments
AFM has received financial support through the Postdoctoral Junior Leader Fellowship Programme from ‘La Caixa’ Banking Foundation (LCF/BQ/LI18/11630007). AFM, DAF and RMcD also thank the ARC for financial support via DP160101608. RMcD is the recipient of an Australian Research Council Future Fellowship (project number FT150100333). AJR was supported by NSF grant AST-1616710 and as a Research Corporation for Science Advancement Cottrell Scholar. JPB was supported by NSF grant AST-1616598.
The data presented herein were obtained at the W. M. Keck Observatory, which is operated as a scientific partnership among the California Institute of Technology, the University of California, and the National Aeronautics and Space Administration. The Observatory was made possible by the generous financial support of the W. M. Keck Foundation. The authors wish to recognise and acknowledge the very significant cultural role and reverence that the summit of Maunakea has always had within the indigenous Hawaiian community. We are most fortunate to have the opportunity to conduct observations from this mountain. Mālama ka ’āina.
References
- Amorisco (2017) Amorisco N. C., 2017, MNRAS, 469, L48
- Arnold et al. (2014) Arnold J. A., et al., 2014, ApJ, 791, 80
- Bacon et al. (2001) Bacon R., et al., 2001, MNRAS, 326, 23
- Bacon et al. (2010) Bacon R., et al., 2010, in Ground-based and Airborne Instrumentation for Astronomy III. p. 773508, doi:10.1117/12.856027
- Barber et al. (2019) Barber C., Schaye J., Crain R. A., 2019, MNRAS, 483, 985
- Beasley et al. (2018) Beasley M. A., Trujillo I., Leaman R., Montes M., 2018, Nature, 555, 483
- Bois et al. (2011) Bois M., et al., 2011, MNRAS, 416, 1654
- Brodie & Strader (2006) Brodie J. P., Strader J., 2006, ARA&A, 44, 193
- Brodie et al. (2014) Brodie J. P., et al., 2014, ApJ, 796, 52
- Buitrago et al. (2008) Buitrago F., Trujillo I., Conselice C. J., Bouwens R. J., Dickinson M., Yan H., 2008, ApJ, 687, L61
- Buitrago et al. (2018) Buitrago F., et al., 2018, A&A, 619, A137
- Bundy et al. (2015) Bundy K., et al., 2015, ApJ, 798, 7
- Cappellari (2017) Cappellari M., 2017, MNRAS, 466, 798
- Cappellari & Copin (2003) Cappellari M., Copin Y., 2003, MNRAS, 342, 345
- Cappellari & Emsellem (2004) Cappellari M., Emsellem E., 2004, PASP, 116, 138
- Cappellari et al. (2011) Cappellari M., et al., 2011, MNRAS, 413, 813
- Carrasco et al. (2010) Carrasco E. R., Conselice C. J., Trujillo I., 2010, MNRAS, 405, 2253
- Conroy et al. (2017) Conroy C., van Dokkum P. G., Villaume A., 2017, ApJ, 837, 166
- Croom et al. (2012) Croom S. M., et al., 2012, MNRAS, 421, 872
- Daddi et al. (2005) Daddi E., et al., 2005, ApJ, 626, 680
- Damjanov et al. (2009) Damjanov I., et al., 2009, ApJ, 695, 101
- Dekel et al. (2005) Dekel A., Stoehr F., Mamon G. A., Cox T. J., Novak G. S., Primack J. R., 2005, Nature, 437, 707
- Ferré-Mateu et al. (2013) Ferré-Mateu A., Vazdekis A., de la Rosa I. G., 2013, MNRAS, 431, 440
- Ferré-Mateu et al. (2014) Ferré-Mateu A., Sánchez-Blázquez P., Vazdekis A., de la Rosa I. G., 2014, ApJ, 797, 136
- Ferré-Mateu et al. (2017) Ferré-Mateu A., Trujillo I., Martín-Navarro I., Vazdekis A., Mezcua M., Balcells M., Domínguez L., 2017, MNRAS, 467, 1929
- Forbes & Remus (2018) Forbes D. A., Remus R.-S., 2018, MNRAS, 479, 4760
- Forbes et al. (2017) Forbes D. A., Sinpetru L., Savorgnan G., Romanowsky A. J., Usher C., Brodie J., 2017, MNRAS, 464, 4611
- Foster et al. (2016) Foster C., et al., 2016, MNRAS, 457, 147
- Gerhard et al. (1998) Gerhard O., Jeske G., Saglia R. P., Bender R., 1998, MNRAS, 295, 197
- Glazebrook (2009) Glazebrook K., 2009, Nature, 460, 694
- Gould (1993) Gould A., 1993, ApJ, 403, 37
- Greene et al. (2019) Greene J. E., et al., 2019, arXiv e-prints,
- Hernquist & Barnes (1991) Hernquist L., Barnes J. E., 1991, Nature, 354, 210
- Hilz et al. (2012) Hilz M., Naab T., Ostriker J. P., Thomas J., Burkert A., Jesseit R., 2012, MNRAS, 425, 3119
- Hilz et al. (2013) Hilz M., Naab T., Ostriker J. P., 2013, MNRAS, 429, 2924
- Holley-Bockelmann & Richstone (2000) Holley-Bockelmann K., Richstone D. O., 2000, ApJ, 531, 232
- Jesseit et al. (2007) Jesseit R., Naab T., Peletier R. F., Burkert A., 2007, MNRAS, 376, 997
- Johnston et al. (2018) Johnston E. J., Hau G. K. T., Coccato L., Herrera C., 2018, MNRAS, 480, 3215
- Ma et al. (2014) Ma C.-P., Greene J. E., McConnell N., Janish R., Blakeslee J. P., Thomas J., Murphy J. D., 2014, ApJ, 795, 158
- Martín-Navarro et al. (2015) Martín-Navarro I., La Barbera F., Vazdekis A., Falcón-Barroso J., Ferreras I., 2015, MNRAS, 447, 1033
- McDermid et al. (2006) McDermid R. M., et al., 2006, MNRAS, 373, 906
- McDermid et al. (2015) McDermid R. M., et al., 2015, MNRAS, 448, 3484
- Morrissey et al. (2018) Morrissey P., et al., 2018, ApJ, 864, 93
- Naab et al. (2009) Naab T., Johansson P. H., Ostriker J. P., 2009, ApJ, 699, L178
- Oser et al. (2010) Oser L., Ostriker J. P., Naab T., Johansson P. H., Burkert A., 2010, ApJ, 725, 2312
- Pastorello et al. (2014) Pastorello N., Forbes D. A., Foster C., Brodie J. P., Usher C., Romanowsky A. J., Strader J., Arnold J. A., 2014, MNRAS, 442, 1003
- Peng et al. (2006) Peng E. W., et al., 2006, ApJ, 639, 95
- Pota et al. (2015) Pota V., et al., 2015, MNRAS, 450, 3345
- Proctor et al. (2009) Proctor R. N., Forbes D. A., Romanowsky A. J., Brodie J. P., Strader J., Spolaor M., Mendel J. T., Spitler L., 2009, MNRAS, 398, 91
- Remus et al. (2017) Remus R.-S., Dolag K., Naab T., Burkert A., Hirschmann M., Hoffmann T. L., Johansson P. H., 2017, MNRAS, 464, 3742
- Rodriguez-Gomez et al. (2016) Rodriguez-Gomez V., et al., 2016, MNRAS, 458, 2371
- Rusli et al. (2013) Rusli S. P., et al., 2013, AJ, 146, 45
- Sánchez et al. (2012) Sánchez S. F., et al., 2012, A&A, 538, A8
- Spavone et al. (2017) Spavone M., et al., 2017, A&A, 603, A38
- Spolaor et al. (2008a) Spolaor M., Forbes D. A., Hau G. K. T., Proctor R. N., Brough S., 2008a, MNRAS, 385, 667
- Spolaor et al. (2008b) Spolaor M., Forbes D. A., Proctor R. N., Hau G. K. T., Brough S., 2008b, MNRAS, 385, 675
- Thomas et al. (2005) Thomas D., Maraston C., Bender R., Mendes de Oliveira C., 2005, ApJ, 621, 673
- Thomas et al. (2007) Thomas J., Saglia R. P., Bender R., Thomas D., Gebhardt K., Magorrian J., Corsini E. M., Wegner G., 2007, MNRAS, 382, 657
- Trujillo et al. (2007) Trujillo I., Conselice C. J., Bundy K., Cooper M. C., Eisenhardt P., Ellis R. S., 2007, MNRAS, 382, 109
- Trujillo et al. (2014) Trujillo I., Ferré-Mateu A., Balcells M., Vazdekis A., Sánchez-Blázquez P., 2014, ApJ, 780, L20
- Vaughan et al. (2018) Vaughan S. P., Davies R. L., Zieleniewski S., Houghton R. C. W., 2018, MNRAS, 479, 2443
- Vazdekis et al. (2016) Vazdekis A., Koleva M., Ricciardelli E., Röck B., Falcón-Barroso J., 2016, MNRAS, 463, 3409
- Veale et al. (2018) Veale M., Ma C.-P., Greene J. E., Thomas J., Blakeslee J. P., Walsh J. L., Ito J., 2018, MNRAS, 473, 5446
- Wasserman et al. (2018) Wasserman A., et al., 2018, ApJ, 863, 130
- de La Rosa et al. (2011) de La Rosa I. G., La Barbera F., Ferreras I., de Carvalho R. R., 2011, MNRAS, 418, L74
- van Dokkum et al. (2017) van Dokkum P., Conroy C., Villaume A., Brodie J., Romanowsky A. J., 2017, ApJ, 841, 68
- van den Bosch et al. (2008) van den Bosch R. C. E., van de Ven G., Verolme E. K., Cappellari M., de Zeeuw P. T., 2008, MNRAS, 385, 647