=\AtBeginShipoutBox\AtBeginShipoutBox
Deep into the structure of the first galaxies: SERRA views
Abstract
We study the formation and evolution of a sample of Lyman Break Galaxies in the Epoch of Reionisation by using high-resolution ( pc), cosmological zoom-in simulations part of the serra suite. In serra, we follow the interstellar medium (ISM) thermo-chemical non-equilibrium evolution, and perform on-the-fly radiative transfer of the interstellar radiation field (ISRF). The simulation outputs are post-processed to compute the emission of far infrared lines ([C ], [N ], and [O ]). At , the most massive galaxy, “Freesia”, has an age , stellar mass , and a star formation rate , due to a recent burst. Freesia has two stellar components (A and B) separated by ; other 11 galaxies are found within kpc. The mean ISRF in the Habing band is and is spatially uniform; in contrast, the ionisation parameter is , and has a patchy distribution peaked at the location of star-forming sites. The resulting ionising escape fraction from Freesia is . While [C ] emission is extended (radius 1.54 kpc), [O ] is concentrated in Freesia-A (0.85 kpc), where the ratio . As many high- galaxies, Freesia lies below the local [C ]-SFR relation. We show that this is the general consequence of a starburst phase (pushing the galaxy above the Kennicutt-Schmidt relation) which disrupts/photodissociates the emitting molecular clouds around star-forming sites. Metallicity has a sub-dominant impact on the amplitude of [C ]-SFR deviations.
keywords:
galaxies: high-redshift, formation, evolution, ISM – infrared: general – methods: numerical1 Introduction
Characterising the interstellar medium (ISM) properties of galaxies in the epoch of the reionisation (EoR) represents a key quest of modern cosmology.
Optical/near infrared (IR) surveys have been fundamental in identifying galaxies in the EoR, and further to give us an overview of their stellar masses, star formation rates and sizes up to redshift , well within the EoR (Dunlop, 2013; Madau & Dickinson, 2014; Bouwens et al., 2015; Oesch et al., 2018). In particular, lensing has enabled us to probe the faintest galaxies (Smit et al., 2014; Bouwens et al., 2017; Vanzella et al., 2018), that are likely the main responsible for the reionisation and metal enrichment of the intergalactic medium (Barkana & Loeb, 2001; Ciardi & Ferrara, 2005; Bromm & Yoshida, 2011; Pallottini et al., 2014a; Greig & Mesinger, 2017; Dayal & Ferrara, 2018; Maiolino & Mannucci, 2019).
However, to understand the properties of the ISM of such objects, spectral information is needed. In particular, far infrared (FIR) lines can give a wealth of diagnostics on the thermo-dynamical state of the gas and on the interstellar radiation field (ISRF). As these lines are the main coolants of the ISM (Dalgarno & McCray, 1972; Wolfire et al., 2003), they can be used to trace feedback processes responsible for the evolution of these systems. Additionally, since FIR lines are emitted by ions with low () and high () ionisation potential, their simultaneous detection can constrain the intensity and shape of the IRSF. Finally, detection of CO rotational transitions would help us to constrain the physical properties of molecular clouds (Solomon & Vanden Bout, 2005; Carilli & Walter, 2013), and thus understanding the processes of star formation in galaxies at the EoR.
The advent of the Atacama Large Millimeter/Submillmeter Array (ALMA) has made it possible to access FIR lines from “normal” star forming galaxies () in the EoR. In particular [C ] at , being typically the strongest FIR line (Stacey et al., 1991), is now routinely observed at in both Lyman Alpha Emitters (LAE, Pentericci et al., 2016; Bradac et al., 2017; Matthee et al., 2017; Carniani et al., 2018b; Harikane et al., 2018) and Lyman Break Galaxies (LBG, Maiolino et al., 2015; Willott et al., 2015; Capak et al., 2015; Knudsen et al., 2016; Carniani et al., 2018a). Additionally, [C ] follow-up observations have enabled us to study the galaxy kinematics (Jones et al., 2017; Smit et al., 2018), albeit such observations have not yet the level of maturity as those concentrating on intermediate () redshift (e.g. De Breuck et al., 2014; Leung et al., 2019). Low surface brightness gas outside the target galaxy is possibly a tracer of outflows: probing such material would help us to constrain the feedback mechanism driving the evolution of EoR galaxies. However, so far only statistical evidence of its presence is currently available (Gallerani et al., 2018; Fujimoto et al., 2019). The presence of [O ] at has been revealed in various observations (Inoue et al., 2016; Laporte et al., 2017; Hashimoto et al., 2018; Tamura et al., 2018); in a few cases both [O ] and [C ] have been simultaneously detected (Carniani et al., 2017; Hashimoto et al., 2018), thus hindering the possibility to constrain the ISRF. Regarding the detection of molecular lines, so far CO has been observed only in one normal star forming galaxy via a serendipitous detection (D’Odorico et al., 2018; Feruglio et al., 2018). Summarising, while a large progress has been made with respect to the first ALMA observation cycles, we currently do not have a complete picture of the FIR properties of these galaxies. It is still unclear whether the local relation between [C ] and star formation rate (De Looze et al., 2014; Herrera-Camus et al., 2015) is fulfilled by high redshift galaxies and which are the physical mechanisms responsible for its larger dispersion w.r.t. the local one (Carniani et al., 2018a). Finally, a convincing explanation of the spectral shifts and spatial offsets between different lines and/or UV continuum that are often observed in these objects is still missing (Capak et al., 2015; Carniani et al., 2017).
To address such issues, on the theoretical side, models of FIR emission from galaxies in the EoR have been developed; these models account for the typically lower metallicity of these systems, higher gas turbulence, and include the suppression of FIR emission by the CMB in low density gas (Vallini et al., 2013; Olsen et al., 2015; Vallini et al., 2015, 2018; Popping et al., 2019). Such models account for the observed ISM and ISRF properties of these objects by post-processing numerical hydrodynamical simulations aimed at describing the formation and evolution of high-redshift galaxies (see Olsen et al., 2018, for an extended discussion).
Cosmological simulations – and in particular zoom-in simulations – have been used in order to study such galaxies. Most works concentrate on the relative importance of different kinds of feedback (e.g. SN, winds from massive stars, radiation pressure) in shaping early galaxy evolution (Agertz & Kravtsov, 2015; Pallottini et al., 2017a; Hopkins et al., 2018b), the chemical evolution of these primeval systems (Maio et al., 2016; Smith et al., 2017; Pallottini et al., 2017b; Lupi et al., 2018; Capelo et al., 2018), the effect of radiation from local sources, the ISM ionisation state, and the consequences for the reionisation process (Katz et al., 2017; Trebitsch et al., 2017; Rosdahl et al., 2018; Hopkins et al., 2018a).
In the past few years we have developed serra, a set of zoom-in simulations of LBGs in the EoR. Starting with Pallottini et al. (2017a), we zoomed-in on the structure of high-z galaxies by studying the formation of few galactic systems and following their evolution down to tens of parsec scales. Then, in Pallottini et al. (2017b), we have analysed the impact of chemistry on the ISM by including thermo-chemical networks to follow the formation of , that ultimately led to the formation of stars. Complementing this numerical simulations with both line (Vallini et al., 2015, 2018; Behrens et al., 2019, [C ], CO, Ly) and continuum (Behrens et al., 2018, UV, IR) emission, we have been able to fairly compare our models with high-redshift observations. However, previous simulation were were lacking a consistent modelling of photoevaporation effects due to the ISRF, that can affect the emission properties of the FIR lines (Vallini et al., 2017) and the evolution of molecular clouds (Decataldo et al., 2017).
With the aim of further improving our models, in the present work we include on-the-fly radiative transfer in our hydrodynamical simulations. By also including all the main sources of feedback (radiative, mechanical, chemical), we are able to pinpoint the origin of the deviation from the [C ]-SFR relation that is observed for galaxies in the EoR. Our numerical model is presented in Sec. 2. An overview of the physical properties of our galaxy sample is given in Sec. 3. The FIR emission properties ([C ], [O ], [N ]) are covered in Sec. 4, while Sec. 5 focuses on the [C ]-SFR relation. Conclusions are given in Sec. 6.
2 Numerical simulations
Our simulation suite serra111Greenhouse in Italian. is focused on zooming-in on galaxies in the EoR. In this work, we present “Freesia”, a prototypical LBG galaxy that is hosted by a dark matter (DM) halo at . With respect to previous works (Pallottini et al., 2017a, b), here we explore the effect of local sources of radiation.
Gas and DM evolution is simulated with a customised version of the Adaptive Mesh Refinement (AMR) code ramses222https://bitbucket.org/rteyssie/ramses (Teyssier, 2002). In ramses, gas is tracked with a second-order Godunov scheme and particles evolution is computed with a particle-mesh solver (see also Guillet & Teyssier, 2011, for the gravity solver). Radiation coupling to hydrodynamics is performed with ramses-rt (Rosdahl et al., 2013), that solves photons advection within a momentum-based framework with the closure given by setting a M1 condition for the Eddington tensor (Aubert & Teyssier, 2008). Coupling between gas and photons is handled by implementing a non-equilibrium chemical network generated with krome333https://bitbucket.org/tgrassi/krome (Grassi et al., 2014). Metal ion abundances and emission lines are calculated in post-processing, by interpolating grids of models obtained from the photo-ionisation code cloudy V17444https://www.nublado.org (Ferland et al., 2017). The modelling for gas, radiation, stars and line emission is described in Sec.s 2.1, 2.3, 2.2, and 2.4 respectively.
Set-up
We generate cosmological initial conditions (IC)555We assume cosmological parameters compatible with Planck results: CDM model with total matter, vacuum and baryonic densities in units of the critical density , , , Hubble constant with , spectral index , (Planck Collaboration et al., 2014). at with music (Hahn & Abel, 2011). The cosmological volume is , and the base grid is resolved with a mass per gas resolution element. The Lagrangian volume of the target halo has a linear size of and is progressively refined by 3 concentric layers with increasing mass resolution, reaching a gas mass of around the target halo. In this zoom-in region, we allow for 6 additional level of refinement by adopting a Lagrangian-like criterion. This enables us to reach scales of at in the densest regions, i.e. the most refined cells have mass and size typical of Galactic molecular clouds (MC, e.g. Federrath & Klessen, 2013). Note that the resolution and IC are the same used in Pallottini et al. (2017a, b) to allow a fair comparison.
2.1 Hydrodynamics
Chemical network
As in Pallottini et al. (2017b), we implement a non-equilibrium chemical network by using krome (Grassi et al., 2014). The selected network includes H, H+, H-, He, He+, He++, H2, H and electrons. The network follows a total of 48 reactions666The reactions, their rates, and corresponding references are listed in App. B of (Bovino et al., 2016): we use reactions from 1 to 31 and 53, 54, from 58 to 61, and from P1 to P9; the rates are reported in Tab. B.1, Tab. B.2, and Tab. 2 of Bovino et al. (2016), respectively., including photo-chemistry, dust processes and cosmic ray-induced reactions (see also Bovino et al., 2016, for the original implementation). Individual ICs for the various species and ions are computed accounting for the chemistry in a primordial Universe (Galli & Palla, 1998).
Metals and dust
Metallicity () is tracked as the sum of heavy elements, and we assume solar abundance ratios of the different metal species (Asplund et al., 2009). Dust evolution is not explicitly tracked during simulation. We make the assumption that the dust-to-gas mass ratio scales with metallicity, i.e. , where for the Milky Way (MW) (e.g. Hirashita & Ferrara, 2002). While in principle it is possible to incorporate the evolution of dust grains in galaxy formation simulations (e.g. Grassi et al., 2017; McKinnon et al., 2018, see also Asano et al. 2013; De Rossi & Bromm 2017 for semi-analytic models), this would bias the following comparison with Pallottini et al. (2017b) and will be explored in the future. The grain size distribution is important when modelling light extinction, and it is detailed in Sec. 2.2 (see in particular Fig. 2).
Dust provides a formation channel for molecular hydrogen: the formation rate of on dust grains is approximated following Jura (1975):
| (1) |
where and are the total and Hydrogen gas densities, respectively. We note that for the dust channel is dominant with respect to gas-phase formation.
We adopt an initial metallicity floor since at our resolution does not allow us to reach a density high enough for efficient formation in the pristine gas of mini-halos, and consequently recover the formation of first stars (e.g. O’Shea et al., 2015; Smith et al., 2018). Such floor only marginally affects the gas cooling time and it is compatible with the metallicity of diffuse enriched IGM in cosmological metal enrichment simulations (e.g. Pallottini et al., 2014a; Maio & Tescari, 2015; Jaacks et al., 2018).
To summarise, metals and dust are treated as passive scalars and we allow for metal enrichment by supernova (SN) explosions and by winds from massive stars (see Sec. 2.3).
Gas thermo-dynamics
We model both the evolution of thermal and turbulent energy content of the gas.
The thermal energy is evolved by the thermo-chemical framework set with krome (see Pallottini et al., 2017b, for details). Note that photo-chemical reaction rates in each gas cell depend on the local amount of radiation and its energy distribution (see Sec. 2.2). Since metal species are not followed individually, we use the equilibrium metal line cooling function calculated via cloudy (Ferland et al., 2013) with a Haardt & Madau (2012) UV background. Following cooling from individual metal species can change the thermodynamics of the low density ISM, but does not appreciably affect the star forming regions, as shown in Capelo et al. (2018, see also ). While such change in the thermodynamical state of the gas can be important to correctly compute emission lines, we recall that in the present work this is accounted for in post-processing (Sec. 2.4). Dust cooling is not explicitly included, however we note that it gives only a minor contribution to the gas temperature for (e.g. Bovino et al., 2016, in particular see their Fig. 3). We consider the contribution of cosmic microwave background (CMB), that effectively sets a temperature floor for the gas.
We model the turbulent energy content of the gas similarly to Agertz & Kravtsov (2015) (see also Pallottini et al., 2017a): turbulent (or non-thermal) energy density is injected in the gas by SN, winds and radiation pressure, and it is dissipated as (Teyssier et al., 2013, see eq. 2)
| (2) |
where is the dissipation time scale, which can be written as in Mac Low (1999)
| (3) |
where is the turbulent velocity dispersion. Note that we do not explicitly include a source term due to shear (see Maier et al., 2009; Scannapieco & Brüggen, 2010; Iapichino et al., 2017, for more refined turbulence models).
2.2 Radiation
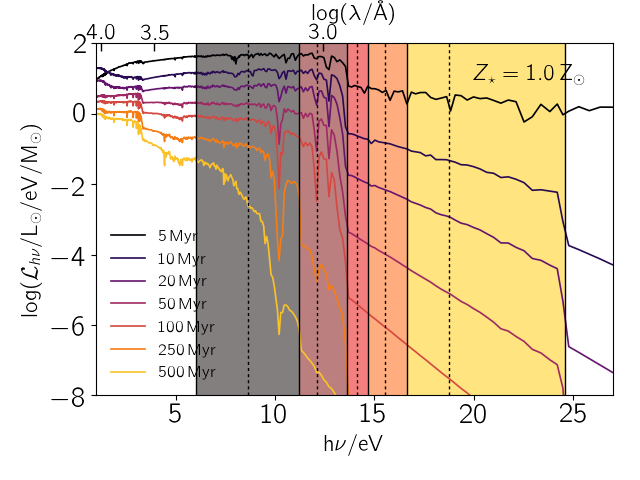
In ramses-rt, photons are treated as a fluid that is spatially tracked by sharing the same AMR structure of the gas. Photons are separated in different energy bins, each one tracking an independent “fluid”.
For the present work we select 5 photon bins to cover both the energy range of the Galactic UV ISRF (Black, 1987; Draine, 1978) adopted in Pallottini et al. (2017b) and H ionising radiation777Photo-ionisation of He and He+ is not included, as the stellar SED are typically not hard enough to produce such photons; He and He+ ionisation is only due to collision in the simulation.. Fig. 1 shows the stellar energy distribution (SED) per unit mass and unit energy for a stellar population at different age (see Sec. 2.3 for details on the assumptions). The first two low energy bins cover the Habing (1968) band888In this paper, the Habing flux is indicated in unit of , the MW value. , which is fundamental in regulating the temperature of the ISM and photo-dissociation regions (PDR). The second bin included in the Habing band is specific for the Lyman-Werner radiation (), which photo-dissociates via the two-step Solomon process (Stecher & Williams, 1967). The last three bins cover the H-ionizing photons up to the first ionisation level of He (). For H-ionizing photons, the energy width is chosen such that the bins have the same number of photons when the SED is averaged on a fiducial stellar population. Our fiducial stellar population has an age and : these stars are the main sources of the ISRF, since such young stars dominate the spectrum of a galaxy with an exponentially rising SFR, as expected for Freesia (Pallottini et al., 2017a, b). To calculate the SED-averaged quantities, we fix the SED to the fiducial one. Note that using three energy bins for H ionisation allows us to reasonably capture the temperature evolution of regions, since photo-ionisation coupling with the gas is computed using the mean energy within each bin.
In ramses the time-step is determined by the Courant condition (Courant et al., 1928), i.e. , with being the gas velocity; taking of the order of the rotational velocity of the galaxy, this yields . ramses-rt adopts an explicit scheme for the time evolution of radiation. Since hydrodynamics and radiation are coupled, it follows that the time-step of the simulation is determined by the minimum between the sound and light crossing time. To limit the computational load, we consider the reduced speed of light approximation to propagate wave-fronts (Gnedin & Abel, 2001), adopting . With such prescription, we expect . Using a reduced speed of light approach yields artefacts when propagating light fronts very far from the sources, e.g. in IGM reionisation studies999Note that a more correct treatment on large scales is possible with a variable speed of light approach (Katz et al., 2017).; however, it well captures the radiation transfer in the ISM/CGM of galaxies (see Deparis et al., 2019, for a detailed study of the impact of a reduced speed of light), as such it is well suited for the present work.
Coupling with gas and dust
In the original implementation of ramses-rt, the thermo-chemical time step is performed simultaneously with the radiation propagation and absorption of photons by gas and dust. Such coupled step is sub-cycled in order to ensure simultaneous convergence for the absorbed photons, final ionisation state, and gas temperatures. This scheme is similar to the one adopted by Nickerson et al. (2018), which includes formation in ramses-rt, albeit and are not explicitly followed.
Here we split the convergence steps: similarly to ramses-rt the absorption of photons is sub-cycled; for each of these sub-cycles, we obtain the ionisation state and gas temperatures with krome, that adaptively solves the thermo-chemical time evolution assuming a constant impinging flux.
For the gas absorption, photon cross sections are the same ones used in the chemical network (see Sec. 2.1). For dust we assume a MW-like grain composition from Weingartner & Draine (2001). Both for gas and dust, the cross sections are used to pre-compute the -th cross section in the photon energy bin as
| (4) |
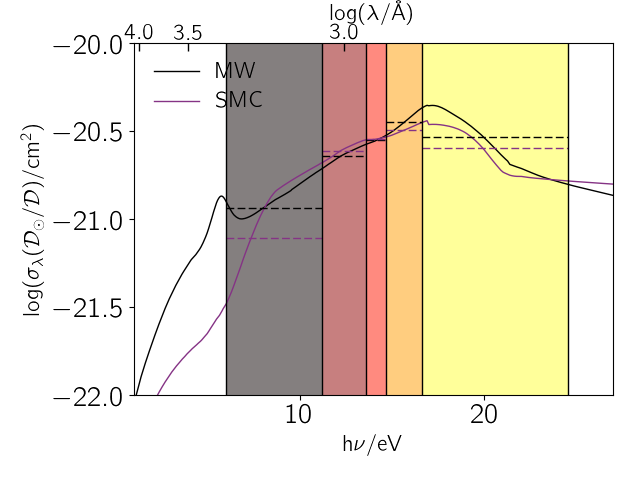
i.e. flux-averaged cross sections, with a weight given by the selected impinging SED . In Fig. 2 we plot the dust absorption cross section () per unit of for both the MW and Small Magellanic Cloud (SMC) -like dust composition, as a function of photon energy (). For both dust types, the are overplotted with dashed lines. The difference in absorption between MW- and SMC-like is , except in the band, where the difference is about .
The analysis of current data seems to favour a MW-like distribution for galaxies. Behrens et al. (2018) manage to explain the observation by Laporte et al. (2017) with a low amount of MW-like dust, that leads to a warm FIR SED. However, the situation is still unclear. De Rossi & Bromm (2017) analyses the role of silicate rich dust, that is expected from a Pop III dominated enrichment: the work shows that a warmer FIR SED can naturally arise because of the emission properties of silicates, that typically emit at higher wavelength with respect to the carbonaceous grains. Further, in De Rossi et al. (2018) it is shown that a combination of silicate and small amount of carbonaceous grains can reproduce the SED observed in Haro 11, a local low-metallicity starburst, thought to be an analogue of high-z galaxies: this entails that assuming a simplified dust models can possibly modify the properties inferred from high-z observations (cfr. Behrens et al., 2018). While dust composition (silicate vs carbonaceous grains) does change the FIR emission properties, in the present work dust is considered only with respect to its absorption properties, that are mainly dependent on the grain size distribution which is assumed to be time-independent (see Sec. 2.1). The analysis of the possible modification to the FIR emission due to a different dust composition is left for a future work.
Summarizing, while a different assumption on the dust distribution can in principle heavily affect the observed SED, it should produce only minor differences in the adopted model, since the only energy bin where is different in the two cases is responsible for neither dissociation nor H ionisation. Finally, the self-shielding of from photo-dissociation is accounted for by using the Richings et al. (2014) prescription, given the column density, temperature and turbulence (cfr. with Wolcott-Green et al., 2011), as detailed in Pallottini et al. (2017b).
While our scheme is different with respect to the one presented in Rosdahl et al. (2013) and Nickerson et al. (2018), the overall results are consistent; detailed tests of our adopted scheme are found in the Appendix of Decataldo et al., in prep. (2019), using PDR (Röllig et al., 2007; Nickerson et al., 2018) and H region (Iliev et al., 2009) benchmarks.
2.3 Stars
Formation
As in Pallottini et al. (2017b), stars form according to a Kennicutt-Schmidt-like relation (Schmidt, 1959; Kennicutt, 1998) that depends on the molecular hydrogen density ():
| (5) |
where is the local star formation rate density, the star formation efficiency, the proton mass, the mean molecular weight, and the free-fall time. The efficiency is set to , by adopting the average value observed for MCs (Murray, 2011, see also Agertz et al. 2013), while computation is included in the non-equilibrium chemical network. As done in Rasera & Teyssier (2006); Dubois & Teyssier (2008); Pallottini et al. (2014a), eq. 5 is solved stochastically at each time step in each cell with size , by forming in each possible event a new star particle with mass , with drawn from a Poisson distribution characterised by mean
| (6) |
For numerical stability, no more than half of the cell mass is allowed to turn into a star particle. Additionally, we allow only star formation events that spawn stellar clusters with mass , i.e. the gas mass resolution of the simulation.
Stellar populations
A single star particle in our simulations can be considered a stellar cluster, with metallicity set equal to that of the parent cell. For the stellar cluster, we assume a Kroupa (2001) initial mass function and, by using starburst99 (Leitherer et al., 1999), we adopt single population stellar evolutionary tracks given by the padova (Bertelli et al., 1994) library, that covers the metallicity range. The stellar tracks are then used to calculate mechanical, chemical, and radiative feedback.
Mechanical and chemical feedback
As in Pallottini et al. (2017a), we account for stellar energy inputs and chemical yields that depend both on metallicity and age of the stellar cluster. Stellar feedback includes SNe, winds from massive stars, and radiation pressure (see also Agertz et al., 2013).
Depending on the kind of feedback, stellar energy input can be both thermal and kinetic, and we account for the dissipation of energy in MCs for SN blastwaves (Ostriker & McKee, 1988) and OB/AGB stellar winds (Weaver et al., 1977), as detailed in Sec. 2.4 and Appendix A of Pallottini et al. (2017a).
In Pallottini et al. (2017a) radiation pressure was implemented by adding a source term to the turbulent (non-thermal) energy. Thus, to avoid double counting of such feedback, we turn off the original radiation pressure coupling of ramses-rt, that is done by following an extra infrared energy bin (see Rosdahl & Teyssier, 2015).
Radiative feedback
Stellar tracks are used to calculate photon production. At each time step, stars act as a source, dumping photons in each energy bin according to their the stellar age and metallicity (Sec. 2.2, in particular Fig. 1), then photons are advected and absorbed in the radiation step, contributing at the same time to the photo-chemistry.
We neglect the cosmic UVB, since the typical ISM densities are sufficiently large to ensure an efficient self-shielding (e.g. Gnedin, 2010). For example, Rahmati et al. (2013) have shown that at the hydrogen ionisation due to the UVB is negligible for , the typical density of diffuse ISM.
We do not explicitly consider production of radiation from recombination, i.e. we assume that recombination photons are absorbed “on the spot”, which is a valid approximation in the optically thick regime (Rosdahl et al., 2013).
Cosmic-ray (CR) processes are not explicitly tracked during the simulation (see however Dubois & Commerçon, 2016; Pfrommer et al., 2017, for possible implementations). Similarly to Pallottini et al. (2017b), we assume a CR hydrogen ionisation rate proportional to the global SFR (Valle et al., 2002) and normalised to the MW value (Webber, 1998, see Ivlev et al. 2015 for the spectral dependence):
| (7) |
Coulomb heating is accounted for by assuming that every CR ionisation releases an energy of eV (see Glassgold et al., 2012, for a more accurate treatment).
2.4 Ions and emission lines
We model metal ion abundances and line emissions using cloudy V17 (Ferland et al., 2017) in post-processing. However, there are some typical challenges and shortcomings to consider when combining emission line codes with simulations (see Olsen et al., 2018, for an overview).
In the following we elaborate on the fact that i) a direct post-processing is computationally unfeasible and not completely consistent, ii) resolution limits our possibility to recover the ionising radiation and internal structure of molecular clouds. We conclude with the description of the solution adopted for the present work.
Consistency of the post-processing
In the simulation, we solve non-equilibrium photo-chemistry by coupling ramses-rt and krome, while cloudy calculations assume photo-ionisation equilibrium. Moreover, cloudy does not account for dynamical effects – such as e.g. shocks – which might affect ion abundances and emission line intensities (cfr. Sutherland & Dopita, 2017; Sutherland et al., 2018). However, the typical PDR code (Röllig et al., 2007) includes – and models more accurately – a larger number of physical processes with respect to the ones typically considered in hydrodynamical simulations with radiative transfer.
One option for the post-processing would consist in using the ISRF resulting from the simulation, and apply a single cloudy model to each cell, given its ISM physical characteristics. On the one hand this is costly: a cloudy model is completed to convergence in CPU hours, depending on the chosen maximum column density. Since each snapshot typically contains cells, the cost in CPU hours to post-process a simulation snapshot would be comparable to the cost of the simulation itself (see also Katz et al., 2019, for a machine learning approach to the problem). On the other hand, it is not guaranteed that such approach would result in a more consistent result. For instance in the hydrodynamical simulation we adopt 5 spectral energy bins, which is a very sparse sampling of the SED when compared to photo-ionisation code calculations, where typically thousands of energy bins are included. Moreover, in a cloudy calculation, a cell is divided in optically thin slices, and the temperature and chemical structure is then calculated as a function of the optical depth. Also, cloudy integrates up to photo-ionisation equilibrium to resolve the internal structure of gas patches (single cells in the simulation). Thus, differences in ion abundances are expected with respect to the adopted krome scheme.
Limits given by the resolution
The resolution and refinement criterion of the hydrodinamical simulation do no guaranteed to resolve dense regions. The column density of in a slab of a dusty gas can be written as (Ferrara et al., in prep., 2019)
| (8a) | |||
| where is the ionisation parameter and | |||
| (8b) | |||
is the column density due to dust where the optical depth to UV photons becomes unity (see Fig. 2). From Pallottini et al. (2017b), we expect the dense ISM of our galaxy to have , , and , because of our resolution. Using these values and eq.s 8, in a typical photo-ionisation region () we obtain a ionisation fraction . A partial ionisation in a single cell implies that all the ionising photons are absorbed, since in ramses-rt photons are advected after the absorption step101010This is equivalent to state that ramses-rt keeps track of the absorbed flux and not the impinging one; the difference between is negligible only for optically thin cells. Thus, it is possible to find young star clusters embedded in dense gas patches that have and .
Moreover, with our resolution we cannot resolve the internal structure of molecular clouds (MC), that are made of clumps and cores of size . Accounting for such contribution is important to correctly compute the emission in high density () regions illuminated by a strong () and ionising () ISRF (Vallini et al., 2017). These ISM regions are expected to be the main contributors of various FIR lines (i.e. [O ]) in galaxies (e.g. Carniani et al., 2017) and their lower analogues (e.g. Cormier et al., 2012).
Adopted model
To summarise, the limited resolution of a typical galaxy simulation does not allow us to recover the physical ion structure/line emission even if we would run a single cloudy model per cell, which 1) is computationally very expensive and 2) the assumptions are not completely consistent with the one adopted in the run. To overcome these problems we have adopted a different strategy, as described below.
Two distinct grids of models are calculated, with and without ionising radiation111111In practical terms, the cloudy models without ionising radiation are calculated by interposing a dust-free obscuring screen with column density of between the source and the gas.. Parameters for each grid are , , and , with the following ranges: , , ; for each parameter the grid spacing is dex, thus there are a total of 1152 individual models per grid. As assumed in the simulation, dust is proportional to metallicity. We use an impinging SED taken from starburst99 (Leitherer et al., 1999) with age , metallicity , and rescaled with . Additionally to the ISRF, we include the CMB at the appropriate redshift. Note that cloudy V17 explicitly considers the CMB suppression (da Cunha et al., 2013; Vallini et al., 2015; Pallottini et al., 2015) and does subtract isotropic backgrounds, similarly to what is done in an ALMA observation (Ferland et al., 2017). For each model we stop each calculation at , after convergence has been reached.
Given , , , and in each cell, the ion abundances and emission lines can be interpolated from the values found in the computed grid. The grid that includes ionising radiation is selected for those gas patches that either have a ionisation parameter or contain young () star clusters. The grid with non ionising radiation is chosen for all the other cells. For lines arising from high-ionisation state (i.e. [O ]), this method allows us to recover both the emission from the diffuse ionised medium and from possibly unresolved dense ionised regions. Changes in the selected threshold do not yield large variations in the [O ] total luminosity, since (i) low entails low flux, while high radiation fields are needed to produce a substantial emission (, see Vallini et al., 2017), (ii) regions containing young star clusters dominate the FIR emission of highly-ionised species (Cormier et al., 2012); this point is detailed in the results, i.e. Sec. 4 (in particular see Fig. 8).
To account for the internal structure of MCs, we use a model similar to Vallini et al. (2015) (see also Vallini et al., 2017, 2018). We assume that a MC with mean density and mach number is characterised by a probability density function (PDF) given by a log-normal distribution (Padoan & Nordlund, 2011):
| (9a) | |||
| with being the logarithmic density | |||
| (9b) | |||
| and where the constants and are given by | |||
| (9c) | |||
| and | |||
| (9d) | |||
| respectively (see also Krumholz & McKee, 2005; Tasker & Tan, 2009; Molina et al., 2012; Federrath & Klessen, 2013). | |||
In each MC, we assume that individual clumps have size given by the Jeans length , and volume . Then, the differential number of clumps of a MC with total volume can be written as
| (10a) | |||
| With our grids of cloudy models we can compute and , i.e. the luminosity per unit area for line and the ion mass fraction per unit volume of ion for each clump. Then the total luminosity and ion mass of the MC can be written as | |||
| (10b) | |||
| and | |||
| (10c) | |||
| respectively. | |||
Case example
It is interesting to discuss a case example of such model for [C ] by looking at the efficiency , i.e. the [C ] luminosity to total gas mass ratio of the MC.
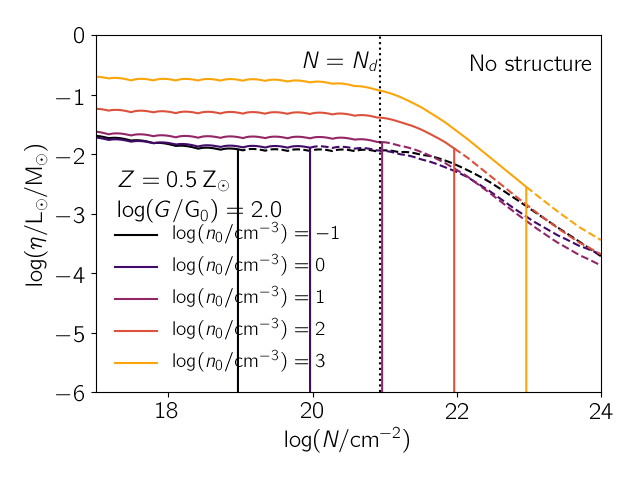
We start by analysing single cloud models – i.e. without internal structure – for different with fixed metallicity () and a non-ionizing radiation field of intensity . The value of as a function of is plotted in the left panel of Fig. 3. At fixed for , roughly , thus is constant, with being the size of the cloud; for , drops in all cases, because becomes constant, and thus .
An important corollary of this result is that, applying these arguments to a simulation with a fixed resolution will likely underestimate [C ] emission for , i.e. in cells with resolution (see eq. 8b)
| (11) |
For typical current state-of-the-art galaxy simulations such value is very demanding, rarely reached, and not compatible with typical refinement criterion selected. Subgrid-models are needed to correctly recover and predict the emission arising from the internal structure of MCs.
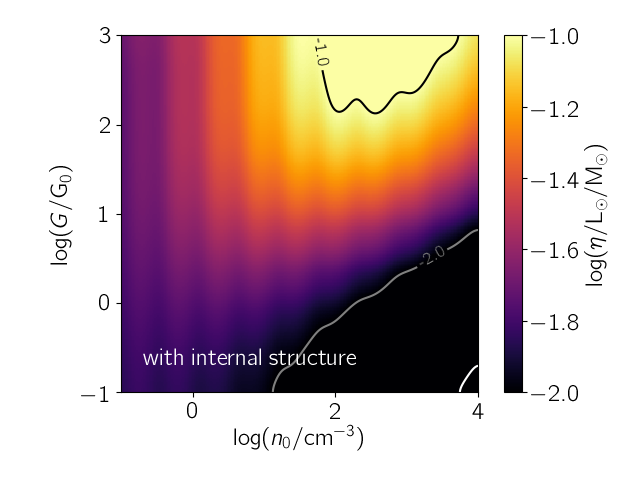
To this aim, we use our model for the internal structure of MC (eq.s 9) and recompute the expected [C ] emission (eq. 10). The result is presented in the right panel of Fig. 3 as a function of and for and , i.e. the typical figures found in our simulated galaxies (Pallottini et al., 2017b; Vallini et al., 2018). A maximum value, , fall approximately at and , while at high density () and low radiation field () the [C ] emission is inefficient (). Note that as at low densities () MCs have little internal structure, the sub-grid model result coincide with single cloud ones.
Adopting such sub-grid model is not completely self-consistent, since cloudy uses an equilibrium approximation, different binning for ISRF, and more physical processes/chemical species. However, it heals some of the problems affecting the calculation of line emission from post-processing of galaxy simulations that cannot spatially resolve regions and the internal structure of MCs.
3 Overview of the results


3.1 Galaxy formation histories
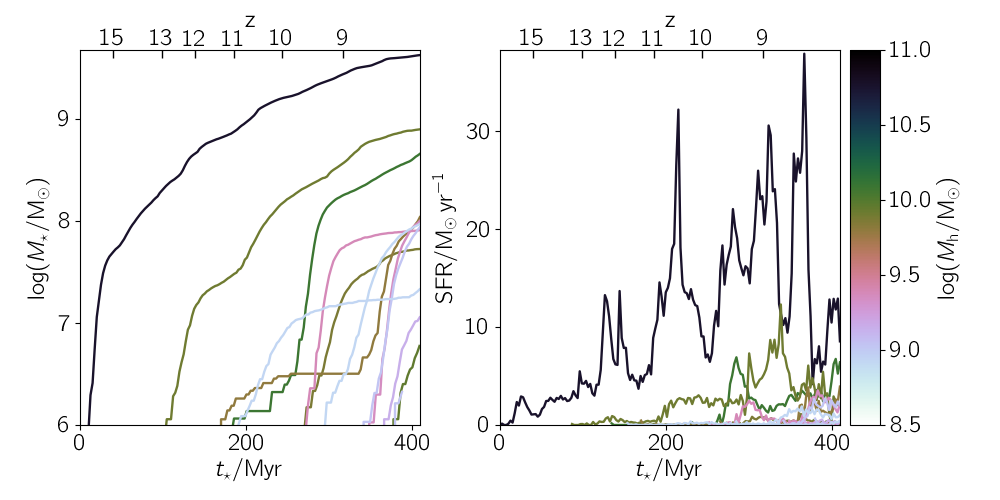
The formation history of the sample of galaxies in our simulation is plotted in Fig. 4, where we show the stellar mass build up () and the star formation history (SFR, left panel) as a function of age () and redshift (, upper axis).
Freesia is the most massive galaxy in the sample. At , it is hosted by a halo of mass ; its age is , it has a stellar mass , and an instantaneous , where the error is given by the variance in the last . The star formation shows variations on timescales of , peaking up to ; overall the evolution is similar to our previous simulation without radiative transfer (Pallottini et al., 2017b), with stellar mass differences of the order , and variations in the SFR mostly due to the stochasticity of the star formation prescription (Sec. 2.3, see eq. 6).
Along with Freesia, there is a sample of eleven more galaxies in the simulated region. They have distance from Freesia that has mean (variance) of (); as they are are at least two virial radii away () at this redshift, we do not label them as satellites. Two of these galaxies are relatively massive, with and , and they are younger () than Freesia. The other nine are smaller (), with lower star formation rates () and they are typically much younger (). Such small galaxies are hosted in dark matter haloes: their relation has a large scatter, that is compatible with results from other theoretical works, which consider larger sample of galaxies (Xu et al., 2016) and zoom-in simulations focusing on smaller galaxies evolved with higher mass resolution (Jeon et al., 2015; Jeon & Bromm, 2019).
As we had already noted in Pallottini et al. (2017b), most of these objects were not present in our previous simulations without radiative transfer, as their star formation was suppressed; this was entailed by our assumption on the spatially uniform ISRF. In the present work, the formation and hence star formation is not suppressed in objects that are located sufficiently far away from Freesia, as a consequence of flux dilution and attenuation.
3.2 Freesia structural properties
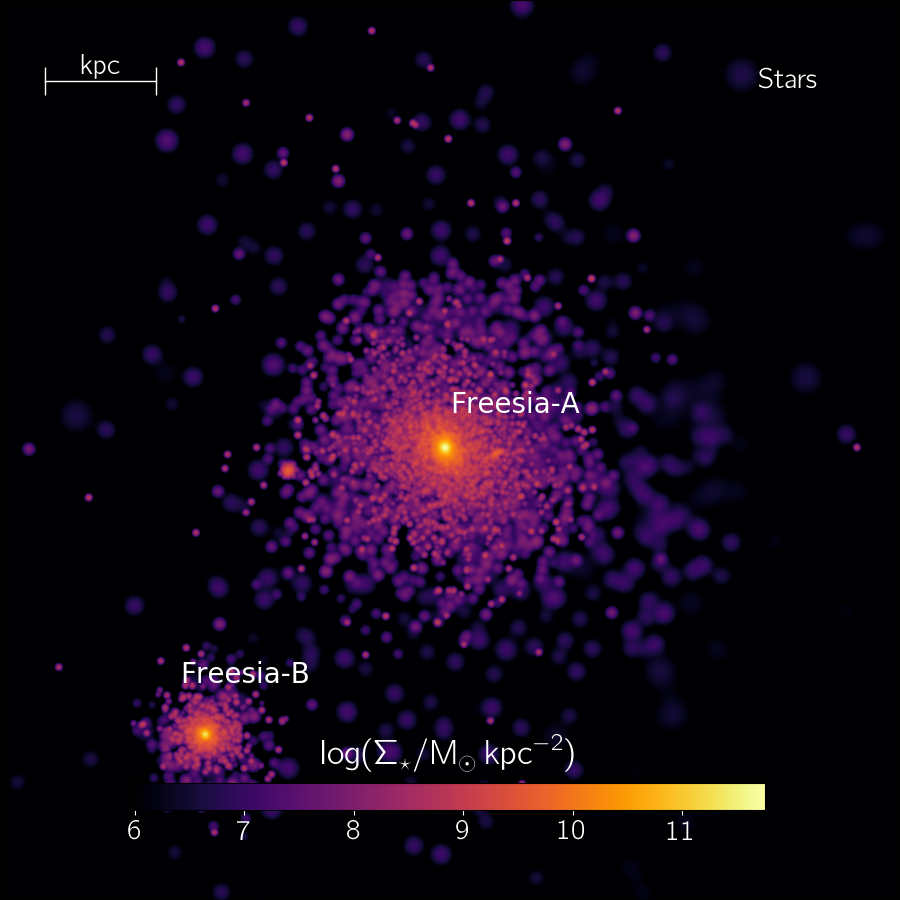
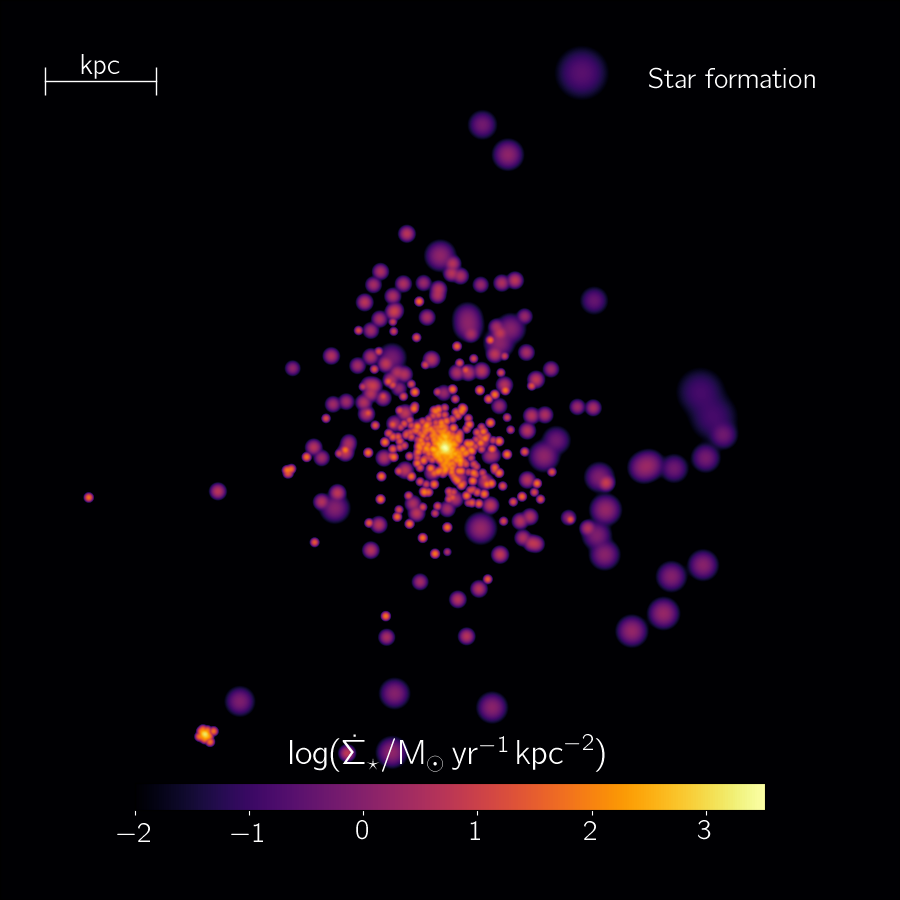
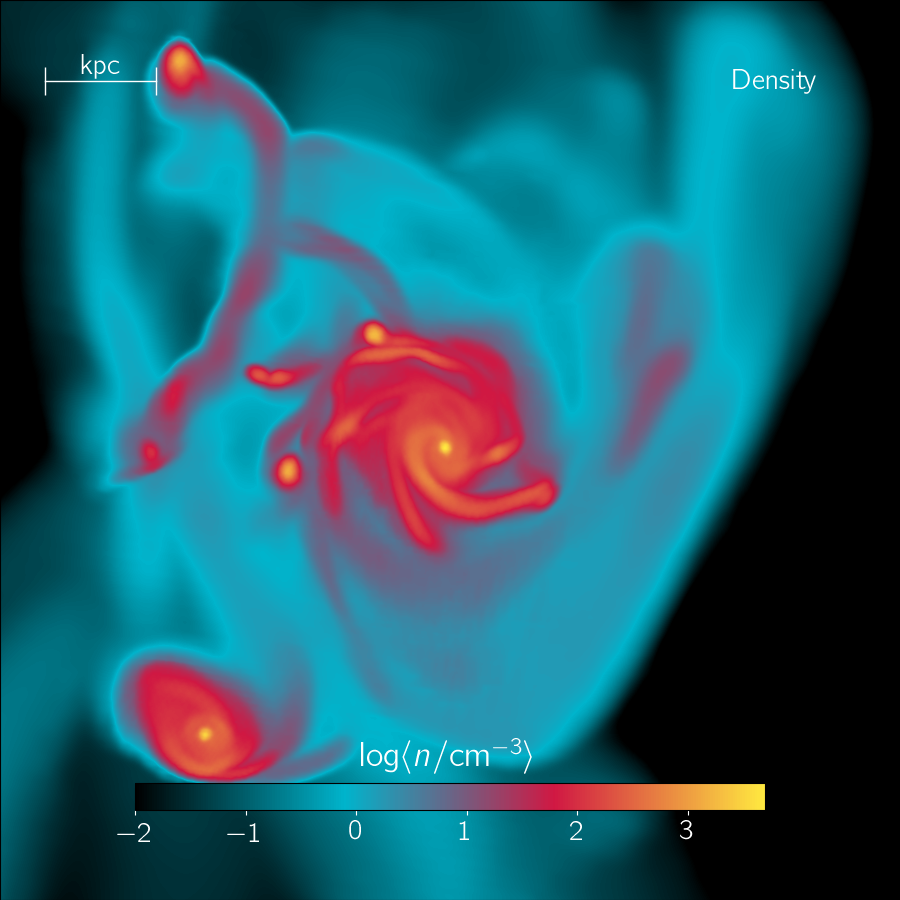
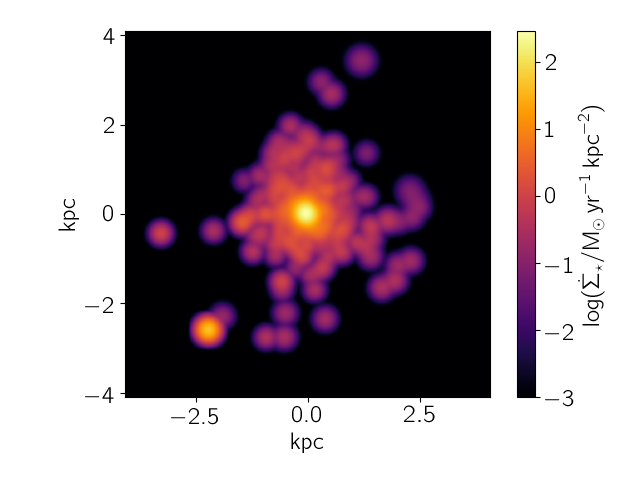
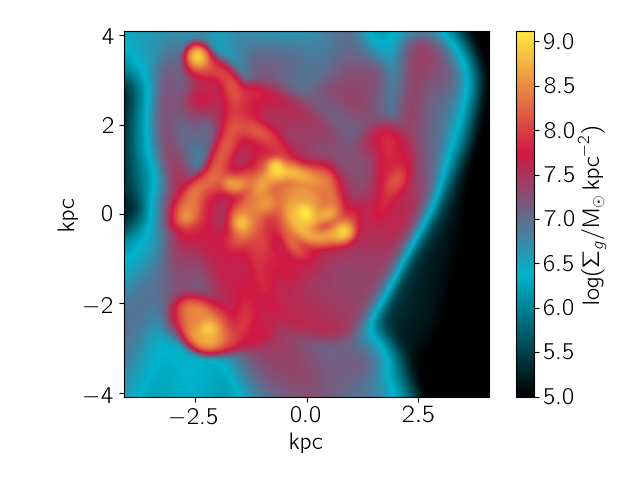
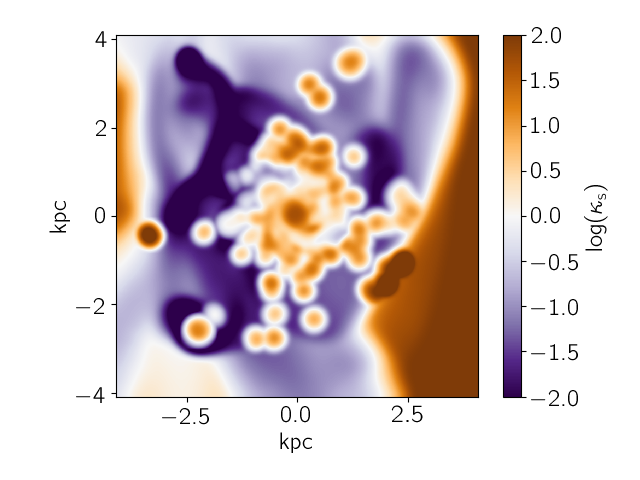
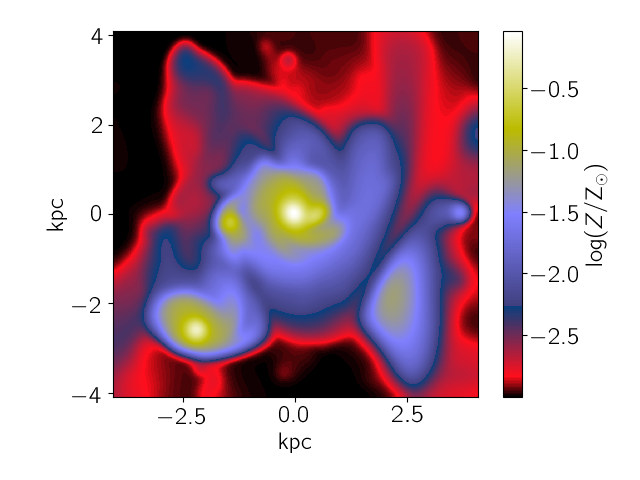
A face-on representation of the key structural properties of Freesia is shown in Fig. 5. Freesia has two stellar components – “A” and “B” – separated by , with Freesia-A containing about of the total stellar mass and dominating the star formation rate (). Both components are highly concentrated, with effective radius of about in both cases; they show stellar surface density peaks with , that are surrounded by a stellar halo with low surface density (), that is likely due to the tidal interaction of the components. Note that some of these stellar clusters have formed recently; while they give a negligible contribution to the total SFR, they can be important in the ionising photon budget.
Looking at the gas density, Freesia-A has a spiral structure with arms characterised by a gas density ; Freesia-B reaches similar densities, but it has a more uniform disk structure, because of its lower mass prevent the development of arms. The only other dense () structure is likely an unstable filament located north-west of Freesia-A. These three components are embedded in a lower density medium (), with very low density () shock-heated patches of gas121212Note that is a very low ISM density, but it is higher than the baryon overdensity that is usually selected to mark the edge of halos in cosmological simulations..
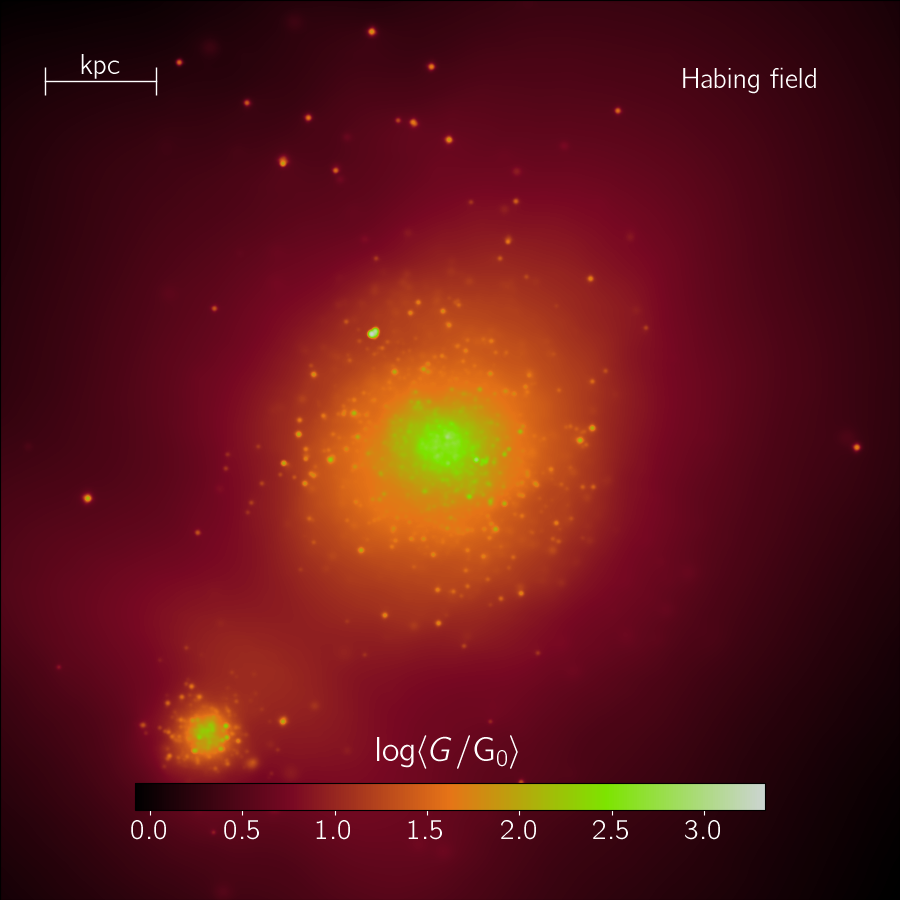
The average131313Average values from the maps are typically quoted in the form . radiation field is i.e. compatible with the assumption in Pallottini et al. (2017b), where ) (see also Behrens et al., 2018). Note that the variance of the radiation field is times the mean, as in the MW (Habing, 1968; Wolfire et al., 2003). In analogy with and peaks, the Habing field has two maxima located at the centre of Freesia-A and Freesia-B and decreases radially from these locations because of flux dilution, as well as gas and dust absorption. While the spatial variance of the Habing field is small, various peaks () are found in correspondence of stellar clusters, particularly in regions of recent star formation; pockets of gas with an enhanced local radiation can give an important contribution to line emission (Sec. 2.4, see Fig. 3).
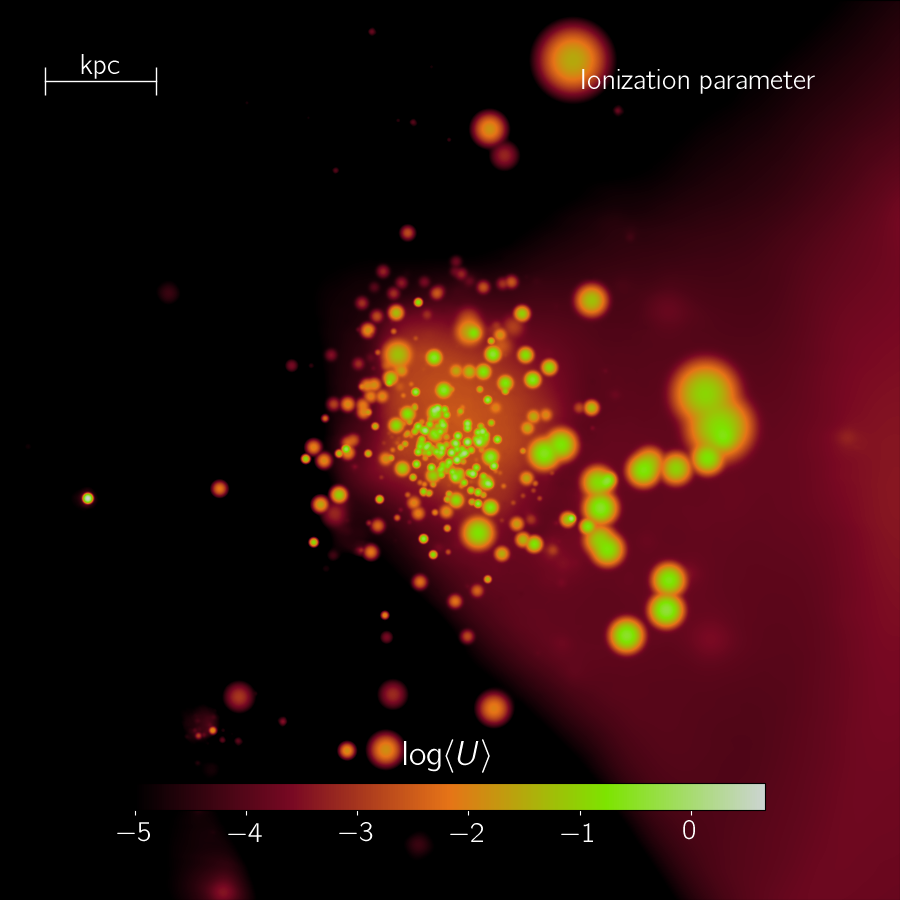
The ionisation field has an asymmetric structure and shows a larger variation, with a mean ; high values () are co-located with recent star formation events, in particular in the region east of Freesia-A, where the gas density is low (). In the same region we can see that there is a trail of ionising photons that is leaving the galaxy with a conical shape.
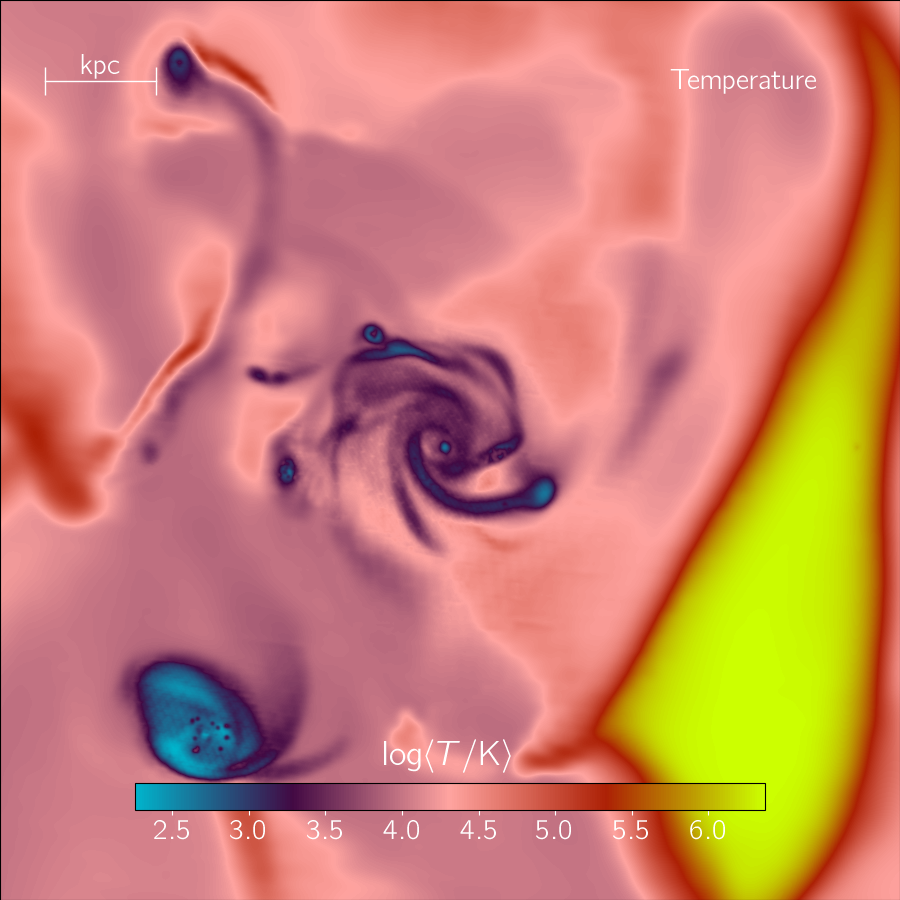
The temperature map shows that the spiral arms of Freesia-A and the dense gas in Freesia-B are cold () structures, blistered with warm () spots, marking the presence of local radiative feedback. Shock heated regions () that reach out from the two stellar components are caused by SN explosions, while the one west of Freesia-A is caused by accretion shocks.
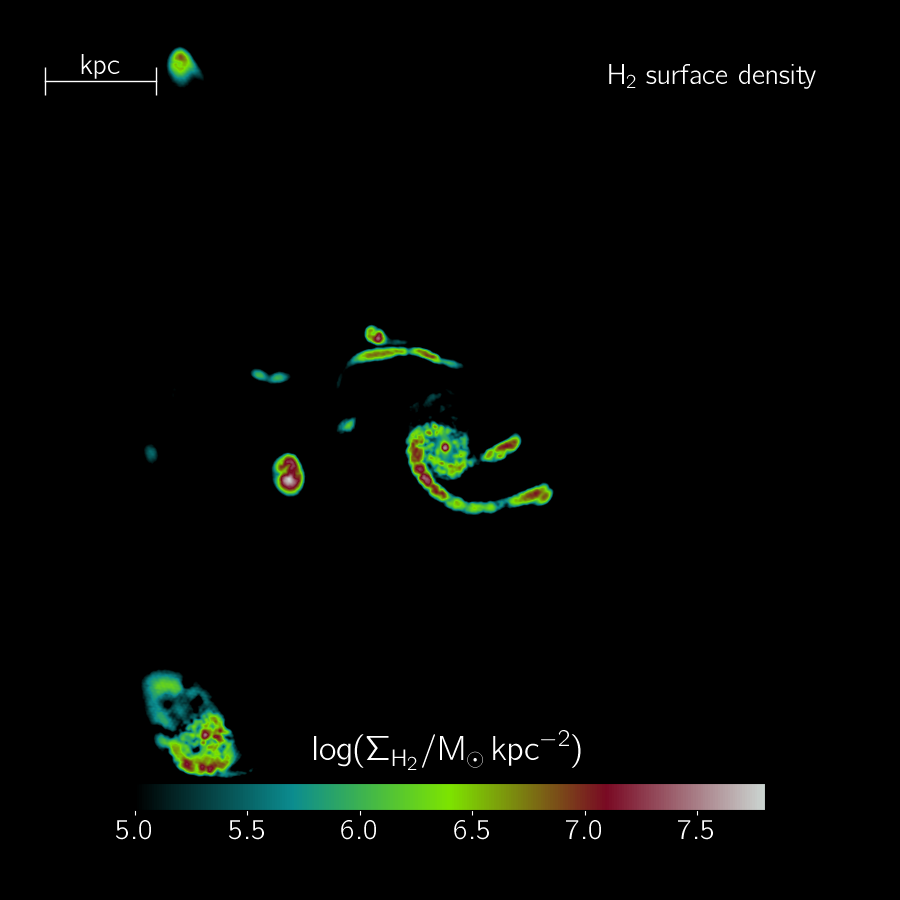
The effect of local radiative feedback is more evident in the molecular and ionised hydrogen maps. The molecular material is concentrated in the spiral arms of Freesia-A and at the location of Freesia-B, with typical surface density peaks with and sizes about 141414See Leung et al., in prep. (2019) for a more complete analysis of individual MC properties found in our serra simulations.. regions also show similar values in the peaks of the distribution, i.e. , but also enclose Freesia with a low surface density halo component. In Freesia-B the correspondence of regions with spots of warm gas and local ionising field () is particularly evident.
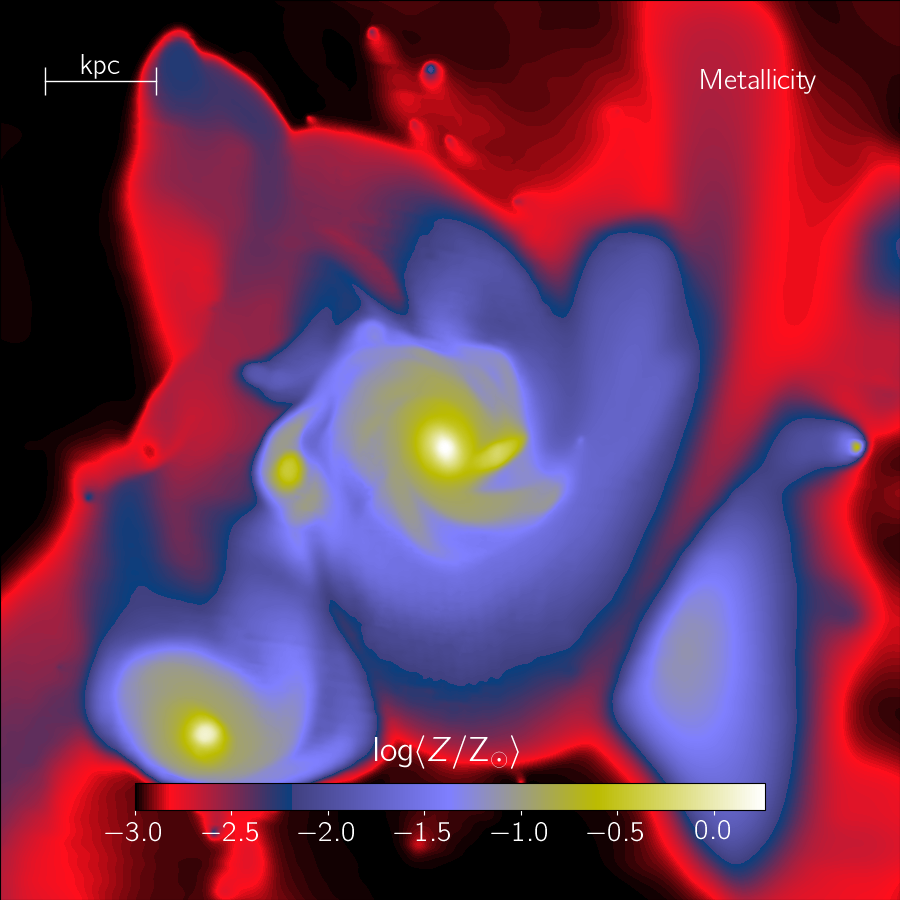
At this stage, Freesia is already mildly enriched, showing a metallicity of in the dense region, with central peaks up to in Freesia-A and Freesia-B. The surrounding gas is enriched at a mean up to from the stellar components. Freesia has a deeper potential well () with respect to the typical metal polluting galaxy (, c.f.r Pallottini et al. 2014a): indeed a halo is needed to have a galaxy with a mean (Jeon et al., 2015, see in particular Fig. 4 therein); thus SN shocks originating from Freesia are less effective in enriching the intergalactic medium, as only the galaxy immediate surroundings can be easily accessed.
3.3 Thermo-chemical structure
To analyse the thermo-chemical structure of the gas we look at the density-temperature phase-diagrams, i.e. mass-weighted probability density functions (PDF) in the - plane. In Fig. 6 we plot the phase-diagrams weighted by the total gas mass, the molecular gas mass, and the ionised component for the material within from Freesia.
Considering the total mass (upper left panel of Fig. 6), we see that of the gas is photoheated (), due to photo-electric heating on dust grains illuminated by the radiation generated by local sources contributing to the Habing field. Lower temperatures can be reached by gas at density , accounting for of the mass budget. The remaining is shock heated () by SN explosions and by accretion. The density has two small peaks around and that are superimposed to a roughly flat distribution. Overall, the total gas phase-diagram is similar to Pallottini et al. (2017b); this is expected since in the former work a uniform ISRF is assumed, and in Freesia we find that the Habing field is rather uniform few away from the stellar component.
The double-peaked nature of the density distribution is due to the presence of the molecular and ionised components, as it is clear from the lower panels of Fig. 6. is concentrated at high density (lower left panel of Fig. 6), with the peak at . The diagram features a prominent peak at and a less pronounced one around . The presence of the latter is linked to the formation of in gas with , i.e. the dust channel is disfavoured with respect to gas phase formation, which is enhanced at . Note that there is a low () amount of molecular hydrogen at even higher temperatures, albeit at lower () densities. This gas is partially molecular and its presence is possible because of shielding from local LW sources. Recall that at this redshift lines fall into the spectral window of SPICA (Spinoglio et al., 2017; Egami et al., 2018), thus in the future it will be possible to test the presence of such relatively high temperature () , as the 0-0 S(1) at and 0-0 S(0) at are in the optimal sensitivity window of the instrument.
is responsible for the low density peak that is seen in the total gas diagram (lower right panel of Fig. 6). The bulk () of ionised gas is centred at and it is photoionised at a temperature . Out of the total , of the gas is in a shock heated state and mostly collisionally ionised. The remaining of the ionised gas has typical densities and is only partially ionised.
The ionisation structure is better appreciated by looking at upper right panel of Fig. 6, that shows the phase-diagram of density vs ionised fraction, i.e. . In Freesia, the ionised fraction decreases with density roughly as , with a dispersion of order of 0.3. The gas is found to be fully ionised () only in low density regions (), while in potentially molecular regions () . Such is likely a spurious result deriving from unresolved high density regions (see Sec.s 2.2 and 2.4).
Radiation gives a non-negligible contribution to the ionised fraction both in high and low density regions. Assuming local thermodynamical equilibrium, the ionisation fraction due to collisions can be written as , where , with and being the collisional ionisation and recombination rate, respectively (see e.g. Dayal et al., 2008; Pallottini et al., 2014b). In Fig. 6 we plot for as a black solid line. is compatible with collisions only when , while for progressively higher density the contributions from radiation becomes dominant, in particular considering that for , that is the typical temperature of the gas.
4 FIR emission properties


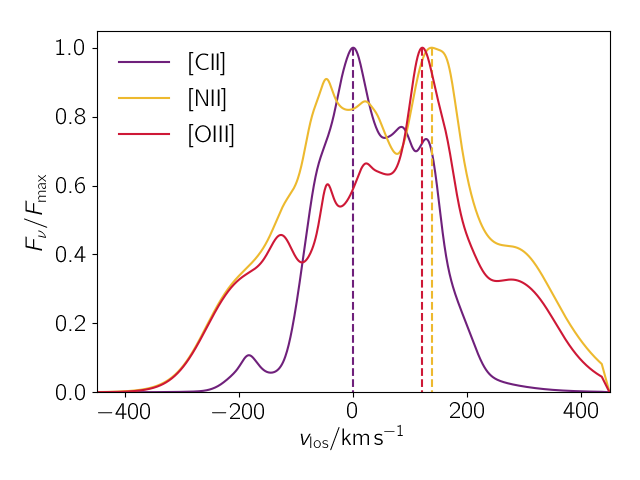
| line | shift | width () | offset | radius | |
|---|---|---|---|---|---|
| [] | [] | [kpc] | [kpc] | ||
| [C ] | - | 93.0 | - | 1.54 | |
| [N ] | 138.1 | 163.0 | 0.52 | 0.50 | |
| [O ] | 121.1 | 163.3 | 0.65 | 0.85 |


In this work we study the following FIR emission lines: [C ] , [N ] , and [O ] , and we analyse the abundance and spatial distribution of their relative ions, (ionisation potential ), (), and ().
4.1 Imaging of the FIR emission and ions
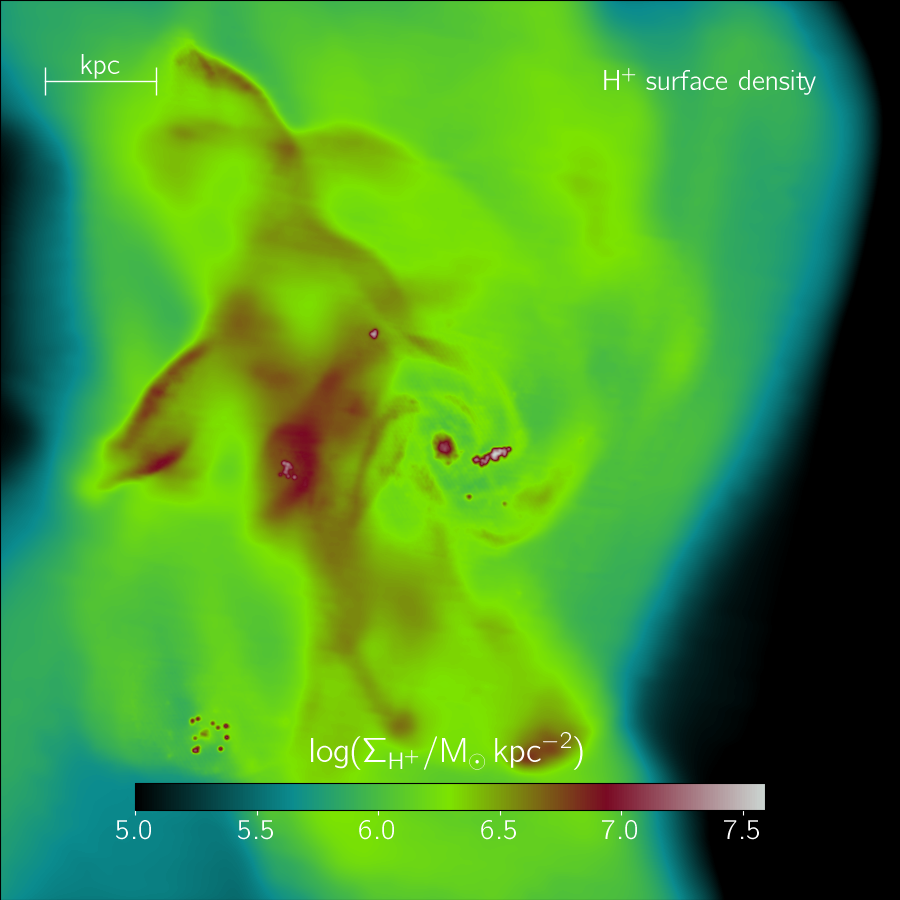
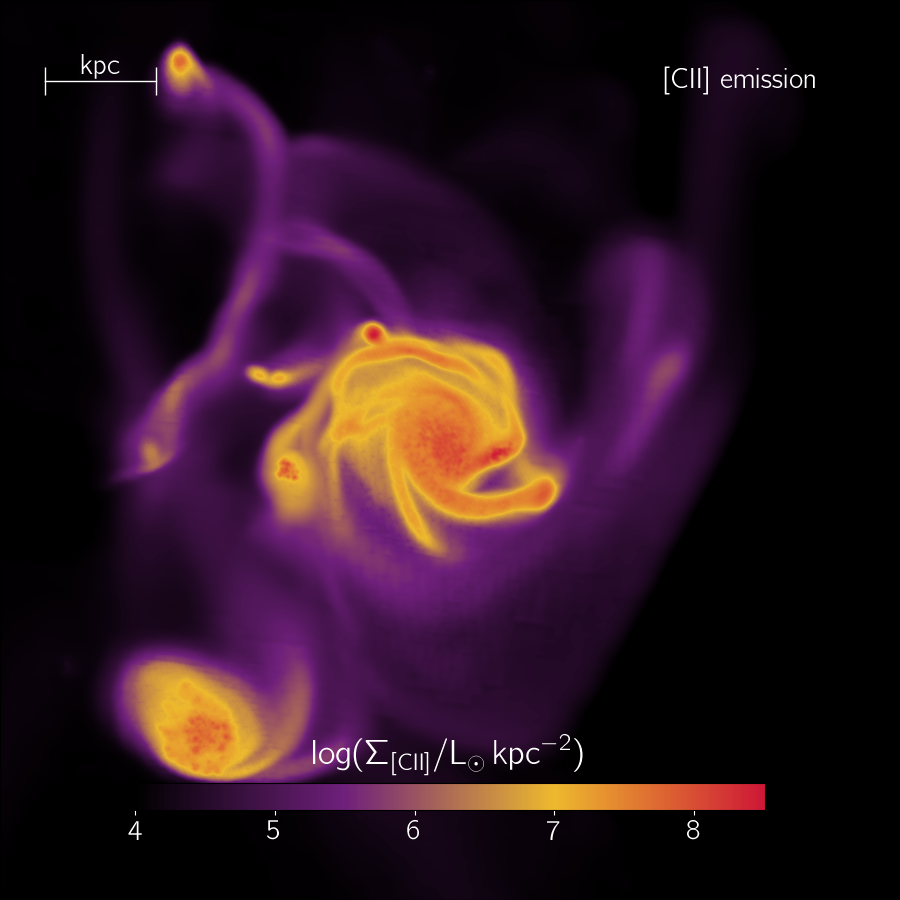
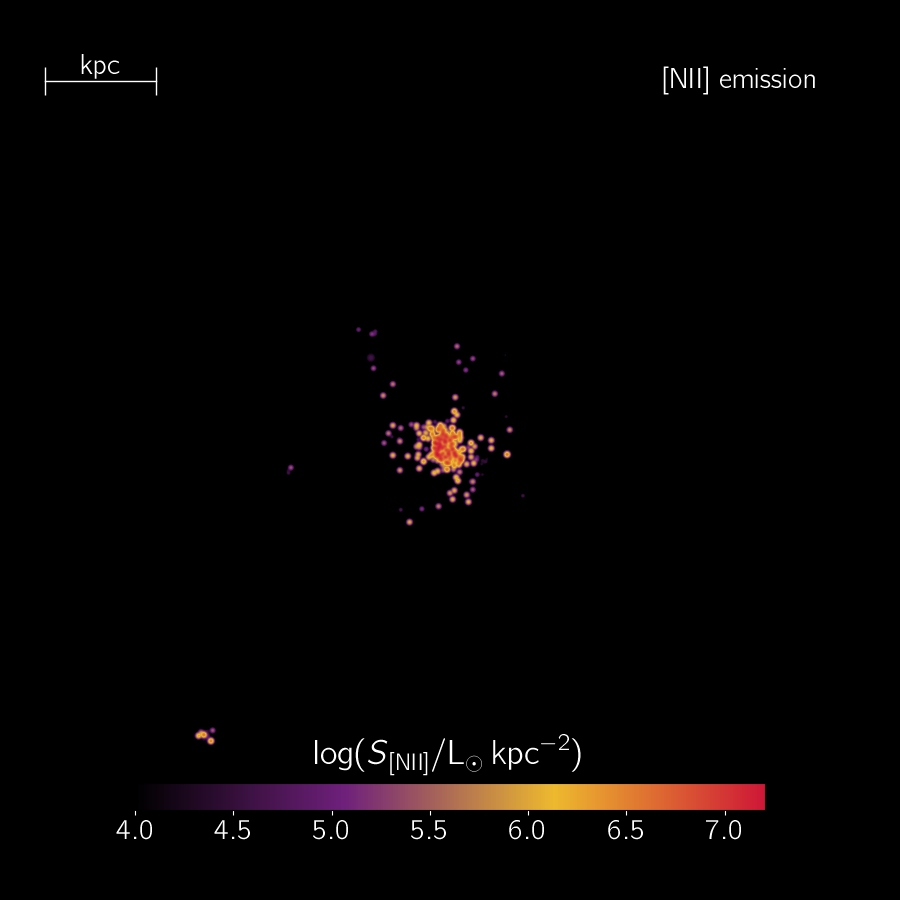
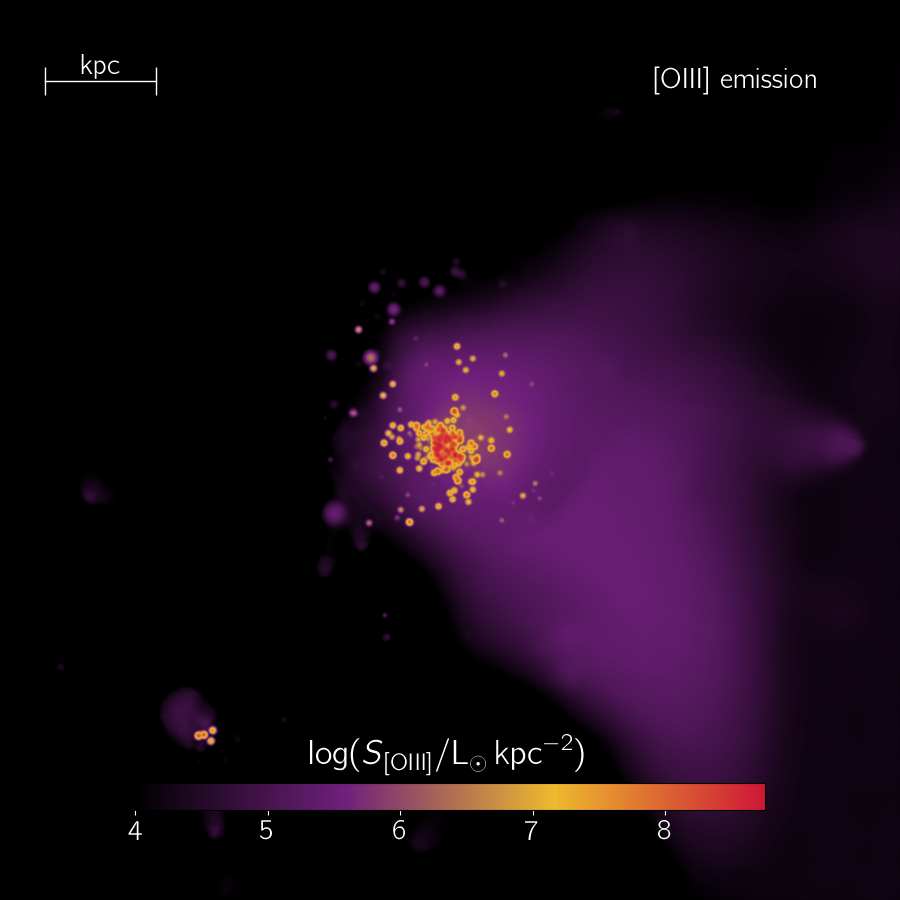
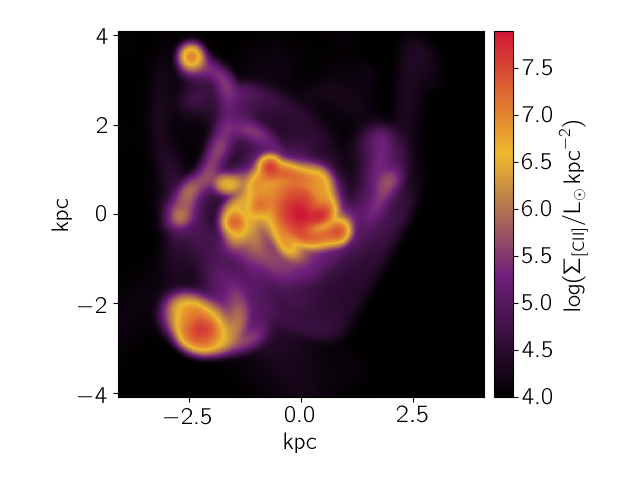
In Fig. 7 we show the emission maps of Freesia in [C ], [N ], and [O ]. As a reference, the properties are summarised in Tab. 1.
The brightest line is [C ], with . The two main peaks () are spread over the Freesia-A and Freesia-B, with extents of the order of . The only other prominent structure is the high density filament () North-West of Freesia, featuring a lower brightness – – due to the lower metal content (, cfr. with Fig. 5). The bright spots are embedded in a faint – – halo that marks the extent of region that has been metal enriched by Freesia. Note that such diffuse halo in Freesia gives only a small contribution to the [C ]: the extension of the emitting region extension is mainly determined by the presence of the two stellar components.
The emission from ions with higher ionisation state has a different morphology than [C ]. Both [N ] and [O ] show are less extended than [C ]. For [N ] and [O ], the luminosity of Freesia-A is a factor larger than Freesia-B, while for [C ] the factor is . Since they trace similar material (see later Fig. 8), the two lines have cospatial emission peaks, located in high density () ionised regions that blister the disk of Freesia and enclose a total size . In particular, the [N ] line has a low luminosity, . This is due to the smaller cooling efficiency with respect to the other lines (Dalgarno & McCray, 1972): the maximum surface brightness is , roughly one order of magnitude smaller than [C ] and [O ]. While the [O ] surface brightness is higher than [C ] (), the smaller emitting region makes its total luminosity lower, i.e. . The [O ] shows a more diffuse halo with surface brightness . However with respect to the [C ] halo the morphology is very different, since the [O ] halo is confined in the east direction, in correspondence of the low ionisation field ().
Along with emission lines, the corresponding ion surface densities (, , and ) are plotted in Fig. 7. [C ] structure follows the ion morphology. is present in both diffuse and molecular material, and – without ionising radiation – we expect (Ferrara et al., in prep., 2019). Since the Habing field is almost constant on these scales, a rough proportionality between the luminosity and the ion abundance is expected. In both Freesia-A and Freesia-B the gas features a flat , that rapidly decreases to in the diffuse halo. As the unstable filament north-west of the galaxy has a lower metal enrichment than the two star forming components, its abundance is similar to that of the halo. and are similarly distributed and trace the ionised high density regions, as for the corresponding lines. In both cases, halos of low surface density material are present (), however the ISRF is not high enough in order for the corresponding lines to be emitted efficiently. Note that the order of magnitude difference in the surface density is mostly due to the difference between the mass abundance of the elements.
4.2 FIR lines as a tracer of the ISM state
Using the phase-diagrams we can analyze the emission structure of the ISM in Freesia. In Fig. 8 we plot the phase-diagrams weighted by the luminosity of [C ] (- plane), [N ] (- plane), and [O ] (- plane).
The [C ] diagram shows that most of the contribution to its emission comes from gas with illuminated by , i.e. dense gas in the two star forming components embedded in the average radiation field; this peak spans roughly an order of magnitude in both axis. Contribution from lower density gas () is present but subdominant (). Note that for a weak field () at low densities (), the contribution to the emission is also suppressed by the CMB (da Cunha et al., 2013; Vallini et al., 2015; Pallottini et al., 2015). Overall these results are consistent with our previous findings (Pallottini et al., 2017a, b), i.e. most of the [C ] emission is associated with material close to the molecular regions. A peak at high density is expected from our benchmark (Sec. 2.4, in particular see Fig. 3), which also shows that [C ] emission is favoured at relatively higher values of the Habing field (). These regions are relatively rare in Freesia, as they are associated with star forming regions, thus in our galaxy the peak contribution comes from regions with a milder radiation field.
Similar distributions are found for [N ] and [O ]. Two types of emitting regions are present: i) a stripe with roughly , which accounts for most of the luminosity of both lines, and ii) a contribution from diffuse ionised gas with and .
In both cases the emission peaks in dense regions. However, some differences are present: the [N ] peak is concentrated at for gas with densities , while [O ] shows a larger range for the ionisation parameter, , and arises from gas with lower densities, . Thus, additionally to the higher typical cooling efficiency, the higher [O ] luminosity with respect to [N ] is also partially due to contribution from gas with , which is more abundant then the gas that dominates the [N ] line emission.
To analyse the spectral hardness of the radiation field, in Fig. 8 we also plot phase-diagram in the - plane weighted by photon number (). Overall, the bulk of the ISRF is relatively soft, with and , and has a trend roughly given by for
The region in the phase-diagram corresponding to high and is characterised by young stellar clusters that have removed the gas from their surrounding, through their radiative and mechanical feedback (see also Fig. 5). This is motivated as follows: before absorption, a typical stellar SED would yield (see Fig. 1); as at most, the density in regions must be , i.e. lower than the original allowing the formation of stars.
Summarising, most of the radiation surrounding Freesia is non ionising, i.e. the escape fraction calculated on a sphere of radius of is of order , in agreement with estimate from observations of lower redshift galaxies with similar brightness (e.g. Bouwens et al., 2016; Grazian et al., 2017) and averaged values of simulated galaxy with similar masses (Xu et al., 2016). However, large variations are expected with different evolutionary stage and radii considered (Trebitsch et al., 2017); a detailed analysis is left for future works.
4.3 Spatial offsets
We have seen that while low () and high () ionisation species have a roughly similar spatial distribution, their corresponding emission structure is very different as a result of the modulation imposed by the IRSF, which is roughly spatially uniform in the Habing band, and very patchy in ionising radiation. This causes a spatial offsets between [C ] and [O ] emitting regions. In Freesia there are two different kinds of spatial offsets. In Freesia-A [C ] is extended and peaks at the edge of the disk, while [O ] is concentrated at the center. This configuration results in a offset for the [C ] and [O ] lines arising from Freesia-A. In Freesia-B [C ] has luminosity , but . While Freesia-B would not be detected in [O ] even with an extremely deep ALMA observation, its [C ] luminosity would move the center of the emission away from Freesia-A; thus a marginally resolved observation of the system would reveal an offset of between [C ] and [O ]. This is similar to what is observed in BDF-3299 (Carniani et al., 2017, in particular see Fig. 4.)
We recall that in BDF-3299 (see Tab. 4 of Carniani et al., 2017), while in Freesia we find . In Freesia, the [O ] emission predominantly comes from gas in Freesia-A; there, . The [O ] emission is limited to regions with an hard radiation field (), while [C ] can excited by the mean UV ISRF () in the diffuse medium surrounding Freesia-A and thus is emitted efficiently also from the material surrounding Freesia-A, yielding a ratio of total luminosity . This difference between Freesia and BDF-3299 can be explained if the latter has a larger ionised region; however it might be due to a different configuration of the system: further investigation is needed to have achieve a full classification.
Interestingly, neither in Freesia nor in the other simulated galaxies we find situations in which , as shown in observations where [O ] is present but [C ] is undetected (Inoue et al., 2016; Laporte et al., 2017). We note that the three simulated galaxies at presented in Katz et al. (2019, see Fig. 11 therein) are also [C ]-dominated with typical values . At present, simulations are apparently unable to reproduce the observed low ratios. This issue requires further study and we leave it for future, more specific analysis.
4.4 Spectral shifts
Spectral shifts between different FIR lines are present in Freesia. To quantify this effect, we build spectra () as a function of the line of sight (l.o.s.) velocity (). Each gas patch along the line of sight gives a contribution corresponding to its luminosity, which is kernel weighted by a Gaussian centred at the peculiar velocity of the gas and with a width that accounts for the thermal and turbulent broadening. Full detail of the model are given in Kohandel et al., in prep. (2019), along with an in-depth analysis of the kinematics of the [C ].
In Fig. 9 we plot the [C ], [N ], and [O ] spectra (see Tab. 1 for reference). The [C ] appears to be more peaked in velocity space, with a line width (second moment of the spectrum) . The [C ] emission comes from both stellar components, with Freesia-A providing a broader turbulent disk component with , while Freesia-B provides a concentrated contribution at , that gives rise to the peak in the total spectrum. This is a rather common situation when multiple, possibly merging, components are present in the same system (Kohandel et al., in prep., 2019). Note that only of the emission comes from high velocity () gas, as most of the emission is concentrated in the dense ISM of the galaxy; only a small fraction possibly due to outflowing material, because of its lower metallicity (Gallerani et al., 2018). The [O ] line is shifted with respect to [C ] by , roughly one third of what is observed for BDF3299 (Carniani et al., 2017) as its emission is dominated by Freesia-A. In Freesia [O ] has a that is larger than [C ], and it additionally features more prominent high velocity wings at , that are due to the diffuse low surface brightness [O ] halo in the West region (see Fig. 7). This possibly makes [O ] a better tracer of outflowing gas. The spectrum of [N ] feature double peaks, due to both the contribution from Freesia-A and Freesia-B, that are almost coincident with the location of [C ] and [O ] peaks in the velocity space. A luminosity ratio [C ]/[N ] is expected also from theoretical works (Vallini et al., 2013). This makes [N ] observations very challenging.
Note that the spatial offsets and spectral shifts typically observed in high- galaxies are between UV/Ly- and [C ]; only in a handful of cases [O ] is also available (Carniani et al., 2017, see Fig. 6.). Such analysis requires additional post-processing work to compute the UV continuum and Ly- radiative transfer, as in e.g. Behrens et al. (2019). This is also deferred to a forthcoming paper (Kohandel et al., in prep., 2019).
5 On the [CII]-SFR relation
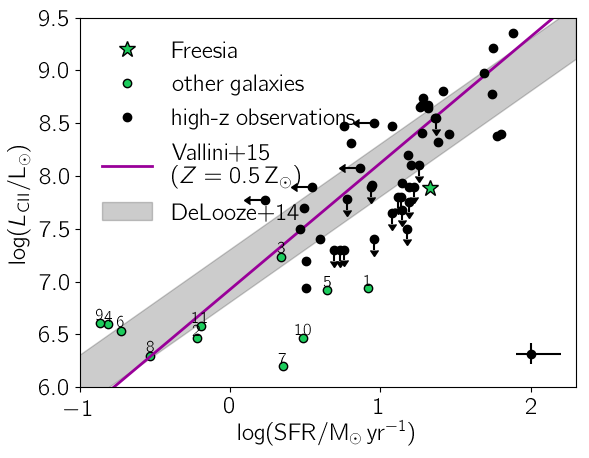
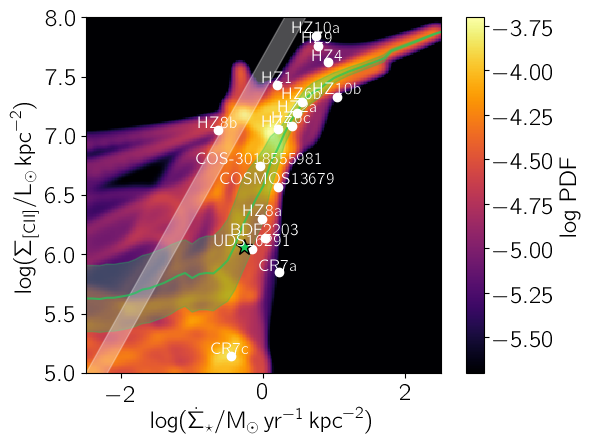
In Fig. 10 we plot the integrated SFR-[C ] relation for Freesia and the other galaxies that are on average within . For our sample of 11 galaxies we find that [C ] is increasing with SFR, however the slope is shallower with respect to the local De Looze et al. (2014) relation: galaxies with lower star formation () lie above or on top the local relation, while as we go to progressively high rates () galaxies fall below the relation. The trend for the simulated galaxies is not clear, as the dispersion is large and the sample is limited.
As noted in Carniani et al. (2018a), this trend is similar to what is observed at : it is unclear whether the local De Looze et al. (2014) relation holds at high redshift because of the low statistical significance of the observed sample, and there is evidence that the dispersion is larger by a factor with respect to the local [C ]-SFR. In particular, Freesia is within from the De Looze et al. (2014) relation, similarly to what is observed in high- galaxies (Carniani et al., 2018a). Low metallicity alone cannot fully explain the tension from the local relation. The mean metallicity of the gas in Freesia and most of the other simulated galaxies is . However, for the Vallini et al. (2015) model is consistent with the De Looze et al. (2014) relation.
Note that at redshift the three simulated galaxies of Katz et al. (2019) have properties that are consistent with the local [C ]-SFR (De Looze et al., 2014). However, Katz et al. (2019) emission lines are computed starting from a library of cloudy models with constant gas temperature, i.e. not computing the temperature structure of the PDR. The temperature is taken from the hydrodynamical simulation and is computed with a simpler network with respect to cloudy or other simulations, e.g. not considering non-equilibrium metal cooling (Capelo et al., 2018). The resulting ion abundances and emission lines may be considerably different.
Instead, in the following Sec.s 5.1 and 5.2, we show that falling below the local [C ]-SFR relation is connected to the galaxy “star-burstiness”, i.e. the evolutionary stage in which the galaxy lies above the Kennicutt-Schmidt relation, therefore experiencing an enhanced stellar feedback. The theoretical background for this argument is worked out in detail in a companion work (Ferrara et al., in prep., 2019).
5.1 Connection with Kennicutt-Schmidt relation
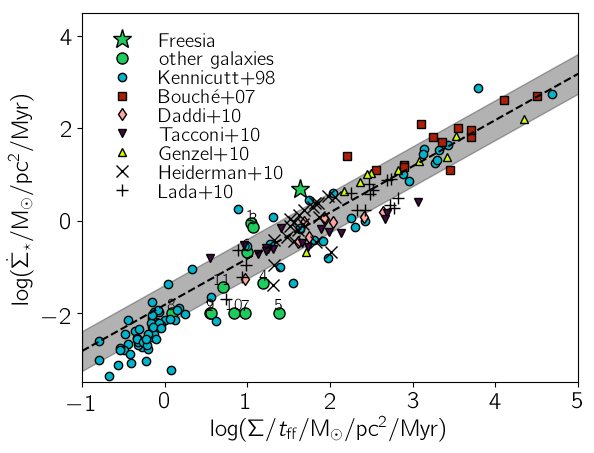
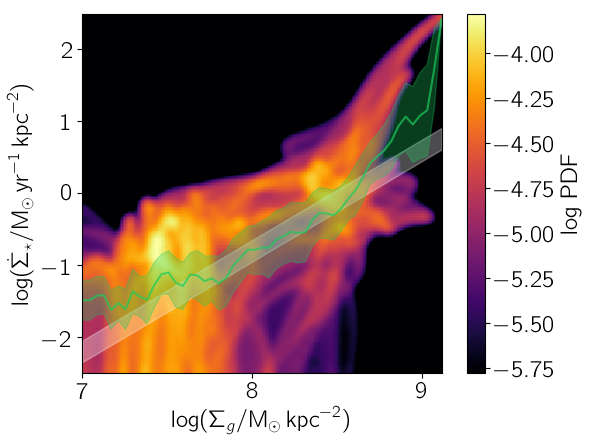
The Kennicutt-Schmidt (KS) relation in our simulated sample is plotted in Fig. 11 (right panel) in the Krumholz et al. (2012) “formulation”, i.e. vs . In this formulation the scatter is lower, and the relation holds for single MCs, local and moderate redshift unresolved galaxies.
Freesia and galaxy 1 are under the De Looze et al. (2014) relation and above the KS151515Recall that Freesia has recently experienced a burst of star formation (Fig. 4), this is the reason why it sits above the relation., while the opposite holds for galaxies 4 and 9, which are over the local [C ]-SFR and below the KS, while galaxies 6 and 8 are consistent with both. This is an indication that the two relations are intimately linked. However galaxies 2, 5, 7, and 10 are below both relations, while 3 is on the De Looze et al. (2014) but above the KS.
5.2 Spatially resolved relations
To clarify the connection between KS relation and [C ]-SFR relation, we analyse their spatially resolved versions, that are generally considered more fundamental in physical terms than the integrated ones (e.g. for [C ] see Herrera-Camus et al., 2015). Freesia is the only galaxy in our simulated sample with a SFR comparable to the one for currently observed galaxies, thus we focus again on that system.
As we are interested in the deviations from the local relations, it is convenient to parameterize them as follows. For the [C ]-SFR we use
| (12a) | |||
| where | |||
| (12b) | |||
with and in units of and , respectively (De Looze et al., 2014, data from Tab. 2). For the KS we can define
| (13a) | |||
| with | |||
| (13b) | |||
where is in units of (Heiderman et al., 2010, see their eq. 2).
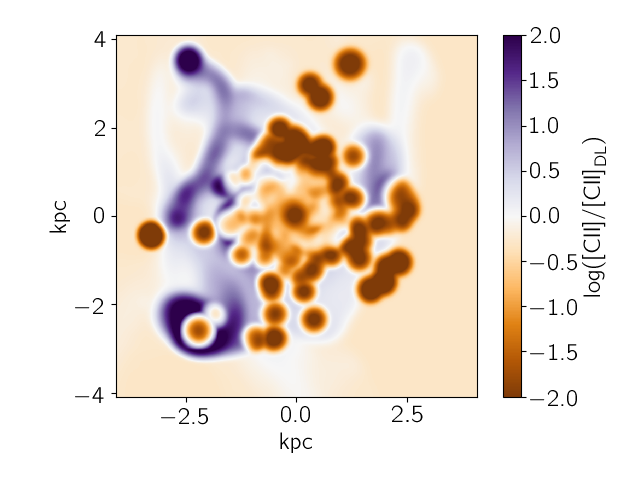
In Fig. 12 we plot the deviation from the relations along with the three quantities determining the local relations (, , ). To have a fair comparison with observations, the maps are smoothed at 100 pc, similar to the De Looze et al. (2014) resolution.
It is striking that in almost all the spots where Freesia is deficient in [C ] (), it is locally star-bursting (); this is particularly evident at the centres of both Freesia-A and Freesia-B, and at the location of the young stars stripped out in the halo of the system. Vice versa, being above the De Looze et al. (2014) relation implies a lack of star formation, as seen in the surroundings of Freesia-B and in the dense gas filament North-West of Freesia-A.
However, a location above (below) the KS relation is a necessary but not sufficient condition for a gas path to be under (over) luminous in [C ], as seen in the material around the filament and in the outer edges of the system. This happens because metallicity plays a secondary role in the link between the two relations (Fig. 12, bottom right). On the one hand, where the metallicity is very low (), the [C ] is fainter than expected even for high (), as carbon abundance limits the emission. On the other hand, a low metallicity implies less dust, the main catalyst of formation, thus consequently stars. This entails a lower for the patches of gas with similar . Such low mean metallicity is not found for relatively massive () and star forming () galaxies; low mean ISM metallicities () are typical of smaller () systems with lower star formation ( Jeon et al. 2015; Jeon & Bromm 2019); for these galaxies, metallicity can play a role as relevant as burstiness, however currently no ALMA [C ] detection is available for galaxies with .
The two resolved relations can be further analysed by extracting the PDFs of - and -. From Fig. 13 we can see that is increasing with in Freesia: the slope is almost flat () for low () and high () formation rates, while the trend is nearly linear for intermediate . The scatter in the relation is decreasing with increasing , because of the smaller spread in metallicity of the gas as we go to progressively higher .
The local - is fitted with an almost linear slope (eq. 12b) and the observed data range is and , with only few observed points (from the galaxy NGC1569) having , where the data seem to indicate the presence of a deficit with respect to the linear trend (De Looze et al., 2014, see in Fig. 2 therein). The local relation is below the one found for Freesia at , while it is above that at . The overlap is not perfect in the intermediate region, because of the patch of low surface brightness regions () at that drags down the mean relation from Freesia.
In Fig. 13 we see that most of the - high-z data – obtained by integrating the various galaxy components and estimating their UV and IR size (see Carniani et al., 2018a, for details) – are nicely consistent with the average value extracted from Freesia, while they fall below the local relation. This is an indication those galaxy are dominated by , critical point where the local - deviate from linear by saturating to an almost constant value (Ferrara et al., in prep., 2019).
To close the loop, we plot the PDF of the KS in Fig. 14. The local relation and the average found in Freesia are in good agreement up to (); for higher values, the intense and concentrated star formation and the consequent strong feedback cause these parts of the galaxy to deviate from the averaged KS. The majority of the regions of the galaxy is below the local -, in particular the patches of gas at high , which are major contributors of its luminosity and SFR; thus, when spatially integrating and , Freesia results to be below the local [C ]-SFR relation and consistent only within (Fig. 10).
6 Conclusions
We have studied the formation and evolution of a sample of Lyman Break galaxies in the Epoch of Reionisation by using crafted, cosmological zoom-in (spatial resolution pc) simulations, as part of the serra suite.
The serra simulations are based on a customised version of the Adaptive Mesh Refinement code ramses (Teyssier, 2002). The ISM thermo-chemical evolution is followed via a non-equilibrium network generated with krome (Grassi et al., 2014), that allows a precise tracking of the formation of , that can be converted into stars. With respect to previous works (Pallottini et al., 2017a, b), the present simulations perform a full on-the-fly radiative transfer of the interstellar radiation field (ISRF) thanks to ramses-rt (Rosdahl et al., 2013). In the post-processing phase we compute the intensities of several FIR lines ([C ], [N ], and [O ]) from a grid of models obtained with the photo-ionisation code cloudy V17 (Ferland et al., 2017). These calculations also account for the turbulent structure of the gas (Vallini et al., 2015). This procedure allows a fair comparison of the results with ALMA observations of high- galaxies.
At , the most massive galaxy in the simulation is “Freesia”. It has a stellar age of , a stellar mass of , and a star formation rate of , due to a recent burst. The galaxy is composed by two concentrated () stellar components (“A” and “B”) separated by kpc. Freesia-A dominates both the mass () and star formation () of the system. Around Freesia, other 11 galaxies are found within kpc ( virial radii); while in our previous work such galaxies were present (Pallottini et al., 2017b), their SFR was likely suppressed in their formation stages, due to lack of proper treatment of the ISRF, which was spatially uniform and dominated in intensity by the most massive galaxy.
The properties of Freesia are overall similar to the ones found in previous work at the same evolutionary stage (Pallottini et al., 2017b), featuring comparable SFR and . The galaxy develops broken spiral disk of gas with radius and average metallicity . The molecular gas is primarily found at gas densities , i.e. about 2 denser than previously found (Pallottini et al., 2017b) as a consequence of the higher local ISRF. This is because higher densities are required in order for the gas to self-shield from the stronger Lyman-Werner radiation. The bulk () of the ionised ISM has low densities (); is collisionally ionised by shocks; only is found in the high density regions (), where ionisation is due to the internal presence of young clusters, which gives large fluctuations in the ionising ISRF.
The ISRF of the galaxies features a mean (variance) Habing flux () and has a rather smooth spatial distribution. The ionisation radiation, parameterized by , shows larger intensity variations in the range and a patchy distribution peaked at the location of recent star formation events. The patchy ionisation structure yields an escape fraction of , a value consistent with observations of lower redshift galaxies with similar brightness (e.g. Bouwens et al., 2016; Grazian et al., 2017), and averaged values of simulated galaxies with similar mass (Xu et al., 2016). We note, however, that large fluctuations are expected between different evolutionary stages (Trebitsch et al., 2017)
The [C ] line luminosity of Freesia is . The emission extends on a few kpc scales, with peaks around Freesia-A, Freesia-B and dense non-starforming clumps found near the galaxy. The emission mostly comes from gas with and illuminated by an ISRF intensity . Instead, [O ] emission is concentrated around Freesia-A, the star-bursting component of the system, and its emission is dominated by gas with a wider range of properties, i.e. and . At the Freesia-A location the oxygen line is very bright, . However, the smaller extent of the [O ] emitting region implies a lower galaxy-integrated emission, i.e. . With respect to [C ], the [O ] show both a spatial offset () and a spectral shift of (), reminiscent of similar evidence found in some systems at high- (Carniani et al., 2017).
Freesia lies below the local [C ]-SFR relation (De Looze et al., 2014, within ) as it is in a starburst phase, i.e. it sits above the Kennicutt-Schmidt (KS) relation (Schmidt, 1959; Kennicutt, 1998, within ). Spatial analysis reveals that patches of the galaxy that are above the resolved local - De Looze et al. (2014) relation are located below KS, and vice-versa.
In particular, due to the recent starburst, the dense center () of Freesia lies above the KS () relation. At such high star formation surface densities the increases with less rapidly than expected from the local relation De Looze et al. (2014), which however only covers the low-end of the range. Thus, the observed [C ]-SFR deficit can be primarily ascribed to negative stellar feedback during starburst phases, disrupting molecular clouds around star formation sites. This interpretation was originally proposed in Vallini et al. (2015); our results fully endorse it.
Metallicity effects have a weaker impact on the origin of [C ]-SFR deviations. Gas with extremely low () metallicities fails below both the local - and the KS relations, because of lack of ions and inefficient formation, respectively. However, gas with is scarce in Freesia and its combined contribution is subdominant when galaxy integrated relations are considered. This situation is common to most of the galaxies in our sample. A metallicity effect might be relevant for galaxies that cannot retain their metal production (Xu et al., 2016; Jeon & Bromm, 2019), that are expected to be smaller () and with a lower star formation (), for which however there is currently no detection with ALMA.
Acknowledgments
This research was supported by the Munich Institute for Astro- and Particle Physics (MIAPP) of the DFG cluster of excellence “Origin and Structure of the Universe”. We thank A. Lupi, M. Trebitsch, J. Rosdahl, and the participants of the “The Interstellar Medium of High Redshift Galaxies” MIAPP conference for fruitful discussion. AF and SC acknowledge support from the ERC Advanced Grant INTERSTELLAR H2020/740120. LV acknowledges funding from the European Union’s Horizon 2020 research and innovation program under the Marie Skłodowska-Curie Grant agreement No. 746119. We acknowledge use of the Python programming language (Van Rossum & de Boer, 1991), Astropy (Astropy Collaboration et al., 2013), Cython (Behnel et al., 2011), Matplotlib (Hunter, 2007), NumPy (van der Walt et al., 2011), pymses (Labadens et al., 2012), Pandas (McKinney, 2010), and SciPy (Jones et al., 2001).
References
- Agertz & Kravtsov (2015) Agertz O., Kravtsov A. V., 2015, ApJ, 804, 18
- Agertz et al. (2013) Agertz O., Kravtsov A. V., Leitner S. N., Gnedin N. Y., 2013, ApJ, 770, 25
- Asano et al. (2013) Asano R. S., Takeuchi T. T., Hirashita H., Inoue A. K., 2013, Earth, Planets, and Space, 65, 213
- Asplund et al. (2009) Asplund M., Grevesse N., Sauval A. J., Scott P., 2009, ARA&A, 47, 481
- Astropy Collaboration et al. (2013) Astropy Collaboration et al., 2013, A&A, 558, A33
- Aubert & Teyssier (2008) Aubert D., Teyssier R., 2008, MNRAS, 387, 295
- Barisic et al. (2017) Barisic I., et al., 2017, ApJ, 845, 41
- Barkana & Loeb (2001) Barkana R., Loeb A., 2001, Phys. Rep., 349, 125
- Behnel et al. (2011) Behnel S., Bradshaw R., Citro C., Dalcin L., Seljebotn D., Smith K., 2011, Computing in Science Engineering, 13, 31
- Behrens et al. (2018) Behrens C., Pallottini A., Ferrara A., Gallerani S., Vallini L., 2018, MNRAS, 477, 552
- Behrens et al. (2019) Behrens C., Pallottini A., Ferrara A., Gallerani S., Vallini L., 2019, MNRAS, 486, 2197
- Bertelli et al. (1994) Bertelli G., Bressan A., Chiosi C., Fagotto F., Nasi E., 1994, A&A Supp., 106, 275
- Black (1987) Black J. H., 1987, in Hollenbach D. J., Thronson Jr. H. A., eds, Astrophysics and Space Science Library Vol. 134, Interstellar Processes. pp 731–744
- Bouché et al. (2007) Bouché N., et al., 2007, ApJ, 671, 303
- Bouwens et al. (2015) Bouwens R. J., et al., 2015, ApJ, 803, 34
- Bouwens et al. (2016) Bouwens R. J., Smit R., Labbé I., Franx M., Caruana J., Oesch P., Stefanon M., Rasappu N., 2016, ApJ, 831, 176
- Bouwens et al. (2017) Bouwens R. J., Illingworth G. D., Oesch P. A., Atek H., Lam D., Stefanon M., 2017, ApJ, 843, 41
- Bovino et al. (2016) Bovino S., Grassi T., Capelo P. R., Schleicher D. R. G., Banerjee R., 2016, A&A, 590, A15
- Bradac et al. (2017) Bradac M., et al., 2017, ApJL, 836, L2
- Bromm & Yoshida (2011) Bromm V., Yoshida N., 2011, ARA&A, 49, 373
- Capak et al. (2015) Capak P. L., et al., 2015, Nature, 522, 455
- Capelo et al. (2018) Capelo P. R., Bovino S., Lupi A., Schleicher D. R. G., Grassi T., 2018, MNRAS, 475, 3283
- Carilli & Walter (2013) Carilli C. L., Walter F., 2013, ARA&A, 51, 105
- Carniani et al. (2017) Carniani S., et al., 2017, A&A, 605, A42
- Carniani et al. (2018a) Carniani S., et al., 2018a, MNRAS, 478, 1170
- Carniani et al. (2018b) Carniani S., Maiolino R., Smit R., Amorín R., 2018b, ApJL, 854, L7
- Ciardi & Ferrara (2005) Ciardi B., Ferrara A., 2005, Space Science Reviews, 116, 625
- Cormier et al. (2012) Cormier D., et al., 2012, A&A, 548, A20
- Courant et al. (1928) Courant R., Friedrichs K., Lewy H., 1928, Mathematische Annalen, 100, 32
- D’Odorico et al. (2018) D’Odorico V., et al., 2018, ApJL, 863, L29
- Daddi et al. (2010a) Daddi E., et al., 2010a, ApJ, 713, 686
- Daddi et al. (2010b) Daddi E., et al., 2010b, ApJL, 714, L118
- Dalgarno & McCray (1972) Dalgarno A., McCray R. A., 1972, ARA&A, 10, 375
- Dayal & Ferrara (2018) Dayal P., Ferrara A., 2018, Phys. Rep., 780, 1
- Dayal et al. (2008) Dayal P., Ferrara A., Gallerani S., 2008, MNRAS, 389, 1683
- De Breuck et al. (2014) De Breuck C., et al., 2014, A&A, 565, A59
- De Looze et al. (2014) De Looze I., et al., 2014, A&A, 568, A62
- De Rossi & Bromm (2017) De Rossi M. E., Bromm V., 2017, MNRAS, 465, 3668
- De Rossi et al. (2018) De Rossi M. E., Rieke G. H., Shivaei I., Bromm V., Lyu J., 2018, ApJ, 869, 4
- Decataldo et al. (2017) Decataldo D., Ferrara A., Pallottini A., Gallerani S., Vallini L., 2017, MNRAS, 471, 4476
- Decataldo et al., in prep. (2019) Decataldo et al., in prep. 2019, -, 0, 0
- Deparis et al. (2019) Deparis N., Aubert D., Ocvirk P., Chardin J., Lewis J., 2019, A&A, 622, A142
- Draine (1978) Draine B. T., 1978, ApJS, 36, 595
- Dubois & Commerçon (2016) Dubois Y., Commerçon B., 2016, A&A, 585, A138
- Dubois & Teyssier (2008) Dubois Y., Teyssier R., 2008, A&A, 477, 79
- Dunlop (2013) Dunlop J. S., 2013, in Wiklind T., Mobasher B., Bromm V., eds, Astrophysics and Space Science Library Vol. 396, Astrophysics and Space Science Library. p. 223 (arXiv:1205.1543), doi:10.1007/978-3-642-32362-1˙5
- Egami et al. (2018) Egami E., et al., 2018, Publ. Astr. Soc. Australia, 35
- Federrath & Klessen (2013) Federrath C., Klessen R. S., 2013, ApJ, 763, 51
- Ferland et al. (2013) Ferland G. J., et al., 2013, Revista Mexicana de Astronomia y Astrofisica, 49, 137
- Ferland et al. (2017) Ferland G. J., et al., 2017, Rev. Mex. Astron. Astrofis., 53, 385
- Ferrara et al., in prep. (2019) Ferrara et al., in prep. 2019, -, 0, 0
- Feruglio et al. (2018) Feruglio C., et al., 2018, A&A, 619, A39
- Fujimoto et al. (2019) Fujimoto S., Ouchi M., Ferrara A., Pallottini A., Ivison R. J., Behrens C., Gallerani S., 2019, arXiv e-prints, p. arXiv:1902.06760
- Gallerani et al. (2018) Gallerani S., Pallottini A., Feruglio C., Ferrara A., Maiolino R., Vallini L., Riechers D. A., Pavesi R., 2018, MNRAS, 473, 1909
- Galli & Palla (1998) Galli D., Palla F., 1998, A&A, 335, 403
- Genzel et al. (2010) Genzel R., et al., 2010, MNRAS, 407, 2091
- Glassgold et al. (2012) Glassgold A. E., Galli D., Padovani M., 2012, ApJ, 756, 157
- Gnedin (2010) Gnedin N. Y., 2010, ApJL, 721, L79
- Gnedin & Abel (2001) Gnedin N. Y., Abel T., 2001, New Astronomy, 6, 437
- Gnedin & Hollon (2012) Gnedin N. Y., Hollon N., 2012, ApJS, 202, 13
- Grassi et al. (2014) Grassi T., Bovino S., Schleicher D. R. G., Prieto J., Seifried D., Simoncini E., Gianturco F. A., 2014, MNRAS, 439, 2386
- Grassi et al. (2017) Grassi T., Bovino S., Haugbølle T., Schleicher D. R. G., 2017, MNRAS, 466, 1259
- Grazian et al. (2017) Grazian A., et al., 2017, A&A, 602, A18
- Greig & Mesinger (2017) Greig B., Mesinger A., 2017, MNRAS, 472, 2651
- Guillet & Teyssier (2011) Guillet T., Teyssier R., 2011, Journal of Computational Physics, 230, 4756
- Haardt & Madau (2012) Haardt F., Madau P., 2012, ApJ, 746, 125
- Habing (1968) Habing H. J., 1968, Bull. Astron. Inst. Netherlands, 19, 421
- Hahn & Abel (2011) Hahn O., Abel T., 2011, MNRAS, 415, 2101
- Harikane et al. (2018) Harikane Y., et al., 2018, ApJ, 859, 84
- Hashimoto et al. (2018) Hashimoto T., et al., 2018, preprint, (arXiv:1806.00486)
- Heiderman et al. (2010) Heiderman A., Evans II N. J., Allen L. E., Huard T., Heyer M., 2010, ApJ, 723, 1019
- Herrera-Camus et al. (2015) Herrera-Camus R., et al., 2015, ApJ, 800, 1
- Hirashita & Ferrara (2002) Hirashita H., Ferrara A., 2002, MNRAS, 337, 921
- Hopkins et al. (2018a) Hopkins P. F., Grudic M. Y., Wetzel A. R., Keres D., Gaucher-Giguere C.-A., Ma X., Murray N., Butcher N., 2018a, arXiv e-prints, p. arXiv:1811.12462
- Hopkins et al. (2018b) Hopkins P. F., et al., 2018b, MNRAS, 480, 800
- Hunter (2007) Hunter J. D., 2007, Computing in Science Engineering, 9, 90
- Iapichino et al. (2017) Iapichino L., Federrath C., Klessen R. S., 2017, MNRAS, 469, 3641
- Iliev et al. (2009) Iliev I. T., et al., 2009, MNRAS, 400, 1283
- Inoue et al. (2016) Inoue A. K., et al., 2016, Science, 352, 1559
- Ivlev et al. (2015) Ivlev A. V., Padovani M., Galli D., Caselli P., 2015, ApJ, 812, 135
- Jaacks et al. (2018) Jaacks J., Thompson R., Finkelstein S. L., Bromm V., 2018, MNRAS, 475, 4396
- Jeon & Bromm (2019) Jeon M., Bromm V., 2019, MNRAS, 485, 5939
- Jeon et al. (2015) Jeon M., Bromm V., Pawlik A. H., Milosavljević M., 2015, MNRAS, 452, 1152
- Jones et al. (2001) Jones E., Oliphant T., Peterson P., et al., 2001, SciPy: Open source scientific tools for Python, http://www.scipy.org/
- Jones et al. (2017) Jones G. C., Willott C. J., Carilli C. L., Ferrara A., Wang R., Wagg J., 2017, ApJ, 845, 175
- Jura (1975) Jura M., 1975, ApJ, 197, 575
- Kanekar et al. (2013) Kanekar N., Wagg J., Chary R. R., Carilli C. L., 2013, ApJL, 771, L20
- Katz et al. (2017) Katz H., Kimm T., Sijacki D., Haehnelt M. G., 2017, MNRAS, 468, 4831
- Katz et al. (2019) Katz H., et al., 2019, arXiv e-prints, p. arXiv:1901.01272
- Kennicutt (1998) Kennicutt Jr. R. C., 1998, ApJ, 498, 541
- Knudsen et al. (2016) Knudsen K. K., Richard J., Kneib J.-P., Jauzac M., Clément B., Drouart G., Egami E., Lindroos L., 2016, MNRAS, 462, L6
- Kohandel et al., in prep. (2019) Kohandel et al., in prep. 2019, -, 0, 0
- Kroupa (2001) Kroupa P., 2001, MNRAS, 322, 231
- Krumholz & McKee (2005) Krumholz M. R., McKee C. F., 2005, ApJ, 630, 250
- Krumholz et al. (2012) Krumholz M. R., Dekel A., McKee C. F., 2012, ApJ, 745, 69
- Labadens et al. (2012) Labadens M., Chapon D., Pomaréde D., Teyssier R., 2012, in Ballester P., Egret D., Lorente N. P. F., eds, Astronomical Society of the Pacific Conference Series Vol. 461, Astronomical Data Analysis Software and Systems XXI. p. 837
- Lada et al. (2010) Lada C. J., Lombardi M., Alves J. F., 2010, ApJ, 724, 687
- Laporte et al. (2017) Laporte N., et al., 2017, ApJL, 837, L21
- Leitherer et al. (1999) Leitherer C., et al., 1999, ApJS, 123, 3
- Leung et al. (2019) Leung T. K. D., et al., 2019, ApJ, 871, 85
- Leung et al., in prep. (2019) Leung et al., in prep. 2019, -, 0, 0
- Lupi et al. (2018) Lupi A., Bovino S., Capelo P. R., Volonteri M., Silk J., 2018, MNRAS, 474, 2884
- Mac Low (1999) Mac Low M.-M., 1999, ApJ, 524, 169
- Madau & Dickinson (2014) Madau P., Dickinson M., 2014, ARA&A, 52, 415
- Maier et al. (2009) Maier A., Iapichino L., Schmidt W., Niemeyer J. C., 2009, ApJ, 707, 40
- Maio & Tescari (2015) Maio U., Tescari E., 2015, MNRAS, 453, 3798
- Maio et al. (2016) Maio U., Petkova M., De Lucia G., Borgani S., 2016, MNRAS, 460, 3733
- Maiolino & Mannucci (2019) Maiolino R., Mannucci F., 2019, A&A Rev., 27, 3
- Maiolino et al. (2015) Maiolino R., et al., 2015, MNRAS, 452, 54
- Matthee et al. (2017) Matthee J., et al., 2017, ApJ, 851, 145
- McKinney (2010) McKinney W., 2010, in van der Walt S., Millman J., eds, Proceedings of the 9th Python in Science Conference. pp 51 – 56
- McKinnon et al. (2018) McKinnon R., Vogelsberger M., Torrey P., Marinacci F., Kannan R., 2018, MNRAS,
- Molina et al. (2012) Molina F. Z., Glover S. C. O., Federrath C., Klessen R. S., 2012, MNRAS, 423, 2680
- Murray (2011) Murray N., 2011, ApJ, 729, 133
- Nickerson et al. (2018) Nickerson S., Teyssier R., Rosdahl J., 2018, preprint, (arXiv:1802.00445)
- O’Shea et al. (2015) O’Shea B. W., Wise J. H., Xu H., Norman M. L., 2015, ApJL, 807, L12
- Oesch et al. (2018) Oesch P. A., Bouwens R. J., Illingworth G. D., Labbé I., Stefanon M., 2018, ApJ, 855, 105
- Olsen et al. (2015) Olsen K. P., Greve T. R., Narayanan D., Thompson R., Toft S., Brinch C., 2015, ApJ, 814, 76
- Olsen et al. (2018) Olsen K., et al., 2018, Galaxies, 6, 100
- Ostriker & McKee (1988) Ostriker J. P., McKee C. F., 1988, Reviews of Modern Physics, 60, 1
- Ota et al. (2014) Ota K., et al., 2014, ApJ, 792, 34
- Ouchi et al. (2013) Ouchi M., et al., 2013, ApJ, 778, 102
- Padoan & Nordlund (2011) Padoan P., Nordlund r., 2011, ApJ, 730, 40
- Pallottini et al. (2014a) Pallottini A., Ferrara A., Gallerani S., Salvadori S., D’Odorico V., 2014a, MNRAS, 440, 2498
- Pallottini et al. (2014b) Pallottini A., Gallerani S., Ferrara A., 2014b, MNRAS, 444, L105
- Pallottini et al. (2015) Pallottini A., Gallerani S., Ferrara A., Yue B., Vallini L., Maiolino R., Feruglio C., 2015, MNRAS, 453, 1898
- Pallottini et al. (2017a) Pallottini A., Ferrara A., Gallerani S., Vallini L., Maiolino R., Salvadori S., 2017a, MNRAS, 465, 2540
- Pallottini et al. (2017b) Pallottini A., Ferrara A., Bovino S., Vallini L., Gallerani S., Maiolino R., Salvadori S., 2017b, MNRAS, 471, 4128
- Pentericci et al. (2016) Pentericci L., et al., 2016, ApJL, 829, L11
- Pfrommer et al. (2017) Pfrommer C., Pakmor R., Schaal K., Simpson C. M., Springel V., 2017, MNRAS, 465, 4500
- Planck Collaboration et al. (2014) Planck Collaboration et al., 2014, A&A, 571, A16
- Popping et al. (2019) Popping G., Narayanan D., Somerville R. S., Faisst A. L., Krumholz M. R., 2019, MNRAS, 482, 4906
- Rahmati et al. (2013) Rahmati A., Pawlik A. H., Raicevic M., Schaye J., 2013, MNRAS, 430, 2427
- Rasera & Teyssier (2006) Rasera Y., Teyssier R., 2006, A&A, 445, 1
- Richings et al. (2014) Richings A. J., Schaye J., Oppenheimer B. D., 2014, MNRAS, 442, 2780
- Röllig et al. (2007) Röllig M., et al., 2007, A&A, 467, 187
- Rosdahl & Teyssier (2015) Rosdahl J., Teyssier R., 2015, MNRAS, 449, 4380
- Rosdahl et al. (2013) Rosdahl J., Blaizot J., Aubert D., Stranex T., Teyssier R., 2013, MNRAS, 436, 2188
- Rosdahl et al. (2018) Rosdahl J., et al., 2018, MNRAS, 479, 994
- Scannapieco & Brüggen (2010) Scannapieco E., Brüggen M., 2010, MNRAS, 405, 1634
- Schaerer et al. (2015) Schaerer D., Boone F., Zamojski M., Staguhn J., Dessauges-Zavadsky M., Finkelstein S., Combes F., 2015, A&A, 574, A19
- Schmidt (1959) Schmidt M., 1959, ApJ, 129, 243
- Smit et al. (2014) Smit R., et al., 2014, ApJ, 784, 58
- Smit et al. (2018) Smit R., et al., 2018, Nature, 553, 178
- Smith et al. (2017) Smith B. D., et al., 2017, MNRAS, 466, 2217
- Smith et al. (2018) Smith B. D., Regan J. A., Downes T. P., Norman M. L., O’Shea B. W., Wise J. H., 2018, MNRAS, 480, 3762
- Solomon & Vanden Bout (2005) Solomon P. M., Vanden Bout P. A., 2005, ARA&A, 43, 677
- Spinoglio et al. (2017) Spinoglio L., et al., 2017, Publ. Astr. Soc. Australia, 34, e057
- Stacey et al. (1991) Stacey G. J., Geis N., Genzel R., Lugten J. B., Poglitsch A., Sternberg A., Townes C. H., 1991, ApJ, 373, 423
- Stecher & Williams (1967) Stecher T. P., Williams D. A., 1967, ApJL, 149, L29
- Sutherland & Dopita (2017) Sutherland R. S., Dopita M. A., 2017, ApJS, 229, 34
- Sutherland et al. (2018) Sutherland R., Dopita M., Binette L., Groves B., 2018, MAPPINGS V: Astrophysical plasma modeling code, Astrophysics Source Code Library (ascl:1807.005)
- Tacconi et al. (2010) Tacconi L. J., et al., 2010, Nature, 463, 781
- Tamura et al. (2018) Tamura Y., et al., 2018, preprint, (arXiv:1806.04132)
- Tasker & Tan (2009) Tasker E. J., Tan J. C., 2009, ApJ, 700, 358
- Teyssier (2002) Teyssier R., 2002, A&A, 385, 337
- Teyssier et al. (2013) Teyssier R., Pontzen A., Dubois Y., Read J. I., 2013, MNRAS, 429, 3068
- Trebitsch et al. (2017) Trebitsch M., Blaizot J., Rosdahl J., Devriendt J., Slyz A., 2017, MNRAS, 470, 224
- Valle et al. (2002) Valle G., Ferrini F., Galli D., Shore S. N., 2002, ApJ, 566, 252
- Vallini et al. (2013) Vallini L., Gallerani S., Ferrara A., Baek S., 2013, MNRAS, 433, 1567
- Vallini et al. (2015) Vallini L., Gallerani S., Ferrara A., Pallottini A., Yue B., 2015, ApJ, 813, 36
- Vallini et al. (2017) Vallini L., Ferrara A., Pallottini A., Gallerani S., 2017, MNRAS,
- Vallini et al. (2018) Vallini L., Pallottini A., Ferrara A., Gallerani S., Sobacchi E., Behrens C., 2018, MNRAS, 473, 271
- Van Rossum & de Boer (1991) Van Rossum G., de Boer J., 1991, CWI Quarterly, 4, 283
- Vanzella et al. (2018) Vanzella E., et al., 2018, MNRAS,
- Weaver et al. (1977) Weaver R., McCray R., Castor J., Shapiro P., Moore R., 1977, ApJ, 218, 377
- Webber (1998) Webber W. R., 1998, ApJ, 506, 329
- Weingartner & Draine (2001) Weingartner J. C., Draine B. T., 2001, ApJ, 563, 842
- Willott et al. (2015) Willott C. J., Carilli C. L., Wagg J., Wang R., 2015, ApJ, 807, 180
- Wolcott-Green et al. (2011) Wolcott-Green J., Haiman Z., Bryan G. L., 2011, MNRAS, 418, 838
- Wolfire et al. (2003) Wolfire M. G., McKee C. F., Hollenbach D., Tielens A. G. G. M., 2003, ApJ, 587, 278
- Xu et al. (2016) Xu H., Wise J. H., Norman M. L., Ahn K., O’Shea B. W., 2016, ApJ, 833, 84
- da Cunha et al. (2013) da Cunha E., et al., 2013, ApJ, 766, 13
- van der Walt et al. (2011) van der Walt S., Colbert S. C., Varoquaux G., 2011, Computing in Science Engineering, 13, 22