Anisotropy engineering edge magnetism in zigzag honeycomb nanoribbons
Abstract
It have been demonstrated that the zigzag honeycomb nanoribbons exhibit an intriguing edge magnetism. Here the effect of the anisotropy on the edge magnetism in zigzag honeycomb nanoribbons is investigated by using two kinds of large-scale quantum Monte Carlo simulations. The anisotropy in zigzag honeycomb nanoribbons is characterized by the ratios of nearest-neighboring hopping integrals in one direction and in another direction. Considering the electron-electron correlation, it is shown that the edge ferromagnetism could be enhanced greatly as increase from to , which not only presenting the avenue for the control of this magnetism, but also being useful for exploring further novel magnetism in new nano-scale materials.
I Introduction
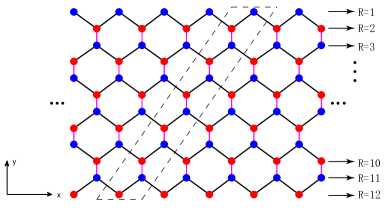
Since the discovery of graphene, extensive attention from the research community has been attracted by the emerging honeycomb and honeycomb-like two-dimentional(2D) materials due to their exotic electronic, optical and magnetic propertiesNovoselov et al. (2012). The family of these materials includes Hexagonal Boron Nitride, transition-metal dichalcogenidesNovoselov et al. (2005); Sun and Chang (2014), siliceneGao et al. (2013); Meng et al. (2013); Yang et al. (2018), germaneneLiu et al. (2011), hafnium monolayerLi et al. (2013), phosphorene Buscema et al. (2014); Castellanos-Gomez et al. (2014); Li et al. (2014); Liu et al. (2014); Xia et al. (2014); Tran et al. (2014); Fei and Yang (2014) as well as its allotropesGuan et al. (2014); Zhao et al. (2015); Wu et al. (2015); Zhu and Tománek (2014); Schusteritsch et al. (2016); Wang et al. (2017); Zhang et al. (2016); Han et al. (2017), and so forth. As a crucial prerequisite for their practical applications, various methods have been proposed to tailor and generate their properties. Among them, nanopatterning is a fruitful approach because quantum confinement realized in nanostructures often induces strikingly evident quantum phenominaOka et al. (2014). Extensive studies have demonstrated that the local magnetic moments appear on the edge of zigzag graphene nanoribbons(ZGNRs)Son et al. (2006); Feldner et al. (2011); Cheng et al. (2015); Viana-Gomes et al. (2009); Magda et al. (2014); Yang et al. (2007), and the shape of zigzag edge has been shown in Fig.1, where the top and the bottom of the lattice structure both show the sketch of zigzag edge. Such quantum phenomenon in ZGNRs instigates more subsequent exploration on the edge magnetism in honeycomb and honeycomb-like nanoribbons such as molybdenum disulfide(MoS2)Kou et al. (2012) and phosphoreneZhu et al. (2014); Du et al. (2015); Yang et al. (2016), which may open the avenue to their possible applications in spintronics. For spintronics, it is required that Curie temperatures of the targeted materials should be higher than ambient temperature, which is supposed to be approximately room temperatureYazyev (2010). To solve the challenging problem, further theoretical and experimental investigations are highly demanded.
It has been unveiled that pristine graphene is nonmagnetic due to the vanishing density of states(DOS) at the Dirac point Kotov et al. (2012). Strikingly, the appearance of edges in a honeycomb-lattice nanostructure gives rise to additional electronic states along the edges at Fermi level which form a quasi-flat band taking up one-third of the one dimensional Brillouin zone in ZGNRsFujita et al. (1996). These striking edge states induce the novel magneticSon et al. (2006); Magda et al. (2014) and optical propertiesYang et al. (2008). As a well-controlled route, strain engineering is often utilized to modulate the magnetic properties of 2D materials and the corresponding nanostructures Guinea et al. (2010); Johari and Shenoy (2012); Ni et al. (2008); Fei and Yang (2014). For ZGNRs, applying strain along the zigzag direction have been theoretically proposed to reinforce the edge magnetismYang et al. (2017); Cheng et al. (2015); Viana-Gomes et al. (2009). The anisotropy induced by strain leads to the displacement of the Dirac points. Thus the electronic correlation effect is enhanced by the higher DOS in the extended flat band, which catalyses the enhancement of edge magnetism. The proper strain even could trigger the room-temperature edge magnetism under the suitable Coulomb interactionYang et al. (2017). Distinct from graphene, the puckered structure of phosphorene with a honeycomb lattice endows this material with strong anisotropyWang et al. (2015). Consequently, the quasi-flat band of zigzag phosphorene nanoribbons(ZPNRs) expands across the entire one-dimensional Brillouin zone and it is completely detached from the bulk bandCarvalho et al. (2014); Peng et al. (2014). The first-principle and quantum Monte Carlo studies have shown the existence of edge ferromagnetism in ZPNRs which is much more stronger than that in ZGNRsZhu et al. (2014); Du et al. (2015); Yang et al. (2016). Considering the relatively weak Coulomb interaction, it is predicted that the Curie temperature could be even high up to room temperatureYang et al. (2016). No matter the anisotropy is induced by intentionally introduced strains in the targeted materials or is inborn quality of materials of interest, the study of the anisotropic effect on the ferromagnetism along the zigzag edges of honeycomb nanoribbons has great academic significance and may advance the development of spintronics.
According to the literatureLieb (1989), honeycomb lattice is bipartite, which can be divided into two sets of sublattices represented by A(blue circle) and B(red circle) in Fig.1. As is shown in Fig.1, and represent two nearest-neighboring hoping integrals and their ratio, namely , denotes the strength of anisotropy, and corresponds to the isotropic case of graphene, while for phosphorene, the value of is near . It is interesting to explore the detailed picture of the anisotropy engineering edge magnetism in zigzag honeycomb nanoribbons in the region of , which may not only shed more light on some other materials, but also provide useful information on synthesizing new materials. In this paper, we use two kinds of large-scale quantum Monte Carlo simulations to explore the anisotropic effect on the edge ferromagnetism of zigzag honeycomb nanoribbons. The edge ferromagnetism is found to be enhanced with the increasing value of from to under proper interaction because the enhanced interaction effect is caused by the higher DOS located in the extended flat band. Through the picture of the tight-binding model, we found that a band gap show up and becomes broader as increases. The enhancement of Coulomb interaction and the doping effect on the edge magnetism are also displayed.
II Model and Method
As a prototype of the honeycomb lattice endowed with strong anisotropic nature, phosphorene can be described by a tight-binding model containing five hopping integrals (i=1, 2, 3, 4, 5), where eV, eV, eV, eV, eVEzawa (2014). For ZPNRs, we adopted the periodic boundary along the -direction and finite lattice size in the -direction. It has been verified that the anisotropic effect of ZPNRs on edge magnetism is mainly reflected by the nearest hopping terms due to their much higher values than those of Ezawa (2014). Therefore, here our study focuses on the correlation of edge magnetism and to ratios with the vanishing under Coulomb interaction in the honeycomb nanoribbons.
The single-band Hubbard model is employed to describe the honeycomb nanoribbons and the Hamiltonian is given as
| (1) |
where represents the hopping integral between the -th and -th sites and we consider to explore the anisotropic effect on the edge magnetism. denotes the annihilation (creation) operator of electron at the -th site and is the occupation number operator. is the chemical potential and is the on-site Coulomb repulsion. As the powerful tools for treating the strong correlated systems, the determinant quantum Monte Carlo (DQMC)Hirsch (1985); Blankenbecler et al. (1981); Santos (2003) and the constrained path quantum Monte Carlo (CPQMC) methodsZhang (1995) are utilized to simulate magnetic correlation in the presence of Coulomb interactionMa et al. (2013, 2018, 2014, 2011); Wu et al. (2013); Ma et al. (2015). The results of DQMC can exhibit the properties of the related systems at finite temperature, while the CPQMC is designed to explore the ground-state properties. For the DQMC, it is free from the notorious sign problem in the half filled cases due to the particle-hole symmetry, which we mainly care about here and thus the corresponding results are guaranteed to be reliableYang et al. (2016). To explore the effect of electron fillings, we present some results which are very near to the half filling by using the CPQMC, and CPQMC is a method inborn to avoid the sign problem.
To explore the thermodynamic properties of the edge magnetism in honeycomb nanoribbons, the uniform magnetic susceptibility along each edge at finite temperatures is calculated using the DQMC. The uniform magnetic susceptibility is defined as the zero-frequency spin susceptibility in the direction as
| (2) |
where with . At first, summation run over the sites along each edge, and then the edge magnetic susceptibility is obtained through averaging the results of the top edge and the bottom edge. Furthermore, the spatial distribution of the magnetic correlations is elucidated utilizing the CPQMC method to calculate the equal-time magnetic structure factor for each zigzag chain which is defined as
| (3) |
where . R is the index of the zigzag chain, i,j are the indices of the sites along the R-th zigzag chain, and represents the number of sites in each zigzag chain. is calculated along the zigzag chain from the bottom to the top as shown in Fig.1. Through the values of spin structure factor , the spatial distribution of spin correlations could be clearly presented.
III Results and Discussion
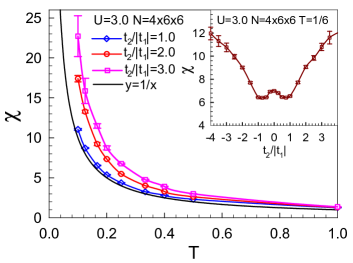
To shed light on the anisotropic effect on the edge magnetism in the zigzag honeycomb nanoribbons, the Fig.2 is plotted to exhibit the magnetic susceptibility along the zigzag edge as a function of temperature with different ratios of to at half filling, Coulomb interaction and lattice size . In the following, we take as the unit if there is no special illustration. For graphene-based material, is around 2.7 eV, and for phosphorene, is around 1.220 eV. The value of the on-site repulsion can be taken from its estimation in polyacetyleneCastro Neto et al. (2009); Herbut (2006); Parr et al. (1950) 6.0-17 eV, which clearly spans a large range of values for graphene based materials, and latter Peierls-Feynman-Bogoliubov variational principle shows that 4 eV is reasonable for graphene, silicene, and benzeneSchüler et al. (2013). Therefore, to explore the importance of interactions on the magnetism of nanoribbons under study, we study the model Hamitonian in the range of =, and this is also feasible for phosphoreneDu et al. (2015); Yang et al. (2016).
Apparently, the correlations of edge magnetic susceptibility and temperature display the Curie-Weiss behavior which describes the magnetic susceptibility dependent on the temperature above the Curie temperature . According to the reference line , all the lines for diverge at the finite low temperature with suggesting that the zigzag honeycomb nanoribbons have the ferromagnetic behavior. Moreover, increases with the increasing at low temperature which presents the enhancement of the anisotropy for the edge magnetism in zigzag honeycomb nanoribbons. To provide clearer diagram for the correlation between and , an inset is added in Fig.2. When the absolute value of is larger than up to , the edge magnetic susceptibility almost linearly increases with the increasing as is shown in the inset of Fig.2. While, for the absolute value of smaller than down to , the magnetic susceptibility slightly increase, which is similar as that in zigzag graphene nanoribbonsYang et al. (2017). Therefore, we may assert that stronger anisotropy can induce stronger edge magnetism in zigzag honeycomb nanoribbons.
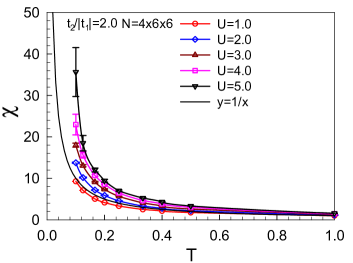
To understand the physical scenarios induced by Coulomb interaction , the magnetic susceptibility of zigzag honeycomb nanoribbons with different Coulomb interactions is computed at the same as Fig.3 illustrates. Clearly, is enhanced by the interaction at the same temperature and . In addition, the system is dominated by the ferromagnetic fluctuation at and . Hence, Fig.2 and Fig.3 show that both anisotropy and interaction can make the edge ferromagnetism robust in the zigzag honeycomb nanoribbons.
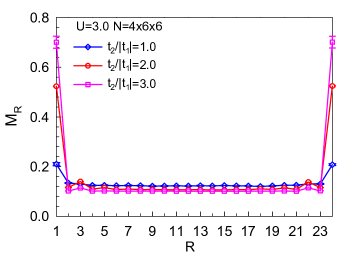
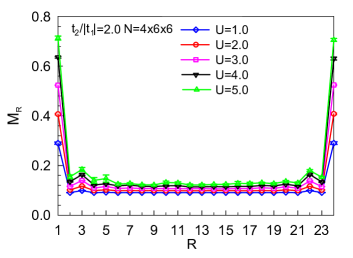
To further study the spatial distribution of magnetic correlations, CPQMC is used to calculate the equal-time magnetic structure factor along each zigzag chain. Fig.4 presents with different cases of / at , half filling and . For an half-filled Hubbard model on a perfect honeycomb lattice, the system shows antiferromagnetic correlationsMa et al. (2018). As the structure of the honeycomb lattice can be described by two interpenetrating sublattices, the spin correlation between the nearest-neighbor sites (or sites on different sublattice) is negative, due to antiferromagnetic correlations, while the spin correlation between the sites belonging to the same sublattice, for example, between the next nearest-neighbor sites, has to be positive. The defined here is an average of the spin correlation between sites belonging to the same sublattice, thus it is positive and acts like ferromagnetic behaviorCheng et al. (2015).
The value of is dramatically larger along each edge than that along each chain in the bulk so that the magnetic correlations are mainly distributed along each edge. Meanwhile, we can see that the edge magnetic correlations become larger with the increasing values of /. Thus the enhancement of the anisotropy for edge magnetism is further verified by the results of the CPQMC in agreement with the conclusion obtained from the DQMC. In Fig.5, the results of the CPQMC illustrate at each chain dependent on the Coulomb interactions at the same /. It is clear that the larger interaction leads to the stronger edge magnetism which is also consistent with the results of DQMC. Even the magnetic structure factor has a finite positive value at , that does not mean the exact presence of observed magnetism, for which we have to make careful finite size scaling analysis to explore the properties at thermodynamical limits. This does cost huge CPU time and restrict us. Anyway, the results shown in Fig.5 at least demonstrate that the magnetic structure factor is enhanced greatly as the interaction strength increases.
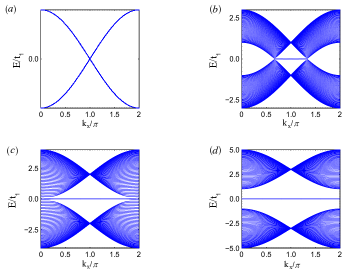
The variation of the topology of the band structure caused by reveals the nature of the enhanced edge magnetism induced by the anisotropy in such systems as is presented in Fig.6. For the case of and in Fig.6(b), the band structure corresponds to that of zigzag graphene nanoribbons with two Dirac cones at and . A flat band consisting of the edge states connects these two Dirac points. The flat band takes up one-third of the one dimensional Brillouin zone. We take as the unit and increase . As the corresponds to in Fig.6(c), we can see that two Dirac cones approach to and then the flat band extends dramatically. In Fig.6(d), we set and as the unit, and is equivalent to which approximately corresponds to zigzag phosphorene nanoribbons according to Ref.Ezawa (2014). In this condition, Fig.6(d) shows a flat band occupying the entire one dimensional Brillouin zone. In the meanwhile, a band gap opens up in the bulk with the increasing anisotropy. The extended flat band derived from the increasing leads to the higher density of states at Fermi level which enhances the interaction effect. Thereby the stronger ferromagnetism is induced by the stronger anisotropy.
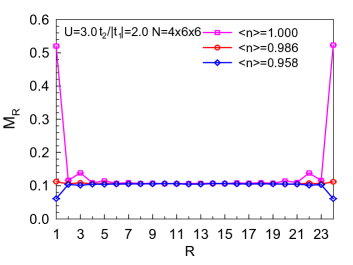
Finally, the doping effect on the edge magnetism is explored using the CPQMC. The relation between the magnetic structure factor and the electron filling is illustrated in Fig.7. It is clear that the edge ferromagnetism is sharply weakened as the electron filling moves away from the half filling and the doped charge mostly locates along the edge. Therefore, it may give a possible way to manipulate the edge magnetism in the honeycomb nanoribbons. The doping level presents in Fig. 7 is =0.014 and 0.042 respectively, namely, 1.4 percent or 4.2 percent doping ratio, which are within the current experimental capacity, as in graphene and other honeycomb-like 2D materials, doping achievable by gate voltage or chemical doping is usually on the order of cm-2Novoselov et al. (2012).
IV Summary
In summary, we used both the DQMC and CPQMC methods to explore the effect of the anisotropy, the interaction and the doping on the edge ferromagnetism in the honeycomb nanoribbons. At a fixed Coulomb interaction, for example , which is a reasonable interaction strength for various 2D materials with honeycomb-like structure, our intensive numerical results show that the edge magnetism could be enhanced remarkably as increases from to . For a fix , a ferromagnetic-like behavior is predicted as , and the ferromagnetic correlation is reduced greatly with a finite doping. These results provide a route for tailoring the magnetic properties of honeycomb 2D materials and searching for new materials with the honeycomb lattice.
Acknowledgements
This work was supported by NSFC (No. 11774033) and Beijing Natural Science Foundation (No.1192011). We also acknowledge computational support from HSCC of Beijing Normal University.
References
- Novoselov et al. (2012) K. S. Novoselov, V. Fal, L. Colombo, P. Gellert, M. Schwab, and K. Kim, Nature 490, 192 (2012).
- Novoselov et al. (2005) K. S. Novoselov, D. Jiang, F. Schedin, T. J. Booth, V. V. Khotkevich, S. V. Morozov, and A. K. Geim, Proc. Natl. Acad. Sci. 102, 10451 (2005).
- Sun and Chang (2014) Z. Sun and H. Chang, ACS Nano 8, 4133 (2014).
- Gao et al. (2013) J. Gao, J. Zhang, H. Liu, Q. Zhang, and J. Zhao, Nanoscale 5, 9785 (2013).
- Meng et al. (2013) L. Meng, Y. Wang, L. Zhang, S. Du, R. Wu, L. Li, Y. Zhang, G. Li, H. Zhou, W. A. Hofer, and H.-J. Gao, Nano Lett. 13, 685 (2013).
- Yang et al. (2018) K. Yang, W.-Q. Huang, W. Hu, G.-F. Huang, and S. Wen, Nanoscale 10, 14667 C (2018).
- Liu et al. (2011) C.-C. Liu, W. Feng, and Y. Yao, Phys. Rev. Lett. 107, 076802 (2011).
- Li et al. (2013) L. Li, Y. Wang, S. Xie, X.-B. Li, Y.-Q. Wang, R. Wu, H. Sun, S. Zhang, and H.-J. Gao, Nano Lett. 13, 4671 (2013).
- Buscema et al. (2014) M. Buscema, D. J. Groenendijk, S. I. Blanter, G. A. Steele, H. S. Van Der Zant, and A. Castellanos-Gomez, Nano Lett. 14, 3347 (2014).
- Castellanos-Gomez et al. (2014) A. Castellanos-Gomez, L. Vicarelli, E. Prada, J. O. Island, K. Narasimha-Acharya, S. I. Blanter, D. J. Groenendijk, M. Buscema, G. A. Steele, and J. Alvarez, 2D Mater. 1, 025001 (2014).
- Li et al. (2014) L. Li, Y. Yu, G. J. Ye, Q. Ge, X. Ou, H. Wu, D. Feng, X. H. Chen, and Y. Zhang, Nat. Nanotechnol. 9, 372 (2014).
- Liu et al. (2014) H. Liu, A. T. Neal, Z. Zhu, Z. Luo, X. Xu, D. Tom nek, and P. D. Ye, ACS Nano 8, 4033 (2014).
- Xia et al. (2014) F. Xia, H. Wang, and Y. Jia, Nat. Commun. 5, 4458 (2014).
- Tran et al. (2014) V. Tran, R. Soklaski, Y. Liang, and L. Yang, Phys. Rev. B 89, 235319 (2014).
- Fei and Yang (2014) R. Fei and L. Yang, Nano Lett. 14, 2884 (2014).
- Guan et al. (2014) J. Guan, Z. Zhu, and D. Tománek, Phys. Rev. Lett. 113, 226801 (2014).
- Zhao et al. (2015) T. Zhao, C. He, S. Ma, K. Zhang, X. Peng, G. Xie, and J. Zhong, J. Phys.: Condens. Matter 27, 265301 (2015).
- Wu et al. (2015) M. Wu, H. Fu, L. Zhou, K. Yao, and X. C. Zeng, Nano Lett. 15, 3557 (2015).
- Zhu and Tománek (2014) Z. Zhu and D. Tománek, Phys. Rev. Lett. 112, 176802 (2014).
- Schusteritsch et al. (2016) G. Schusteritsch, M. Uhrin, and C. J. Pickard, Nano Lett. 16, 2975 (2016).
- Wang et al. (2017) H. Wang, X. Li, Z. Liu, and J. Yang, Phys. Chem. Chem. Phys. 19, 2402 (2017).
- Zhang et al. (2016) J. L. Zhang, S. Zhao, C. Han, Z. Wang, S. Zhong, S. Sun, R. Guo, X. Zhou, C. D. Gu, K. D. Yuan, et al., Nano Lett. 16, 4903 (2016).
- Han et al. (2017) W. H. Han, S. Kim, I.-H. Lee, and K. J. Chang, J. Phys. Chem. Lett. 8, 4627 (2017).
- Oka et al. (2014) H. Oka, O. O. Brovko, M. Corbetta, V. S. Stepanyuk, D. Sander, and J. Kirschner, Rev. Mod. Phys. 86, 1127 (2014).
- Son et al. (2006) Y.-W. Son, M. L. Cohen, and S. G. Louie, Nature 444, 347 (2006).
- Feldner et al. (2011) H. Feldner, Z. Y. Meng, T. C. Lang, F. F. Assaad, S. Wessel, and A. Honecker, Phys. Rev. Lett. 106, 226401 (2011).
- Cheng et al. (2015) S. Cheng, J. Yu, T. Ma, and N. M. R. Peres, Phys. Rev. B 91, 075410 (2015).
- Viana-Gomes et al. (2009) J. Viana-Gomes, V. M. Pereira, and N. Peres, Phys. Rev. B 80, 245436 (2009).
- Magda et al. (2014) G. Magda, X. Jin, H. I, V. P, O. Z, N.-I. P, H. C, B. LP, and T. L, Nature 514, 608 (2014).
- Yang et al. (2007) L. Yang, C.-H. Park, Y.-W. Son, M. L. Cohen, and S. G. Louie, Phys. Rev. Lett. 99, 186801 (2007).
- Kou et al. (2012) L. Kou, C. Tang, Y. Zhang, T. Heine, C. Chen, and T. Frauenheim, J. Phys. Chem. Lett. 3, 2934 (2012).
- Zhu et al. (2014) Z. Zhu, C. Li, W. Yu, D. Chang, Q. Sun, and Y. Jia, Appl. Phys. Lett. 105, 113105 (2014).
- Du et al. (2015) Y. Du, H. Liu, B. Xu, L. Sheng, J. Yin, C.-G. Duan, and X. Wan, Sci. Rep 5, 8921 (2015).
- Yang et al. (2016) G. Yang, S. Xu, W. Zhang, T. Ma, and C. Wu, Phys. Rev. B 94, 075106 (2016).
- Yazyev (2010) O. V. Yazyev, Rep. Prog. Phys. 73, 056501 (2010).
- Kotov et al. (2012) V. N. Kotov, B. Uchoa, V. M. Pereira, F. Guinea, and A. C. Neto, Rev. Mod. Phys. 84, 1067 (2012).
- Fujita et al. (1996) M. Fujita, K. Wakabayashi, K. Nakada, and K. Kusakabe, J. Phys. Soc. Jpn 65, 1920 (1996).
- Yang et al. (2008) L. Yang, M. L. Cohen, and S. G. Louie, Phys. Rev. Lett. 101, 186401 (2008).
- Guinea et al. (2010) F. Guinea, M. Katsnelson, and A. Geim, Nat. Phys. 6, 30 (2010).
- Johari and Shenoy (2012) P. Johari and V. B. Shenoy, ACS Nano 6, 5449 (2012).
- Ni et al. (2008) Z. H. Ni, T. Yu, Y. H. Lu, Y. Y. Wang, Y. P. Feng, and Z. X. Shen, ACS Nano 2, 2301 (2008).
- Yang et al. (2017) G. Yang, B. Li, W. Zhang, M. Ye, and T. Ma, J. Phys.: Condens. Matter 29, 365601 (2017).
- Wang et al. (2015) X. Wang, A. M. Jones, K. L. Seyler, V. Tran, Y. Jia, H. Zhao, H. Wang, L. Yang, X. Xu, and F. Xia, Nat. Nanotechnol. 10, 517 (2015).
- Carvalho et al. (2014) A. Carvalho, A. Rodin, and A. C. Neto, Europhys. Lett. 108, 47005 (2014).
- Peng et al. (2014) X. Peng, A. Copple, and Q. Wei, J. Appl. Phys. 116, 144301 (2014).
- Lieb (1989) E. H. Lieb, Phys. Rev. Lett. 62, 1201 (1989).
- Ezawa (2014) M. Ezawa, New J. Phys. 16, 115004 (2014).
- Hirsch (1985) J. E. Hirsch, Phys. Rev. B 31, 4403 (1985).
- Blankenbecler et al. (1981) R. Blankenbecler, D. Scalapino, and R. Sugar, Phys. Rev. D 24, 2278 (1981).
- Santos (2003) R. R. d. Santos, Braz. J. Phys. 33, 36 (2003).
- Zhang (1995) S. Zhang, Phys. Rev. Lett. 74, 3652 (1995).
- Ma et al. (2013) T. Ma, H.-Q. Lin, and J. Hu, Phys. Rev. Lett. 110, 107002 (2013).
- Ma et al. (2018) T. Ma, L. Zhang, C.-C. Chang, H.-H. Hung, and R. T. Scalettar, Phys. Rev. Lett. 120, 116601 (2018).
- Ma et al. (2014) T. Ma, F. Yang, H. Yao, and H.-Q. Lin, Phys. Rev. B 90, 245114 (2014).
- Ma et al. (2011) T. Ma, Z. Huang, F. Hu, and H.-Q. Lin, Phys. Rev. B 84, 121410 (2011).
- Wu et al. (2013) Y. Wu, G. Liu, and T. Ma, Europhys. Lett. 104, 27013 (2013).
- Ma et al. (2015) T. Ma, H.-Q. Lin, and J. E. Gubernatis, Europhys. Lett. 111, 47003 (2015).
- Castro Neto et al. (2009) A. H. Castro Neto, F. Guinea, N. M. R. Peres, K. S. Novoselov, and A. K. Geim, Rev. Mod. Phys. 81, 109 (2009).
- Herbut (2006) I. F. Herbut, Phys. Rev. Lett. 97, 146401 (2006).
- Parr et al. (1950) R. G. Parr, D. P. Craig, and I. G. Ross, J. Chem. Phys. 18, 1561 (1950).
- Schüler et al. (2013) M. Schüler, M. Rösner, T. O. Wehling, A. I. Lichtenstein, and M. I. Katsnelson, Phys. Rev. Lett. 111, 036601 (2013).