Investigating an angular correlation between nearby starburst galaxies and UHECRs with the Telescope Array experiment
Abstract
The arrival directions of cosmic rays detected by the Pierre Auger Observatory (Auger) with energies above 39 EeV were recently reported to correlate with the positions of 23 nearby starburst galaxies (SBGs): in their best-fit model, 9.7% of the cosmic-ray flux originates from these objects and undergoes angular diffusion on a scale. On the other hand, some of the SBGs on their list, including the brightest one (M82), are at northern declinations outside the Auger field of view. Data from detectors in the northern hemisphere would be needed to look for cosmic-ray excesses near these objects. In this work, we tested the Auger best-fit model against data collected by the Telescope Array (TA) in a 9-year period, without trying to re-optimize the model parameters for our dataset in order not to introduce statistical penalties. The resulting test statistic (double log-likelihood ratio) was , corresponding to significance among isotropically generated random datasets, and to significance among ones generated assuming the Auger best-fit model. In other words, our data is still insufficient to conclusively rule out either hypothesis. The ongoing fourfold expansion of TA will collect northern hemisphere data with much more statistics, improving our ability to discriminate between different flux models.
1 The Auger analysis
We will briefly illustrate the main features of the analysis by the Pierre Auger Collaboration (Aab:2018chp, ), which we tried to replicate using Telescope Array data.
1.1 Assumed sources (23 starburst galaxies)
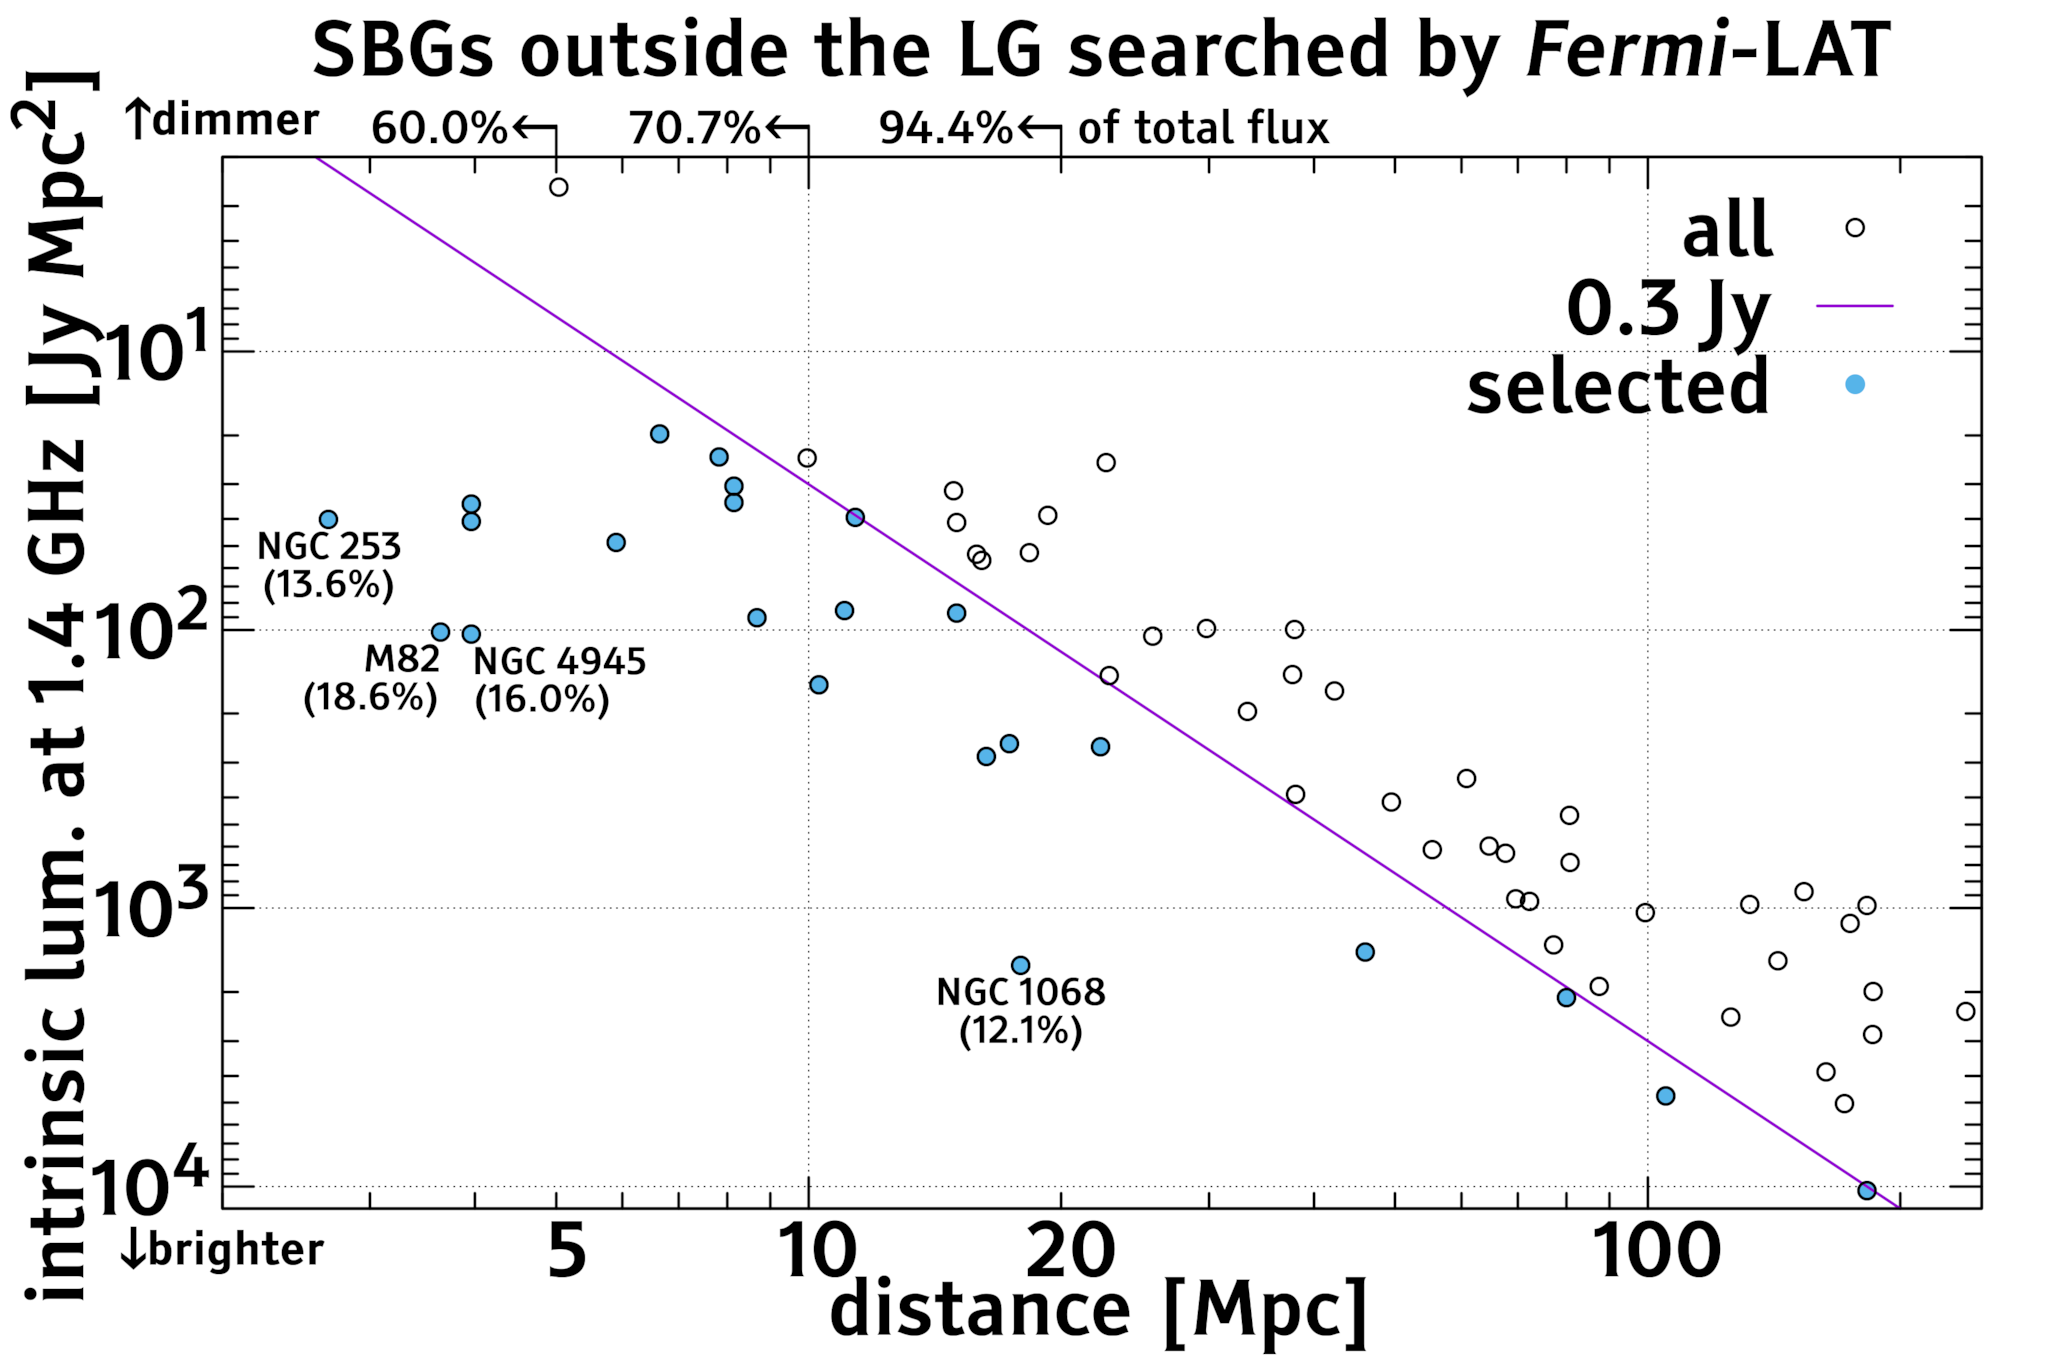
In Aab:2018chp , the candidate sources were selected from a list of 64 starburst galaxies (SBGs) outside the Local Group searched by Fermi-LAT (Ackermann:2012vca, ) for gamma-ray emission (which was only significantly detected from 4 of them in that work). Among these, Aab:2018chp selected the 23 objects whose radio flux at 1.4 GHz is at least 0.3 Jy (figure 1). Their UHECR luminosity was assumed to be proportional to their radio luminosity.
1.2 The flux model
In Aab:2018chp , the directional flux of UHECRs from SBGs is assumed to be a weighed sum of von Mises–Fisher distributions (the spherical analog of a Gaussian):
where is taken proportional to the radio flux at 1.4 GHz and is the RMS deviation in each transverse dimension (the total RMS deviation being ). The total flux is assumed to be that from SBGs plus an isotropic background,
where .
1.3 The log-likelihood ratio test
Given two flux models and the directional exposure of the experiment, the log-likelihood ratio test statistic is given by
A positive indicates that the data favour the model over , and a negative TS vice versa. Aab:2018chp used , , and searched for the values of the parameters , , maximizing .
1.4 Results
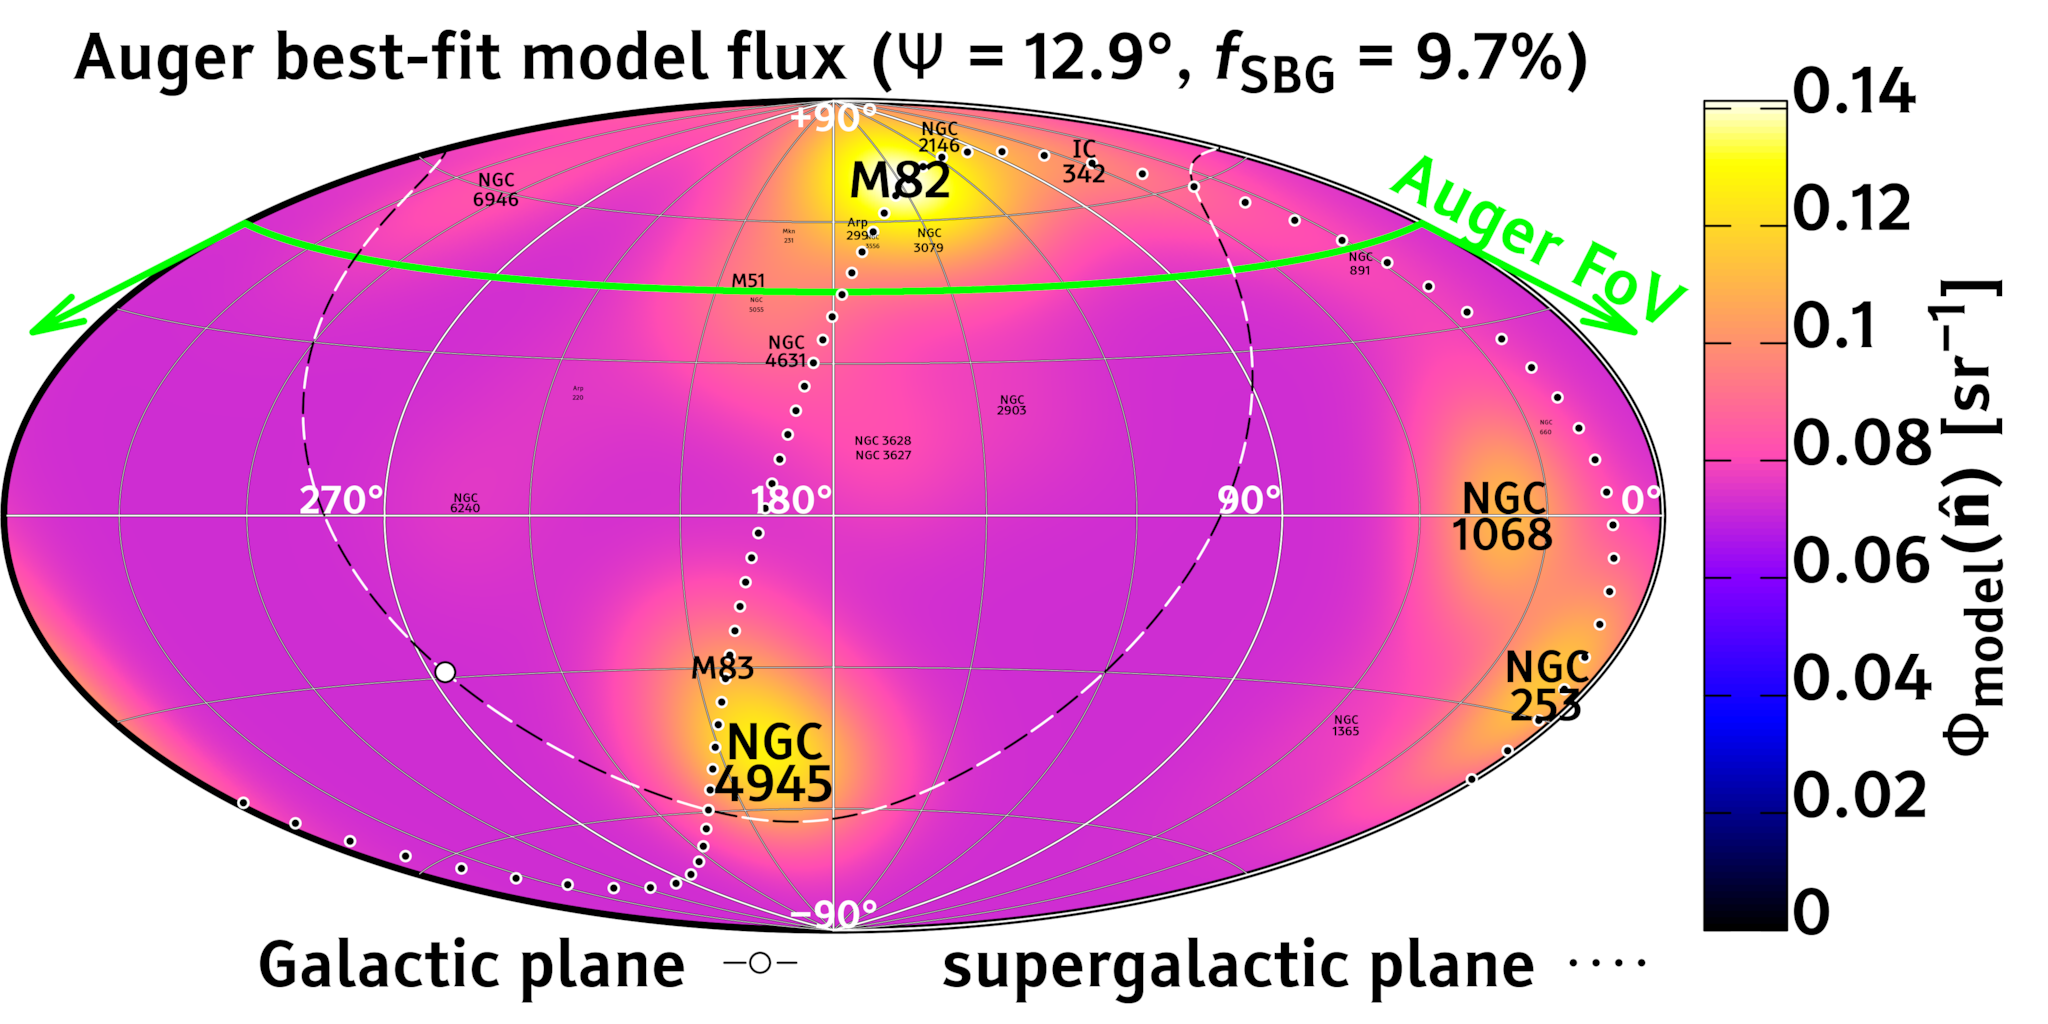
The best-fit parameters found by Aab:2018chp were , , and EeV. The corresponding flux map is shown in figure 2. This model is favoured at the (post-trial) level over an isotropic null hypothesis and at the level over the hypothesis that the UHECR emissivity is proportional to the overall matter density in the nearby extragalactic Universe.
2 The Telescope Array follow-up
Since several of the objects in the Auger analysis (including the brightest one, M82) are in the Northern Hemisphere outside the Auger field of view, we decided to test the same hypothesis using Telescope Array data (Abbasi:2018tqo, ).
2.1 The analysis
We computed TS for our data using the same values of and as in the best-fit of Aab:2018chp (), without scanning them in order to not introduce any statistical penalty. We neglected the attenuation of UHECRs in intergalactic space, which was found to be negligible by Aab:2018chp because most of the flux from SBGs in this model originates from a few Mpc.
2.2 The dataset (284 events)
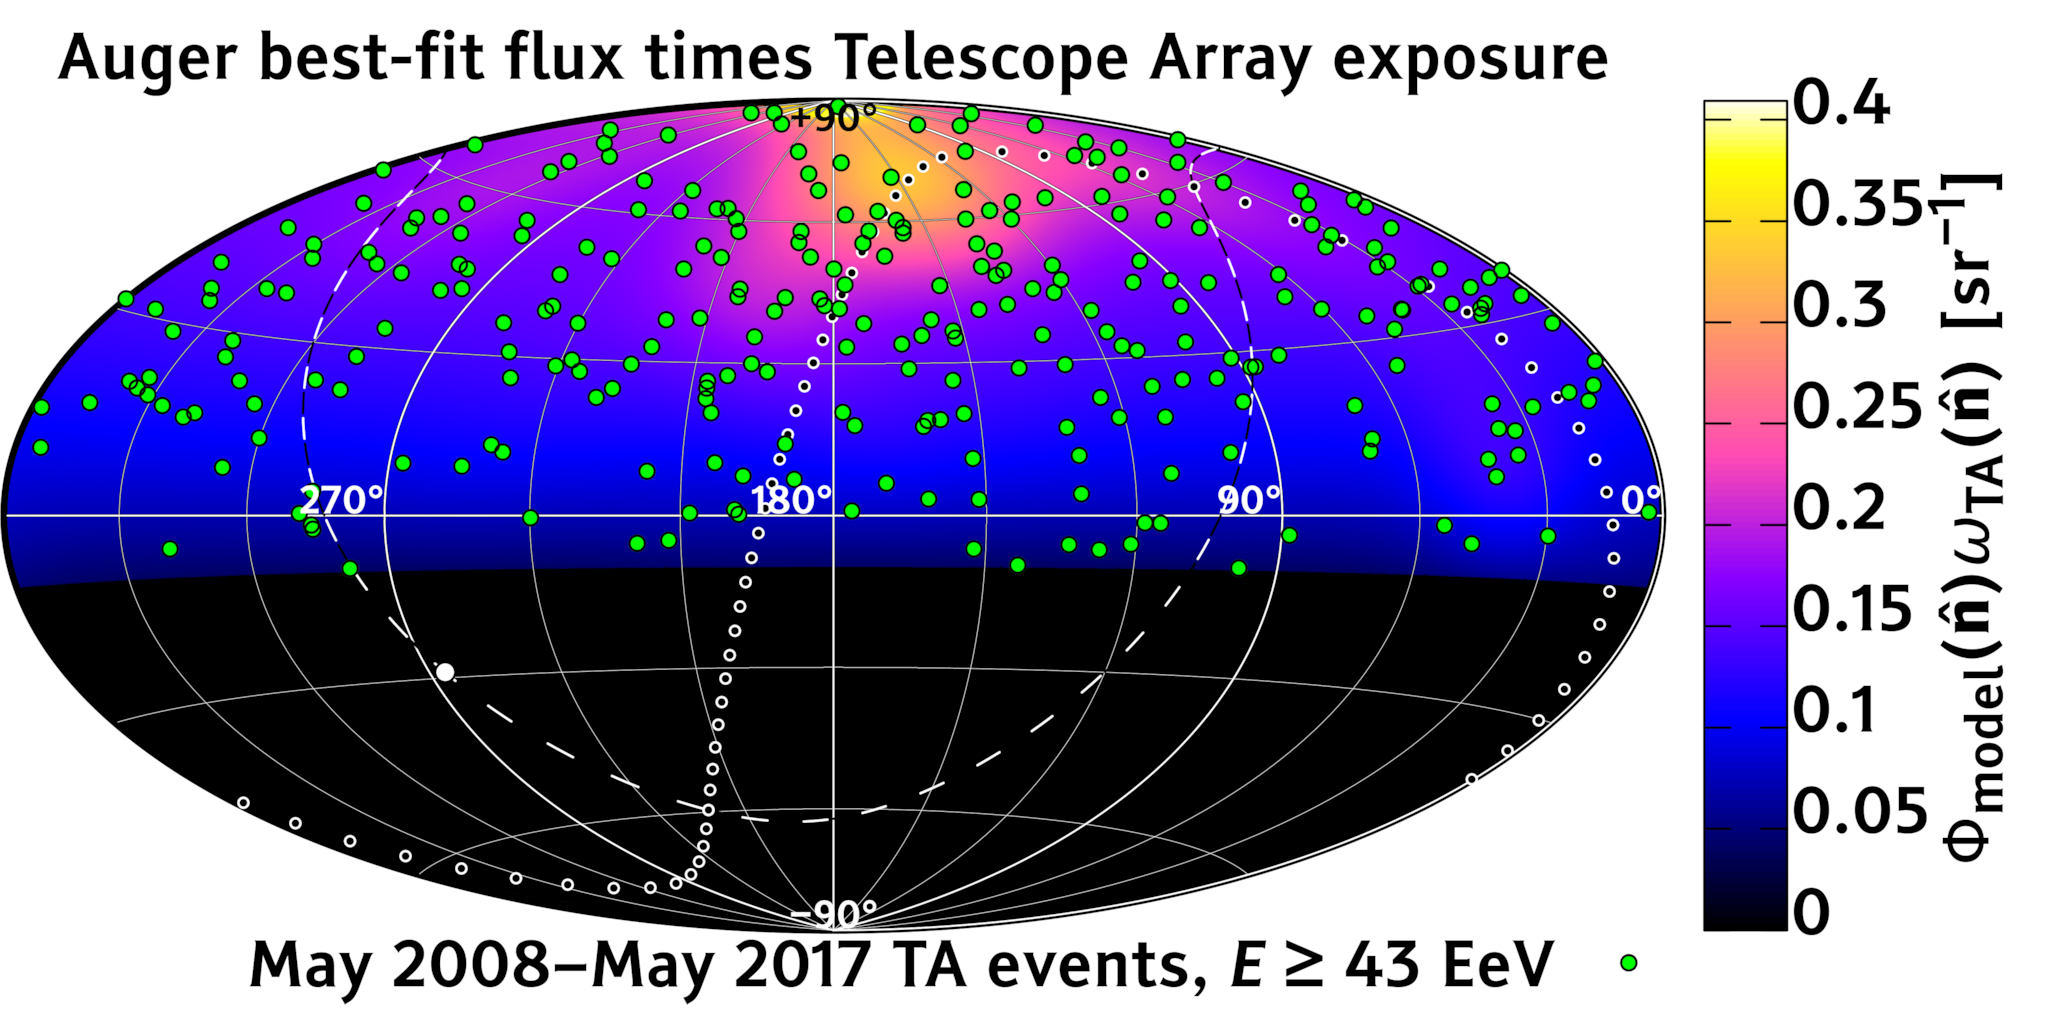
We used events collected by the Telescope Array ( N, W, 700 km2 area) in the 9-year period from May 2008 to May 2017. We used the same quality cuts as in Abbasi:2014lda , among which zenith angle and declination . The energy threshold we used is EeV, corresponding to Aab:2018chp ’s 39 EeV when taking into account the 10% mismatch in energy scales between the two experiments (Ivanov:2017juh, ). We neglected the measurement resolution ( on energy, on arrival directions) and assumed the detector to be fully efficient in the considered energy and zenith-angle range, calculating its exposure from purely geometrical considerations. This dataset includes 284 events, whose arrival directions are plotted in figure 3, along with the detector exposure multiplied by the model flux.
2.3 Result and discussion
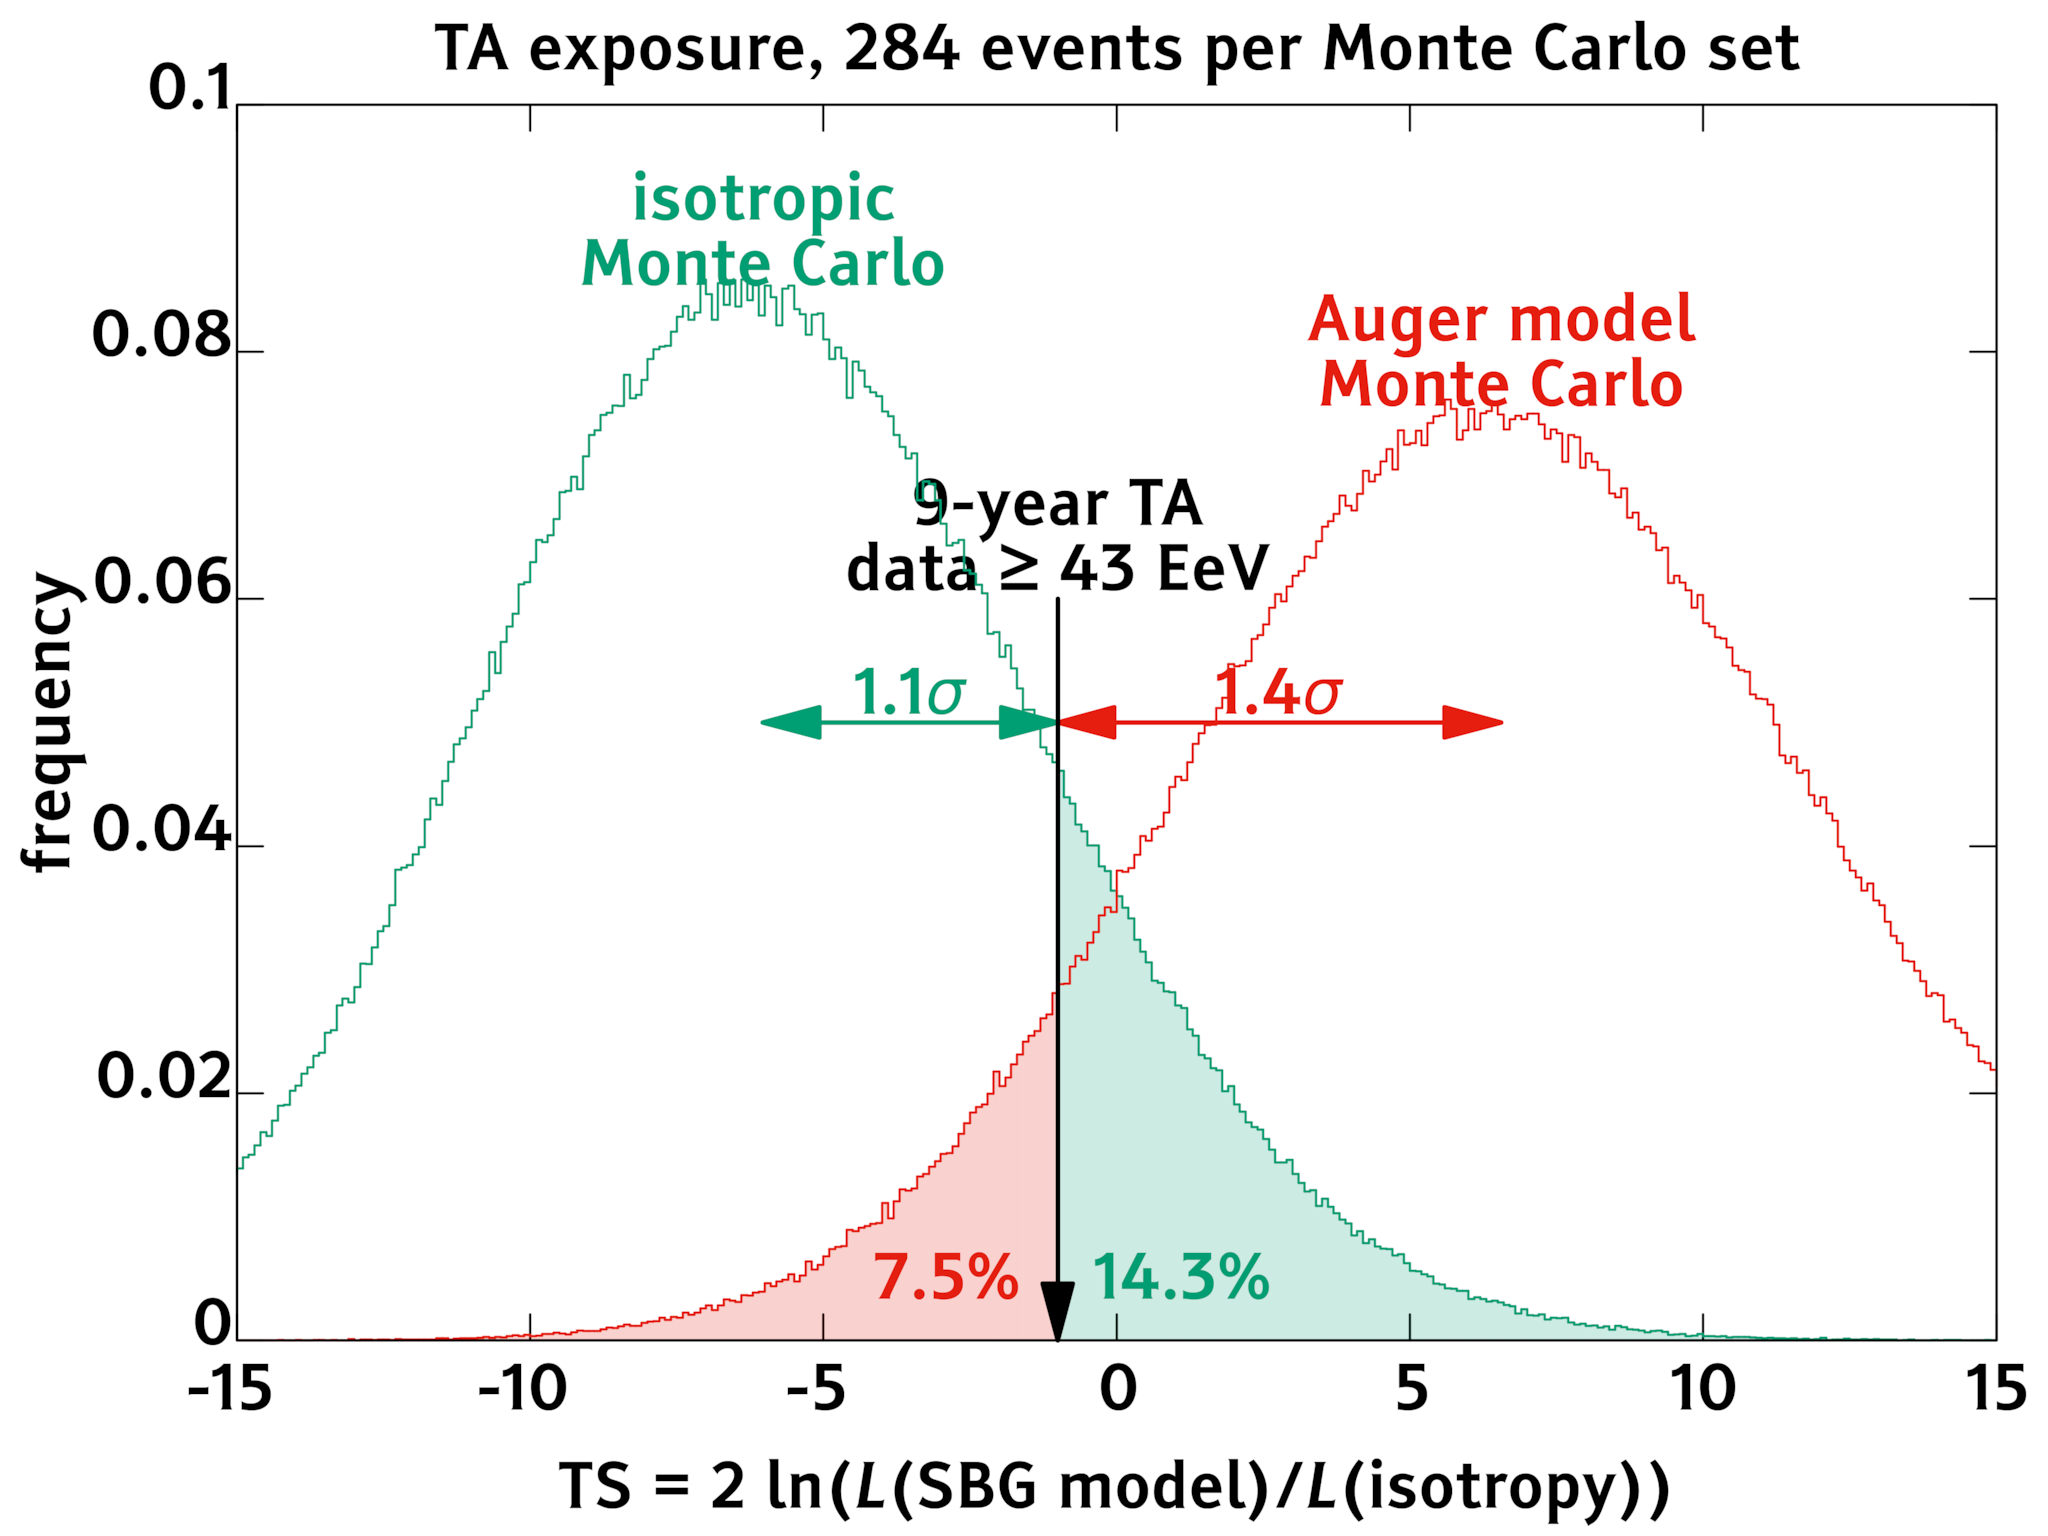
The test statistic value we obtained was , less than in 14.3% of the Monte Carlo simulations we made assuming an isotropic flux but more than in 7.5% of the simulations assuming the best-fit model from Aab:2018chp is correct (figure 4). This means our data are still insufficient to rule out either scenario.
The upcoming expansion of Telescope Array, TA4 (Kido, ), will increase its effective area by a factor of 4. If the data-taking of the TAx4 is started in 2019 as planned, by 2024 it will have collected the equivalent of 30 years of data with the current exposure, improving the statistical sensitivity proportionally to the square root of the number of events111The separation between the two TS distributions is proportional to the ratio between the standard deviation and the average of each distribution, the former scaling as and the latter as ., hence by a factor compared to the present work.
The present study does not include the Local Group objects SMC, LMC, M33 and M31, which were also listed in Ackermann:2012vca but in a separate table. Their intrinsic radio luminosities are very low compared to those in figure 1 (ranging from 0.19 to 6.2 Jy Mpc2), but due to their proximities (0.05 to 0.85 Mpc) their radio fluxes are very large (3.3 to 444 Jy), and would dominate the sky if the assumed proportionality between UHECR and radio luminosities also applied to them. A possible justification for omitting them is hypothesizing that UHECRs are only accelerated during transient events, the expected number of which is proportional to the star-formation rate with a coefficient of order –, such that Poissonian fluctuations in the brightest few selected objects in figure 1 are minor but most of the time there are zero events in the Local Group. One example of such a class of events is gamma-ray bursts from supernovae (one every years in M82, each producing UHECRs for years) (Biermann:2018clk, ).
References
- (1) A. Aab et al. (Pierre Auger), Astrophys. J. 853, L29 (2018), 1801.06160
- (2) M. Ackermann et al. (Fermi-LAT), Astrophys. J. 755, 164 (2012), 1206.1346
- (3) R.U. Abbasi et al. (Telescope Array Collab.), Astrophys. J. Lett. 867, L27 (2018), 1809.01573
- (4) R.U. Abbasi et al. (Telescope Array), Astrophys. J. 790, L21 (2014), 1404.5890
- (5) D. Ivanov (Pierre Auger, Telescope Array), PoS ICRC2017, 498 (2018)
- (6) E. Kido (Telescope Array), these proceedings (2018)
- (7) P.L. Biermann et al., Adv. Space Res. 62, 2773 (2018), 1803.10752