Synthesis of complex organic molecules in soft X-ray irradiated ices
Abstract
We study the chemical evolution of H2O:CO:NH3 ice mixtures irradiated with soft X-rays, in the range eV. We identify many nitrogen-bearing molecules such as e.g., OCN-, NH, HNCO, CH3CN, HCONH2, and NH2COCONH2. Several infrared features are compatible with glycine or its isomers.
During the irradiation, we detected through mass spectroscopy many species desorbing the ice. Such findings support either the infrared identifications and reveal less abundant species with not clear infrared features. Among them, has been ascribed to methyl isocyanate (CH3NCO), a molecule of prebiotic relevance, recently detected in protostellar environments.
During the warm up after the irradiation, several infrared features including 2168 cm-1 band of OCN-, 1690 cm-1 band of formamide, and the 1590 cm-1 band associated to three different species, HCOO-, CH3NH2 and NHCH2COO survive up to room temperature. Interestingly, many high masses have been also detected. Possible candidates are methyl-formate, (, HCOOCH3), ethanediamide (, NH2COCONH2), and N-acetyl-L-aspartic acid (). This latter species is compatible with the presence of the , 70 and 80 fragments.
Photo-desorption of organics is relevant for the detection of such species in the gas-phase of cold environments, where organic synthesis in ice mantles should dominate. We estimate the gas-phase enrichment of some selected species in the light of a protoplanetary disc model around young solar-type stars.
1 Introduction
Ice mantles covering cold dust particles in dense clouds and circumstellar regions are laboratories for chemistry giving rise to a plethora of chemical species (Herbst & van Dishoeck, 2009). Processing of space ice analogues with ultraviolet photons (Bernstein et al., 1995; Muñoz-Caro et al., 2002; Bernstein et al., 2002; Muñoz-Caro & Schutte, 2003; Meierhenrich et al., 2004; Nuevo et al., 2006; Chen et al., 2007; de Marcellus et al., 2011; Vinogradoff et al., 2013; Muñoz-Caro & Dartois, 2013; Meinert et al., 2016; Oba et al., 2016), and energetic particles (Palumbo et al., 1998; Loeffler et al., 2005; Sicilia et al., 2012; Islam et al., 2014; Muñoz-Caro et al., 2014; Jones et al., 2014; Förstel et al., 2016) have widely explored the cold solid state synthesis of complex organic molecules. Formation routes, mechanisms responsible for the production of new species, and efficiency of the different energetic processing have contributed to the interpretation of the observed interstellar ice features (Boogert et al., 2015). More recently X-ray processing of ice analogues has been studied given its relevance in circumstellar discs around young stars (Ciaravella et al., 2010; Andrade et al., 2010; Ciaravella et al., 2012; Jiménez-Escobar et al., 2012; Chen et al., 2013; Pilling & Bergantini, 2015; Ciaravella et al., 2016; Jiménez-Escobar et al., 2016, 2018). In solar type stars X-ray emission dominates over far extreme ultraviolet emissions for almost one billion year (Ribas et al., 2005) penetrating through the disc and reaching inner regions otherwise forbidden to less energetic photons (e.g., Walsh et al. 2012).
In this paper we present evidence for the synthesis of N-bearing organic molecules induced by soft X-rays in an H2O:CO:NH3 (1:0.9:0.7) ice mixture. The photo-desorption of a similar mixture is discussed in Jiménez-Escobar et al. (2018).
The photochemistry of ices containing ammonia was first studied in astrophysically relevant ice mixtures by Hagen et al. (1979), who irradiated a CO ice containing traces of water, ammonia and carbon dioxide. This early investigation and others that followed – changing the initial composition, the abundance ratios, and the energy source – had as major outcomes the formations of XCN compounds (in particular OCN-), and moderately complex amino containing molecules, which may be precursors for amino acids. The largest infrared detected molecule was (Muñoz-Caro & Schutte, 2003). Subsequently, two independent studies formed amino acids by zapping dirty water ices with ultraviolet radiation (Bernstein et al., 2002; Muñoz-Caro et al., 2002). The ices contained a fairly high amount of ammonia, methanol and hydrogen cyanide. In addition, the processing of nitrogen bearing mixtures produced species with the peptide moiety, such e.g., isocyanic acid, HNCO, the smallest stable molecule containing all four primary biogenic elements, and formamide, (e.g., Demyk et al. 1998; Jones et al. 2011; Jiménez-Escobar et al. 2014; Kaňuchová et al. 2016). Among the energy sources available in space, ultraviolet radiation and cosmic rays (e.g., Hudson & Moore 2000; Pilling et al. 2010) have been the most exploited in this kind of studies.
There are certainly differences in the way different energy sources affect the chemistry. Depending on the incident photon energy, different set of orbitals become energetically possible. Soft X-rays are particularly effective in ionizing core levels. If the core-level of an atom or a molecule is photoionized, the ionic state is highly unstable and will decay to a state of lower energy. In (relatively) light atoms (), when an electron is removed from the atom core level (photo-electron), a higher energy level electron may fall in the vacancy. The excess energy involved causes the emission from the atom of another electron known as Auger electron. The kinetic energy of the Auger electron is defined by the difference between the intermediate (core-ionized state) and final states. During the photoexcitation of a core-level, the electron is first promoted to an unoccupied orbital, with resulting core-hole filled by an electron as in the normal Auger case. Then, an Auger electron is released with an energy corresponding to the excess energy of the transition.
The ejected electrons interact with the ice, producing a chain of (valence orbital) ionizations, freeing gradually other electrons of increasingly smaller energy, that, until they can, keep ionizing the ice material. This leads to the fragmentation of the ice molecules with a creation of a large number of ions and radicals, through a number of processes such as e.g., dissociative electron attachment, in which a molecule captures a low-energy electron in an excited resonant state, forming a transient molecular anion, that eventually dissociates (e.g., Munro et al. 2012).
We describe the experiment in Section 2. We present and discuss the results in Section 3: irradiation products, the warm up phase followed through infrared and mass spectroscopy, and the refractory residue left on the window after the warm up of the sample to room temperature. The conclusions and the astrophysical implications are in Section 4.
2 Experiment
The experiments were carried out in the Interstellar Photo-process System (IPS), an ultrahigh vacuum (UHV) chamber of base pressure mbar. A mid-infrared Fourier Transform Infrared ABB FTLA-2000-104 spectrometer equipped with a mercury-cadmium-telluride infrared detector records infrared spectra in transmission of the ice sample. A Quadrupole Mass Spectrometer (QMS) in the amu range (0.5 amu resolution) were used to monitor the ice and the composition of the gas in the chamber during the whole experiment. The gas line system baked out at C to eliminate organic and water contamination reaches a minimum pressure of mbar before preparing the gas mixture for the experiments. For a detailed description of the IPS facility see Chen et al. (2014). As X-rays source we used the Spherical Grating Monochromator beamline BL08B at National Synchrotron Radiation Research Center (NSRRC, Taiwan) covering photon energies from 250 to 1250 eV, whose spectrum is in Figure 1. During the experiments, X-ray photon flux is monitored by an in-line nickel mesh (about 90% optical transmission), calibrated by a traceable photodiode (International Radiation Detectors, Inc.).
A KBr window cooled to 13 K was used as substrate for a H2O:CO:NH3 (1:0.9:0.7) ice mixture. Such a mixture was irradiated with the soft X-ray spectrum of Figure 1 for a total of 120 min. In the mixture we used H2O from Merck, GC-mass grade, freeze-pump-thaw degassing more than 3 times; CO and NH3 from Matheson, 99.99% purity. The column densities of the ice components were 8.2 1017 molecules cm-2 for H2O, derived using the 5018 cm-1 band with a band strength cm molecule-1 (Gerakines et al., 2005), molecules cm-2 for CO using the band at 2142 cm-1 with cm molecule-1 (Jiang et al., 1975), and molecules cm-2 for NH3 using the band at 1112 cm-1 with cm molecule-1 (Sandford & Allamandola, 1993). The total column density of the mixture is molecules cm-2.
Before and after irradiation, infrared spectra were collected with a resolution of 1, 2, and 4 cm-1. The irradiation was stopped ten times (0.5, 1, 5, 10, 20, 40, 60, 80, 100, 120 min) and infrared spectra were taken with a resolution of 2 cm-1. end of the irradiation, the ice was heated up to room temperature at a rate of 2 K minute-1. During the warm-up, infrared spectra were acquired every 10 K with a resolution of 4 cm-1. The QMS was scanning masses from 1 to 200 amu during the whole experiment. We also ran a blank experiment using a similar ice mixture and no irradiation.

3 Results and Discussion
3.1 Irradiation and Products
During the irradiation infrared spectra and mass spectra of the photo-desorbing species have been recorded. It is worthy to mention that both techniques have a degree of degeneracy. Blending of the infrared features of different species prevent in many case a unique identification. Mass spectra of less abundant and/or heavier species are more difficult to detect. We used infrared and mass spectra to identify the products and whenever necessary we based our identification on the most probable formation routes during the irradiation and the warm up.
The primary effect of the X-rays is the core ionization of the atoms in the molecule as
| (1) |
(Mase et al., 1998), and
| (2) |
(Benndorf et al., 1999). The star symbol (*) indicates an excited state. In a liquid solution of ammonia and water a nitrogen 1s core-level ionization results in
| (3) |
(Unger et al., 2015). In the case of N excitation to the molecular orbital, the core-excited molecule de-excites primarily via resonant Auger decay into
| (4) |
The ejected primary photo-electrons, and Auger electrons, will further interact with the ice, giving rise to a cascade of secondary electrons that will drive the chemistry.
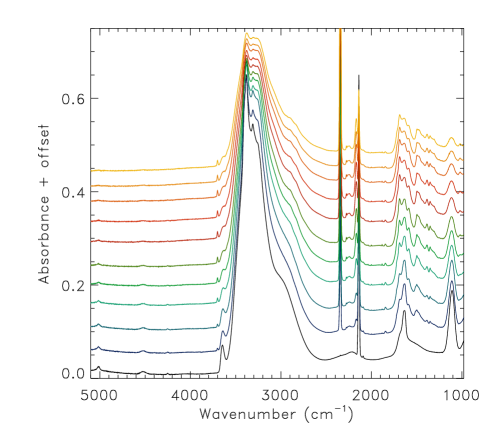
In Figure 2 are shown the infrared spectra of the mixture sample and those taken at different steps during the irradiation. From Figure 2, the range between cm-1 is the richest in new features. A close-up view of this portion along with the region between cm-1 is reported in Figure 3, in which we marked the most abundant species (see Table 1). The spectral region from 1800 to 1000 cm-1 is dominated by NH, -NH, and -COO- stretchings and C-H bending, found in a large variety of organic molecules, from simplest compounds to more complex molecules such as amino acids.

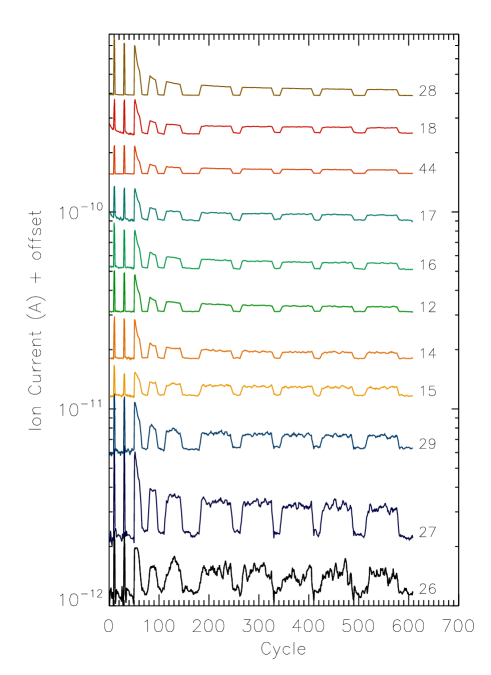
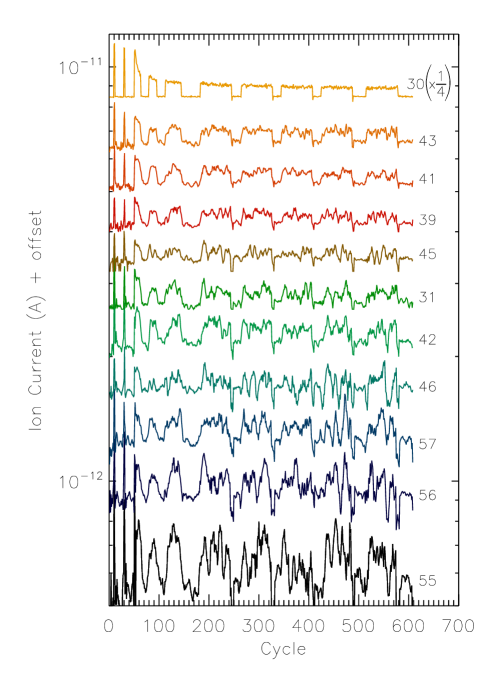
In Figure 4 are shown the mass spectra of the main fragments desorbing during the irradiation. Along with the masses of the parent molecules (CO , H2O and NH3 ) and their main fragments (having 10 desorption peaks as many as the number of the irradiation steps), we also detected many other molecules showing the same pattern. Although more noisy, less abundant species/fragments show similar pattern.
|
The majority of the infrared features appear after the first 30 s irradiation. CO2 (2342 cm-1, ) is the most abundant product. HNCO (2168 cm-1) is a second generation product formed by direct reaction of CO with NH2 produced after the direct interaction of NH3 with X-ray (reaction 3, see also Hudson & Moore 2000)
| (5) |
OCN- (2168 cm-1) arises from the reaction between NH3 and HNCO
| (6) |
The cyanate ion has been detected in many experiments of ice irradiation and radiolysis (Gerakines et al., 2004; van Broekhuizen et al., 2005; Chen et al., 2007; Pilling et al., 2010), and also observed in many astrophysical sources (Öberg et al., 2011; Aikawa et al., 2012). The features at 2261 and 2242 cm-1 are associated to HNCO (Raunier et al., 2004). The detection of mass during the irradiation and the warm up support the presence of this species. In this region of the spectrum only a band at 2233 cm-1 has been detected in 46 MeV Ni ions irradiation of a similar mixture by Pilling et al. (2010), and has been assigned to N2O.
At 2260 cm-1 there is the CN-stretch feature of acetonitrile (CH3CN) (Mencos & Krim, 2016). Mass spectra of have been detected during irradiation and warm up. Such mass its is also associated to an isomer of acetonitrile CH2CNH compatible with the infrared feature at 2038 cm-1 as listed in Table 1. Both species have been detected in space (McGuire, 2018).
The band at 1690 cm-1 and the shoulder at 2900 cm-1 can be associated to formamide, HCONH2 (see Figure 3). The other bands of formamide at 3368 and 3181 (Brucato et al., 2006) are blended under the broad feature of . Photo-desorption of mass , although is mostly associated to , might have been contributed by formamide. HCONH2 can be formed by reaction of NH2 with HCO
| (7) |
HCO is easily formed by the interaction of CO with H formed during irradiation. For further details see the chemical reaction scheme in Hudson & Moore (2000). The feature at 1495 cm-1, is assigned to NH and/or NH2. Their formation takes place via NH3 photolysis and subsequent addition of H+ produced by either H2O or NH3 reactions in equations 1 and 3 (Pilling et al., 2010; Hudson & Moore, 2000), or other channels provided by the secondary electron cascade
| (8) |
Another possible proton donor could the hydronium ion H3O+, how it occurs in liquid solution.
The absorption at 1590 cm-1 is widely contributed by the vibrational modes of the asymmetric stretching of HCOO- and the -NH2 scissor of species such as CH3NH2 () (Holtom et al., 2005), an intermediate in the amino acids formation (Woon, 2002) or even an amino acid such as glycine (Maté et al., 2018). The features at 1495 and 1590 together with the feature at 2900 cm-1 are also associated to the zwitterionic , NHCH2COO- (Hudson & Moore, 2000), or the neutral form of glycine, NH2CH2COOH (Gómez-Zavaglia & Fausto, 2003; Maté et al., 2011). Formation of glycine is also supported by QMS detection of desorbing in the range K (see Figure 9) during the warm-up. Glycine formation in ice mixtures have been inferred in ion irradiation (Pilling et al., 2010). However, as remarked by Oba et al. (2016) in ultraviolet-irradiated ice analogs, glycine is not a major component of , with many other isomers as methylcarbamic acid, CH3NHCOOH, and glycolamide, NH2COCH2OH, that dominate.
Table 1 summarizes all the infrared features identified in the spectra, their assignments, and for some species the band strengths. In Figure 5 we report the column densities of H2O, CO and NH3 and four products CO2 2342 cm-1, OCN- 2168 cm-1, HCO 1848 cm-1 and HNCO 2242, 2261 cm-1. Two Gaussian fitting is used to compute the integrated absorbances of CO and OCN-. HNCO is the sum of the 2241 and 2261 cm-1 bands (Raunier et al., 2004). Three Gaussian fitting needs to separate the bands of HNCO from at 2277 cm-1.
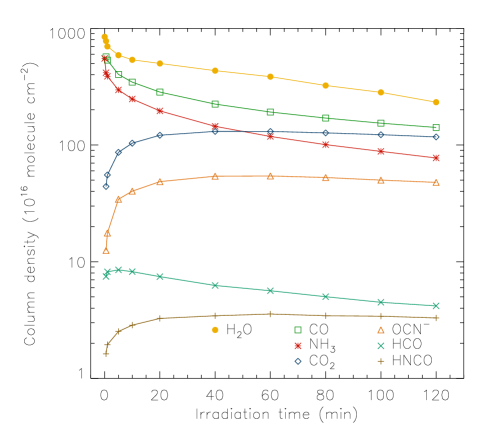
At the end of the irradiation % of the H2O, % of the CO and % of NH3 have been destroyed. CO2, OCN- and HNCO increase for the first 60 min irradiation. OCN- species is always less abundant than CO2. HCO increases during the first 5 min and then decreases. This species was not detected in heavy ions irradiation (Pilling et al., 2010).
| Band | Assignment | Band Strength |
|---|---|---|
| (cm-1) | (cm molec-1) | |
| 3700 | CO2 | |
| 3380 | NH3 | |
| 2900 | HCONH | |
| 2834 | ?? weak | |
| 2342 | CO2 | 7.610-17b |
| 2277 | 13CO2 | 7.810-17c |
| 2261 | HNCO, CH3CNd | 7.2 10-17e |
| 2242 | HNCO, N2O (?) | |
| 2168 | OCN- | 1.310-16c |
| 2139 | CO | 1.110-17 |
| 2038 | C, CH2CNHg,HNCh | |
| 2001 | C2Oi, CNNCj | |
| 1882 | CO, NCOj, NOX | 4.510-18j |
| 1848 | HCOm, HOCO, N2O | 9.610-18m |
| 1841 | HCO, HOCO | |
| 1717 | HCOOCH, H2CO | 4.910-17n |
| HCOOHu, H2CO3,NH2CH2COOH-o | ||
| 1690 | HCONH | |
| 1638 | HCOOHu, NH3, N2O | |
| 1590 | HCOO-, CH3NH, NHCH2COO-q | |
| 1495 | NH, NH, NH, NHCH2COO-q | |
| 1478 | NH, NO(?) | |
| 1387 | -COO-,HCONH | |
| 1383 | ?? | |
| 1352 | CH3CHO, HCOO-, NHCH2COO- | |
| 1307 | CH4, N2O, N2O,HCONH2? | |
| 1250 | NH2CH2COOHo | |
| 1112 | NH …. | 1.710-17t |
| 1021 | CH3OHb, O3? | 1.810-17b |
Note. — aBrucato et al. (2006), bGerakines et al. (1996), cvan Broekhuizen et al. (2004), dMencos & Krim (2016), e Theule et al. (2011), fHinkle et al. (1988), gMencos & Krim (2016), hMencos & Krim (2018), iJiménez-Escobar et al. (2016), jSicilia et al. (2012), kChen et al. (2015), lJamieson et al. (2005), m HCO; Milligan & Jacox (1971), nModica & Palumbo (2010), oGómez-Zavaglia & Fausto (2003), pVarietti & Pimentel (1971), qHoltom et al. (2005), rZheng et al. (2008), sPilling et al. (2010), tSandford & Allamandola (1993) uBisschop et al. (2007)
During the irradiation, thanks to its high sensitivity, the QMS detected masses of low abundant species that have no clear infrared features. As an example , 56 and 57 cannot be related to species listed in Table 1. A promising candidate for is methane isocyanate (CH3NCO). The most intense feature of this species at 2278 cm-1 (Maté et al., 2017) overlaps with the 13CO2. However the detections of along with the two fragments CH2NCO () and CHNCO () support the presence of such species. This molecule has been recently detected in a low-mass solar-type protostellar binary (Martín-Doménech et al., 2017; Ligterink et al., 2017).
Following the analysis by Jiménez-Escobar et al. (2018) we identified the species associated to the masses detected during the irradiation, see Table 2. In the same table we also list the masses detected during the subsequent warm-up phase along with their possible candidate species.
| Irrad. | Warmup | Fragments | |
|---|---|---|---|
| 12 | y | y | C |
| 13 | - | y | 13C |
| 14 | y | y | N, CH2 |
| 15 | y | y | HN, CH3 |
| 16 | y | y | O, NH2, CH4 |
| 17 | y | y | HO, NH3 |
| 18 | y | y | H2O |
| 25 | - | y | HC2 |
| 26 | y | y | CN |
| 27 | y | y | HCN |
| 28 | y | y | CO, N2 |
| 29 | y | y | HCO, 13CO, CH3N |
| 30 | y | y | H2CO, CH3NH, NO |
| 31 | y | y | CH3O,CH3NH2 |
| 32 | - | y | CH3OH, O2 |
| 33 | - | y | NH2OH |
| 34 | - | y | H2O2 |
| 36 | - | y | ? |
| 38 | - | y | ? |
| 39 | y | y | CHCN |
| 40 | - | y | CH2CN |
| 41 | y | y | CH3CN, CH2CNH, CHCO |
| 42 | y | y | NCO, CH2CO |
| 43 | y | y | HNCO, CH3CO |
| 44 | y | y | CO2, N2O, CONH2, CH3CHO |
| 45 | y | y | 13CO2, HCONH2, HCOO |
| 46 | y | y | HCOOH |
| 47 | - | y | HNO2? |
| 54 | - | y | ? |
| 55 | y | y | CHNCO |
| 56 | y | y | CH2NCO |
| 57 | y | y | CH3NCO |
| 58 | - | y | HCOHCO |
| 59 | - | y | C2H5NO |
| 60 | - | y | HCOOCH3, NH2CONH2 |
| 61 | - | y | CH3NO2 |
| 70 | - | y | ? |
| 71 | - | y | CH3CH2NCO |
| 73 | - | y | HCONHHCO, HCOCONH2 |
| 75 | - | y | NH2CH2COOH |
| 88 | - | y | NH2COCONH2, NH2CONHCHO |
| 175 | - | y | C6H9NO5 |
3.2 Warm Up: Infrared and Mass Spectra
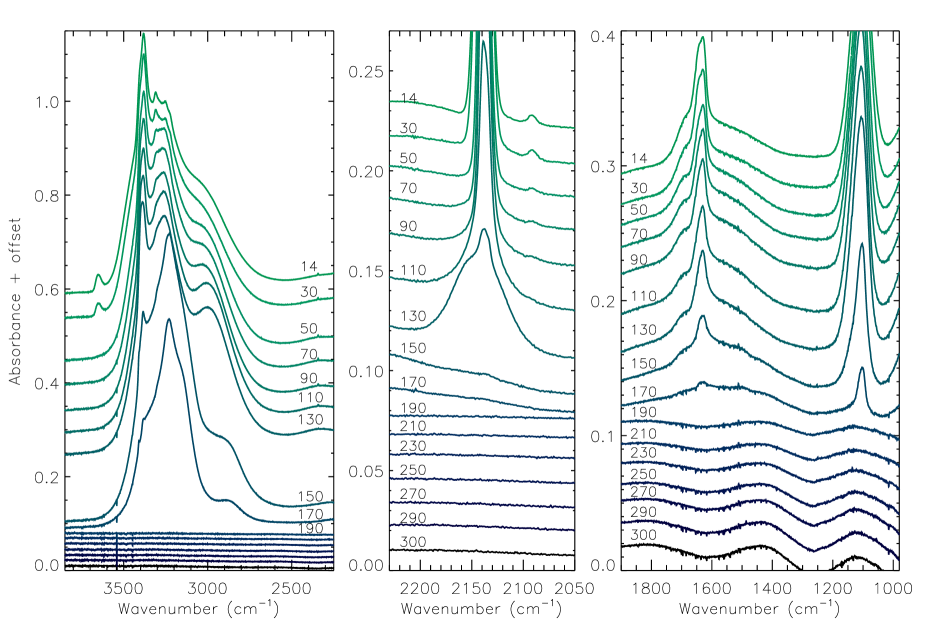
At the end of the irradiation the ice has been warmed up at a rate of 2 K/min. In Figure 6 are reported the infrared spectra of the ice at different temperatures during this phase. As comparison we report similar spectra for the blank experiment in Figure 7.
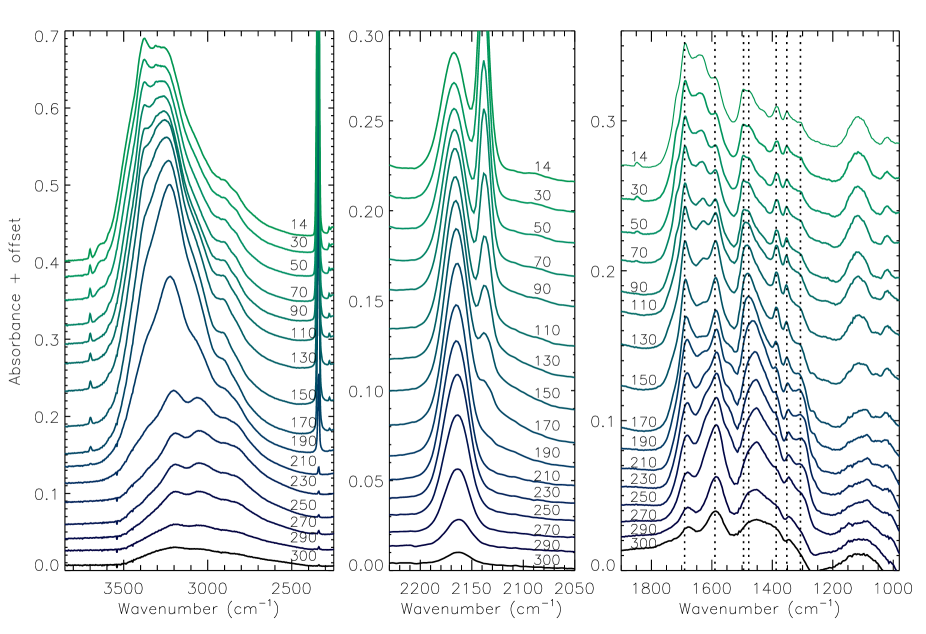
The desorption temperatures of species in the mixture are generally higher than those in single component ices (Martín-Doménech et al., 2014). CO band at 2145 cm-1 disappears completely between 170 and 190 K in the irradiated sample, and between 130 and 150 K in the blank. In a thick ( cm-2) pure CO ice such infrared feature disappears between 40 and 50 K. As listed in Table 2 many masses were detected by the QMS during this phase.
OCN- at 2168 cm-1 is still present at 300 K, its column density as function of the ice temperature is shown in Figure 8. The column density of the HNCO in the same figure is, as in Figure 5, the sum of the 2241 and 2261 cm-1 bands. Although band strengths may change with temperature (e.g. Luna et al. 2018), no measurements on either OCN- and HNCO are available. Data reported in the Figure 8 are thus obtained taken the band strengths constant.
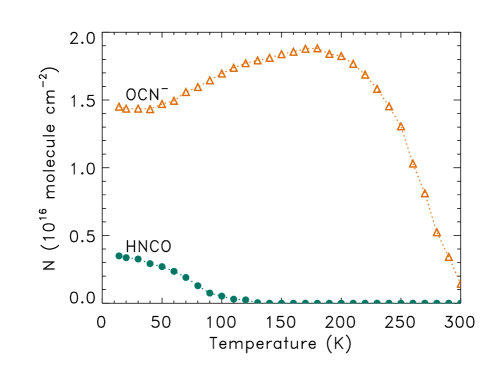
The band strengths at 15 K of 1.3 10-16 cm molecule-1 for OCN- (van Broekhuizen et al., 2004), and 7.8 10-17 cm molecule-1 for HNCO (van Broekhuizen et al., 2004) have been used. During the warm up OCN- increases from 50 up to 170 K, then starts decreasing. Such increase could be justified by a further production of OCN- through the reaction . In agreement with the infrared spectra, starting from 170 K the ion current of mass increases reaching a broad peak between 240 and 270 K, with a tail extending up to 300 K (see Figure 9).
As mentioned in the previous section the infrared feature at 2260 cm-1 is compatible with acetonitrile CH3CN. During the warm up associated to such species or its isomer CH2CNH is detected along with , see second panel from the top in Figure 9. is the largest fragments after for both CH3CN and CH2CNH. Above 200 K the profiles of such masses are very similar supporting the identification of the species.
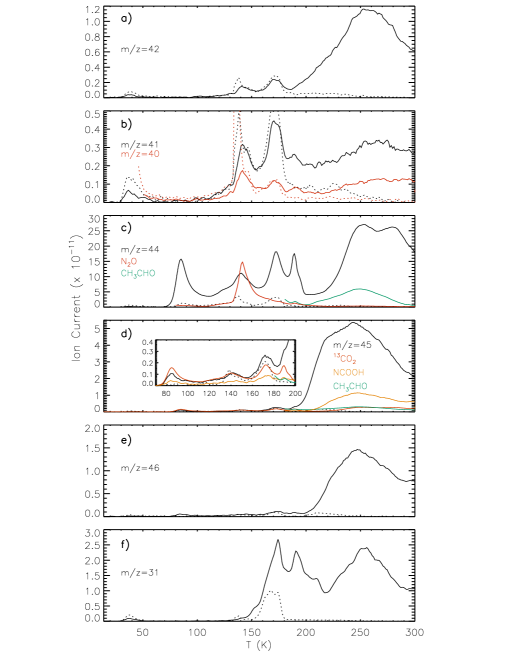
The column density of CO2 (2342 cm-1) shown in Figure 10 as function of the temperature during the warm up phase indicates that about 90% of CO2 desorbs between 150 and 190 K (see also Figure 6). Although the desorption peak of a pure CO2 is around 85 K, a fraction of this molecule may be retained in the ice matrix, and co-desorbed with others abundant species such as water. In Figure 9 the mass spectrum of shows a series of desorption peaks between 80 and 300 K. While the peaks between 80 and 200 K are in agreement with desorption of CO2, as shown by the infrared spectra in Figure 6 and the column density in Figure 10, the broad and intense peak between 220 and 300 K suggests a contribution to from fragmentation of larger compounds in the ice.

An upper limit to the contribution of N2O to can be estimated using a fragment of either NH3 and N2. Assuming that is only associated to the fragmentation of N2O, we obtain a negligible contribution of N2O to (see red curve in the third panel from the top of Figure 9).
One of the carrier of the band at 1352 cm-1 is CH3CHO (). of this species is 83% of its main mass . Even assuming that at high temperature is only related to CH3CHO, an upper limit to its contribution is given by the green curve shown in panel c) of Figure 9.
Several bands in the range in cm-1 of the infrared spectra survive up to room temperature. In particular, the bands at 1690 cm-1 of formamide is clearly present in the infrared spectra at 300 K. The associate mass in panel d) of Figure 9 shows a series of peaks within the temperature range. The red curve in the panel is the contribution of 13CO2 to , computed as the 10% of . Assuming that CO2 is the only carrier of , its isotopologue 13CO2 can at most justify only below 200 K. Pure formamide in thick ice has a desorption peak at 220 K that well fit with the broad feature between 200 and 300 K. In this range acetic acid (HCOOH - yellow curve) and acetaldehyde (CH3CHO - green curve) may also contribute to this mass.
The band at 1590 cm-1 is associated to three different species: HCOO- that most probably desorbs after recombination with H as , see panel e); CH3NH2 (), see panel f); NHCH2COO- (). This band is still present in the infrared spectra at 300 K (Figure 7). These masses shown in Figure 9 and that of NHCH2COO- in Figure 11 have desorption peaks extending up to 300 K.
The QMS is much more sensitive than the infrared spectrometer and some of the detected masses during the warm up have no clear features in the infrared spectra. Complex organic molecules produced in the experiment have generally low abundances, share similar fragments and are therefore more challenging to identify. Masses such as , 29, 30, 31, 32 and 44 are common to many species and their intensities at high temperature require many contributors. For such species to be identified, we require the presence of the expected main mass fragments, and the existence of a consistent reaction channel in the ice.
Polymerization of two HCO⋅ radicals in the mixture will bring to glyoxal species (HCOHCO, )
| (9) |
During warm-up, show a desorption peak around 260 K (see Figure 11). Other fragments of such species, i.e. , 31 and 30 are detected co-desorbing with , support the presence of glyoxal.
Vacuum ultraviolet irradiation experiments of CH4:HNCO (Ligterink et al., 2018) produce the desorption of a fragment with at 220 K, that have been assigned to several candidates, the most probable being propionamide, CH3CH2C(O)NH2.
In our experiments desorbs at higher temperatures, 270 K. Considering the different ice composition and thus, the different first generation products such as H2CO and HCONH2, is readily explained by further energetic processing yielding a second generation of radicals
| (10) |
| (11) |
Radical reactions of this species are among the most important routes in producing new molecules of astrobiological interest.
As mentioned in Section 3.1 and Table 1 several infrared features are compatible with glycine or other isomers. The thermal desorption of further support the infrared identification. As shown in Figure 11 this mass although very weak shows a desorption from 250 to 300K. Its main fragment , presenting a desorption tail extending up to room temperature, supports this assignment.
As the chemical complexity induced by energetic processing increases, molecules with can be produced by reactions involving second generation radicals. The reaction between two formamide radicals bring to ethanediamide, NH2COCONH2
| (12) |
Ethanediamide desorption is supported by detection of the fragment NH2CONH2 (). As Figure 11 shows the two masses have similar profile. Since the ratio is much larger than the value of 1.2 expected for ethanediamide, contributions from other species (e.g., urea) are required. The infrared bands of urea could be blended with the features around 1150 and 1500 cm-1. Reaction of urea radical with HCO produces formylurea (NH2CONHCHO, ),
| (13) |
Methyl-formate, HCOOCH3, is another candidate for . This species as shown in Table 1 it could contribute to the 1717 cm-1 feature. Its main fragments , 32 and 29 are observed desorbing at the same temperature.

The largest mass detected during the warm up is . Such a large mass is difficult to identify. A possible candidate for could be N-acetyl-L-aspartic acid. Such species implies the presence of aspartic acid and other amino acids like alanine. Aspartic acid may in fact be present given the detection of his main fragments , 70 and 43. Alanine has as main fragment , a mass common to many species. A more reliable identification of molecules having such large mass requires the use of other analytical techniques, and/or the characterization of the residue, that is beyond the scope of this work.
Table 2 summarize the species identified as carriers of the observed mass spectra.
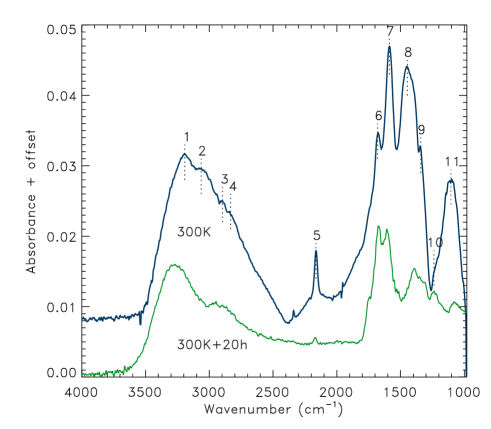
3.3 The Refractory Residue
Infrared spectra of the residue are shown in Figure 12. The two spectra were obtained at 300 K, the first just after the warm-up and the second one day after keeping the window for 20 h in the vacuum chamber. Although the spectrum after 20 h is significantly reduced, in the range cm-1 all the features are still present. The broad band around 3000 cm-1 is shared by species containing the hydroxyl functional group, such as alcohols and carboxylic acids frequently present in processed ice residues. After 20 h, this band displays a clear tail that extends beyond 2500 cm-1, suggesting the presence of carboxylic acids. Indeed, alcohols are expected to desorb gradually at room temperature, which likely accounts for the decrease of the band around 3000 cm-1 and the band peaking around 1100 cm-1. The feature at 2165 cm-1 typical of the C=N stretch in OCN- still present after 20 h.
The COO- feature at 1588 cm-1 typical of carboxylic acid salts is significantly reduced after 20 h, as compared to the 1679 cm-1. The C=O stretching at 1679 cm-1 suggests the presence of amides.
Hexamethylenetetramine (HMT) in the spectrum corresponds to the bands at 2897, 2832, and 1238 cm-1. The main HMT band peaks around 1007 cm-1, in this spectrum it would be a small narrow band superposed on the larger band that appears at this wavenumber. In ultraviolet experiments with ice of the present composition, HMT is very minor species, that makes sense because HMT has 6 CH2 groups, and CO is not a good precursor; the presence of methanol would be much more favorable for its formation. In addition, the formaldehyde precursor of HMT is more efficently formed when methanol is included in the ice. Furthermore, HMT forms at room temperature, and it would not be expected in the fresh residue. The feature at cm-1 that shifts at lower wavenumber in the spectrum after 20 h is associated to HOCH2COO− (Muñoz-Caro & Schutte, 2003). The bands identified in the infrared spectrum of the residue are in Table 3.
| Label | Band | Assignment | Ref. |
|---|---|---|---|
| (cm-1) | |||
| 1 | 3192 | NH | 1 |
| 2 | 3063 | ?? | |
| 3 | 2897 | HMT? | 1 |
| 4 | 2832 | HMT,NH | 1 |
| 5 | 2165 | OCN- | 2 |
| 6 | 1679 | Amides | 1,2 |
| 7 | 1588 | COO- str. in carboxylic acid salts | 1,2 |
| 8 | 1447 | NH | 1 |
| 9 | 1341 | COO- str. in carboxylic acid salts | 1,2 |
| 10 | 1238 | HMT | 1 |
| 11 | 1105 | HOCH2COO− | 1 |
| m/z | Molecule | molecules/photon |
|---|---|---|
| 31 | CH3NH2 | 1.94 10-5 |
| 41 | CH3CN | 3.62 10-5 |
| 43 | HNCO | 3.17 10-5 |
| 57 | CH3NCO | 2.03 10-5 |
4 Conclusions and Astrophysical Implications
We have studied the chemical evolution induced by soft X-rays in the range eV in a mixture containing nitrogen, H2O:CO:NH3. Among the products of the irradiation there are many N-bearing molecules such as e.g., OCN- (2168 cm-1), HNCO and CH3CN (2261 cm-1), HCONH2 (1690 cm-1), and NH (1478 cm-1). Several features of the irradiated mixture are compatible with the presence of glycine or its isomers (see e.g., Oba et al. 2016). The products detected in the infrared spectra are common to other irradiation experiments of similar mixtures with ultraviolet (Hudson & Moore, 2000) and energetic particles (Hudson & Moore, 2000; Pilling et al., 2010).
Detection of several masses in gas-phase either during the irradiation and the warm up revealed a number of complex organics with not clear features in the infrared spectra of the irradiated ice. Photo- and thermal-desorptions are of great interest as they offer the possibility that complex organics formed in solid phase can enrich the gas-phase molecular distribution.
Acetonitrile CH3CN detected through the 2260 cm-1 infrared feature and has been observed in Sgr B2 and Sgr A (Solomon et al., 1971) while its isomer CH2CN (compatible with 2038 cm-1) in Sgr B2 (Lovas et al., 2006). More recently methyl cyanide has been observed in a protoplanetary disc around MWC480 by Öberg et al. (2015).
Formamide HCONH2 is also produced and its mass () is among the most intense during thermal desorption. Formamide with its peptide moiety may be a building block for species of astrobiological interest such as sugars and amino-acids. This species has been identified in hot cores, and external galaxies (cf. McGuire 2018), and also around the SVS13-A protostar by Bianchi et al. (2019). These authors also detected acetaldehyde (CH3CHO), methanol (CH3OH), and methyl formate (HCOOCH3), all of them produced in the present experiments, and revealed through QMS in the gas-phase either during the irradiation or warm up (see Table 2).
Another species detected in the gas-phase during the experiments is methyl isocyanate (CH3NCO), , itself a molecule of prebiotic relevance. This species has been recently detected in protostar environments (Ligterink et al., 2017; Martín-Doménech et al., 2017), the Orion cloud (Cernicharo et al., 2016), and in comets (Goesmann et al., 2015). Ligterink et al. (2017) estimated the column density of CH3NCO towards the binary low-mass protostar IRAS 16293-2422 to be and cm-2 are obtained towards sources B and A, respectively. A similar value, cm-2, has been derived towards IRAS 16293-2422 B by Martín-Doménech et al. (2017). The fractional abundances with respect to hydrogen nuclei results (Martín-Doménech et al., 2017).
Following the QMS quantification and calibration by Martín-Doménech et al. (2015), we estimated the photo-desorption yields in molecules ph-1 for the molecules listed in Table 4. The quantitative calibration of QMS for the present facility has been detailed in Sie et al. (2019). We then exploit the chemical model of protoplanetary disc around classical T Tauri stars put forward by Walsh et al. (2012). These authors investigated an axisymmetric region surrounding a star with half the mass and twice the radius of the Sun. The effective temperature is 4000 K, and the X-ray luminosity, erg s-1, is taken constant throughout the disc evolution. The stellar X-ray spectrum used in the disc modelling (Nomura et al., 2007) covers energies from 0.1 to 10 keV with a dominant broad and intense peak in the range between 200 and 900 eV, similar in shape to the spectrum used in our experiments (see Figure 1).
The gas-phase fractional density of a particular species produced by photo-desorption is given by
| (14) |
where is the photo-desorption yield reported in Table 4, cm2 the average dust geometrical cross-section per hydrogen nucleus, the local X-ray flux in photons cm-2 s-1, and the irradiation time.
Methyl isocyanate emission has been detected towards IRAS 16293-2422 on Solar System scales, i.e. within au from the prostar (Ligterink et al., 2017). At radial distances between 10 and 50 au, and within 50 au of altitude from the plane of the disc, dust temperatures are between 20 and 40 K, consistent with a long residence time of mixed water ices. The X-ray flux results ergs cm-2 s-1 (Walsh et al., 2012). Assuming an average photon energy of 600 eV, we obtain photons cm-2 s-1. Using equation (14), we derive an irradiation time yr. Such times are compatible with the disc dynamical age of 40000 yr reported in Martín-Doménech et al. (2017), and with other estimates for this source (Bottinelli et al., 2014; Majumdar et al., 2016).
On the base of Table 4 we may estimate the CH3NCO/HNCO ratio to be , about a factor of 3 bigger than the largest observational estimate (Ligterink et al., 2017). However, we did not expect to find a close agreement with the observational data, as the two species, CH3NCO and HNCO formed on the surface of dust grains, are photo-desorbed and incorporated into the gas phase without any further interaction. Our results show the photo-desorption may be an efficient non-thermal source of such species, and other organic molecules. Thus, around young solar-type stars, known to emit many more X-rays than the present-day Sun, X-ray irradiation has a potential role in prebiotic chemistry.
In conclusion, the present results show that X-ray irradiation of a water mixed (H2O:CO:NH3) ice may originate a chemistry rich in organic compounds, most of them likely to be desorbed to the gas-phase via photo and/or thermal desorption. Such species have been detected in many astrophysical environments and in particular in circumstellar regions. In this latter case, X-rays can permeate the disc and reach deeper regions, where less energetic radiation such as ultraviolet is inhibited, triggering a solid phase chemistry that through photo-desorption can enrich dilute medium of complex organics. Future experiments will be aimed to a more detailed identification of the species including the solid and gas-phase production yields in order to provide a more accurate comparison with observations.
5 Acknowledgments
We acknowledge the NSRRC general staff for running the synchrotron radiation facility. We also thank Dr. T.-W. Pi, the spokesperson of BL08B in NSRRC.
This work has been supported by the project PRIN-INAF 2016 The Cradle of Life - GENESIS-SKA (General Conditions in Early Planetary Systems for the rise of life with SKA). We also acknowledge support from INAF through the ”Progetto Premiale: A Way to Other Worlds” of the Italian Ministry of Education. One of us, G.M.M.C., was financed by the Spanish MINECO-FEDER under projects AYA2014-60585-P and AYA2017-85322-R, and the MOST grants MOST 107-2112-M-008-016-MY3 (Y.-J.C.), Taiwan.
References
- Aikawa et al. (2012) Aikawa, Y. Kamuro, D., Sakon, I., et al. 2012, A&A, 538, 57
- Andrade et al. (2010) Andrade, D. P. P., Rocco, M. L. M., & Boechat-Roberty, H. M. 2010, MNRAS, 409, 1289
- Bernstein et al. (1995) Bernstein, M. P., Sandford, S. A., Allamandola, L. J., Chang, S., & Scharberg, M. A. 1995, ApJ, 454, 327
- Benndorf et al. (1999) Benndor, M., Westerveld, W.B., van Eck, J., van der Weg, J. & Heideman, H.G.M. 1999, J. Phys. B: At. Mol. Opt. Phys., 32, 2503
- Bernstein et al. (2002) Bernstein, M. P., Dworkin, J. P., Sandford, S. A., Cooper, G. W., & Allamandola, L. J. 2002, Nature, 416, 401
- Bianchi et al. (2019) Bianchi, E., Codella, C., Ceccarelli, C., et al. 2019, MNRAS, 483, 1850
- Bisschop et al. (2007) Bisschop, S. E., Fuchs, G. W., van Dishoeck, E. F., Linnartz, H. 2007, A&A, 464, 1061
- Boogert et al. (2015) Boogert, A. C. A., Gerakines, P. A., & Whittet, D. C. B. 2015, ARA&A, 53, 541
- Bottinelli et al. (2014) Bottinelli S., Wakelam V., Caux E., Vastel C., Aikawa Y., & Ceccarelli C. 2014, MNRAS, 441, 1964
- Brucato et al. (2006) Brucato, J. R., Baratta, G. A., & Strazzulla, G. 2006, A&A, 455, 395
- Cernicharo et al. (2016) Cernicharo, J., Kisiel, Z., Tercero, B., et al. 2016, A&A, 587, L4
- Chen et al. (2007) Chen, Y.-J., Nuevo, M., Hsieh, J.-M., et al. 2007, A&A, 464, 253
- Chen et al. (2013) Chen, Y.-J., Ciaravella, A., Muñoz Caro, G. M., et al. 2013, ApJ, 778, 162
- Chen et al. (2014) Chen, Y.-J. , Chuang, K.-J., Muñoz Caro, G.M., Nuevo, M., Chu, C.-C. , Yih T.-S. , Ip, W.-H. & Wu C.-Y. R., 2014, ApJ, 781, 15
- Chen et al. (2015) Chen, H.-F., Liu, M.-C., Chen, S.-C., et al. 2015, ApJ, 804, 36
- Ciaravella et al. (2010) Ciaravella, A, Muñoz Caro, G. M., Jiménez-Escobar, A., Cecchi-Pestellini, C., Giarrusso, S., Barbera, M., & Collura, A. 2010, ApJ, 722, L45
- Ciaravella et al. (2012) Ciaravella, A, Muñoz Caro, G. M., Jiménez-Escobar, A., Cecchi-Pestellini, C., Candia, R., Giarrusso, S., Barbera, M., & Collura, A. 2010, ApJ, 746, L1
- Ciaravella et al. (2016) Ciaravella, A., Chen, Y.-J., Cecchi-Pestellini, C., Jiménez-Escobar, A., Muñoz Caro, G. M., Chuang, K.-J., & Huang, C.-H. 2016, ApJ, 819, 38
- de Marcellus et al. (2011) de Marcellus, P., Meinert, C., Nuevo, M., et al. 2011, ApJ, 727, L27
- Demyk et al. (1998) Demyk, K., Dartois, E., d’Hendecourt, L., Jourdain de Muizon, M., Heras, A. M., & M Breitfellner, M. 1998, A&A, 339, 553
- Förstel et al. (2016) Förstel, M., Maksyutenko, P., Jones, B. M., Sun, B. J., Lee, H. C., Chang, A. H. H., & Kaiser, R. I. 2016, ApJ, 820, 117
- Gerakines et al. (1996) Gerakines, P. A., Schutte, W. A., Ehrenfreund, P. 1996, A&A, 312, 289
- Gerakines et al. (2004) Gerakines, P. A., Moore, M. H., & Hudson, R. L. 2004, Icarus, 170, 202
- Gerakines et al. (2005) Gerakines, P. A., Bray, J. J., Davis, A., & Richey, C. R. 2005, ApJ, 620, 1140
- Goesmann et al. (2015) Goesmann, F., Rosenbauer, H., Bredehöftet, J. K., et al. 2015, Science, 6247, 349
- Gómez-Zavaglia & Fausto (2003) Gómez-Zavaglia, A., & Fausto, R. 2003, PCCP, 5, 3154
- Hagen et al. (1979) Hagen, W., Allamandola, L. J., & Greenberg, J. M. 1979, Ap&SS, 65, 215
- Herbst & van Dishoeck (2009) Herbst, E., & van Dishoeck, E.F. 2009,ARA&A, 47, 427
- Hinkle et al. (1988) Hinkle, K. H., Keady, J. J., & Bernath, P. F. 1988, Science, 241, 1319
- Holtom et al. (2005) Holtom, P. D., Bennett, C. J., Osamura, Y., Mason, N. J., & Kaiser, R. I. 2005, ApJ, 626, 940
- Hudson & Moore (2000) Hudson, R.L., & Moore, M.H. 2000, A&A, 357, 787
- Islam et al. (2014) Islam, F., Baratta, G. A., & Palumbo, M. E. 2014, A&A, 561, A73
- Jamieson et al. (2005) Jamieson, C.S., Bennett, C., Mebel, A.M., & Kaise, R.I. 2005, ApJ, 624, 436
- Jiang et al. (1975) Jiang, G. J., Person, W. B., & Brown, K. G. 1975, J. Chem. Phys., 64, 1201
- Jiménez-Escobar et al. (2012) Jiménez-Escobar, A., Muñoz Caro, G. M., Ciaravella, A., Cecchi-Pestellini, C., Candia, R., & Micela, G. 2012, ApJ, 751, L40
- Jiménez-Escobar et al. (2014) Jiménez-Escobar, A., Giuliano, B. M., Muñoz Caro, G. M., Cernicharo, J., & Marcelino, N. 2014, ApJ, 788, 19
- Jiménez-Escobar et al. (2016) Jiménez-Escobar, A., Chen, Y.-J., Ciaravella, A., Huang, C.-H., Micela, G., Cecchi-Pestellini, C. 2016, ApJ, 820, 25
- Jiménez-Escobar et al. (2018) Jiménez-Escobar, A., Ciaravella, A., Cecchi-Pestellini, C., Huang, C.-H., Sie, N. E., Chen, Y.-J., & Muñoz-Caro, G.M. 2018, ApJ, 868, 73
- Jones et al. (2011) Jones, B. M., Bennett, C. J., & Kaiser, R. I. 2011, ApJ, 734, 78
- Jones et al. (2014) Jones, B. M., Kaiser, R. I., & Strazzulla, G. 2014, ApJ, 781, 85
- Kaňuchová et al. (2016) Kaňuchová, Z., Urso, R. G., Baratta, G. A., Brucato, J. R., Palumbo, M. E., & Strazzulla, G. 2016, A&A, 585, A155
- Ligterink et al. (2017) Ligterink, N. F. W., Coutens, A., Kofman, V., et al. 2017, MNRAS, 469, 2219
- Ligterink et al. (2018) Ligterink, N. F. W., Terwisscha van Scheltinga, J., Taquet, V., Jørgensen, J. K., Cazaux, S., van Dishoeck, E. F., & Linnartz, H., MNRAS, 2018, 48,3628
- Loeffler et al. (2005) Loeffler, M. J., Baratta, G. A., Palumbo, M. E., Strazzulla, G., & Baragiola, R. A. 2005, A&A, 435, 587
- Lovas et al. (2006) Lovas, F. J., Hollis, J. M., Remijan, A. J., & Jewell, P. R. 2006, ApJ, 645, L137
- Luna et al. (2018) Luna, R., Molpeceres, G., Ortigoso, J., Satorre, M. A., Domingo, M., & Maté, B. 2018, A&A, 617, A116
- Majumdar et al. (2016) Majumdar L., Gratier P., Vidal T., Wakelam V., Loison J.-C., Hickson K. M., & Caux E. 2016, MNRAS, 458, 2, 1859
- Mase et al. (1998) Mase, K., Nagasono, M., Tanaka, S. & Urisi, T. 1998 J. Chem. Phys., 108, 6550
- Martín-Doménech et al. (2014) Martín-Doménech, R., Muñoz-Caro, G.M., Bueno, J., et al. 2014, A&A, 564, A8
- Martín-Doménech et al. (2015) Martín-Doménech, R., Manzano-Santamaría, J., Muñoz-Caro, G.M., et al. 2015, A&A, 584, A14
- Martín-Doménech et al. (2017) Martín-Doménech, R., Rivilla, V. M.; Jiménez-Serra, I., Quénard, D., Testi, L., & Martín-Pintado, J. 2017, MNRAS, 469, 2230
- Maté et al. (2011) Maté, B., Rodriguez-Lazcano, Y., Gálvez, Ó., Tanarro, I., Escribano, R. 2011, PCCP, 13, 12268
- Maté et al. (2017) Maté, B., Molpeceres, G., Timón, V., Tanarro, I., Escribano, R., Guillemin, J. C., Cernicharo, J., Herrero, V. J. 2017, MNRAS, 470, 4222
- Maté et al. (2018) Maté, B., Molpeceres, G., Tanarro, I., Peláez, R. J., Guillemin, J. C, Cernicharo, J., & Herrero, V. J. 2018, ApJ, 861, 61
- McGuire (2018) McGuire, B. A. 2018, ApJS, 219, 12
- Meierhenrich et al. (2004) Meierhenrich, U. J., Muñoz Caro, G. M., Hendrik B. J., Jessberger, E. K., & Thiemann, W. H.-P. 2004, PNAS, 101, 9182
- Meinert et al. (2016) Meinert, C., Myrgorodska, I., de Marcellus, P. et al. 2016, Science, 352, 208
- Mencos & Krim (2016) Mencos, A., & Krim, L. 2016, MNRAS, 460, 1990
- Mencos & Krim (2018) Mencos, A., & Krim, L. 2018, MNRAS, 476, 5432
- Milligan & Jacox (1971) Milligan, D. D., & Jacox, M. E. 1971, J. Chem. Phys., 54, 927
- Modica & Palumbo (2010) Modica, P., & Palumbo, M. E. 2010, A&A, 519, 22
- Muñoz-Caro et al. (2002) Muñoz Caro, G. M., Meierhenrich, U. J., Schutte, W. A., et al. 2002, Nature, 416, 403
- Muñoz-Caro & Schutte (2003) Muñoz Caro, G. M., & Schutte, W. A. 2003, A&A, 412, 121
- Muñoz-Caro & Dartois (2013) Muñoz Caro, G. M., & Dartois, E. 2013, Chem. Soc. Rev., 42, 2173
- Muñoz-Caro et al. (2014) Muñoz Caro, G. M., Dartois, E., Boduch, P., Rothard, H., Domaracka, A., & Jiménez-Escobar, A. 2014, A&A, 566, A93
- Munro et al. (2012) Munro, J. J., Harrison, S., Fujimoto, M. M., & Tennyson, J. 2012, JPhCS, 388, 012013
- Nomura et al. (2007) Nomura H., Aikawa Y., Tsujimoto M., Nakagawa Y., & Millar T. J., 2007, ApJ, 661, 334
- Nuevo et al. (2006) Nuevo, M., Meierhenrich, U. J., Muñoz Caro, G. M., et al. 2006, A&A, 47, 741
- Oba et al. (2016) Oba, Y., Takano, Y., Watanabe, N., & Kouchi, A. 2016, ApJ, 827, L8
- Öberg et al. (2011) Öberg, K. I., Boogert, A. C. A., et al. 2011, ApJ, 740, 109
- Öberg et al. (2015) Öberg, K. I., Guzmán, V. V., Furuya, K., et al. 2015, Natur, 520, 198
- Palumbo et al. (1998) Palumbo, M. E., Baratta, G. A., Brucato, J. R., Castorina, A. C., Satorre, M. A., & Strazzulla, G. 1998, A&A, 334, 247
- Pilling et al. (2010) Pilling, S., Seperuelo Duarte, E., da Silveira, E.F., et al. 2010, A&A, 509, A87
- Pilling & Bergantini (2015) Pilling, S., & Bergantini, A. 2015, ApJ, 811, 151
- Raunier et al. (2004) Raunier, S., Chiavassa, T., Marinelli, F., & Aycard, J. P. 2004, Chem. Phys., 302, 259
- Ribas et al. (2005) Ribas, I., Guinan, E.F., Gudel, M., & Audard, M. 2005, ApJ, 622, 680
- Sandford & Allamandola (1993) Sandford, S. A., & Allamandola, L. J. 1993, ApJ, 417, 815
- Sicilia et al. (2012) Sicilia, D., Ioppolo, S., Vindigni, T., Baratta, G. A., & Palumbo, M. E. 2012, A&A, 543, A155
- Sie et al. (2019) Sie, N.-E., Muñoz Caro, G. M., Huang, Z.-H., Martín-Doménech, R., Fuente, A. & Chen, Y.-J. 2019, ApJ, 874, 35
- Solomon et al. (1971) Solomon, P. M., Jefferts, K. B., Penzias, A. A., & Wilson, R. W. 1971, ApJ, 168, L107
- Theule et al. (2011) Theule, P., Duvernay, F., Ilmane, A., Hasegawa, T., Morata, O., Coussan, S., Danger, G., Chiavassa, T. 2011, A&A, 530, 96
- Unger et al. (2015) Unger, I., Hollas, D., Seidel, R., Thürmer,S., Aziz, E. F., Slavícěck, P., & Winter, B. 2015, J. Phys. Chem., 119, 10750
- van Broekhuizen et al. (2004) van Broekhuizen, F. A., Keane, J. V., & Schutte, W. A. 2004, A&A, 415, 425
- van Broekhuizen et al. (2005) van Broekhuizen, F. A., Pontoppidan, K. M., Fraser, H. J., & van Dishoeck, E. F. 2005, A&A, 441, 249
- Varietti & Pimentel (1971) Varetti, E.L., & Pimentel, G.C. 1971, J. Chem. Phys., 55, 3813
- Vinogradoff et al. (2013) Vinogradoff, V., Duvernay, F., Danger, G., Theulè, P., Borget, F., & Chiavassa, T. 2013, A&A, 549, A40
- Walsh et al. (2012) Walsh, C., Nomura, H., Millar, T. J., & Aikawa, Y. 2012, ApJ, 747, 114
- Woon (2002) Woon, D. E. 2002, ApJ, 571, L77
- Zheng et al. (2008) Zheng, W., Jewitt, D., Osamura, Y., & Kaiser, R. 2008, ApJ, 674, 1242