REJUVENATION IN QUIESCENT GALAXIES IN LEGA-C
Abstract
We use reconstructed star-formation histories (SFHs) of quiescent galaxies at in the LEGA-C survey to identify secondary star-formation episodes that, after an initial period of quiescence, moved the galaxies back to the star-forming main sequence (blue cloud). % of the quiescent population has experienced such rejuvenation events in the redshift range after reaching quiescence at some earlier time. On average, these galaxies first became quiescent at , and those that rejuvenated, remained quiescent for Gyr before their secondary SF episode which lasted Gyr. The stellar mass attributed to rejuvenation is on average 10% of the galaxy stellar mass, with rare instances of an increase of more than a factor 2. Overall, rejuvenation events only contribute % of the total stellar mass in quiescent galaxies and we conclude that rejuvenation is not an important evolutionary channel when considering the growth of the red sequence. However, our results complicate the interpretation of galaxy demographics in color space: the galaxies with rejuvenation events tend to lie in the so-called ‘green valley’, yet their progenitors were quiescent at .
1 Introduction
The colors of galaxies are known to be bimodal, not only in the local universe (e.g., Strateva et al., 2001; Baldry et al., 2004), but also at redshift and beyond (e.g. Bell et al., 2004; Franzetti et al., 2007; Whitaker et al., 2011; Straatman et al., 2016). Galaxies are classified as either part of the ‘blue cloud’ or ‘red sequence’, where the blue cloud contains galaxies that are actively forming new stars, while the red sequence contains quiescent galaxies that have very low ongoing star-formation (SF). Ages and metallicities of massive quiescent galaxies (stellar mass ) at are consistent with passive evolution to the present-day (e.g., Gallazzi et al., 2014; Choi et al., 2014), although Gallazzi et al. (2014) require additional quenching of a fraction of massive star-forming galaxies at to account for the scatter in the ages of present-day quiescent galaxies. Schiavon et al. (2006), however, compared stacked spectra of red sequence galaxies at redshifts to local SDSS galaxies (York et al., 2000) and found that their ages are inconsistent with passive evolution, which suggests that either new galaxies with younger stars continually transition to the red sequence, or individual quiescent galaxies experience ‘frosting’, where continuing low-level star formation adds a minority of young stars to an older base population (Trager et al., 2000). Wu et al. (2018) and Spilker et al. (2018) reached the same conclusion using high-resolution spectra of massive (stellar mass M⊙) galaxies from the Large Early Galaxy Astrophysics Census Survey (LEGA-C, van der Wel et al., 2016).
The increasingly dominant population of quiescent galaxies measured in number density evolution studies (e.g., Pozzetti et al., 2010; Brammer et al., 2011; Moustakas et al., 2013; Muzzin et al., 2013a) indicates that star-forming galaxies have their star-formation quenched and transition from the blue cloud to the red sequence. The nature of this quenching process is still not understood, although the ‘maintenance mode’ of AGN feedback is widely believed to suppress star-formation in massive galaxies by providing sufficient energy to keep the halo gas from cooling (e.g., Goto, 2006; Heckman & Best, 2014). Therefore, if AGN feedback fails to keep halo gas hot, the star-formation in a galaxy could be reignited.
Although the aforementioned evolution studies indicate that galaxies evolve from being star-forming to quiescent, secondary SF has been found to be a common phenomenon in local early-type galaxies: the fraction of early-type galaxies showing evidence of recent star formation is thought to be between 10 and 30% (Schawinski et al., 2007; Donas et al., 2007). This fraction is higher in low-density environments (e.g., Schawinski et al., 2007; Thomas et al., 2010), which is consistent with H I being detected more often in field galaxies than in clusters (e.g., Oosterloo et al., 2010). Treu et al. (2005) and Thomas et al. (2010) found that the fraction of stellar mass formed from secondary SF episodes decreases with galactic mass, ranging from % for stellar masses M⊙ to for stellar masses M⊙. This is in line with Kaviraj et al. (2007) who found that star-formation is more efficiently quenched in high-mass galaxies (for stellar masses M⊙).
Secondary SF episodes have been linked to either H I gas accretion or mergers which bring in gas, often resulting in only a small population of relatively young stars (e.g. Yi et al., 2005; Kaviraj et al., 2009; Marino et al., 2009). There is no general trend between stellar population and H I properties, however, galaxies with a significant young sub-population have inner gas discs (Oosterloo et al., 2010). Post-starburst (PSB) or ‘E+A’ galaxies, i.e. young quiescent galaxies with strong Balmer absorption lines and weak to no SF-related emission lines (Dressler & Gunn, 1983; Dressler et al., 1999; Tran et al., 2004), have also been linked to secondary SF episodes in order to reconcile the number density of PSBs with the slow growth of the quiescent population at the high-mass end (M⊙) at (e.g., Rowlands et al., 2018), as well as using starburst timescales (Myr) to show that PSBs are likely not a major component in the growth of the passive galaxy population (e.g., Dressler et al., 2013). E+A galaxies are also likely caused by interactions or mergers (Goto, 2005; Yamauchi et al., 2008).
There are multiple measurements of the fraction of galaxies that undergo secondary SF, however, previous studies were mostly limited to low redshifts because of the abundance of high-resolution spectra in the local Universe. Furthermore, many of these studies do not determine whether the galaxies ‘rejuvenate’, i.e. transition back to the blue cloud from the red sequence. Recently, Pandya et al. (2017) analysed a semi-analytical model of galaxy formation as well as GAMA and CANDELS observations out to to constrain the frequency of rejuvenation episodes. They measured the transition of massive galaxies (M⊙) from the star-forming ‘main sequence’ (SFMS) to both the ‘transition region’ between the blue cloud and red sequence, and the quiescent sequence. they found that the average quiescent galaxy first joined the quiescent population at and that 31% of quiescent galaxies have experienced at least one rejuvenation event since . However, these rejuvenation timescales are short as the average time a galaxy spends in quiescence is comparable for rejuvenated and non-rejuvenated galaxies in their model. Behroozi et al. (2019) applied empirical models of galaxy formation to dark halo merger trees to determine individual galaxies’ SFRs that are consistent with observations (e.g. stellar mass functions, specific and cosmic SFRs, quenched fractions, etc.). They found that, at , rejuvenation fractions range from to % for stellar masses in the range M⊙, with the rejuvenation fraction peaking around M⊙. Their rejuvenation fractions at are significantly higher (% in the same stellar mass range), presumably because galaxies at lower redshifts have had more time to quench and then rejuvenate at a later stage.
The magnitude of the effect of rejuvenation processes still needs to be addressed. Specifically, we do not know if the stellar mass formed from such events is a significant portion of the cosmic star-formation rate density (SFRD) of the Universe and on what timescale these events occur, or how often secondary SF episodes cause galaxies to transition back to the blue cloud during the event . In an earlier paper (Chauke et al., 2018), we reconstructed the star-formation histories (SFHs) of galaxies at using the high-resolution spectra from LEGA-C. These SFHs revealed secondary star-formation episodes in a minority of the quiescent population. This allows us to be able to investigate rejuvenation timescales as well as the frequency and magnitude of such events. In this study, we use the reconstructed SFHs from Chauke et al. (2018) to investigate quiescent galaxies with rejuvenation episodes. In Section 2 we give a brief overview of the sample. In Section 3 we investigate the properties of rejuvenated galaxies, viz. the timescales of rejuvenation episodes, the density and mass dependence of these episodes, as well as whether the mass formed from such events is significant. Finally, in Section 4 we summarise the results. We assume a model with km s-1Mpc-1, and .
2 Data
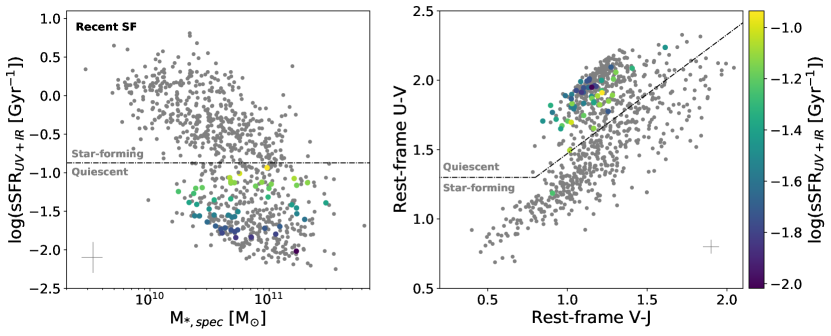
LEGA-C (van der Wel et al., 2016) is an ESO Public Spectroscopic survey with VLT/VIMOS of 3000 galaxies in the COSMOS field with redshifts in the range . The galaxies were selected from the Ultra-VISTA catalog (Muzzin et al., 2013b), with a redshift dependent K-band limit (Klog). Each galaxy is observed for h, which results in spectra with Å-1 (with resolution R ) in the wavelength range . For details of the data reduction procedure, see van der Wel et al. (2016) and Straatman et al. (2018). This work is based on the second data release111http://www.eso.org/sci/publications/announcements/sciann17120.html, which contains 1550 primary sample galaxies. We make use of the following measured quantities in the analysis: rest-frame U-V and V-J colors, UV+IR star formation rates (SFRs), UV+IR specific SFRs (sSFRUV+IR), and scale-independent local overdensities, log, i.e. the local surface density divided by the mean local surface density. The UV+IR SFRs are estimated from UV and IR luminosities, following Whitaker et al. (2012). The log values are estimated from redshift slices using the Voronoi tessellation method (Darvish et al., 2016). Figure 1 shows sSFRUV+IR as a function of M∗,spec (left panel), and the rest-frame UVJ diagram (right panel) of the LEGA-C population at the observed redshift. Star-forming and quiescent populations are distinguished by the dashed lines and quiescent galaxies whose SF was rejuvenated, are color-coded by sSFRUV+IR for comparison. See Section 2.2 for definitions of quiescence and rejuvenation.
2.1 Star Formation Histories
Chauke et al. (2018) used a custom full-spectrum fitting algorithm to reconstruct the SFHs of the LEGA-C sample. The algorithm incorporates emcee (an affine invariant ensemble sampler for MCMC, Foreman-Mackey et al., 2013) and FSPS v3.0 (the Python implementation of the Flexible Stellar Population Synthesis package, Conroy & Gunn, 2010; Conroy et al., 2009; Foreman-Mackey et al., 2014). emcee makes use of MCMC ‘walkers’ which randomly explore the parameter space and converge to the most likely parameters values. The galaxy spectra were fit to a linear combination of a set of 12 composite stellar populations (CSPs), with solar metallicity and constant star formation within the time interval of the templates. The algorithm for 2 dust reddening values, , one for the youngest (more dust-obscured) stellar population and the second for the other stellar populations. The algorithm uses emission-line subtracted spectra. Emission line spectra are computed using the Penalized Pixel-Fitting method (pPXF, Cappellari & Emsellem, 2004). For details of the emission line fitting procedure, see Bezanson et al. (2018). The model results in measurements of stellar masses (M∗,spec), luminosities (Lspec), mean mass-weighted and light-weighted ages (a<MW> and a<LW>, respectively) and the dust reddening values. The stellar masses derived using our method, M∗,spec, are in good agreement with photometry-based stellar masses derived with FAST (Kriek et al., 2009). See Chauke et al. (2018) for further details and results of the fitting algorithm.
2.2 Identifying Rejuvenated Galaxies
One of the main goals of this study is to measure the contribution of rejuvenation to the total stellar mass of quiescent galaxies, therefore, we select quiescent galaxies by their specific star-formation rate (sSFR). This approach results in an identical sample of rejuvenated galaxies, with the exception of one galaxy, compared to selecting quiescent galaxies by their U-V and V-J colors, see Figure 1 for a comparison at the observed redshift. In this study, sSFR is used as a quiescent selection criterion because we can directly compute the sSFR from our reconstructed SFHs.
We use the reconstructed SFHs to compute the sSFR of a galaxy at time , where is the time bin number and sSFR is the SFR at ti divided by the total stellar mass at that time, i.e. . A galaxy is defined as quiescent if the log(sSFR [Gyr at redshift . To track the quiescence of galaxies along their SFHs, we use the Speagle et al. (2014) redshift dependent sSFR to adjust our definition for quiescence to larger redshifts. For example, the limit increases to and at redshifts and , respectively (see Speagle et al., 2014, for full details). The instant a galaxy’s sSFR falls below the redshift adjusted limit at some point in its history, it is considered to be quiescent at that point (and the accumulated stellar mass is recorded), until such a time that it rises above the limit. The stellar mass accumulated during this period is considered to be mass formed from secondary SF.
To minimise the error of adding false positives, we compute the probability of a rejuvenation event having occurred using the MCMC walkers (see Section 2.1 and Figure 4). The probability that a galaxy has a rejuvenation episode () is equal to the probability that the galaxy is quiescent at () multiplied by the probability that it is star-forming at a later time (). We find the time interval where the galaxy is quiescent (i.e. ) and the interval where it is star-forming, and then compute the maxima of the product of the probabilities over these time intervals. () is the fraction of walkers that lie below (above) the sSFR limit at (). If , then the galaxy is considered to have had a rejuvenation episode.
All galaxies in our sample, with the exception of 3 , contain at most 1 rejuvenation episode before becoming quiescent again at the observed redshift. The quiescent sample contains 412 galaxies, 52 (%) of which have had a rejuvenation episode. These galaxies are shown in Figure 1, they are color-coded by sSFRUV+IR for comparison with the rest-frame UVJ diagram on the right panel. If the sSFR limit were decreased (increased) to (), the fraction of rejuvenated galaxies in our sample would be 19% (9%). Furthermore, using a combination of sub-solar ( Z⊙) and solar metallicity CSPs as well as super-solar ( Z⊙) and solar metallicity CSPs in our fitting algorithm, instead of solar metallicity CSPs alone, results in
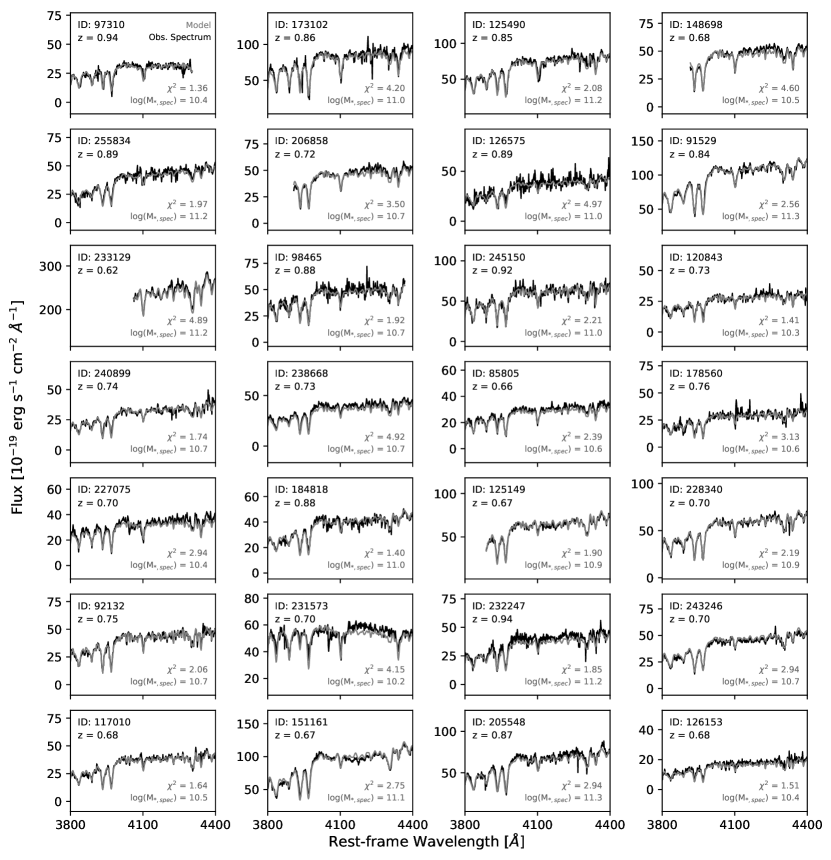
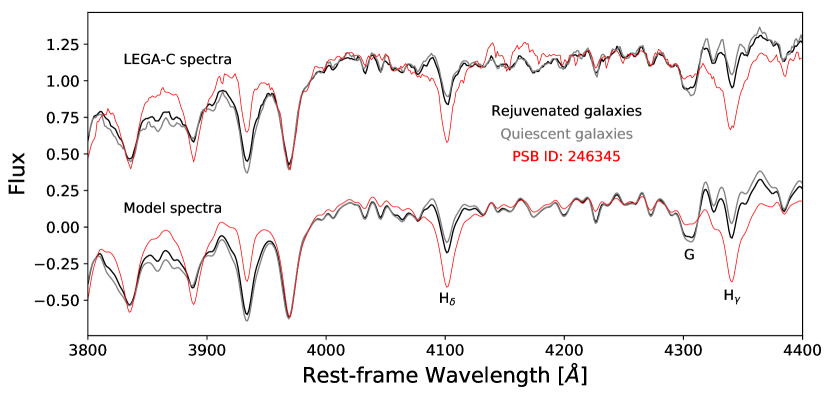
In Figure 2, we compare the average normalised spectrum (LEGA-C as well as best-fit model) of quiescent galaxies that are identified as rejuvenated to stellar mass and Hδ matched quiescent galaxies that are not identified as such. A PSB spectrum is also shown for comparison. The average rejuvenated galaxy has stronger and lines, which are characteristic of young stellar populations; however, its G-band (absorption lines of the CH molecule around 4300Å), which is characteristic of older stellar populations, is not as strong as that of quiescent galaxies without rejuvenation episodes. See Figure A.8 in the appendix for individual best-fit spectra of rejuvenated galaxies in our sample obtained from MCMC full-spectrum fitting (Chauke et al., 2018). Compared to PSB or E+A galaxies, our sample of rejuvenated galaxies have weaker Balmer lines and redder colors. Their V-J colors (see Figure 1) are higher than the typical cut for PSBs (V-J , e.g. Whitaker et al., 2012), and most have H equivalent widths (EW[H], see Figure 2) that are lower than required for PSBs (EW[H, Wu et al., 2018). Therefore, our sample of rejuvenated galaxies suggests that most PSB and E+A galaxies are not recently rejuvenated galaxies as suggested in previous studies (e.g., Dressler et al., 2013; Rowlands et al., 2018); instead, they might be galaxies that recently quenched for the first time.
3 Properties of Rejuvenated population
3.1 The Green Valley
Figure 3 shows the rest-frame U-V color as a function of M∗,spec of rejuvenated galaxies compared to the LEGA-C sample as a whole. The majority of galaxies with rejuvenation episodes have intermediate U-V colors and stellar masses (as well as sSFRs, see Figure 1), i.e. they are in the so-called ‘green-valley’, where galaxies are thought to be in the transition phase from the blue cloud to the red sequence. This is to be expected since recent SF should boost the U-V color and rejuvenation episodes decrease with stellar mass (Treu et al., 2005). However, this indicates that a fraction of quiescent green valley galaxies (20%) have made this transition more than once, i.e. they have quiescent progenitors at higher redshifts, which transitioned back to the blue cloud or green-valley, and they are now on their way back to the red sequence.
3.2 SFHs and rejuvenation timescales
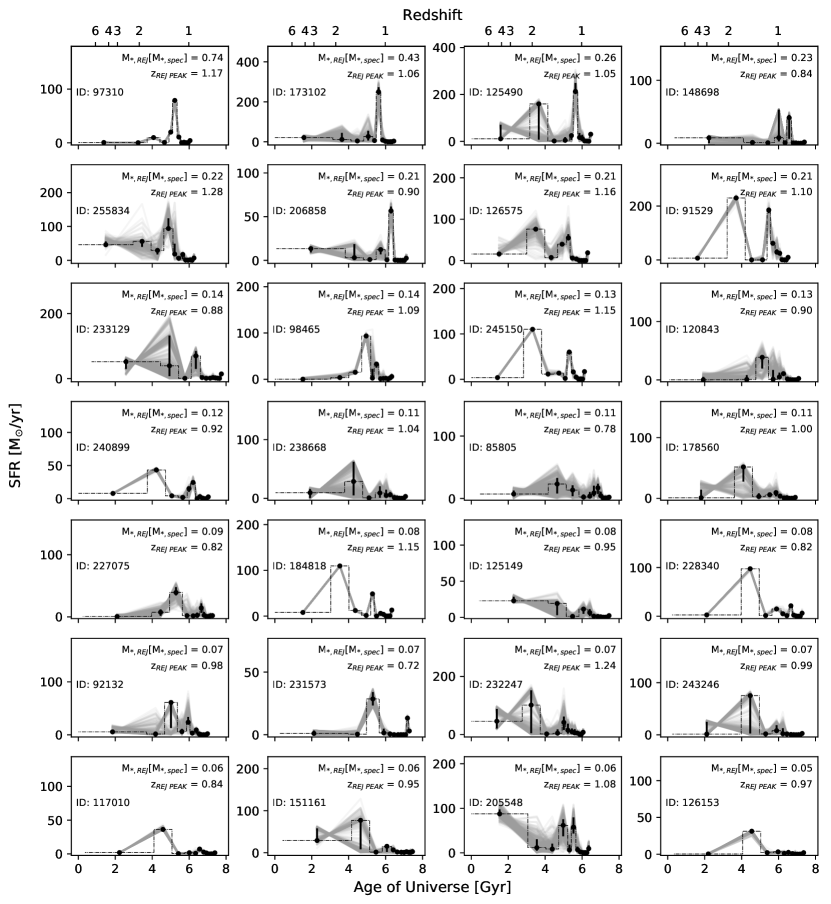
Figure 4 shows rejuvenated galaxies’ reconstructed SFHs, the gray lines represent the MCMC walkers (see Section 2.1), the black points and the lower and upper error bars represent the , and percentiles of the walkers, and the horizontal dashed lines show the sizes of the (constant star-formation) CSP age bins. The fraction of M∗,spec formed from rejuvenation as well as the redshift of the peak SFR of the episode are shown in black. The presence of young and old populations seen in the SFHs is driven by the presence, in the galaxy spectra (Figure A.8), of both features characteristic of young and older stellar populations, such as Balmer absorption lines and the G-band.
We find that galaxies in the LEGA-C sample have rejuvenation episodes during the redshift range . This is because our method can only trace rejuvenation events at lookback times Gyr because our oldest CSP bin is wide ( Gyr), therefore, the algorithm cannot trace rejuvenation for redshifts . However, it is not clear whether full spectrum fitting can trace rejuvenation with older stellar populations ( Gyr). On average, we find that galaxies that rejuvenate first become quiescent at for about Gyr before their secondary SF episode, which lasts Gyr.
3.3 SFR-Mass relation during rejuvenation
In Figure 5, we show the SFR-M∗ relation of the rejuvenated sample at the peak of their SF episode (black) compared to the relation at their observed redshift (red) when they have transitioned back to quiescence. The gray connecting lines track the evolution of each galaxy in SFR and stellar mass, the blue dashed lines represent the star-forming main sequence (SFMS) at redshift (Speagle et al., 2014) with a dex scatter, and the black dashed line distinguishes star-forming and quiescent populations at redshift . This shows that rejuvenation episodes can lead to SFRs which are high enough to cause galaxies to transition back and forth between the SFMS (as well as the starburst region) and the red sequence. These galaxies cover a wide range of SFRs during their rejuvenation episodes, are within 0.3dex of the SFMS and 3 reach starburst status (dex above the SFMS) during their rejuvenation episode. However, Figure 5 also shows that the stellar mass does not increase much after the rejuvenation episode (see Section LABEL:sec:density).
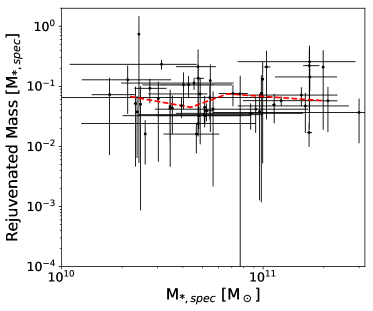
Figure 6 shows the fraction of stellar mass attributed to rejuvenation as a function of M∗,spec. The median trend is indicated in red (computed using galaxies per stellar mass bin) and the upper and lower uncertainties are based on the 16th and 84th percentiles of the walkers of the MCMC algorithm (see Section 2.1). On average, rejuvenation events result in the formation of a small fraction of stellar mass: they account for 10% of the stellar mass of these galaxies, with 67% of galaxies having rejuvenated masses M∗,spec. The median trend consistent with a constant rejuvenation mass fraction with stellar mass.
In Figure 7, we show the scale-independent local density as a function of galaxy stellar mass. The gray points represent the quiescent sample and the black points represent rejuvenated galaxies. To test if rejuvenation is density dependent, we use a Kolmogorov-Smirnov test to compare the local overdensity distribution of the rejuvenated sample to the overall quiescent sample. We find that the occurrence of rejuvenated galaxies increases with decreasing density (D statistic , ), which is in agreement with Schawinski et al. (2007) (see Section 1). Rejuvenated galaxies have smaller stellar masses compared to the quiescent sample (D statistic , ). Most galaxies that show evidence of rejuvenation have stellar masses M∗,spec M⊙ (see Figure 7). These trends are consistent with gas-rich mergers triggering rejuvenation events. Lower-mass galaxies in lower-density environments are more likely to merge with smaller gas-rich galaxies. On the other hand, in more dense environments, the gas in lower-mass galaxies is stripped by high-mass galaxies resulting in dry mergers.
3.4 Contribution to the Cosmic Star-formation Rate Density
To determine if rejuvenation episodes contribute significantly to the stellar mass and SF budget in the universe, we compute the fraction of stellar mass formed during rejuvenation events in quiescent galaxies . average SFRD in the redshift range made up by rejuvenation events is M⊙yr-1Mpc-3, a mere of the total Madau & Dickinson (2014) SFRD. This indicates that only a negligible fraction of all SF at this epoch is due to revived quiescent galaxies.
4 Summary
We have investigated rejuvenation in quiescent galaxies in the LEGA-C sample using Chauke et al. (2018)’s reconstructed SFHs, which were obtained from full spectrum fitting. We have shown that most galaxies which have had a rejuvenation episode lie in the green valley, i.e. they have intermediate U-V colors and stellar masses (Figure 3). We presented the fraction of LEGA-C’s quiescent population that have experienced rejuvenation events in their recent past, i.e. galaxies which had at one point transitioned from the star-forming to the quiescent sequence, transitioned back to the star-forming sequence before becoming quiescent again (Figure 4).
Limitations from the full spectrum fitting algorithm (see Section 3) means that we can only measure rejuvenation from redshift (lookback Gyr w.r.t. to the present day). We measure these events in the redshift range and they have an average time span of Gyr (Figure 4). The occurrence of rejuvenated galaxies is higher in low-density environments, which is in agreement with previous studies (Figure 7). We found that rejuvenated galaxies generally have lower stellar masses (M⊙) compared to the overall quiescent population, however, we do not measure a dependence on other galaxy parameters such as size.
On average, rejuvenation episodes generate 10% of the galaxies’ total stellar mass (Figure 6). At the peak SFR of the rejuvenation episode, many galaxies transition back to the SFMS (Figure 5). % of the quiescent population has likely experienced a rejuvenation episode, this is only % of the stellar mass in the quiescent sample, which means that rejuvenation episodes in the redshift range account for only 0.3% of the SFRD. This shows that although a significant portion of galaxies experience rejuvenation episodes, the mass formed from such events does not significantly contribute to the SFRD in the Universe. Therefore, rejuvenation is not an important factor in the growth of the red sequence, however, it can be a significant factor in detailed color studies.
5 Acknowledgements
Based on observations made with ESO Telescopes at the La Silla Paranal Observatory under programme ID 194-A.2005 (The LEGA-C Public Spectroscopy Survey). PC gratefully acknowledge financial support through a DAAD-Stipendium. This project has received funding from the European Research Council (ERC) under the European Union’s Horizon 2020 research and innovation programme (grant agreement No. 683184). KN and CS acknowledge support from the Deutsche Forschungsemeinschaft (GZ: WE 4755/4-1). We gratefully acknowledge the NWO Spinoza grant.
References
- Baldry et al. (2004) Baldry, I. K., Glazebrook, K., Brinkmann, J., et al. 2004, ApJ, 600, 681
- Behroozi et al. (2019) Behroozi, P., Wechsler, R. H., Hearin, A. P., & Conroy, C. 2019, MNRAS, arXiv:1806.07893
- Bell et al. (2004) Bell, E. F., Wolf, C., Meisenheimer, K., et al. 2004, ApJ, 608, 752
- Bezanson et al. (2018) Bezanson, R., van der Wel, A., Pacifici, C., et al. 2018, ApJ, 858, 60
- Brammer et al. (2011) Brammer, G. B., Whitaker, K. E., van Dokkum, P. G., et al. 2011, ApJ, 739, 24
- Calzetti et al. (2000) Calzetti, D., Armus, L., Bohlin, R. C., et al. 2000, ApJ, 533, 682
- Cappellari & Emsellem (2004) Cappellari, M., & Emsellem, E. 2004, PASP, 116, 138
- Chauke et al. (2018) Chauke, P., van der Wel, A., Pacifici, C., et al. 2018, ApJ, 861, 13
- Choi et al. (2014) Choi, J., Conroy, C., Moustakas, J., et al. 2014, ApJ, 792, 95
- Conroy & Gunn (2010) Conroy, C., & Gunn, J. E. 2010, ApJ, 712, 833
- Conroy et al. (2009) Conroy, C., Gunn, J. E., & White, M. 2009, ApJ, 699, 486
- Darvish et al. (2016) Darvish, B., Mobasher, B., Sobral, D., et al. 2016, ApJ, 825, 113
- Donas et al. (2007) Donas, J., Deharveng, J.-M., Rich, R. M., et al. 2007, ApJS, 173, 597
- Dressler & Gunn (1983) Dressler, A., & Gunn, J. E. 1983, ApJ, 270, 7
- Dressler et al. (2013) Dressler, A., Oemler, Jr., A., Poggianti, B. M., et al. 2013, ApJ, 770, 62
- Dressler et al. (1999) Dressler, A., Smail, I., Poggianti, B. M., et al. 1999, ApJS, 122, 51
- Foreman-Mackey et al. (2013) Foreman-Mackey, D., Hogg, D. W., Lang, D., & Goodman, J. 2013, PASP, 125, 306
- Foreman-Mackey et al. (2014) Foreman-Mackey, D., Sick, J., & Johnson, B. 2014, doi:10.5281/zenodo.12157. https://doi.org/10.5281/zenodo.12157
- Franzetti et al. (2007) Franzetti, P., Scodeggio, M., Garilli, B., et al. 2007, A&A, 465, 711
- Gallazzi et al. (2014) Gallazzi, A., Bell, E. F., Zibetti, S., Brinchmann, J., & Kelson, D. D. 2014, ApJ, 788, 72
- Goto (2005) Goto, T. 2005, MNRAS, 357, 937
- Goto (2006) —. 2006, MNRAS, 369, 1765
- Heckman & Best (2014) Heckman, T. M., & Best, P. N. 2014, ARA&A, 52, 589
- Kaviraj et al. (2007) Kaviraj, S., Kirkby, L. A., Silk, J., & Sarzi, M. 2007, MNRAS, 382, 960
- Kaviraj et al. (2009) Kaviraj, S., Peirani, S., Khochfar, S., Silk, J., & Kay, S. 2009, MNRAS, 394, 1713
- Kriek et al. (2009) Kriek, M., van Dokkum, P. G., Labbé, I., et al. 2009, ApJ, 700, 221
- Madau & Dickinson (2014) Madau, P., & Dickinson, M. 2014, ARA&A, 52, 415
- Marino et al. (2009) Marino, A., Iodice, E., Tantalo, R., et al. 2009, A&A, 508, 1235
- Moustakas et al. (2013) Moustakas, J., Coil, A. L., Aird, J., et al. 2013, ApJ, 767, 50
- Muzzin et al. (2013a) Muzzin, A., Marchesini, D., Stefanon, M., et al. 2013a, ApJ, 777, 18
- Muzzin et al. (2013b) —. 2013b, ApJS, 206, 8
- Oosterloo et al. (2010) Oosterloo, T., Morganti, R., Crocker, A., et al. 2010, MNRAS, 409, 500
- Pandya et al. (2017) Pandya, V., Brennan, R., Somerville, R. S., et al. 2017, MNRAS, 472, 2054
- Pozzetti et al. (2010) Pozzetti, L., Bolzonella, M., Zucca, E., et al. 2010, A&A, 523, A13
- Rowlands et al. (2018) Rowlands, K., Heckman, T., Wild, V., et al. 2018, MNRAS, 480, 2544
- Schawinski et al. (2007) Schawinski, K., Kaviraj, S., Khochfar, S., et al. 2007, ApJS, 173, 512
- Schiavon et al. (2006) Schiavon, R. P., Faber, S. M., Konidaris, N., et al. 2006, ApJ, 651, L93
- Speagle et al. (2014) Speagle, J. S., Steinhardt, C. L., Capak, P. L., & Silverman, J. D. 2014, ApJS, 214, 15
- Spilker et al. (2018) Spilker, J., Bezanson, R., Barišić, I., et al. 2018, ApJ, 860, 103
- Straatman et al. (2016) Straatman, C. M. S., Spitler, L. R., Quadri, R. F., et al. 2016, ApJ, 830, 51
- Straatman et al. (2018) Straatman, C. M. S., van der Wel, A., Bezanson, R., et al. 2018, ApJS, 239, 27
- Strateva et al. (2001) Strateva, I., Ivezić, Ž., Knapp, G. R., et al. 2001, AJ, 122, 1861
- Thomas et al. (2010) Thomas, D., Maraston, C., Schawinski, K., Sarzi, M., & Silk, J. 2010, MNRAS, 404, 1775
- Trager et al. (2000) Trager, S. C., Faber, S. M., Worthey, G., & González, J. J. 2000, AJ, 120, 165
- Tran et al. (2004) Tran, K.-V. H., Franx, M., Illingworth, G. D., et al. 2004, ApJ, 609, 683
- Treu et al. (2005) Treu, T., Ellis, R. S., Liao, T. X., et al. 2005, ApJ, 633, 174
- van der Wel et al. (2016) van der Wel, A., Noeske, K., Bezanson, R., et al. 2016, ApJS, 223, 29
- Whitaker et al. (2012) Whitaker, K. E., Kriek, M., van Dokkum, P. G., et al. 2012, ApJ, 745, 179
- Whitaker et al. (2011) Whitaker, K. E., Labbé, I., van Dokkum, P. G., et al. 2011, ApJ, 735, 86
- Wu et al. (2018) Wu, P.-F., van der Wel, A., Gallazzi, A., et al. 2018, ApJ, 855, 85
- Yamauchi et al. (2008) Yamauchi, C., Yagi, M., & Goto, T. 2008, MNRAS, 390, 383
- Yi et al. (2005) Yi, S. K., Yoon, S.-J., Kaviraj, S., et al. 2005, ApJ, 619, L111
- York et al. (2000) York, D. G., Adelman, J., Anderson, Jr., J. E., et al. 2000, AJ, 120, 1579
Appendix A Best-fit spectra of rejuvenated galaxies
In Figure 4 we showed the reconstructed SFHs, obtained from full-spectrum fitting (Chauke et al., 2018), of rejuvenated galaxies in the LEGA-C Survey. In Figure A.8 we show the spectra of those rejuvenated galaxies, along with the resulting spectra obtained from full-spectrum fitting.