Broad-band X-ray analysis of local mid-infrared selected Compton-thick AGN candidates
Abstract
The estimate of the number and space density of obscured AGN over cosmic time still represents an open issue. While the obscured AGN population is a key ingredient of the X-ray background synthesis models and is needed to reproduce its shape, a complete census of obscured AGN is still missing. Here we test the selection of obscured sources among the local 12m sample of Seyfert galaxies. Our selection is based on a difference up to three orders of magnitude in the ratio between the AGN bolometric luminosity, derived from the spectral energy distribution (SED) decomposition, and the same quantity obtained by the published XMM-Newton 2–10 keV luminosity (). The selected sources are UGC05101, NGC1194 and NGC3079 for which the available X-ray wide bandpass, from Chandra and XMM-Newton plus NuSTAR data, extending to energies up to 30–45 keV, allows us an accurate determination of the column density, and hence of the true intrinsic power. The newly derived values clearly indicate heavy obscuration (, and cm-2 for UGC05101, NGC1194 and NGC3079, respectively), and are consistent with the prominent silicate absorption feature observed in the Spitzer-IRS spectra of these sources (9.7m rest frame). We finally checked that the resulting X-ray luminosities in the 2–10 keV band are in good agreement with those derived from the mid-IR band through empirical relations.
keywords:
galaxies: active – galaxies: Seyfert – infrared: galaxies – X-rays: galaxies.1 Introduction
XRB synthesis models (e.g., Gilli et al., 2007; Akylas et al., 2012) require a significant fraction of obscured active galactic nuclei (AGN); a fraction of these are expected to be heavily obscured, including Compton-thick AGN (with column density cm-2), thus likely elusive or difficult to detect even in deep X-ray surveys. The number density of obscured sources and their space density as a function of cosmic time still represent an open and challenging issue (e.g., Vignali et al., 2010, 2014). Being hidden by extreme column densities of obscuring gas that can absorb even hard X-ray photons, Compton-thick AGN are difficult to find, especially at high redshifts. Mildly Compton-thick AGN (column densities of – cm-2) are the most promising candidates to explain the residual (i.e., not resolved yet into individual sources at the limits of current X-ray surveys) spectrum of the cosmic XRB at its 30 keV peak (e.g., Gilli, 2013; Shi et al., 2013) but only a limited number of these sources are currently known and verified as bona-fide Compton-thick AGN beyond the local Universe. The redshift distribution and space density of Compton-thick AGN are also important in accurately assessing the supermassive black hole mass function and constraining the Eddington ratio and radiative efficiency averaged over cosmic times; this result can be achieved through a comparison with the relic black hole mass distribution of local galaxies e.g., Marconi et al. \textcolorblue2004, hereafter M04).
Obscured AGN look differently depending on the band in which they are observed. Therefore, to provide a census as complete as possible of these AGN, it is fundamental to follow a multi-wavelength approach and keep into consideration the observational biases behind each of the adopted source selection methods. The safest way to identify Compton-thick AGN and describe the basic X-ray properties of their nuclear emission consists of detecting the primary continuum piercing through the absorber, but this typically requires measurements above 10 keV. Below 10 keV, the classification of a source as a Compton-thick AGN relies mostly on indirect indications, such as the observation of a flat photon index for the hard X-ray continuum, the presence of a reflected and/or scattered continuum, a prominent iron K fluorescence emission line (with typical equivalent width, EW, of keV), and anomalously low values for the ratio between the observed X-ray flux and that predicted on the basis of AGN intrinsic emission proxies at other wavelengths.
Over the last fifteen years, in the deepest fields 80% of the 2–10 keV XRB has been resolved into individual objects by Chandra and XMM-Newton surveys (Hickox & Markevitch, 2006; Brandt & Alexander, 2015). At energies above 10 keV, however, the observational framework is far from being complete, due to observational limitations. The sensitivity of coded-mask instruments such as Integral/IBIS and Swift/BAT ( ) is such that this investigation is limited to the local Universe (e.g., Tueller et al., 2008; Beckmann et al., 2009); in the end, the fraction of the XRB resolved by these instruments at its peak intensity (20–30 keV) is % (Krivonos et al., 2007; Ajello et al., 2012; Vasudevan et al., 2013). The field regarding hard X-ray surveys has been revitalized by the hard X-ray imaging instrument onboard NuSTAR, which has improved the sensitivity limits by a factor of more than 100 with respect to Integral and Swift, and has probed a significantly wider range in redshift, up to z3 (Lansbury et al., 2017a); we note, however, that most of the NuSTAR-detected sources lie at low redshift. NuSTAR has now resolved 35% of the XRB in the 8–24 keV band and directly identified AGN with high obscuring column densities (Ricci et al., 2015; Harrison et al., 2016; Lansbury et al., 2017b; Del Moro et al., 2017; Zappacosta et al., 2018).
This work takes advantage of NuSTAR data and is based on a multi-wavelength research approach. The work carried out by Gruppioni et al. (\textcolorblue2016, hereafter G16) on the local 12m sample of Seyfert galaxies (12MGS; Rush et al., 1993) with Spitzer-IRS spectra has played a key role in defining the selection criteria for the sample of galaxies investigated here. We used the infrared observations along with X-rays to pick up and properly investigate three local galaxies which are likely to host a heavily obscured AGN. The mid-infrared (mid-IR) regime offers a good potential for discoveries of heavily obscured AGN, since any primary AGN continuum (i.e., disc emission in the optical/UV) that is absorbed must ultimately come out at these wavelengths after being thermally reprocessed by the dusty nuclear material, i.e., the torus. G16 compared the AGN bolometric luminosity () derived from the SED decomposition (hereafter ) to the same quantity obtained by means of different methods: the 2–10 keV luminosity (from IPAC-NED public database) and the AGN mid-IR line luminosity ([Ne V]14.3m, [Ne V]24.3m and [O IV]25.9m; Tommasin et al. 2008, 2010). As the X-ray luminosities taken from literature and based on data below 10 keV were already corrected for absorption, (i.e., the bolometric luminosity derived from the X-ray emission adopting a bolometric correction) should represent the intrinsic emission from the nucleus, and the ratios should be close to unity. Instead, up to three orders of magnitude lower than were found for some sources. One possibility is that the intrinsic X-ray luminosity obtained correcting for the obscuration may be underestimated (Lanzuisi et al., 2015a).
We have tested this hypothesis by reanalysing the X-ray spectra of three sources showing a significant difference with respect to the 1:1 relation in and having hard X-ray (i.e., NuSTAR) data available. Firstly, we present the broad-band X-ray spectral analysis using observations taken by NuSTAR plus XMM-Newton and Chandra, aimed at determining their obscuration and, hence, the true AGN intrinsic power. Secondly, we investigated the absorbing medium parameters by applying a proper, physically motivated torus model to X-ray data.
The paper is organized as follows. We present the 12MGS data set and the results from the work of G16 which led to the analysis conducted in this paper in Section 2. Section 3 describes our X-ray broad-band data analysis and spectral fitting methods, and Section 4 gives the main results obtained in the present work. Finally, we discuss the results in a broader context and present our conclusions in Section 5.
Throughout this paper, we adopt a CDM cosmology with a Hubble constant =71 km s-1 Mpc-1, and .
2 The sample
2.1 The local 12MGS sample of Seyfert galaxies
The starting point of the analysis carried out by G16 was the extended 12MGS galaxy sample selected by Rush et al. (\textcolorblue1993; hereafter RMS) from the Infrared Astronomical Satellite (IRAS) Faint Source Catalogue Version-2 (FSC-2). The original RMS sample comprises 893 galaxies with IRAS 12m flux density Jy; 116 of these sources were classified as AGN (51 Seyfert 1s or quasars, 63 Seyfert 2s and two blazars). This can be considered one of the largest IR-selected AGN samples with limited selection bias, likely to be almost representative of the true number and fractions of different active galaxy types. The 12m sample benefits from an extensive ancillary dataset, including photometry and spectroscopy from X-ray to radio frequencies, coming from different observational campaigns spread over the past 20 years.
2.2 Broad-band SED decomposition: the subsample of the 12MGS
Thanks to the very detailed data (IR spectrum from Spitzer and photometry along the whole electromagnetic spectrum) available for this local sample, G16 were able to perform a detailed broad-band SED decomposition including the emission of stars, dust heated by star formation and possible AGN emission. They constrained the key physical quantities characterizing the AGN and their host galaxy, i.e., AGN luminosity and fractional contribution to the overall SED, star-formation rate (SFR) and stellar mass.
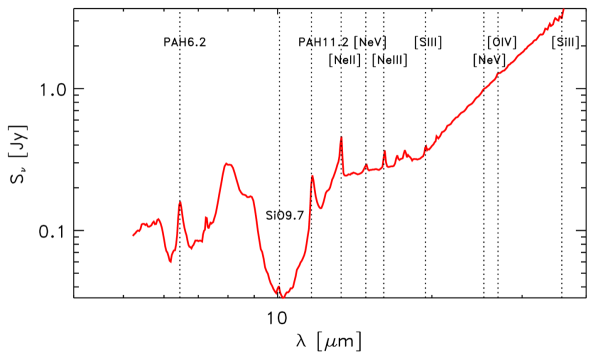
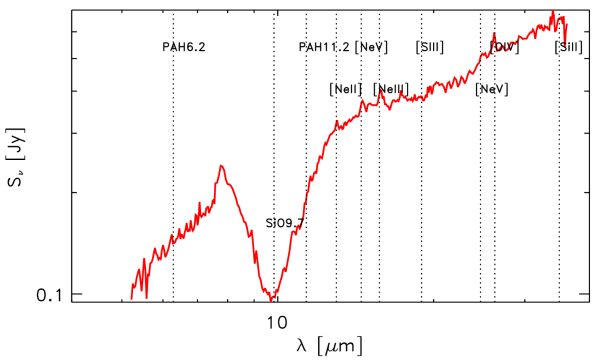
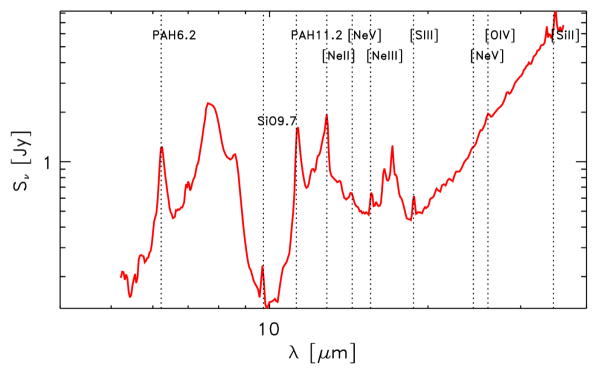
The availability of Spitzer-IRS low-resolution mid-IR spectra is crucial for disentangling and characterizing the AGN component (dusty torus) at its peak wavelengths and constraining its main parameters. This has been carried out by considering high optical depth () templates for sources showing a strong absorption feature in their mid-IR spectra. Generally, high values are associated with a deep dust absorption feature at 9.7m attributed to silicates. Figure 1 shows the IRS spectra of the sources analysed in this paper, for which the obscured nature is suggested by the prominence of this feature seen in absorption at 9.7m rest frame.
G16 obtained reliable spectra for 76 sources: 42 Seyfert 1 (including 4 quasars), 27 Seyfert 2 and 7 non-Seyfert galaxies (6 H II and one LINER). To maximize the data coverage in the mid-IR range, where the emission from the AGN torus is expected to peak, they have re-binned the IRS spectral data in 2-m intervals and added these data to the photometric datapoints. About the AGN emission, the adopted library includes both the emission of the dusty torus and that of the accretion disk (whose contribution is expected to be more relevant in Seyfert 1 than in Seyfert 2 galaxies). The AGN models, based on a continuous (e.g., “smooth") distribution of dust in the torus (Fritz et al., 2006; Feltre et al., 2012), were found to reproduce adequately the mid-IR emission of AGN in past works (see, e.g., Vignali et al. 2009; Pozzi et al. 2012; Gilli et al. 2014). To reduce the parameter degeneracies (which are present in all SED-fitting/decomposition codes), also the X-ray classification, including the column density and X-ray luminosity (as available from the IPAC-NED public database) has been taken into account, along with the classification based on optical and mid-IR spectra, to select the type of torus models used to fit the SED. In particular, for each source G16 used the value and the presence/absence of the 9.7m feature to reduce the number of possible torus solutions: they excluded all the torus models with no 9.7m absorption feature for objects with high and/or with that feature observed in the IRS spectrum. Vice versa, they excluded the high- models for objects with low column density and/or no 9.7m feature in absorption in the IRS spectrum. AGN bolometric luminosities were estimated using the X-ray luminosity and a bolometric correction.
| Name | RA (J2000) | Dec. (J2000) | z | ||||
|---|---|---|---|---|---|---|---|
| (1) | (2) | (3) | (4) | (5) | (6) | (7) | (8) |
| 3C120 | 68.294 | 5.355 | 0.0330 | 45.9 | 44.2 | 11.5 | 12.2 |
| 3C273 | 187.282 | 2.051 | 0.1583 | 48.1 | 45.8 | 13.0 | 14.3 |
| 3C445 | 335.955 | -2.104 | 0.0562 | 46.2 | 43.9 | 11.7 | 11.8 |
| ESO362-G018 | 79.903 | -32.658 | 0.0124 | 43.8 | 42.4 | 10.7 | 9.9 |
| IC4329A | 207.331 | -30.310 | 0.0161 | 45.5 | 43.7 | 11.5 | 11.5 |
| IRASF07599+6508 | 121.138 | 64.997 | 0.1488 | 42.9 | 42.1 | 12.4 | 9.5 |
| IRASF13349+2438 | 204.325 | 24.386 | 0.1076 | 45.5 | 43.8 | 12.7 | 11.7 |
| Izw001 | 13.396 | 12.693 | 0.0611 | 45.3 | 43.6 | 12.3 | 11.4 |
| MGC-03-34-064 | 200.598 | -16.726 | 0.0165 | 45.2 | 42.9 | 11.5 | 10.5 |
| MRK0006 | 103.051 | 74.427 | 0.0188 | 44.9 | 43.1 | 10.4 | 10.8 |
| MRK0079 | 115.637 | 49.808 | 0.0222 | 44.9 | 43.8 | 11.6 | 11.7 |
| MRK0273 | 206.174 | 55.887 | 0.0378 | 44.3 | 42.8 | 11.8 | 10.4 |
| MRK0335 | 1.576 | 20.201 | 0.0258 | 44.7 | 43.5 | 10.9 | 11.3 |
| MRK0463 | 209.011 | 18.372 | 0.0504 | 44.8 | 43.1 | 12.5 | 10.8 |
| MRK0704 | 139.607 | 16.307 | 0.0292 | 44.5 | 43.4 | 11.3 | 11.1 |
| NGC0262 | 12.201 | 31.957 | 0.0150 | 44.2 | 43.3 | 11.3 | 11.0 |
| NGC0424 | 17.862 | -38.085 | 0.0118 | 44.3 | 42.5 | 11.2 | 10.0 |
| NGC0526A | 20.978 | -35.065 | 0.0191 | 44.8 | 43.3 | 10.3 | 11.0 |
| NGC1194 | 45.952 | -1.104 | 0.0136 | 43.9 | 42.3 | 11.1 | 9.7 |
| NGC1365 | 53.402 | -36.140 | 0.0055 | 43.0 | 42.5 | 10.4 | 10.0 |
| NGC2992 | 146.418 | -14.323 | 0.0077 | 44.0 | 43.1 | 10.1 | 10.8 |
| NGC3079 | 150.491 | 55.681 | 0.0037 | 41.2 | 40.9 | 10.0 | 8.2 |
| NGC3516 | 166.703 | 72.567 | 0.0088 | 44.3 | 43.8 | 10.2 | 11.7 |
| NGC4051 | 180.791 | 44.531 | 0.0023 | 42.6 | 40.9 | 8.9 | 8.2 |
| NGC4151 | 182.644 | 39.402 | 0.0033 | 44.0 | 42.1 | 10.5 | 9.5 |
| NGC4253 | 184.608 | 29.814 | 0.0129 | 44.3 | 43.0 | 10.6 | 10.6 |
| NGC4388 | 186.441 | 12.664 | 0.0084 | 43.3 | 42.9 | 10.7 | 10.5 |
| NGC4593 | 189.917 | -5.346 | 0.0090 | 44.2 | 42.8 | 10.0 | 10.4 |
| NGC5256 | 204.576 | 48.275 | 0.0279 | 43.2 | 42.2 | 11.2 | 9.7 |
| NGC5506 | 213.309 | -3.207 | 0.0062 | 44.4 | 42.8 | 10.6 | 10.4 |
| NGC5548 | 214.499 | 25.137 | 0.0172 | 45.1 | 43.4 | 11.3 | 11.1 |
| NGC6810 | 295.890 | -58.656 | 0.0068 | 40.6 | 39.9 | 10.0 | 7.1 |
| NGC6890 | 304.577 | -44.806 | 0.0081 | 41.7 | 42.2 | 9.7 | 9.7 |
| NGC7213 | 332.319 | -47.166 | 0.0058 | 43.4 | 42.7 | 9.7 | 10.3 |
| NGC7469 | 345.815 | 8.874 | 0.0163 | 44.5 | 43.2 | 10.9 | 10.9 |
| UGC05101 | 143.953 | 61.356 | 0.0394 | 42.3 | 42.5 | 12.0 | 10.0 |
2.2.1 AGN bolometric luminosity: relation and source selection
In Fig. 6 of G16 the AGN bolometric luminosity derived from the SED decomposition (i.e., from the best-fitting torus model) is compared to the same quantity obtained from the 2–10 keV luminosity (IPAC-NED database). This relation is more dispersed and with a lower significance than those derived using mid-IR AGN lines in the G16 work. The scatter around the 1:1 relations is , , , and . The significance of these relations are 1.5, 3.4, 3.3, and 3.2 for X-ray, [Ne V]14.3m, [Ne V]24.3m and [O IV]25.9m luminosities, respectively. The relative low significance of the relation involving the X-ray luminosity is ascribed to the presence of several objects showing AGN bolometric luminosities estimated from the X-ray band (by means of a bolometric correction) lower than those derived by decomposing the SED. Most of the deviating objects are known to be highly obscured AGN (e.g., IRASF07599+6508, UGC05101), showing relatively low X-ray luminosities ( erg s-1). However, at these X-ray luminosities it is possible that some of these sources may present a significant contamination from star-formation (e.g., Brightman & Nandra 2011b consider “X-ray AGN" only sources with an observed 2–10 keV luminosity larger than erg s-1).
As the adopted X-ray luminosities have been corrected for absorption, should represent the intrinsic emission from the nucleus, and the ratios should be close to 1. The difference up to three orders of magnitude shown in the plot for some sources suggests that correcting for obscuration may be difficult also in X-rays if the data quality is not high and the observing band is limited (i.e., data were available only below 10 keV). The intrinsic X-ray luminosity obtained by means of a correction for obscuration could be underestimated.
Since the intrinsic luminosity in the 2–10 keV band has been taken from various literature papers, we tried to evaluate how much of the scatter found in G16 could result from a not uniform choice of the . We computed the bolometric correction as a function of the bolometric luminosity considering the 2–10 keV luminosity. The AGN sample is composed of sources for which the values, taken from Brightman & Nandra (\textcolorblue2011a, hereafter BN11a) and based on XMM-Newton observations, were available. Table 1 provides the relevant information about these sources. Despite the scatter, the known trend of increasing bolometric correction at increasing bolometric luminosity is confirmed (Lusso et al.; see also the recent work by Martocchia et al. 2017). Since it seems that for not all of the sources the same was applied, to uniform the analysis we systematically re-computed all the bolometric luminosities by adopting M04 relation; Table 1, column 8, lists the derived values.
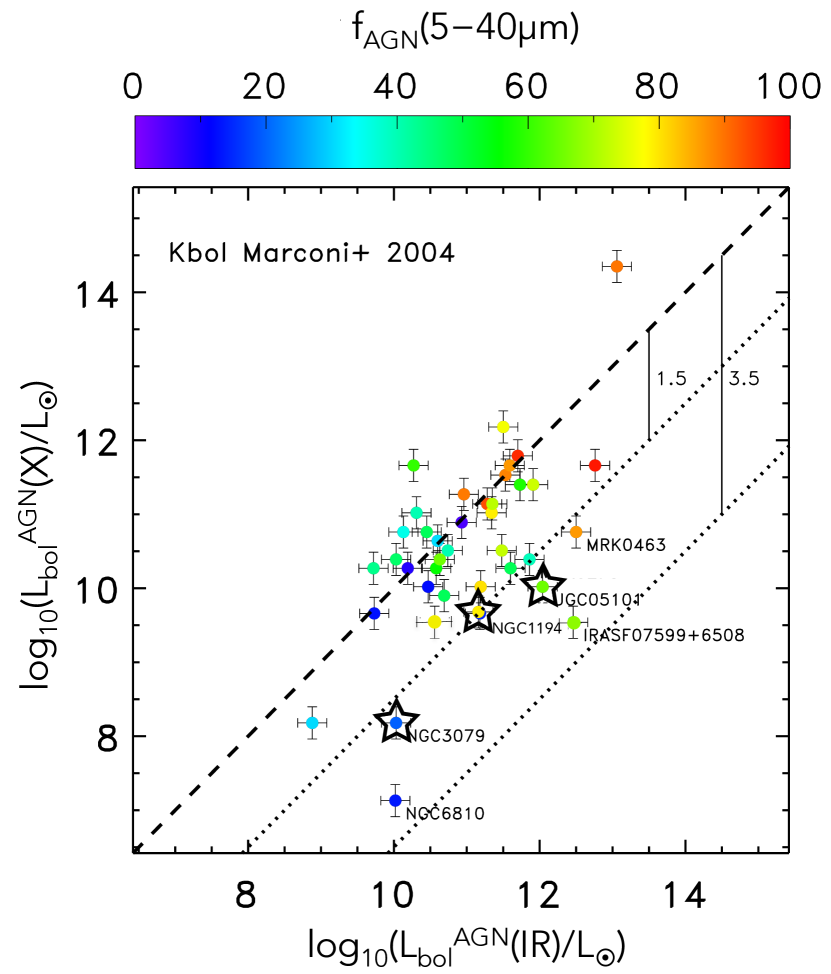
Now we can plot the versus using in the y-axis our newly X-ray-derived bolometric values (Fig. 2). The dashed line on this diagram represents the 1:1 relation. The correlation is tighter with respect to the original one; nonetheless, there are still a few sources clearly “underluminous" in the 2–10 keV band. These galaxies are labeled in the plot.
We focused on the sources showing the most striking separation from the 1:1 relation ( times below in the log–log space). Among these, we selected those for which observations from at least two satellites were available, one of these being NuSTAR (Harrison et al., 2013), complementary to Chandra and/or XMM-Newton, to have a broad-band, although not simultaneous, X-ray spectral coverage. The resulting selected sources are UGC05101, NGC1194 and NGC3079. We note that NGC3079 was already reported as a Compton-thick AGN by BN11a in virtue of its large iron K EW and reflection fraction. Furthermore, NGC1194 and NGC3079 are water megamaser AGN (Pesce et al., 2015; Kondratko, Greenhill, & Moran, 2005) and, as such, were presented in a compilation by Masini et al. \textcolorblue2016 (hereafter M16). For instance, the almost ubiquitous presence of heavy obscuration in water megamasers AGN was presented in several works (e.g., Greenhill, Tilak, & Madejski 2008; Castangia et al. 2013; Leiter et al. 2018). For UGC05101 and NGC3079, data from all three satellites are available, while NGC1194 has XMM-Newton and NuSTAR observations only.
We note that there are other sources apparently satisfying the adopted conditions for “extreme" source selection. These either lack NuSTAR data or are undetected by NuSTAR; in the case of Mrk463, a comprehensive, broad-band analysis of the galaxy hosting two active nuclei (Bianchi et al., 2008) has been recently published (Yamada et al., 2018). Focusing on the two sources deviating most from the 1:1 relation, i.e. NGC6810 and IRASF07599+6508, the former is most likely a starburst according to published X-ray observations (Strickland, 2007, BN11a) and has no available NuSTAR data, while the latter is a Broad Absorption Line Quasi-Stellar Object (BALQSO), undetected in the 28 ks NuSTAR observation (Luo et al., 2014).
3 X-ray broad-band spectral analysis
3.1 Data reduction
The set of observations used in this work consists of European Photon Imaging Camera (EPIC-pn and MOS) XMM-Newton observations along with the Chandra Advanced CCD Imaging Spectrometer (ACIS-S) and the NuSTAR Focal Plane Modules (FPMA-B) observations.
3.1.1 XMM-Newton
The raw observation data files have been processed using SAS111https://www.cosmos.esa.int/web/xmm-newton/sas. v16.0 tasks, with the associated latest calibration files. A standard XMM-Newton reduction has been applied and the calibrated event files were screened to check for soft protons flaring examining the light curves at energy 10 keV. For NGC3079 the cleaning was done applying a threshold to the count rate (CR1.5 for pn and CR0.7 for the MOS cameras). The source spectra were extracted from a circular region centered on each source (radius of 20′′ and 10′′ for pn and MOS events, respectively, for NGC1194; 30′′ and 20′′ for pn and MOS events for NGC3079; 20′′ for both pn and MOS events in the case of UGC05101). The chosen areas encircle 80% of the photons energy at 5.0 keV. For the background we typically chose a 10 times larger area (when possible), adopting circular and elliptical regions on the same CCD where the source is located, ensuring no contamination from nearby sources. This guarantees a good sampling of the background spectrum and optimize the signal-to-noise ratio. None of the sources shows photon pile-up. Here and in the following X-ray spectral fits, the background is obviously normalized to the source area.
3.1.2 Chandra
To perform the data processing and calibration we used the analysis package CIAO222http://cxc.harvard.edu/ciao. v4.8. All the observations were carried out in imaging mode with the ACIS-S3 detector operating in faint mode. Starting from level 1 event files, new level 2 filtered event files were generated, using the latest calibrations. From the evt2 files we generated new files selecting good grades, the CCD in use and data in the keV spectral range. Chandra images also show diffuse emission from the host galaxy, unresolved by XMM-Newton, for their superior spatial resolution. In particular, the Chandra image of NGC3079 shows that the nuclear source is embedded in a bubble of diffuse emission (stellar winds and supernova explosions, Cappi et al., 2006). This structure extends for 11′′ around the nuclear position; however, it does not contribute significantly to the nuclear emission at E2 keV. Therefore, we extracted the source spectrum from a circular region of radius 4′′ centered on the source maximizing the nuclear emission. For UGC05101 we varied the extraction radius, obtaining Chandra spectra from two circular regions, one including mostly the nuclear emission (radius of 2′′) and the other encircling also a more extended emission (radius of 5′′). For the background, we chose an appropriate large area in both cases, to be free from contaminating sources, always following the same criteria. We then ran specextract tool to create spectra and responses matrices.
3.1.3 NuSTAR
The data have been reduced using NUSTARDAS333https://heasarc.gsfc.nasa.gov/docs/nustar/analysis. v1.8 and instrumental responses from NuSTAR CALDB. We produced calibrated and cleaned event files from the level 1 event files applying the nupipeline script that runs in sequence all the tasks of the standard data processing. Events are flagged according to various cuts criteria and screened by applying cleaning criteria. We produced source extraction region files by choosing a circular region of 40, 45 and 30 arcsec radius centered on the source for NGC1194, NGC3079 and UGC05101, respectively, to optimize the signal-to-noise ratio (SNR). The same choice was made for FPMA and FPMB. We selected the background regions in blank areas as close to each source as possible without including source photons, on the same detector where the source is located and away from the outer edges of the field of view (which have systematically higher background). To extract the level 3 science products, e.g. spectra and response matrices, we run the nuproducts module.
3.2 Photon statistics and spectral binning
For each source observation, the incidence of the source counts with respect to the total (sourcebackground) is 80% in the spectral range used to fit the data. The spectra of the two individual MOS cameras were summed into a single spectrum for each observation, summing also the corresponding background spectra, and merging the response matrices as well; response matrices are weighted by the exposure time of each instrument. We will fit the summed MOS spectra simultaneously with the pn spectrum. This gives the same quantitative results as fitting the three EPIC spectra simultaneously, and the SNR in each bin increases. Data from the two NuSTAR FPM detectors will be fitted simultaneously rather than coadded because data are not always completely consistent with each other over the whole range in which they operate.
Finally, we rebinned the spectra for further analysis with XSPEC (version 12.9.0; Arnaud 1996), in order to have at least 20 (15 in case of Chandra data) counts in each spectral bin. The binning we applied is appropriate for statistics that is valid in Gaussian statistics regime, e.g., if there are enough counts in each spectral bin.
3.3 Spectral modeling
In order to derive the source physical properties, within the limits of the available statistics, we first constructed a phenomenological model to obtain a first-order source characterization. We then adopted a physically motivated model, MYTorus (Murphy & Yaqoob, 2009), specifically developed to model Compton-thick obscuration in a toroidal geometry. We developed a systematic approach to the spectral fitting of our sample, starting the analysis from the XMM-Newton pn data to have preliminary spectral indications of the source properties using the dataset with the highest statistics; these indications were then verified including also the MOS data in the analysis. Then, separately, the same best-fitting model obtained with XMM-Newton has been applied to Chandra and NuSTAR data separately to verify whether significant spectral variations are present among the various datasets (having in mind the different spectral coverage and energy resolution of the instruments). Once checked that the same model applies reasonably well to all datasets, as a final stage we performed a full-band spectral fit considering all the available X-ray data. The three sources seem to be characterized by similar spectral components, therefore the adopted spectral modeling will be the same. This approach, testing increasingly complicated models to find the best spectral fit to the data, is described below.
As a phenomenological model, we initially assumed a standard power-law model, to account for the source continuum emission, and Galactic absorption, fixed to the measured value obtained using nh tool within FTOOLS (Kalberla et al., 2005). This is the simplest scenario for an AGN. We interpret any relatively flat X-ray slope (power-law photon index with values 1) as suggestive of the presence of either a reflection or a transmission component (i.e., passed through an absorbing medium), or both. In the following phenomenological model we will assume the transmission scenario (to limit model degeneracies and make the model not too complicated at this first stage), although we note that reflection can be present (as in the case of NGC1194). We then gradually included additional, physically motivated model components looking at the residuals (data-model in units of the statistical uncertainty, reported in the lower panel of each figure showing the X-ray spectra and data). For what concerns the soft X-ray band, “extra" X-ray emission (wrt. the extrapolation of the primary power-law emission) is generally observed and interpreted as nuclear emission scattered at the “poles" by electrons (Thomson scattering) plus thermal emission ascribed to the host galaxy. Finally, once the continuum is fitted relatively well, we tried to model any residuals indicating the possible presence of emission features. To summarize, the spectral model components used to provide a phenomenological spectral characterization of each source are the following:
-
1.
Neutral absorption at redshift 0 (phabs model within xspec), associated with the Galaxy (from Kalberla et al. 2005).
-
2.
A neutral absorber at the source redshift due to absorbing structures in the host galaxy, such as dust lanes (see e.g., Severgnini et al., 2015); values are usually few cm-2.
-
3.
A thermal plasma component, mekal, to account for the excess with respect to the power law, ubiquitously observed in the soft spectra and visible at energies 2 keV. It may arise from unresolved emission structures likely due to binaries and supernovae remnants.
-
4.
A primary power law, powerlaw, to account for the source continuum emission. During the spectral fitting procedure, the spectral index of the primary power law was fixed to the AGN typical value (, e.g. Piconcelli et al., 2005).
-
5.
A second neutral absorption component at the source redshift , zphabs, for nuclear absorption intrinsic to the source. We left it as a free parameter during the model fitting procedure.
-
6.
A soft power law to account for soft emission from any scattered power law radiation often seen in type 2 Seyfert spectra (e.g., Turner et al., 1997). The power law index is fixed to , being the photons physical origin the same. The normalization of the soft power law is typically a few percent of the primary one (e.g., Lanzuisi, et al., 2015b).
-
7.
Line emission modeled by one or more Gaussian components (zgauss).
We have chosen the best-fit model as the simplest one that has a combination of components with the lowest reduced and is physically motivated.
Given that an obscuring model seemed to be required, we subsequently performed the analysis adopting the spectral-fitting suite MYTorus trying to reproduce in more physical terms the emission of the obscured objects. MYTorus (Murphy & Yaqoob, 2009) is a physical model, designed specifically for modeling the X-ray spectra of active galaxies assuming a toroidal geometry for the reprocessor (uniform and cold). MYTorus, based on Monte Carlo simulations, self-consistently includes reflection and transmission (see e.g. Lanzuisi, et al. 2015b for further details, Appendix B of Lanzuisi et al. 2015a for a comparison with other models applied to heavily obscured AGN, and the recent work by Marchesi et al. 2019). Additional components (low-energy scattering, host galaxy emission, and emission lines, as observed in particular in the X-ray spectrum of NGC1194) were included along with MYTorus.
The best-fitting models are reported source by source. All errors are quoted at the 90% confidence level for one parameter of interest ( = 2.706, Avni, 1976).
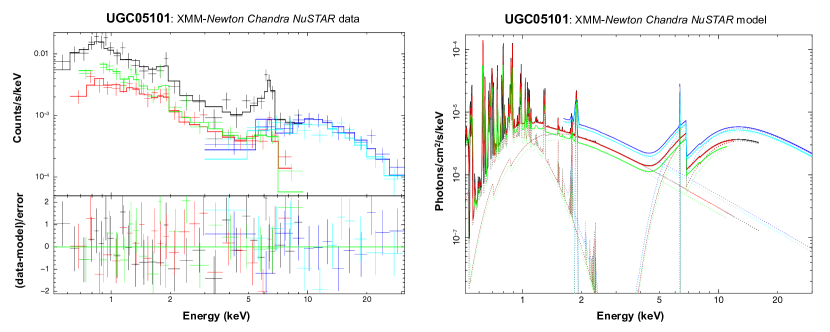
3.3.1 UGC05101 spectral fits
A first individual analysis of the spectra from each instrument shows that there is no evidence for significant spectral differences, therefore we used the datasets together, adopting at first the phenomenological model described in Sec. 3.3 and then a more physical one, as previously described. Using the simultaneous spectral fit we are able to recover information from the broad 0.5–30 keV band. In order to take into account calibration issues among the different datasets, besides some flux differences due to the fact that the analyzed data were not simultaneous, each dataset has been multiplied by a constant. The resulting values for the constants are typically consistent to within 20%. A similar approach will be adopted for the other sources. For what concerns the MYTorus model, it is adopted in the coupled version (cross-normalization fixed to 1 between primary power law, reflection and line emission).
Phenomenological model. Figure 3 (top-left panel) shows the full-band spectrum fitted with the phenomenological transmission model (reported in the top-right panel), including data-model residuals in units of . The black curve refers to the pn, while the red one shows the summed MOS1-2 spectrum; the green line indicates the ACIS-S3 spectrum, and blue and light blue lines indicate the FPMA and FPMB spectra, respectively.
The continuum spectral components model the cut-off due to Galactic ( (Gal) cm-2) and host galaxy absorption ( cm-2), plus a thermal emission with temperature kT0.2 keV, a scattered component and a heavily absorbed primary component. The normalization of the soft power law ( fixed to 1.8) is 3% of the primary one at 1 keV. The absorption intrinsic to the source has a value cm-2. Narrow Gaussian lines (zgauss, with frozen to 10 eV) are added with best-fitting centroid energies at 1.98 keV and 6.4 keV (rest-frame energy) to model emission lines from Si XIV and neutral Fe K, respectively. In xspec notation, the resulting model is phabs[mekal + zgauss + zpowerlaw + zphabs(zpowerlaw + zgauss)]. In the NuSTAR spectrum, because of poor spectral resolution ( eV at 6 keV), the Fe emission line is not constrained. Apparently, the iron line energy is not consistent with being neutral; however, once only XMM-Newton data (having good energy resolution and photon statistics at the energy of the line) are used, we find it to be in the range 6.4–6.8 keV (at the 90% confidence level), i.e., consistent with neutral emission up to the He-like transition; we note that neutral or mildly ionized iron emission (E=6.46 keV) was found by Oda et al. (2017) analysis and reported in previous investigation based on Chandra data alone (Imanishi et al., 2003; Iwasawa et al., 2011). The reduced (/dof, where dof=degrees of freedom) of our best fit is 80.8/87.
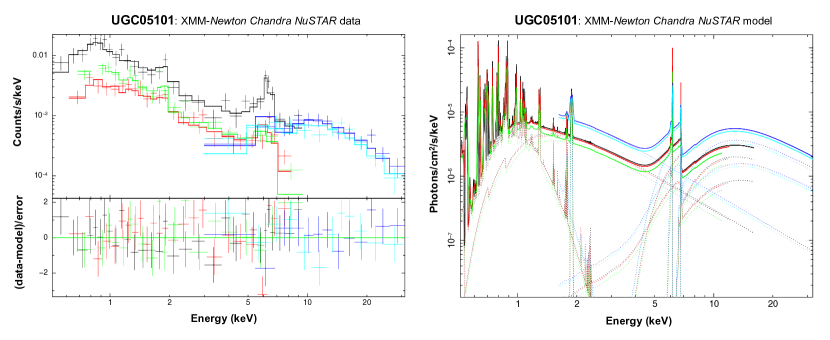
MYTorus model. Figure 3 (bottom-left panel) shows the full-band spectrum fitted with the MYTorus model and data-model residuals in units of ; in xspec notation, this model can be reported as phabs(mekal + zgauss + zpowerlaw + MYTorus); see Fig 3 (bottom-right panel). The power law spectral index was fixed to the AGN typical value . Table 2 lists the basic parameter values with their relative errors. The derived value is cm-2, consistent with the recent analysis carried out by Oda et al. (2017). The absorption column density along the line of sight is basically the equatorial one, since the incident angle (angle between the observer line-of-sight and the symmetry axis of the torus) is . The reduced of the fit is 92.9/89.
A more in-depth comparison of our results with those of Oda et al. (2017), where Chandra, XMM-Newton, NuSTAR, Suzaku and Swift/BAT data were used and interpreted using both a phenomenological and a more “physical" modeling, indicates that overall our results are in agreement with theirs. More specifically, Oda et al. (2017) used the Ikeda, Awaki, & Terashima (2009) torus model, and found that its half-opening angle is (see their Table 5) and the equatorial column density is cm-2. Due to their broader band and higher statistics data, they were able to constrain the photon index (1.63). Conversely, we were not able to obtain good constraints on the photon index once it was left free to vary within the MYTorus modeling; however, still provides a good representation of our data, and the derived main source parameters adopting this photon index are basically unchanged within errors.
The AGN flux in the 2–10 keV band is ( in Oda et al. 2017) and corresponds to an intrinsic (i.e., corrected for the measured obscuration) rest-frame 2–10 keV (10–40 keV) luminosity of erg s-1 ( erg s-1); see Table 3.
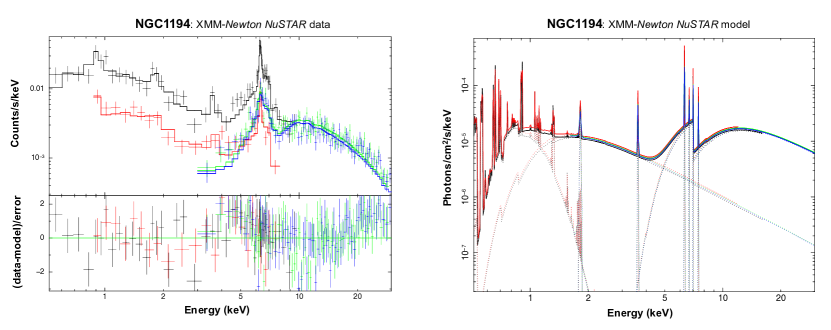
3.3.2 NGC1194 spectral fits
Once verified that the XMM-Newton and NuSTAR spectra provide a similar description of the NGC1194 properties and in absence of a significant flux variation in the 3–10 keV common band, being the values according to both satellites, we were able to fit the full-band 0.5–30 keV spectra.
Phenomenological model. Figure 4 shows the simultaneously fitted spectra (top-left panel) and the relative phenomenological transmission model (top-right panel); pn data are in black, MOS (summed) in red, NuSTAR FPMA in green and FPMB in blue. All the spectral features identified in the pn spectrum are reproduced in the MOS data, except for what may be the Ni K emission line (visible from the residuals around 7.5 keV), possibly due to the lower effective areas of the MOS detectors. The Galactic column density for this source is cm-2; also in this case an extra absorption of cm-2 was required in the soft band. To account for the host galaxy contribution, we added a mekal component, with a derived temperature of kT0.11 keV. Also included is a second power law component with spectral index fixed to to model the scattering fraction of the nuclear radiation that results equal to . In addition to the Fe K and Fe K fluorescence lines, emission features from several other elements are evident in the pn spectrum and mostly confirmed by the summed MOS spectra (SiXIII, Ca K, He-like FeXXV and Ni K). In xspec notation, the phenomenological model for NGC1194 is phabs[mekal + zgauss + zgauss + zpowerlaw + zphabs(zpowerlaw + zgauss + zgauss + zgauss + zgauss)]. Fluorescent lines from Ca and Si (and from other cosmically abundant elements such as C, O, Ne, Mg and S) are less observationally relevant than those from Fe and Ni due to their small fluorescence yield and because lower energy line photons have a higher probability of being absorbed before escaping the medium than higher energy photons (see e.g., Matt et al., 1997). Nevertheless, the fluorescent lines due to lighter elements can be important in “pure-reflection" spectra (see, e.g., Piconcelli et al. 2011). The resulting is cm-2. The reduced of the fit, 281.7/214, is suggestive that further spectral complexities may be present. In fact, some positive residuals at 4-5 keV and above 15 keV are visible in Fig. 4 (top-left panel, including data-model residuals, in units of ), possibly suggesting the presence of a strong reflection component (see below for the improvement in the spectral fit using MYTorus model). This would be in agreement with the presence of strong emission lines.
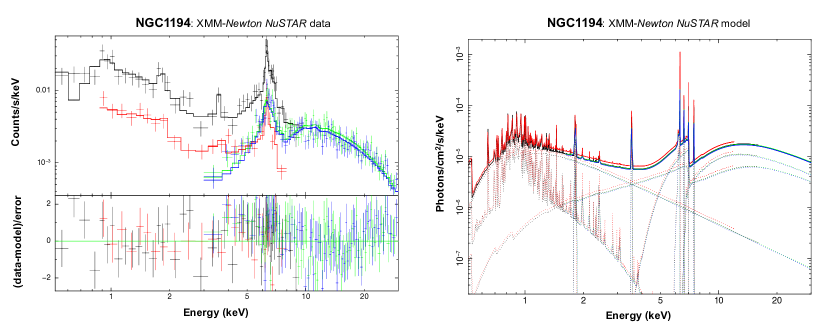
MYTorus model. Figure 4 shows the MYTorus model (bottom-right panel) fitting the full-band spectrum (bottom-left panel); all the basic spectral parameters with the relative errors are reported in Table 2. The resulting is 2.08 cm-2, hence in the Compton-thick regime. After having tested different values for the incident angle, we adopted , where the fit seems to converge. The absorption in the soft (Galactic+extra) has a column density of cm-2; the thermal plasma component has a temperature 0.8 keV, and the scattered nuclear radiation results to be 1% (consistent with the scattering reported in Marchesi et al. \textcolorblue2018, hereafter M18). The prominent Fe K emission line is properly reproduced using the MYTorus model. Its EW has been measured to be relatively high (650 eV rest-frame). In addition to Fe K and Fe K, self-consistently fitted by the MYTorus model, it was possible to describe the other emission residuals with the addition of Gaussian components, with centroid energies at keV (Si XIII), keV (Ca K), keV (Ni K) and fixed at 6.7 keV (He-like FeXXV). In xspec notation, this model can be reported as phabs(mekal + zgauss + zgauss + zgauss + zgauss + zpowerlaw + MYTorus). The reduced of the fit is 257.0/219. As suggested by the phenomenological model, the residuals at 4-5 keV and above 15 keV are well modeled by the reflection component of MYTorus ().
NGC1194 has been subject of multiple X-ray analyses in recent years; our results are broadly consistent with those published. In Georgantopoulos & Akylas (2019, NuSTAR data), M18 (XMM-NewtonNuSTAR data), Tanimoto et al. (2018, SuzakuSwift/BAT data) and M16 (NuSTAR data) the source is presented as a Compton-thick AGN444The column density is below the Compton-thick threshold only in the work of M18, where NGC1194 is, however, considered as being Compton-thick within uncertainty using the spectral curvature technique; see Koss et al. (2016) for definition and reliability of this technique. More in detail, in these papers the reported column densities are 1.7 cm-2, 0.81 cm-2, 1.15 cm-2, and 1.4 cm-2, respectively. In all these works, the MYTorus model has been adopted (in M16 in its decoupled version), with the exception of Tanimoto et al. (2018), where the NH reported above is referred to the phenomenological, best-fitting result. Although the derived column density value from our analysis lies in the upper envelope of the published results, we note that overall the Compton-thick nature of this source is widely confirmed; the line is strong and present in all datasets, and the derived value of EW is fully consistent with literature (e.g., EW=780 eV in M18). For what concerns the continuum emission, both M18 and M16 found a best-fitting photon index for the primary power law of and , respectively. The difference in slope between the one adopted in our paper () and 1.5–1.6 can be responsible for our slightly higher value of column density given the degeneracy between the two parameters. We note, however, that once higher energy data are considered as in the work by Tanimoto et al. (2018, including Swift/BAT), a photon index of is found.
The AGN observed 2–10 keV band flux and rest-frame, absorption-corrected luminosity (see Table 3) are and erg s-1, respectively. While the flux is consistent with both M18 and M16 values, our X-ray luminosity agrees with the value reported by M16 but is a factor of 2 higher than the one in M18, most likely because of our higher correction for intrinsic absorption. The 10–40 keV luminosity is erg s-1.
| UGC05101 | NGC1194 | NGC3079 | |
|---|---|---|---|
| () | |||
| () | |||
| - | - | ||
| - | - | ||
| - | - | ||
| - | - | ||
| - | - | ||
| - | - | ||
| - | - | ||
| - | - | ||
| - | - | ||
| - | - | ||
| - | - | ||
| - | - | ||
| /dof | 92.9/89 | 257.0/219 | 306.3/246 |
3.3.3 NGC3079 spectral fits
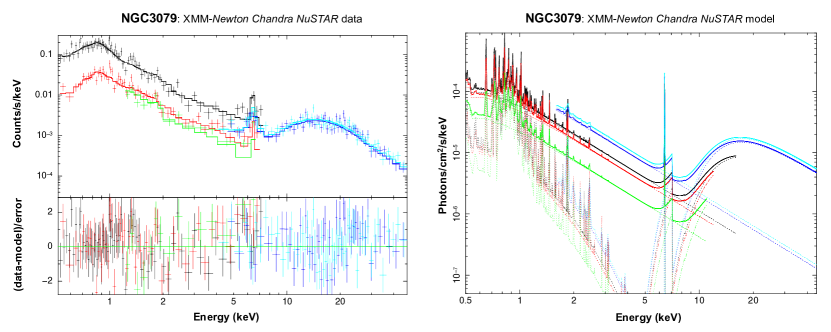
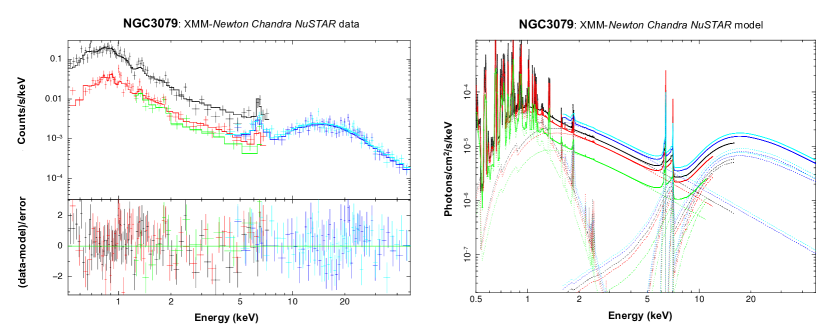
Given the absence of significant flux and spectral variability among the several datasets available for NGC3079, they were all fit simultaneously in the up to 45 keV (due to the good SNR of the NuSTAR spectra) using a transmission model.
Phenomenological model. Figure 5 (top-left panel) shows the fitted spectra (and data-model residuals in units of ) and the relative model in transmission (top-right panel); pn data are shown in black, the MOS summed spectra are in red, ACIS-S data are in green, and blue and light blue show the NuSTAR FPMA and FPMB spectra, respectively. The MOS data reproduce well all the spectral features identified in the pn spectrum, although some residuals remain at the energy of the Fe K fluorescence emission line. The resulting spectral parameters derived from the Chandra data fitted individually have values consistent with those derived from the XMM-Newton spectra, in particular the value measured in the primary power law. The Galactic absorption is cm-2, while the column density considered in the spectral fit and affecting the soft X-ray emission (Galactic+extra) is cm-2. A mekal component, with temperature kT keV, accounts for the host galaxy emission in the soft band; the scattered fraction is %. The neutral column density measured in the primary power law results cm-2, confirming that the source is heavily obscured. Summarizing, the best-fitting phenomenological model in xspec notation is phabs[mekal + zpowerlaw + zphabs(zpowerlaw + zgauss)]. Some residuals are still present (as suggested by the quality of the fit parameterized by /dof=318.5/244), especially at the iron K energy, possibly indicating some variations in the iron line properties between the XMM-Newton vs. NuSTAR datasets.
MYTorus model. Figure 5 (bottom-left panel) shows the full-band spectra fitted with MYTorus model. The spectral parameters with relative errors are listed in Table 2. The absorption (Galactic+extra) in the soft band has a column density of cm-2; the thermal plasma component has a temperature of 0.2 keV, and the scattered nuclear radiation results to be 1% (in agreement with M16). The Fe K emission line is prominent, with a corresponding (rest-frame) EW of 1.1 keV (consistent, within the errors, with the value reported by M18), indicative of heavy obscuration of the central source. Thanks to the wide band we constrained the absorption to be cm-2. This physical model, which can be reproduced within xspec as phabs(mekal + zpowerlaw + MYTorus), is shown in Figure 5 (bottom-right panel). The best value for the incident angle is close to , indicating an edge-on orientation of the source with respect to the line-of-sight. The reduced of the fit is 306.3/246; residuals are still present at 3–7 keV and at 20–30 keV, but likely do not affect significantly the main outcomes of our analysis.
Also for NGC3079 we can compare the main spectral results obtained from our analysis to those reported in recent literature works. In particular, the source is reported as heavily obscured in Georgantopoulos & Akylas (2019, cm-2), M18 ( cm-2), M16 ( cm-2), and in Brightman et al. (2015), where the TORUS and SPHERE models provide a column density in the range cm-2, pointing towards a fully-covered picture for the obscuration in NGC3079. Furthermore, in all the cited papers the power-law photon index is , consistent with the value assumed in our spectral fitting.
The AGN flux and absorption-corrected luminosity in the 2–10 keV band are (intermediate between M18 and M16) and erg s-1 (at face value, 50% lower than in M18 and M16); the X-ray luminosity in the 10–40 keV band is erg s-1.
| SrcName | MYTorus | Phenomenological | |||
|---|---|---|---|---|---|
| UGC05101 | |||||
| NGC1194 | |||||
| NGC3079 | |||||
4 Main X-ray spectral fitting results
The wide bandpass, obtained fitting simultaneously NuSTAR spectra along with either XMM-Newton or Chandra (or both) spectra, allowed us to gain new and more solid insights into the X-ray spectral properties of the 12MGS sources presented in this paper. We focused on an accurate determination of the column density parameter taking advantage of the availability of broad-band data. The resulting measured absorption column densities, in units of cm-2, are , and for UGC05101, NGC1194 and NGC3079, respectively, therefore in the Compton-thick regime. This confirms that the original selection of these sources (see Section 2.2.1) was correct. The consistency of our results will be discussed using the Gandhi et al. (2009) relation in 5. The rest-frame EWs of the K iron fluorescent emission line are about 150 eV, 650 eV and 1.1 keV, respectively. These values are highly suggestive of heavy obscuration (at least for NGC1194 and NGC3079). For UGC05101, even if all spectral models suggest a Compton-thick nature of the source, the iron line results to be weak, consistent with the results obtained by Oda et al. (2017) and Iwasawa et al. (2011). A possible explanation for the low EW of the line could be either a low metallicity or a low covering factor for the torus. To check whether the latter hypothesis is viable, we fitted the data using the BORUS02 model (Baloković et al., 2018), where the covering factor of the obscuring medium is a free parameter of the fit. The fit is worse (/dof=119/87) than the one obtained with MYTorus, but overall the main components described above and the derived spectral parameters (including the column density of the obscuring medium) are confirmed. The resulting covering factor of the torus is constrained to be (where unity means a fully-covered source), and the torus appears to be observed at an inclination angle close to 90∘ (i.e., edge-on). Hence, a low covering factor for the torus can provide a reasonable explanation for the low EW of the iron emission line reported above.
As exercise meant to determine how much one can be wrong in using a phenomenological model (a transmission model in this case) and as a posteriori verification, we compared the column densities derived using the two tested models, i.e. MYTorus and the phenomenological model. Table 3 lists the values. They are broadly consistent and, overall, all indicate that the sources suffer from heavy obscuration. The intrinsic (i.e. corrected for the absorption) AGN rest-frame luminosity in the 2–10 keV band is , and erg s-1 in case of UGC05101, NGC1194 and NGC3079, respectively, all obtained using the MYTorus model. We investigated the 2–10 keV luminosity of the AGN using also the phenomenological transmission model to evaluate how much model-dependent the results are. Table 3 lists the values derived from the different spectral models. It results that MYTorus systematically provides higher luminosity values with respect to the phenomenological model, without necessarily finding higher values. In the most extreme case (NGC3079), the value inferred from the phenomenological model is 40% of the MYTorus one.
5 Discussion and conclusions
In this paper we have focused on the search and detailed X-ray spectral analysis of heavily obscured AGN candidates. The sources have been selected from the subsample of the local 12MGS considered by G16 to trace black hole accretion by means of SED decomposition. G16 compared the AGN bolometric luminosity () derived from the SED decomposition to the same quantity obtained by means of different methods, among which the 2–10 keV luminosity converted into a bolometric luminosity using a bolometric correction. From the ratios, a difference up to three orders of magnitude resulted for some sources, suggesting that the original intrinsic X-ray luminosity, although formally corrected for the obscuration, could be underestimated. In particular, in the present work we have focused on three of the most extreme of such sources, showing a significant difference with respect to the 1:1 relation and for which data from at least two satellites were available, one of these being NuSTAR, complementary to XMM-Newton and/or Chandra. NuSTAR extends the spectral band up to high energies (30–45 keV), whereas XMM-Newton and Chandra provide spectral coverage down to 0.5 keV and good spectral resolution (150 eV at energy 6.4 keV) and photon statistics below 10 keV. This approach is necessary to constrain all the spectral components in an appropriate way. The resulting selected sources are UGC05101, NGC1194 and NGC3079; for these sources we provided an accurate analysis of the X-ray spectra. We aimed at determining their obscuration and, hence, their true intrinsic power, by applying the physically motivated MYTorus model to X-ray data.
The X-ray spectral properties inferred from our broad-band analysis are highly suggestive of heavy obscuration. In particular, the measured absorption column densities, in units of cm-2, are , and for UGC05101, NGC1194 and NGC3079, respectively, with typical errors of the order of 12% (at the 90% confidence level), therefore in the Compton-thick regime. The large measured values are consistent with the prominent dust absorption features attributed to silicates present in the Spitzer-IRS spectra of these sources (Fig. 1), and with previous analyses (e.g., Oda et al. 2017; \al@Masini2016, Marchesi2018; \al@Masini2016, Marchesi2018).
Furthermore, compared to other literature works dealing with a broad-band analysis as the one presented in this paper, we have strictly linked the X-ray properties of the sources with those derived in the mid-IR via SED-fitting decomposition (G16). Of the sources listed in Tab. 1, all the three analyzed here (%) are recognized as Compton-thick once the NuSTAR data are taken into account. Interestingly, M18 found a fraction of of hard X-ray selected sources (from the Swift-Burst Alert Telescope (BAT) 100 month catalog) for which the addition of NuSTAR data has the opposite effect, turning their classification from Compton-thick to Compton-thin, thus underlying again the importance of a broad-band approach for local obscured AGN.
To finally verify the intrinsic X-ray power derived from the spectral analysis, we compared the absorption-corrected 2–10 keV luminosities (adopting the MYTorus modeling) with those derived from the mid-IR band using the empirical relation by Gandhi et al. (2009); see also Asmus et al. (2015). The mid-IR (12.3m) luminosity for the AGN component alone is derived directly from the SED fitting carried out by G16 and can be considered an accurate proxy of the intrinsic AGN power, since any primary continuum (i.e., disc emission) that is absorbed must ultimately come out at these wavelengths after being thermally reprocessed by the torus (e.g., Lutz et al., 2004; Maiolino et al., 2007). We therefore expect that the X-ray luminosities obtained from X-ray fitting and those derived from the mid-IR AGN emission are in good agreement. Table 4 lists the values along with the comparison between derived from the Gandhi et al. (2009) relation and those obtained from the X-ray spectral analysis. Overall, the values are in good agreement, further supporting that the estimate of the column densities from the X-ray spectral analysis carried out in this work is likely correct.
| Name | |||
|---|---|---|---|
| derived | measured | ||
| UGC05101 | |||
| NGC1194 | |||
| NGC3079 | |||
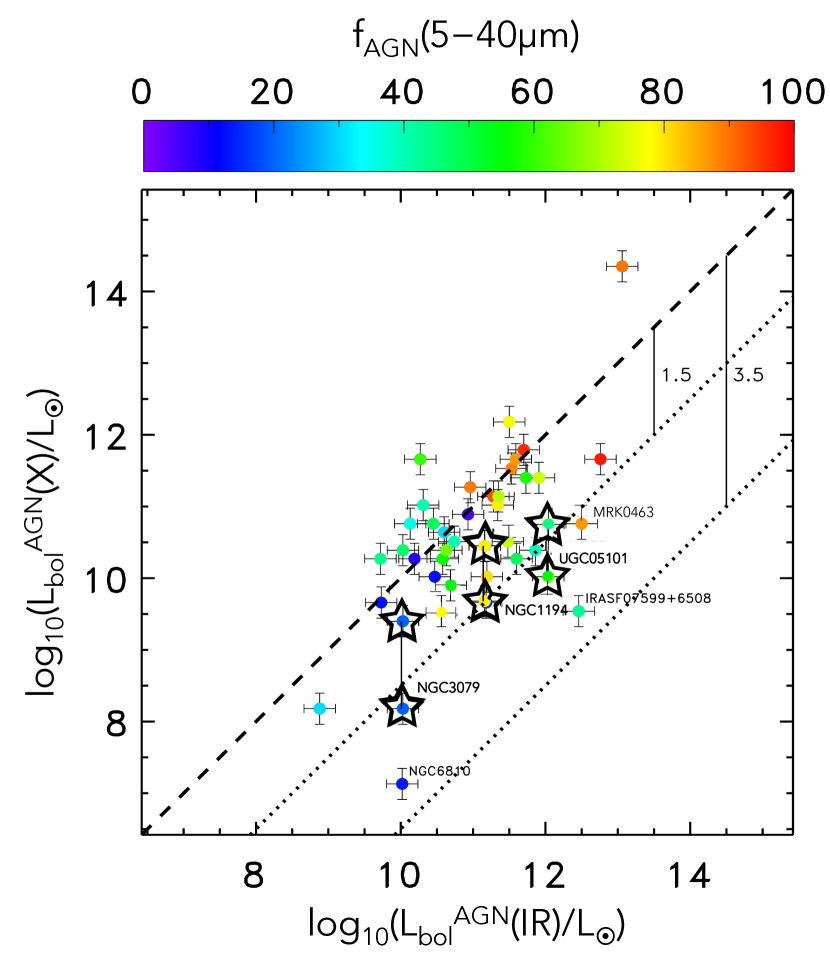
To conclude our work, we replotted the original relation (Fig. 2) using the AGN bolometric luminosity that we have computed from the 2–10 keV luminosity derived from our spectral analysis applying the M04 bolometric correction. The new source distribution is shown in Figure 6. The examined sources that showed the most striking separation from the linear relation (e.g., times lower in log) now lie much closer to the 1:1 relation, within the range of 1.5 (see the star symbols connected by a straight vertical line in Fig. 6).
The selection of AGN with very low observed X-ray luminosity to ratios (e.g., Lanzuisi et al., 2015a, Dalla Mura et al. in preparation) has been extensively used recently to identify Compton-thick sources, even at high redshift, although for a more complete source characterization (e.g., by using the most up-to-date torus models) good-quality X-ray data are needed. This work can pave the way for future-mission studies as an obscured AGN selection method like the one adopted in this paper (not considering the complication of recomputing the ) could be effective in perspective of the X-ray satellite eROSITA (Merloni et al., 2012) in combination with either WISE or the infrared facility SPICA (e.g., Gruppioni et al. 2017; Roelfsema et al. 2018) selected as a new-mission concept study by ESA for M5.
Acknowledgements
Tha authors thank the referee for her/his useful comments and suggestions, which helped improving the quality of the paper. The authors acknowledge financial support from the Italian Space Agency (ASI) under the contracts ASI-INAF I/037/12/0 and ASI-INAF n.2017-14-H.0.
References
- Ajello et al. (2012) Ajello M., Alexander D. M., Greiner J. et al., 2012, ApJ, 749, 21
- Akylas et al. (2012) Akylas A., Georgakakis A., Georgantopoulos I., Brightman M., Nandra K., 2012, A&A, 546, A98
- Arnaud (1996) Arnaud K. A., 1996, ASPC, 101, 17
- Asmus et al. (2015) Asmus D., Gandhi P., Hönig, S. F. et al., 2015, MNRAS, 454, 766
- Avni (1976) Avni Y., 1976, ApJ, 210, 642
- Baloković et al. (2018) Baloković M., et al., 2018, ApJ, 854, 42
- Beckmann et al. (2009) Beckmann V., Soldi S., Ricci C. et al., 2009, A&A, 505, 417
- Bianchi et al. (2008) Bianchi S., Chiaberge M., Piconcelli E., Guainazzi M., Matt G., 2008, MNRAS, 386, 105
- Brandt & Alexander (2015) Brandt W. N., Alexander D. M., 2015, A&AR, 23, 1
- Brightman & Nandra (2011a) Brightman M., Nandra K., 2011a, MNRAS, 413, 1206 (BN11a)
- Brightman & Nandra (2011b) Brightman M., Nandra K., 2011b, MNRAS, 414, 3084
- Brightman et al. (2015) Brightman M., et al., 2015, ApJ, 805, 41
- Cappi et al. (2006) Cappi M., Panessa F., Bassani L. et al., 2006, A&A, 446, 459
- Castangia et al. (2013) Castangia P., Panessa F., Henkel C., Kadler M., Tarchi A., 2013, MNRAS, 436, 3388
- Del Moro et al. (2017) Del Moro A., et al., 2017, ApJ, 849, 57
- Feltre et al. (2012) Feltre A., Hatziminaoglou E., Fritz J. et al., 2012, MNRAS, 426, 120
- Fritz et al. (2006) Fritz J., Franceschini A., Hatziminaoglou E., 2006, MNRAS, 366, 767
- Gandhi et al. (2009) Gandhi P., Horst H., Smette A. et al., 2009, A&A, 502, 457
- Georgantopoulos & Akylas (2019) Georgantopoulos I., Akylas A., 2019, A&A, 621, A28
- Gilli et al. (2007) Gilli R., Comastri A., Hasinger G., 2007, A&A, 463, 79
- Gilli (2013) Gilli R., 2013, MmSAI, 84, 647
- Gilli et al. (2014) Gilli R., et al., 2014, A&A, 562, A67
- Greenhill, Tilak, & Madejski (2008) Greenhill L. J., Tilak A., Madejski G., 2008, ApJ, 686, L13
- Gruppioni et al. (2016) Gruppioni C., Berta S., Spinoglio L. et al., 2016, MNRAS, 458, 4297 (G16)
- Gruppioni et al. (2017) Gruppioni C., et al., 2017, PASA, 34, e055
- Harrison et al. (2013) Harrison F. A., Craig W. W., Christensen F. E. et al., 2013, ApJ, 770, 103
- Harrison et al. (2016) Harrison F. A., Aird J., Civano F. et al., 2016, ApJ, 831, 185
- Hickox & Markevitch (2006) Hickox R. C., Markevitch M., 2006, ApJ, 645, 95
- Ikeda, Awaki, & Terashima (2009) Ikeda S., Awaki H., Terashima Y., 2009, ApJ, 692, 608
- Imanishi et al. (2003) Imanishi M., Terashima Y., Anabuki N., Nakagawa T., 2003, ApJ, 596, L167
- Iwasawa et al. (2011) Iwasawa K., et al., 2011, A&A, 529, A106
- Kalberla et al. (2005) Kalberla P. M. W., Burton W. B., Hartmann D. et al., 2005, A&A, 440, 775
- Kondratko, Greenhill, & Moran (2005) Kondratko P. T., Greenhill L. J., Moran J. M., 2005, ApJ, 618, 618
- Koss et al. (2016) Koss M. J., et al., 2016, ApJ, 825, 85
- Krivonos et al. (2007) Krivonos R., Revnivtsev M., Lutovinov A. et al., 2007, A&A, 475, 775
- Lansbury et al. (2017a) Lansbury G. B., et al., 2017a, ApJ, 836, 99
- Lansbury et al. (2017b) Lansbury G. B., et al., 2017b, ApJ, 846, 20
- Lanzuisi et al. (2015a) Lanzuisi G., Perna M., Delvecchio I. et al., 2015a, A&A, 578, A120
- Lanzuisi, et al. (2015b) Lanzuisi G., et al., 2015b, A&A, 573, A137
- Leiter et al. (2018) Leiter K., et al., 2018, IAUS, 336, 141
- Luo et al. (2014) Luo B., Brandt W. N.. Alexander D. M. et al., 2014, ApJ, 794, 70
- Lusso et al. (2012) Lusso E., Comastri A., Simmons B. D. et al., 2012, MNRAS, 425, 623
- Lutz et al. (2004) Lutz D., Maiolino R., Spoon H. W. W., Moorwood A. F. M., 2004, A&A, 418, 465
- Maiolino et al. (2007) Maiolino R., Shemmer O., Imanishi M. et al., 2007, A&A, 468, 979
- Marchesi et al. (2018) Marchesi S., Ajello M., Marcotulli L., Comastri A., Lanzuisi G., Vignali C., 2018, ApJ, 854, 49 (M18)
- Marchesi et al. (2019) Marchesi S., et al., 2019, ApJ, 872, 8
- Marconi et al. (2004) Marconi A., Risaliti G., Gilli R. et al., 2004, MNRAS, 351, 169 (M04)
- Martocchia et al. (2017) Martocchia S., et al., 2017, A&A, 608, A51
- Masini et al. (2016) Masini A., Comastri A., Baloković M. et al., 2016, A&A, 589, A59 (M16)
- Matt et al. (1997) Matt G., Fabian A. C., Reynolds C. S., 1997, MNRAS, 289, 175
- Merloni et al. (2012) Merloni A., et al., 2012, MPE document. Edited by S. Allen. G. Hasinger and K. Nandra (arXiv:1209.3114)
- Murphy & Yaqoob (2009) Murphy K. D., Yaqoob T., 2009, MNRAS, 397, 1549
- Oda et al. (2017) Oda S., Tanimoto A., Ueda Y. et al., 2017, ApJ, 835, 179
- Pesce et al. (2015) Pesce D. W., Braatz J. A., Condon J. J., Gao F., Henkel C., Litzinger E., Lo K. Y., Reid M. J., 2015, ApJ, 810, 65
- Piconcelli et al. (2005) Piconcelli E., Jimenez-Bailón E., Guainazzi M. et al., 2005, A&A, 432, 15
- Piconcelli et al. (2011) Piconcelli E., Bianchi S., Vignali C., Jiménez-Bailón E., Fiore, F., 2011, A&A, 534, A126
- Pozzi et al. (2012) Pozzi F., et al., 2012, MNRAS, 423, 1909
- Ricci et al. (2015) Ricci C., Ueda Y., Koss M. J., Trakhtenbrot B., Bauer F. E., Gandhi P., 2015, ApJ, 815, L13
- Roelfsema et al. (2018) Roelfsema P. R., et al., 2018, PASA, 35, e030
- Rush et al. (1993) Rush B., Malkan M. A., Spinoglio L., 1993, ApJS, 89, 1
- Severgnini et al. (2015) Severgnini P., Ballo L., Braito V. et al., 2015, MNRAS, 453, 3611
- Shi et al. (2013) Shi Y., Helou G., Armus L., 2013, ApJ, 777, 6
- Strickland (2007) Strickland D. K., 2007, MNRAS, 376, 523
- Tanimoto et al. (2018) Tanimoto A., Ueda Y., Kawamuro T., Ricci C., Awaki H., Terashima Y., 2018, ApJ, 853, 146
- Tommasin et al. (2008) Tommasin S., Spinoglio L., Malkan M. A. et al., 2008, ApJ, 676, 836
- Tommasin et al. (2010) Tommasin S., Spinoglio L., Malkan M. A. et al., 2010, ApJ, 709, 1257
- Tueller et al. (2008) Tueller J., Mushotzky R. F., Barthelmy S. et al., 2008, ApJ, 681, 113
- Turner et al. (1997) Turner T. J., George I. M., Nandra K., Mushotzky R. F., 1997, ApJS, 113, 23
- Vasudevan et al. (2013) Vasudevan R. V., Mushotzky R. F., Gandhi P., 2013, ApJL, 770, L37
- Vignali et al. (2009) Vignali C., et al., 2009, MNRAS, 395, 2189
- Vignali et al. (2010) Vignali C., Alexander D. M., Gilli R., Pozzi F., 2010, MNRAS, 404, 48
- Vignali et al. (2014) Vignali C., Mignoli M., Gilli R. et al., 2014, A&A, 571, A34
- Yamada et al. (2018) Yamada S., Ueda Y., Oda S., Tanimoto A., Imanishi M., Terashima Y., Ricci C., 2018, ApJ, 858, 106
- Zappacosta et al. (2018) Zappacosta L., et al., 2018, ApJ, 854, 33