On the Origin of the Dramatic Spectral Variability of WPVS 007
Abstract
We report the discovery of large-amplitude mid-infrared variabilities (MIR; mag) in the Wide-field Infrared Survey Explorer and bands of the low-luminosity narrow-line Seyfert 1 galaxy WPVS 007, which exhibits prominent and varying broad-absorption lines (BALs) with blueshifted velocity up to . The observed significant MIR variability, the UV to optical color variabilities in the Swift bands that deviate from the predictions of pure dust attenuation models, and the fact that Swift light curves can be well fitted by the stochastic AGN variability model suggest that its observed flux variabilities in UV-optical-MIR bands should be intrinsic, rather than owing to variable dust extinction. Furthermore, the variations of BAL features (i.e., trough strength and maximum velocity) and continuum luminosity are concordant. Therefore, we propose that the BAL variability observed in WPVS 007 is likely induced by the intrinsic ionizing continuum variation, alternative to the rotating-torus model proposed in a previous work. The BAL gas in might be in the low-ionization state as traced by its weak N v BAL feature; as the ionizing continuum strengthens, the C iv and Si iv column densities also increase, resulting in stronger BALs and the emergence of high-velocity components of the outflow. The outflow launch radius might be as small as pc under the assumption of being radiatively driven, but a large-scale origin (e.g., torus) cannot be fully excluded because of the unknown effects from additional factors, e.g., the magnetic field.
keywords:
galaxies: active — galaxies: individual (WPVS 007) — quasars: absorption lines.1 Introduction
Outflows are commonly observed in active galactic nuclei (AGNs; e.g., Tombesi et al., 2010; Gofford et al., 2013; Harrison et al., 2014), which are possibly driven by radiation pressure (e.g., Proga et al., 2000; Proga & Kallman, 2004), magnetic field (e.g., Ohsuga et al., 2009; Jiang et al., 2014), or Compton heating (e.g., Begelman et al., 1983) from the accretion disk. Powerful outflows can be identified via blueshifted broad-absorption lines (BALs; FWHM 2000 ) in either UV or X-ray bands, and are believed as an important candidate for AGN feedback by injecting their kinetic energy and momentum outward (see, e.g., Fabian 2012 and King & Pounds 2015 for reviews). However, direct measurements of outflow geometry, distance, stability, energy and hence its influence on galaxy environment and evolution are so far inconclusive. Multi-epoch observations and variability studies that focus on sources with prominent outflow features provide a new way to constrain these properties, and thus help shed light on how and where the winds are launched, accelerated, varied, and coupled with galactic-wide materials (e.g., FilizAk et al., 2012; Grier et al., 2015; Rogerson et al., 2016; Matzeu et al., 2017; Parker et al., 2017; McGraw et al., 2018; Pinto et al., 2018; DeCicco et al., 2018).
Previous studies have found that two mechanisms are mainly responsible for the observed BAL variability: (1) changes in the ionization state; and (2) changes of the covering factor (e.g., the absorbers moving into/out-of the sightline). The first mechanism can easily explain the coordinated relationships between BALs and continuum variabilities found in large quasar samples (e.g., Wang et al., 2015; He et al., 2017); and the variability timescale, which provides important information of the recombination timescale, can be used to constrain crucial outflow properties such as gas density, outflow distance and mass outflow rate (e.g., Gofford et al., 2014; He et al., 2019). While in the second scenario, the cloud transverse motion (thus BAL variability) is expected to be independent of the continuum, and the variability (transverse) timescale can be used to constrain the distance of the absorber (e.g., Capellupo et al., 2012; Matzeu et al., 2016; Rogerson et al., 2016; Braito et al., 2018; Matzeu et al., 2019). Therefore, distinguishing different variability mechanisms is crucial for us to investigate the physical conditions of the outflow.
The low-luminosity () narrow-line Seyfert 1 galaxy (NLS1) WPVS 007, located at (Grupe et al., 1995), is one of the most extensively studied source owing to its peculiar variability behavior (e.g., Leighly et al., 2009; Grupe et al., 2013; Leighly et al., 2015). At its first discovery in the ROSAT all-sky survey, it appeared as a bright X-ray source with an extremely soft spectrum (Grupe et al., 1995). However, in the subsequent observations by Chandra (Vaughan et al., 2004) and Swift observatories (Grupe et al., 2007), it showed persistently weak X-ray emission with no detections in most of the time, while the first hard X-ray detection suggested the existence of a high column-density ( cm-2), partial-covering absorber (Grupe et al., 2008).
The spectroscopic monitoring by the Hubble Space Telescope (HST) and the Far Ultraviolet Spectroscopic Explorer (FUSE) also revealed some unique phenomena. In the 1996 HST observation, WPVS 007 only exhibited a mini-BAL with a maximum velocity (Leighly et al., 2009). However, a significant outflow feature traced by the blueshifted P v BAL with appeared in the 2003 FUSE spectrum (Leighly et al., 2009), and a more dramatic C iv BAL with was detected in the 2010 HST observation (Leighly et al., 2015). The discovery of these prominent outflow features makes the low-luminosity a distinct object since powerful outflows are more likely to be found in luminous quasars (e.g., PDS 456; Pounds et al., 2003; Reeves et al., 2003; Hamann et al., 2008; Dunn et al., 2010; Danehkar et al., 2018). Interestingly, in the three succeeding HST observations from 2013 to 2015, the wind velocities decreased persistently down to a few thousand , accompanied with dimming and reddening of the continuum (Leighly et al., 2015). The significant velocity “shifts” (Leighly et al. 2015; also see our Section 4.2) make WPVS 007 an extraordinary object owing to the fact that most of observed BAL troughs only show variations in profile and strength rather than velocity structure (e.g., Grier et al., 2016).
The coordinated correlation between outflow velocity and continuum flux is usually unexpected in the moving cloud scenario. However, Leighly et al. (2015) (hereafter L15) proposed an interesting scenario that outflows are launched from an inhomogeneous rotating torus to explain the coordination. As the torus rotates, the scale height varies, the extinction changes, and outflows with different launching velocities move into our sightline, which result in both changes on continuum fluxes and outflow velocities, thus building the bridge between velocity and continuum variabilities (see their Figure 5 and Section 3.4). However, we note that the BAL strength is also correlated with continuum flux (see Section 4.1), but the physical reason behind such a relationship has not been explored yet.
In addition, L15 intensively analyzed the UV-optical photometries for and captured a particular “occultation event” which lasted for days in 2015. By assuming Keplerian motion of the occulting cloud, they constrained the distance of the absorber to be at the torus scale, and explained the occultation as a result of variable reddening in the rotating torus framework (see their Figure 1 and Figure 5 and our Section 4.4). If variable reddening also governs the flux variability during the ten-years Swift monitoring (Grupe et al., 2013), we should expect no significant mid-infrared (MIR) variability since the reprocessed MIR emission is insensitive to dust extinction.
However, we check the Wide-field Infrared Survey Explorer (WISE) data for this source and find large-amplitude variabilities () in () and () bands, suggesting that must experience significant intrinsic luminosity variability. Although L15 can explain the occultation event in the variable extinction scenario, how the additional variable factor (i.e., the intrinsic luminosity) would influence our understanding of the dramatic BAL variability in this particular source is currently unclear. Therefore, in this work, we plan to extensively analyze the combined UV-optical-IR variabilities of WPVS 007 aiming at comprehensively exploring its long-term variability nature and the driving mechanism of its coordinated BAL variabilities, which might give important clues on constraining physical properties of this unique low-luminosity, NLS1-BAL system. This paper is organized as follows. In 2 we describe the observations and data reduction. In 3 we present our analyses on WISE variabilities, color variabilities and Swift light curves that lead us to the conclusion that the variable intrinsic luminosity is mainly responsible for the flux variabilities observed in WPVS 007, instead of variable extinction. In 4 we discuss the origin of its dramatic BAL variability in the variable luminosity framework and put important constraints on the driving mechanism and launch radius of the varying outflows. The results are summarized in 5. Throughout this paper, we adopt a flat cosmology with , , and .
2 Observations and data reduction
The archival WISE MIR photometries, Swift UV-optical photometries and HST UV-optical spectra used in this work are summarized in Table 1. Below we give a detailed description of each data set.
| Telescope / Instrument | Observation Date | Photometric Bands / Spectral Coverages | PI |
|---|---|---|---|
| WISE | 2010 May – 2016 Nov | W1 (3.6 ) and W2 (4.5 ) | WISE |
| Swift / XRT | 2005 Oct – 2018 Mar | UVW2, UVW1, UVM2, U, B, V | Swift & Dirk Grupe |
| HST / FOS | 1996 Jul | 1140 Å– 2508 Å (BL) and 1573 Å– 6872 Å (RD) | Robert Goodrich |
| HST / COS | 2010 Jun | 1230 Å– 2050 Å (FUV) and 1700 Å– 3200 Å (NUV) | Karen Leighly |
| HST / COS | 2013 Jun | 1230 Å– 2050 Å (FUV) and 1700 Å– 3200 Å (NUV) | Karen Leighly |
| HST / COS | 2013 Dec | 1230 Å– 2050 Å (FUV) and 1700 Å– 3200 Å (NUV) | Karen Leighly |
| HST / COS | 2015 Mar | 1230 Å– 2050 Å (FUV) and 1700 Å– 3200 Å (NUV) | Karen Leighly |
| HST / COS | 2017 Mar | 1230 Å– 2050 Å (FUV) and 1700 Å– 3200 Å (NUV) | Karen Leighly |
2.1 WISE observations
The WISE mission (Wright
et al., 2010) and its successor, the Near-Earth WISE Reactivation (NEOWISE) mission (Mainzer
et al., 2014), have imaged the full sky repeatedly since January 2010. The WISE light curves for WPVS 007 at and bands are extracted from the IRSA service111See https://irsa.ipac.caltech.edu/Missions/wise.html. with a 2′′ matching radius. Data points with quality flags of , and are excluded.222See https://wise2.ipac.caltech.edu/docs/release/allwise/expsup
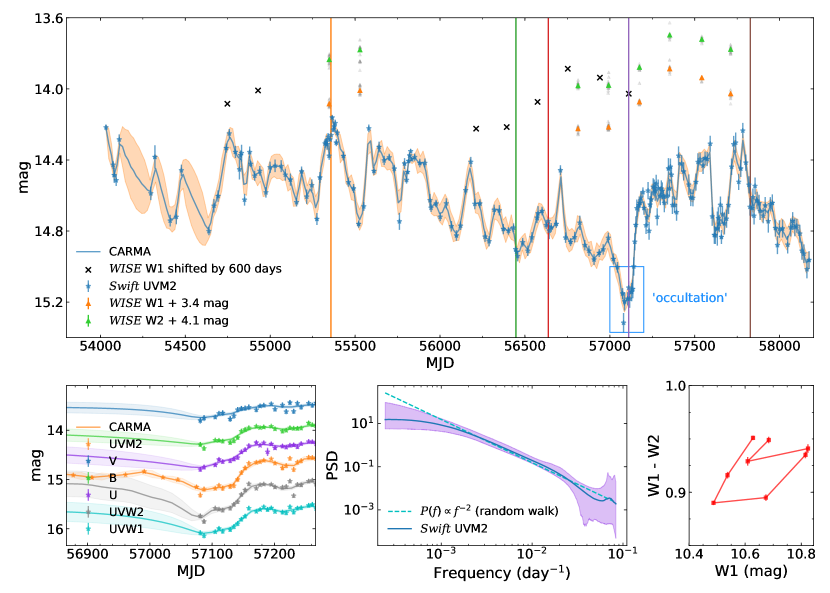
/sec3_2.html for details. The binned light curves are shown in Fig. 1 as orange () and green () triangles. The individual observations are shown in gray points.
2.2 Swift observations
WPVS 007 has been extensively monitored with Swift (Gehrels et al., 2004) using XRT and UVOT, including UVW2, UVW1, UVM2, U, B and V bands centered at 1928 Å, 2246 Å, 2600 Å, 3465 Å, 4392 Å and 5468 Å, respectively (e.g., Grupe et al., 2007; Grupe et al., 2008; Grupe et al., 2013). We extract its Swift light curves using the HEASOFT version 6.24 uvmaghist tool. The source region is selected using a circle with a radius of centered on the source and the corresponding background region is selected by an annulus with a inner radius and a outer radius. The binned UVM2 light curve (in bins of 6 days) is displayed in Figure 1.
The intrinsic 1450 Å luminosity () is calculated by extrapolating the UVW1 band and U band luminosities with a power law. The photometry used in the calculation has been corrected for Galactic reddening assuming mag (Schlegel et al., 1998) and the Cardelli et al. (1989) extinction law. is then converted into bolometric luminosity () using (Runnoe et al., 2012) and the resulting for the six HST observations (Section 2.3) are presented in Table 2. The UVW1 and U bands are utilized here because they are relatively less affected by possible intrinsic extinction (owing to their longer wavelengths compared to the UVM2 and UVW2 bands; e.g., Calzetti et al. 2000) and emission lines (note that the B and V bands are close to strong emission lines; see Figure 2). Note that we mainly focus on the relative variability of luminosity in the following analysis. Therefore, we argue that the constant host galaxy contamination and a different bolometric conversion factor would not influence our main results materially.
2.3 HST observations
| Date | () | C iv () | C iv EW (Å) | Si iv () | Si iv EW (Å) |
|---|---|---|---|---|---|
| 1996 Jun | 900 (N v) | – | – | – | |
| 2010 Jun | 14100 | 20.4 | 11900 | 9.2 | |
| 2013 Jun | 9000 | 15.1 | 6700 | 8.8 | |
| 2013 Dec | 8700 | 15.9 | 6300 | 7.4 | |
| 2015 Mar | 7700 | 6.3 | 4000 | 3.3 | |
| 2017 Mar | 13400 | 19.2 | 5800 | 9.9 |
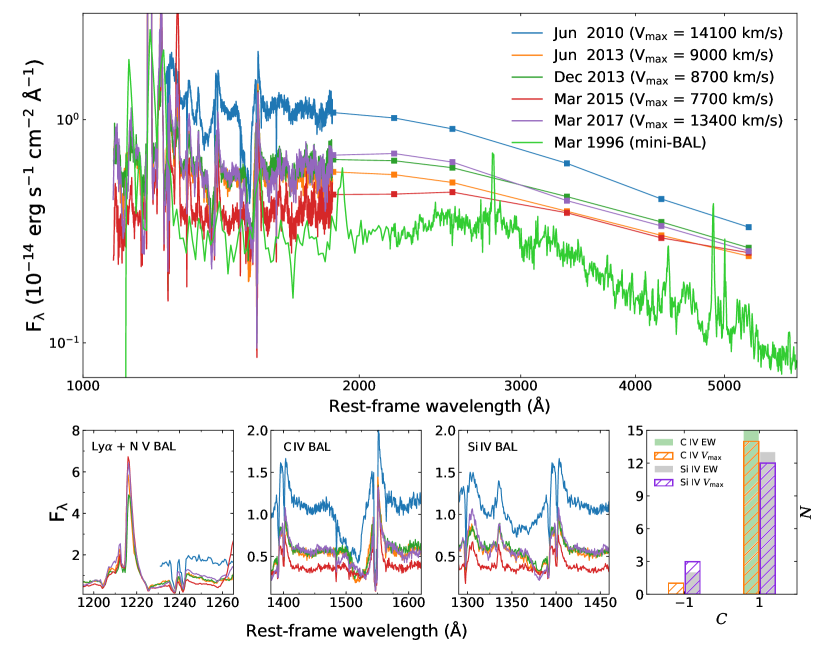
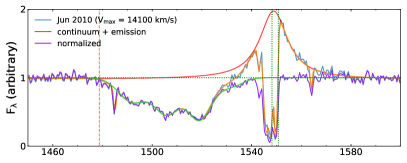
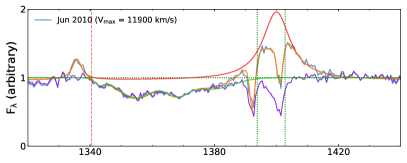
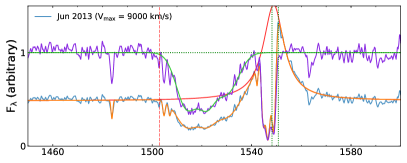
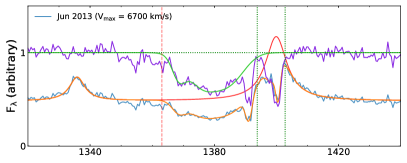
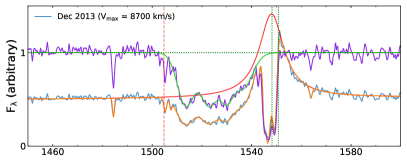
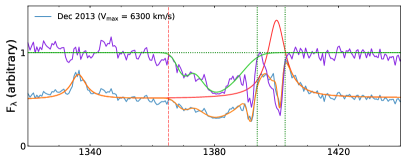
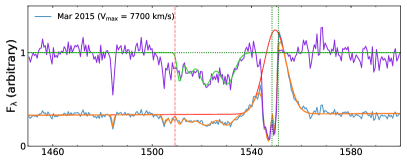
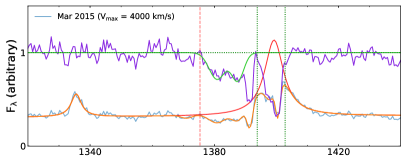
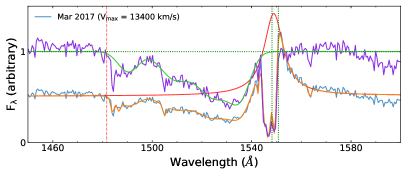
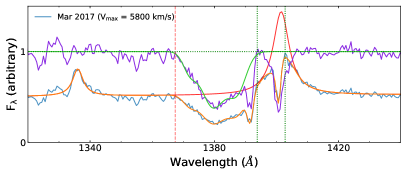
WPVS 007 has been observed six times by the Faint Object Spectrograph (FOS) or Cosmic Origins Spectrograph (COS) aboard HST since 1996 (see Table 1). The spectra are extracted from the HST online dataset333See http://archive.stsci.edu/hstonline. that are calibrated and shown in Figure 2 after smoothing by averaging the adjacent seven pixels. The BAL regions of C iv, Si iv and N v are plotted in bottom panels. To obtain the BAL velocity, we fit the observed spectra by an empirical model. We model the continuum with a power law in line-free regions (1000–1430 Å, 1470–1610 Å, 1620–1680 Å, 1740–1760 Å and 1850–2900 Å). The absorption features are fitted using a set of Gaussian profiles. The emission lines are modeled with Lorentz profiles except for the 2015 spectrum for which we use the Gaussian profile since the curve_fit python package we used is unable to find a solution with the Lorentz profile. The BAL troughs are determined as a combination of broad Gaussians, and the observed maximum velocity of the outflow is calculated as the velocity corresponding to the first point of the best fitted normalized BAL profiles which equals to 0.99 counted from the bluest wavelength. The derived velocities of are summarized in Table 2 and the spectral fitting results of C iv and Si iv BAL regions are shown in Figure 3.
3 Change of obscuration or intrinsic luminosity?
3.1 WISE variability
MIR variability has been widely utilized as a powerful tool to distinguish various variability mechanisms. The AGN MIR emission in the WISE and bands is mainly produced by the hot dust re-radiation surrounding the central engine. Due to the small extinction in the MIR bands, large-amplitude MIR variability should only arise from intrinsic luminosity variability rather than the change of obscuration (Sheng et al., 2017; Stern et al., 2018). For that exhibits mag variability in the WISE bands (see Figure 1), it would require a change in extinction if a variable obscuration scenario is assumed, insensitive to the adopted extinction models (Cardelli et al., 1989; O’Donnell, 1994; Fitzpatrick, 1999). This would transform into a mag change in the V band and mag change in the UVM2 band, which are all significantly larger than the true variability amplitudes during the Swift monitoring (i.e., only mag change at maximum). Moreover, we find that the color generally increases with increasing magnitude (see the inset in Figure 1), suggesting that the MIR color becomes redder when the source dims. This might be explained by that the torus temperature decreases with decreasing luminosity, thus the spectral energy distribution (SED) becomes redder in the faint state. Such a phenomenon is also unexpected if the UV-optical flux variabilities are dominated by the obscuring materials move into/out-of the sightline. Therefore, the MIR variability observed in suggests that its intrinsic luminosity must vary significantly.
3.2 Color variability
As the intrinsic luminosity changes, the color would also change in response and is typically observed as being “bluer-when-brighter” that has been widely found in quasar variabilities (e.g., Ruan et al., 2014; Guo & Gu, 2016), which could be well explained by the stochastic temperature fluctuation in an inhomogeneous accretion disk (e.g., Dexter & Agol, 2011; Cai et al., 2016, 2018). Alternatively, the flux variability caused by variable extinction also displays a similar trend, since extinctions are more significant at shorter wavelengths (e.g., Calzetti et al., 2000).
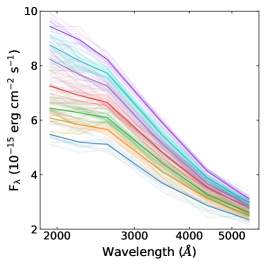
To examine whether the color variability in also requires the change of intrinsic luminosity, we divide Swift light curves into seven bins based on their UVW2 fluxes. The SEDs in each bin and their average values are shown in Figure 4, in which the bluer-when-brighter behavior can be clearly seen. If variable extinction governs the color variability, we should be able to reproduce low-flux SEDs by simply adding dust extinction to high-flux SEDs. Note that L15 captured a particular occultation event lasting for days in 2015 and explained it as a result of variable extinction (but see Section 4.4). Since our WISE data cannot deny this possibility, we exclude the data during the occultation event while calculating the SEDs (but we note that adding them back does not affect our results).
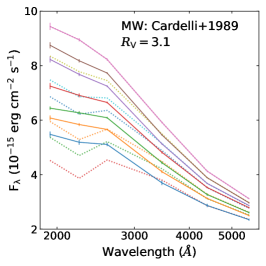
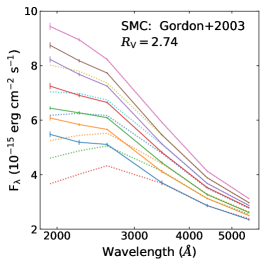
We test various extinction models (Cardelli et al., 1989; O’Donnell, 1994; Fitzpatrick, 1999; Gordon et al., 2003) and show the results of using the Milky Way (MW; Cardelli et al., 1989) and Small Magellanic Cloud (SMC; Gordon et al., 2003) extinction curves in Figure 4 for illustration. The top SED is extincted using a range of values from 0 to 0.3. For the resulting SEDs at given values (shown as dotted curves) which match well with the observed SEDs at and bands, they all significantly underestimate the fluxes at UVM2 and UVW1 bands, insensitive on the assumed values of . Note that we do not consider the UVW2 band here since it might be contaminated by the C iii] emission line. This result suggests that the variable extinction model fails to reproduce the bluer-when-brighter trend, and intrinsic variability is required to account for the observed color variability of .
3.3 Swift variability
As discussed in Sections 3.1 and 3.2, the intrinsic luminosity of must vary significantly to account for the long-term WISE and UV to optical color variations, and the change of obscuration may play a subordinate role. If our model is correct, we should be able to explain the flux variations in UV-optical bands by means of stochastic changes of intrinsic AGN power, and the corresponding power spectral density (PSD) should be similar to those of other type 1 AGNs. To examine the variability pattern of Swift light curves, we fit them with the CARMA code444See https://github.com/brandonckelly/carma_pack. (Kelly et al., 2014) and derive the power spectral densities (PSDs). The CARMA code models the AGN stochastic variability using a Gaussian continuous-time autoregressive process, and uses two order parameters, and , to describe autoregressive coefficients and moving average coefficients of different stochastic processes. We determine and using the choose_order method in CARMA that selects the best model using the Akaike Information Criterion (see Section 3.5 in Kelly et al. 2014 for details). The fitting results and the PSD are shown in Figure 1. The PSD for the random walk model (i.e., ) is also displayed for comparison.
It is evident that the ten-year Swift light curves can be well fitted by a , CARMA process (note that we only display the fitting result for the UVM2 band but light curves in other bands can be also well fitted), including the occultation event reported in L15 (see our Section 4.4). Comparing the derived PSD shape with that of the random walk model, we find that the high-frequency PSD slope for is consistent with –2, i.e, the slope of the random walk process. The PSD then flattens at low frequencies, suggesting that the variabilities are damped at longer timescales (e.g., Kelly et al., 2009). Such a PSD shape is similar to those of other type 1 AGNs reported in previous studies (Kelly et al., 2009; MacLeod et al., 2010; Zu et al., 2013; Sun et al., 2015), and might be caused by the thermal fluctuations in the accretion disk (e.g., Kelly et al., 2009; Sun et al., 2018). Therefore, our results suggest that the intrinsic stochastic AGN variability being caused by a fluctuated accretion disk is able to well reproduce the observed Swift variability behavior, without the necessity to invoke other significant variable factors such as the change of dust extinction.
In addition, based on the 5100 Å luminosity ( on Jun 2010), we estimate the inner-torus sublimation radius of to be pc (Netzer, 2015); the torus size at is estimated to be based on the relationship obtained through MIR-interferometry observations (see Figure 4 in Netzer 2015). Therefore, the torus size at WISE bands () might lie between . Converting the distance into light crossing time, we expect the time delay between WISE and Swift variabilities to be by rougly adopting . Although the sparse sampling of WISE observations does not allow us to robustly constrain the time delay, simply shifting WISE light curves by 600 days yields good agreement between WISE and Swift profiles, i.e., the rise and later decline of WISE data are consistent with the brightening and dimming of Swift data between MJD 56300 to MJD 56700, and MJD 56700 to MJD 57000, respectively (see the black crosses in Figure 1), thereby lending further support to the intrinsic nature of UV-optical variabilities.
4 Discussion
Our analysis of archival WISE and Swift data suggests that the large-amplitude MIR variability, color variability, and UV-optical continuum flux variabilities discovered in the ten-year monitoring of WPVS 007 are most probably driven by the stochastic change of intrinsic luminosity, and variable extinction may play a minor role.
| (Å) | (yrs) | (yrs) | (yrs) |
|---|---|---|---|
| 1929 | 0.011 | 1.68 | 0.14 |
| 2242 | 0.015 | 3.34 | 0.23 |
| 2609 | 0.021 | 6.48 | 0.37 |
| 3460 | 0.038 | 23.78 | 0.95 |
| 4384 | 0.061 | 68.75 | 2.05 |
| 5472 | 0.096 | 1769.30 | 4.14 |
Following Section 3.2 (Page 108) of Kato et al. (2008), we calculate the timescales that are relevant to various intrinsic variability mechanisms at different wavelengths (radii): the thermal timescale , which represents the timescale of thermal fluctuation of accretion disk; the viscous timescale , on which the global accretion rate changes; and the heating-cooling front timescale , corresponding to the heating and cooling fronts propagating through an disk (i.e., the viscosity in the accretion disk, which is crucial for driving the angular momentum of the accreted materials outward, is assumed to be , where and are the dimensionless viscous parameter and the total pressure, respectively; see Shakura & Sunyaev 1973). The results are listed in Table 3. Note that these values are derived under the assumption of a standard thin disk model for simplicity, since for as in WPVS 007, the disk remains geometrically thin at NUV/optical wavelengths. The local thermal fluctuation with a few days produces the seed of short-timescale variability at a given radius (e.g., Sun et al., 2018). The falls within the observed timescale, which makes it possible that the inner accretion disk could go through significant overall variability as the cooling and heating fronts propagate radially across an disk, thus causing large variations at multiple wavelengths (e.g., Stern et al., 2018; Ross et al., 2018).
In the intrinsic luminosity variability scenario and within the radiatively-driven outflow framework, the outflow properties may display dramatic variability as the incident ionizing continuum changes. In the following sections, we investigate the BAL variability in WPVS 007, aiming at testing whether its behavior is consistent with being photoionization-driven, and try to put constraint on the outflow launch radius (e.g., Parker et al., 2017; Pinto et al., 2018).
4.1 Change of ionization state and BAL trough strength
The ionization parameter () and ion column densities of the outflowing gas would change in response to the variable ionizing luminosity, resulting in the change of BAL strength. Using the best fit normalized BAL component (see the green curves in Figure 3), we calculate the equivalent width (EW) of C iv and Si iv BALs and list the results in Table 2. To qualitatively describe its relationship with luminosity, we calculate the concordance index following Wang et al. (2015). is assigned as +1 if BAL strength and bolometric luminosity vary in the same sign (i.e., both increasing or decreasing); otherwise, it is assigned as . The distribution of for any two observations is shown in the bottom-right panel of Figure 2. All (most) epochs have for C iv (Si iv) BAL, which suggests that the BAL and luminosity of weaken and strengthen simultaneously.
Such a trend is different from what is typically observed in luminous quasars, for which the weakening of BAL trough is often accompanied with the brightening of continuum (e.g., Wang et al., 2015; He et al., 2017; Pinto et al., 2018). This may be explained by the different ionization states between and quasars. For , Leighly et al. (2009) derived (see also Grupe et al. 2013) and from the FUSE spectrum. The persistently weak N v line during 2010 to 2017 (see Figure 2) also suggests that it is in a lower ionization state compared with other luminous BAL quasars, possibly related to its low luminosity and X-ray weak nature (Grupe et al., 2007; Grupe et al., 2008; Grupe et al., 2013; Gibson et al., 2008). As shown in Figure 8 in He et al. (2017), for , the column densities of C iv and Si iv ions reach the peaks at and monotonically decrease at both sides. Therefore, for the low-ionization source that lies on the left side of the peak of the vs. curve, the BAL strength and luminosity vary in a coordinated way.
4.2 Coordination between outflow velocity and AGN luminosity
We use the same concordance index method introduced in Section 4.1 to describe the relationship between BAL blue-shifted velocity and source luminosity. A similar coordinated correlation between bolometric luminosity and the “observed” maximum velocity can be also seen from Table 2 that increases with increasing , including the faintest state in 1996 when no BALs were detected. For the C iv BALs, is 1 for 14 out of 15 epochs, and the only exception happened at the two 2013 observations, at which the luminosity and velocity for the two epochs are actually very close to each other. While for the Si iv BALs, is 1 for 80% (12/15) of the observations.
We note that if the change of apparent velocity is caused by a flowing structure randomly crossing our sightline (e.g., Hamann et al., 2008), equal probabilities of concordance (i.e., ) and anti-concordance (i.e., ) between and should be expected in each pair of observations. Therefore, considering all observations, we should expect that half of the observations have while the remaining have (i.e., the distribution of should follow a binomial distribution with a concordance probability of being 0.5). However, we find that 14 (12) out of 15 observations for C iv (Si iv) BALs have . Under the assumption of the moving-cloud scenario, the binomial probabilities for observing such events are only 0.0005 for C iv, and 0.014 for Si iv, respectively. Such low probabilities suggest that it is not very likely that the change of observed maximum velocity is caused by the transverse motion of obscuring clouds.
Instead, the coordinated correlation can be easily explained if the BAL variability is photoionization-driven (e.g., Hamann et al., 2011; FilizAk et al., 2012, 2013; Wang et al., 2015; He et al., 2017). As pointed out in Section 4.1, the C iv and Si iv column densities decrease when the source becomes fainter. For the high-velocity components of the outflow that typically have small absorption strengths and are more likely to vary (e.g., Capellupo et al., 2012), they would become weaker and disappear in the spectrum when the optical depth reduces, leading to the decrease of the “observed” maximum velocity when the source dims. The component with emerged for the C iv BAL in the Mar 2017 observation but no corresponding component was found for the Si iv BAL (see Figure 3) suggests that, the smaller optical depth of Si iv is responsible for the absence of the high-velocity component in the Si iv trough, owing to much smaller element abundance of Si iv compared to C iv. In addition, the increasing radiation pressure from Mar 2015 to Mar 2017 may also contribute to the increasing velocity, but current data do not allow measurement of the actual acceleration.
4.3 BAL velocity and outflow launch radius
If the outflows are launched radiatively, the large outflowing velocity may provide hints on its launch radius. To illustrate this, we express the motion equation of the radiatively-driven outflow as
| (1) |
where is the radial wind velocity, is the radial distance, is the fraction of continuum being absorbed or scattered in the wind, is the bolometric luminosity, is the speed of light, is the mass of proton, is the black hole mass, respectively (Hamann, 1998).
Integrating Eq. 1 from the launch radius to infinity yields the terminal velocity
| (2) |
where is the launch radius in units of pc, is , is the column density relative to , is the bolometric luminosity relative to , and is the black hole mass in units of , respectively.
The black hole mass was estimated to be with a 0.43 dex uncertainty in L15. Using the observed maximum velocity as a proxy for terminal velocity and assuming (Leighly et al., 2009), we obtain an average launch radius about pc if the winds are produced in the dust-free region, consistent with Leighly et al. (2009). Note that the value of used here was calculated in Leighly et al. (2009) by approximately reconstructing the intrinsic X-ray to optical SED for WPVS 007 with the use of Mrk 335 and Mrk 493 SEDs as unattenuated templates. It is impossible to accurately measure this ratio during the 2010 to 2017 HST observations owing to the limited HST spectral coverage and weak X-ray signal. But we note that, adopting a larger (e.g., ) or smaller (e.g., ) ratio would obtain a launch radius about or , which will not significantly influence our results.
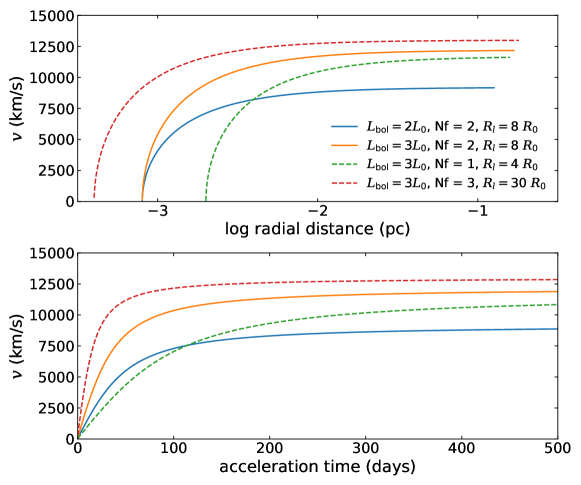
We then calculate the evolution of wind velocity as a function of acceleration time and radial distance with different initial conditions (, , and ) using Eq. 1. The results are displayed in Figure 5. For a launch radius as small as pc, the outflow soon reaches its maximum velocity in a few tens of days, and an increase in velocity with luminosity can be clearly seen, which may also contribute to the coordination between outflow velocity and AGN luminosity, as discussed in Section 4.2.
According to the top panel of Figure 5, the outflow velocity reaches at a radial distance , which is close to the torus sublimation radius estimated in Section 3.3. Therefore, the strongly blueshifted BAL features observed may be located far away from their launch radius and close to the torus, since the winds propagate and are accelerated outward (see Figure 5).
To test whether the outflows can be initially launched from the torus scale (Leighly et al., 2015), we assume that the torus can fully absorb the continuum (i.e., = 1.0) to simulate the boosted radiation pressure caused by the presence of dust since dust has a much larger cross section compared with pure electron scattering. We adopt two column densities, i.e., the maximum () and minimum () column densities reported in Grupe et al. (2013) during 2005–2013 Swift observations, to calculate the launch radius. The derived values are and , respectively, which are all much smaller than the torus sublimation radius, thereby conflicting with our initial assumption that the outflows are launched in the torus. In addition, the fully absorbed scenario is also inconsistent with observations (Leighly et al., 2009); and more sophisticated calculations of radiation pressure implementing on dusty gas from the torus also indicated that the typical maximum outflow velocity is a few thousand km s-1 and hardly reaches , even if an enhanced dust to gas ratio is adopted for luminous dusty quasars (e.g., Ishibashi & Fabian, 2016; Ishibashi et al., 2017). Therefore, we argue that the outflows in WPVS 007 may most probable to be launched in the region closer to the black hole, and the torus origin maybe less likely. But we note that since we only consider radiation pressure in our simple calculation, it is currently unclear how additional factors, such as the existence of magnetic field, would influence our result. Future numerical simulations are required to test whether outflows launched at a scale as large as the torus can reach the observed maximum velocity.
4.4 Comparison with previous analysis
L15 captured an occultation event lasting for days characterized by a continuous dimming of UVM2 flux accompanied with the increase of . Through extensive color and timescale analyses, they concluded that such an event can be explained by variable extinction when different parts of a rotating torus moving into/out of our sightline. In addition, to explain the decreased BAL velocity during the occultation event, L15 proposed that the dusty gas is ablated from the rotating torus with variable scale height; and, the velocity of the outflowing gas decreases with increasing scale height (see Figure 5 and Section 3.4 in L15). Therefore, as the scale height increases during the occultation event, the torus may intercept our sightline, absorb the continuum flux and reduce the blue-shifted BAL velocity. As emerges from the occultation event, a bluer and brighter SED with faster outflows will be revealed along our sightline again; this prediction is indeed consistent with the new HST observation in 2017.
However, we note that if outflows are launched close to the inner accretion disk as we conclude in Section 4.3, whether the variable-height torus rotates or not should not significantly affect the fast outflows, thus BALs. Alternatively, since we have already shown that the luminosity for this source must vary significantly, the UV-optical-MIR flux variabilities (including the occultation event, whose light curves can also be modeled by the AGN stochastic variability; see the lower-left panel of Figure 1), the coordinated BAL variabilities (both velocity and strength) with luminosities and the large outflow velocities can all be easily explained, if the variability is driven by the luminosity variations of the central engine and the outflows are launched close to the inner accretion disk.
5 Conclusion
WPVS 007, a low-luminosity NLS1, is noted for its unique spectral variability: being an X-ray bright, extremely soft AGN transforming into an X-ray weak source, the emergence of strong BALs compared with earlier observations, and dramatic outflows with up to given its low luminosity. Therefore, this source can serve as an ideal laboratory to investigate the physical conditions of the extraordinary low-luminosity, NLS1-BAL systems.
To this end, we have intensively analyzed all the archival WISE, Swift, and HST observations of WPVS 007 in order to understand its peculiar variability nature and put important constraints on the driving mechanism of variable fast outflows in this rare object.
The observed significant MIR variability, the UV-optical color variabilities in the Swift bands that deviate from the prediction of pure dust attenuation models, and the fact that Swift light curves can be well fitted by the stochastic AGN variability model suggest that, the variability of intrinsic luminosity caused by the change of the inner accretion disk, rather than variable dust extinction, should be mainly responsible for these observed facts in .
We also test whether the variability behavior of BALs is consistent with being photoionization-driven and constrain the outflow launch radius. The ionization state of , traced by its weak N v line, might be much lower compared with other luminous BAL quasars, possibly related to its low luminosity and weak X-ray nature. At the low-ionization state, the C iv and Si iv column densities and luminosities are positively correlated. Owing to the reduction of optical depth as the luminosity decreases, the C iv and Si iv BAL troughs become weaker; the high-velocity components of the outflow that typically have smaller absorption strengths might be too weak to be detected, resulting in the coordination between the “observed” maximum velocity and its bolometric luminosity. Based on the radiatively-driven wind model, we estimate that the outflow launch radius might be as small as . However, a large-scale origin (e.g., the torus) cannot be fully excluded owing to the unknown effects from additional factors, e.g., magnetic field; future numerical simulations are required to test whether outflows launched at the torus scale can produce the observed maximum velocity.
6 ACKNOWLEDGMENTS
We thank Guilin Liu, Luming Sun and Guobin Mou for useful discussions. J.Y.L., M.Y.S., and Y.Q.X. acknowledge support from the NSFC (NSFC-11603022, NSFC-11473026, NSFC-11421303, NSFC-11890693), the 973 Program (2015CB857004), the CAS Frontier Science Key Research Program (QYZDJ-SSW-SLH006) and the K.C.Wong Education Foundation. M.Y.S. acknowledges support from the China Postdoctoral Science Foundation (2016M600485). T.G.W. and Z.C.H. acknowledge support from the 973 Program (2015CB857005) and the NSFC (NSFC116203021, NSFC-11703022, NSFC-11833007).
This publication makes use of data products from the Wide-field Infrared Survey Explorer, which is a joint project of the University of California, Los Angeles, and the Jet Propulsion Laboratory/California Institute of Technology, funded by the National Aeronautics and Space Administration. This publication makes use of data products from the Near-Earth Object Wide-field Infrared Survey Explorer (NEOWISE), which is a project of the Jet Propulsion Laboratory/California Institute of Technology. NEOWISE is funded by the National Aeronautics and Space Administration. This publication is based on observations made with the NASA/ESA Hubble Space Telescope, obtained from the data archive at the Space Telescope Science Institute. STScI is operated by the Association of Universities for Research in Astronomy, Inc. under NASA contract NAS 5-26555. We acknowledge the use of the public data from the Swift data archive and the UK Swift Science Data Center.
References
- Begelman et al. (1983) Begelman M. C., McKee C. F., Shields G. A., 1983, ApJ, 271, 70
- Braito et al. (2018) Braito V., et al., 2018, MNRAS, 479, 3592
- Cai et al. (2016) Cai Z.-Y., Wang J.-X., Gu W.-M., Sun Y.-H., Wu M.-C., Huang X.-X., Chen X.-Y., 2016, ApJ, 826, 7
- Cai et al. (2018) Cai Z.-Y., Wang J.-X., Zhu F.-F., Sun M.-Y., Gu W.-M., Cao X.-W., Yuan F., 2018, ApJ, 855, 117
- Calzetti et al. (2000) Calzetti D., Armus L., Bohlin R. C., Kinney A. L., Koornneef J., Storchi-Bergmann T., 2000, ApJ, 533, 682
- Capellupo et al. (2012) Capellupo D. M., Hamann F., Shields J. C., Rodr guez Hidalgo P., Barlow T. A., 2012, MNRAS, 422, 3249
- Cardelli et al. (1989) Cardelli J. A., Clayton G. C., Mathis J. S., 1989, ApJ, 345, 245
- Danehkar et al. (2018) Danehkar A., et al., 2018, ApJ, 853, 165
- DeCicco et al. (2018) DeCicco D., Brandt W. N., Grier C. J., Paolillo M., Filiz Ak N., Schneider D. P., Trump J. R., 2018, A&A, 616, A114
- Dexter & Agol (2011) Dexter J., Agol E., 2011, ApJ, 727, L24
- Dunn et al. (2010) Dunn J. P., et al., 2010, ApJ, 709, 611
- Fabian (2012) Fabian A. C., 2012, ARA&A, 50, 455
- FilizAk et al. (2012) FilizAk N., et al., 2012, ApJ, 757, 114
- FilizAk et al. (2013) FilizAk N., et al., 2013, ApJ, 777, 168
- Fitzpatrick (1999) Fitzpatrick E. L., 1999, PASP, 111, 63
- Gehrels et al. (2004) Gehrels N., et al., 2004, ApJ, 611, 1005
- Gibson et al. (2008) Gibson R. R., Brandt W. N., Schneider D. P., 2008, ApJ, 685, 773
- Gofford et al. (2013) Gofford J., Reeves J. N., Tombesi F., Braito V., Turner T. J., Miller L., Cappi M., 2013, MNRAS, 430, 60
- Gofford et al. (2014) Gofford J., et al., 2014, ApJ, 784, 77
- Gordon et al. (2003) Gordon K. D., Clayton G. C., Misselt K. A., Landolt A. U., Wolff M. J., 2003, ApJ, 594, 279
- Grier et al. (2015) Grier C. J., et al., 2015, ApJ, 806, 111
- Grier et al. (2016) Grier C. J., et al., 2016, ApJ, 824, 130
- Grupe et al. (1995) Grupe D., Beuerman K., Mannheim K., Thomas H.-C., Fink H. H., de Martino D., 1995, A&A, 300, L21
- Grupe et al. (2007) Grupe D., Schady P., Leighly K. M., Komossa S., O’Brien P. T., Nousek J. A., 2007, AJ, 133, 1988
- Grupe et al. (2008) Grupe D., Leighly K. M., Komossa S., 2008, AJ, 136, 2343
- Grupe et al. (2013) Grupe D., Komossa S., Scharwächter J., Dietrich M., Leighly K. M., Lucy A., Barlow B. N., 2013, AJ, 146, 78
- Guo & Gu (2016) Guo H., Gu M., 2016, ApJ, 822, 26
- Hamann (1998) Hamann F., 1998, ApJ, 500, 798
- Hamann et al. (2008) Hamann F., Kaplan K. F., Rodríguez Hidalgo P., Prochaska J. X., Herbert-Fort S., 2008, MNRAS, 391, L39
- Hamann et al. (2011) Hamann F., Kanekar N., Prochaska J. X., Murphy M. T., Ellison S., Malec A. L., Milutinovic N., Ubachs W., 2011, MNRAS, 410, 1957
- Harrison et al. (2014) Harrison C. M., Alexander D. M., Mullaney J. R., Swinbank A. M., 2014, MNRAS, 441, 3306
- He et al. (2017) He Z., Wang T., Zhou H., Bian W., Liu G., Yang C., Dou L., Sun L., 2017, ApJS, 229, 22
- He et al. (2019) He Z., et al., 2019, Nature Astronomy, 3, 265
- Ishibashi & Fabian (2016) Ishibashi W., Fabian A. C., 2016, MNRAS, 463, 1291
- Ishibashi et al. (2017) Ishibashi W., Banerji M., Fabian A. C., 2017, MNRAS, 469, 1496
- Jiang et al. (2014) Jiang Y.-F., Stone J. M., Davis S. W., 2014, ApJ, 796, 106
- Kato et al. (2008) Kato S., Fukue J., Mineshige S., 2008, Black-Hole Accretion Disks — Towards a New Paradigm —
- Kelly et al. (2009) Kelly B. C., Bechtold J., Siemiginowska A., 2009, ApJ, 698, 895
- Kelly et al. (2014) Kelly B. C., Becker A. C., Sobolewska M., Siemiginowska A., Uttley P., 2014, ApJ, 788, 33
- King & Pounds (2015) King A., Pounds K., 2015, ARA&A, 53, 115
- Leighly et al. (2009) Leighly K. M., Hamann F., Casebeer D. A., Grupe D., 2009, ApJ, 701, 176
- Leighly et al. (2015) Leighly K. M., Cooper E., Grupe D., Terndrup D. M., Komossa S., 2015, ApJ, 809, L13
- MacLeod et al. (2010) MacLeod C. L., et al., 2010, ApJ, 721, 1014
- Mainzer et al. (2014) Mainzer A., et al., 2014, ApJ, 784, 110
- Matzeu et al. (2016) Matzeu G. A., Reeves J. N., Nardini E., Braito V., Costa M. T., Tombesi F., Gofford J., 2016, MNRAS, 458, 1311
- Matzeu et al. (2017) Matzeu G. A., Reeves J. N., Braito V., Nardini E., McLaughlin D. E., Lobban A. P., Tombesi F., Costa M. T., 2017, MNRAS, 472, L15
- Matzeu et al. (2019) Matzeu G. A., et al., 2019, MNRAS, 483, 2836
- McGraw et al. (2018) McGraw S. M., Shields J. C., Hamann F. W., Capellupo D. M., Herbst H., 2018, MNRAS, 475, 585
- Netzer (2015) Netzer H., 2015, ARA&A, 53, 365
- O’Donnell (1994) O’Donnell J. E., 1994, ApJ, 422, 158
- Ohsuga et al. (2009) Ohsuga K., Mineshige S., Mori M., Kato Y., 2009, PASJ, 61, L7
- Parker et al. (2017) Parker M. L., et al., 2017, Nature, 543, 83
- Pinto et al. (2018) Pinto C., et al., 2018, MNRAS, 476, 1021
- Pounds et al. (2003) Pounds K. A., Reeves J. N., King A. R., Page K. L., O’Brien P. T., Turner M. J. L., 2003, MNRAS, 345, 705
- Proga & Kallman (2004) Proga D., Kallman T. R., 2004, ApJ, 616, 688
- Proga et al. (2000) Proga D., Stone J. M., Kallman T. R., 2000, ApJ, 543, 686
- Reeves et al. (2003) Reeves J. N., O’Brien P. T., Ward M. J., 2003, ApJ, 593, L65
- Rogerson et al. (2016) Rogerson J. A., Hall P. B., Rodríguez Hidalgo P., Pirkola P., Brandt W. N., Filiz Ak N., 2016, MNRAS, 457, 405
- Ross et al. (2018) Ross N. P., et al., 2018, MNRAS, 480, 4468
- Ruan et al. (2014) Ruan J. J., Anderson S. F., Dexter J., Agol E., 2014, ApJ, 783, 105
- Runnoe et al. (2012) Runnoe J. C., Brotherton M. S., Shang Z., 2012, MNRAS, 422, 478
- Schlegel et al. (1998) Schlegel D. J., Finkbeiner D. P., Davis M., 1998, ApJ, 500, 525
- Shakura & Sunyaev (1973) Shakura N. I., Sunyaev R. A., 1973, A&A, 24, 337
- Sheng et al. (2017) Sheng Z., Wang T., Jiang N., Yang C., Yan L., Dou L., Peng B., 2017, ApJ, 846, L7
- Stern et al. (2018) Stern D., et al., 2018, ApJ, 864, 27
- Sun et al. (2015) Sun M., et al., 2015, ApJ, 811, 42
- Sun et al. (2018) Sun M., Xue Y., Wang J., Cai Z., Guo H., 2018, ApJ, 866, 74
- Tombesi et al. (2010) Tombesi F., Sambruna R. M., Reeves J. N., Braito V., Ballo L., Gofford J., Cappi M., Mushotzky R. F., 2010, ApJ, 719, 700
- Vaughan et al. (2004) Vaughan S., Edelson R., Warwick R. S., 2004, MNRAS, 349, L1
- Wang et al. (2015) Wang T., Yang C., Wang H., Ferland G., 2015, ApJ, 814, 150
- Wright et al. (2010) Wright E. L., et al., 2010, AJ, 140, 1868
- Zu et al. (2013) Zu Y., Kochanek C. S., Kozłowski S., Udalski A., 2013, ApJ, 765, 106