Blockchain Goes Green? An Analysis of
Blockchain on Low-Power Nodes
Abstract
Motivated by the massive energy usage of blockchain, on the one hand, and by significant performance improvements in low-power, wimpy systems, on the other hand, we perform an in-depth time-energy analysis of blockchain systems on low-power nodes in comparison to high-performance nodes. We use three low-power systems to represent a wide range of the performance-power spectrum, while covering both x86/64 and ARM architectures. We show that low-end wimpy nodes are struggling to run full-fledged blockchains mainly due to their small and low-bandwidth memory. On the other hand, wimpy systems with balanced performance-to-power ratio achieve reasonable performance while saving significant amounts of energy. For example, Jetson TX2 nodes achieve around 80% and 30% of the throughput of Parity and Hyperledger, respectively, while using and less energy compared to traditional brawny servers with Intel Xeon CPU.
1 Introduction
Recent years have seen the increasing adoption of blockchain systems by enthusiasts, industry and the academia. Starting with Bitcoin [17], and followed by a myriad of other networks, among which Ethereum [7] is one of the most popular, these public blockchain systems are mainly used for cryptocurrencies. More recently, permissioned blockchains, such as Hyperledger [6], are used to facilitate asset management among mutually distrusting entities.
With an estimated annual energy usage of 52 TWh in 2018, Bitcoin network is using more energy than developed countries such as Portugal or Singapore [9]. Even Ethereum would enter top 100 countries with an estimated energy usage of almost 10 TWh [10]. When accounting for the other hundreds or thousands of blockchain systems, we obtain a worrying figure for energy usage. While other IT domains, such as cloud and high-performance computing [20], have been optimizing to reduce power consumption and to increase energy efficiency, we believe it is time for blockchain systems to follow this trend.
Energy represents the electricity used in a period of time. In computer systems, high energy is the result of (i) long execution time and/or (ii) high power usage of active subsystems, such as the main processor (CPU), graphics processor (GPU) or other accelerators. In public blockchain platforms, Proof-of-Work (PoW) consensus protocols are considered the Achilles’ heel in terms of time-energy performance [9, 10]. This is because PoW consists of a compute-intensive mining phase running cryptographic algorithms. In addition to the high cost of the consensus phase, we show in this paper that newer versions of Ethereum exhibit long transaction execution time due to a design choice that leads to many transactions being restarted multiple times.
Other proposed consensus protocols, including proof-of-authority (PoA), proof-of-stake (PoS) and proof-of-elapsed-time (PoET), among others, are promising in terms of lowering the time-energy costs because they do not include resource-intensive algorithms. In this paper, we analyze three blockchain systems with different consensus protocols, namely Ethereum, Parity and Hyperledger which are using PoW, PoA and Practical Byzantine Fault Tolerance (PBFT) [8] consensus protocols, respectively.
The high energy consumption of well-known blockchain systems is a result of using traditional high-performance hardware in the mining process. The ASICs used in mining Bitcoin or the high-end GPUs used by Ethereum have power characteristics in the order of hundreds or thousands of Watts (W). Even traditional high-performance CPU-only systems used by many blockchains are using a significant quantity of energy. On the other hand, emerging low-power devices based on ARM architecture are showing significant performance improvements that promote them as alternative to traditional x86/64 servers [25]. While the majority of low-power, wimpy nodes [15] are deployed at the edge, in Internet of Things (IoT) setups, higher-end devices are targeting the server market. In this paper, we seek answer to the question of whether these low-power devices are able to run blockchain and at what performance-to-power cost.
The performance of modern blockchain systems on traditional servers was analysed using BLOCKBENCH in [11], among other works. In this paper, we extend BLOCKBENCH in two significant directions. First, we extend the original time-performance analysis performed on Xeon CPUs to low-power, wimpy nodes. Second, we provide in-depth analysis of energy cost on both brawny and wimpy systems. For brawny nodes, we use the same system specified in [11]. For wimpy nodes, we use three systems covering a wide performance-to-power spectrum, as well as both x86/64 and ARM architectures.
We make the following contributions in this paper:
-
•
We provide the first extensive time-energy performance study of state-of-the-art blockchain systems on both high-performance and low-power nodes acting as miners or validators. We examine Hyperledger, Ethereum and Parity running on Intel Xeon, NUC [2], NVIDIA Jetson TX2 [14], and Raspberry Pi 3 [1]. We share not only the analysis, but our experience of running blockchain on various system architectures.
-
•
We show that low-power ARM-based systems struggle to run full-fledged blockchain workloads mainly due to insufficient memory size and bandwidth. For example, the low-end Raspberry Pi 3 wimpy node is unable to run Ethereum, and it requires non-trivial code modifications and special configuration to run Hyperledger.
-
•
We show that systems with the lowest power profile do not necessarily achieve the best energy efficiency. For example, Jetson TX2 is more energy-efficient than Raspberry Pi 3, even if the latter has a lower power profile.
-
•
We show that wimpy nodes can achieve reasonable performance while saving significant amounts of energy. For example, eight Jetson TX2 nodes trade 17% and 72% of Parity and Hyperledger throughput, respectively, for and lower energy consumption compared to eight Xeon nodes.
-
•
Our analysis of Ethereum performance leads to an insight into the design trade-off in newer Ethereum releases compared to older ones that are used in [11]. In particular, the new design has lower throughput due to the cost of many transaction execution restarts.
The remainder of this paper is organized as follows. In Section 2 we present background and related work on blockchain systems. In Section 3 we describe the hardware systems and blockchain workloads used in this study. We also provide a detailed characterization of the hardware systems in this section. In the next two sections, we analyze the time and energy performance at single-node and cluster level. We conclude in Section 6.
2 Background and Related Work
In this section, we provide a background on blockchain systems and survey the related work on time and energy performance analysis of blockchains.
2.1 Blockchain Systems
A blockchain is a distributed ledger running on a network of mutually distrusting nodes (or peers). The ledger is stored as a linked list (or chain) of blocks of transactions. The links in the chain are built using cryptographic pointers to ensure that no one can tamper with the chain or with the data inside a block.
Blockchains are most famous for being the underlying technology of cryptocurrencies, but many blockchains are able to support general-purpose applications. This ability is determined by the execution engine and data model. For example, Bitcoin [17] supports only operations related to cryptocurrency (or token) manipulation. On the other hand, Ethereum [7] can run arbitrary computations on its Turing-complete Ethereum Virtual Machine (EVM). At data model level, there are at least three alternatives used in practice. The Unspent Transaction Output (UTXO) model, used by Bitcoin, represents the ledger states as transaction ids and associated unspent amounts which are the input of future transactions. The account/balance model resembles a classic banking ledger. A more generic model used by Hyperledger consists of key-value states. On top of the data model, ones can write general applications that operate on the blockchains states. Such applications are called smart contracts. In this paper, we use BLOCKBENCH benchmarks which provides a set of smart contracts for Hyperledger, Ethereum and Parity.
Depending on how nodes can join the network, the blockchain is public or private (or permissioned). In public networks, anybody can join or leave and, thus, the security risks are high. Most of the cryptocurrency blockchains are public, such as Bitcoin [17] and Ethereum [7]. On the other hand, private blockchains allow only authenticated peers to join the network. Typically, private blockchains, such as Hyperledger [6] and Parity [18], are deployed inside or across big organizations.
Blockchains operate in a network of mutually distrusting peers, where some peers may not be just faulty but malicious. Hence, they assume a Byzantine environment, in contrast to the crash-failure model used by the majority of distributed systems. To ensure consistency among honest peers, most private blockchains use Byzantine fault-tolerant consensus protocols such as PBFT [8], whereas most public blockchains use proof-of-work (PoW) consensus protocols.
In PoW, participating nodes, called miners, need to solve a difficult cryptographic puzzle. The node that solves the puzzle first has the right to append transactions to the ledger. On the other hand, PBFT consists of exchanging messages among the nodes to reach agreement on the transactions to be appended to the blockchain. These consensus protocols are considered the Achilles’ heel of blockchain due to poor time-energy performance. While PoW is scalable since it can run in parallel on all nodes, it is compute-intensive and, thus, it is both slow and power-hungry on traditional brawny servers. PBFT exhibits quadratic time growth with the number of nodes in the network, leading to energy wastage.
Our analysis in the next sections confirms that a PoW-based blockchain, such as Ethereum, uses more power compared to a PBFT- or PoA-based blockchain. A PBFT-based blockchain, such as Hyperledger, uses almost the same power as a PoA-based blockchains, such as Parity, on small networks of up to eight nodes.
| Xeon | NUC | TX2 | RP3 | ||
| Specs | ISA | x86-64 | x86-64 | AARCH64 | ARMv7l |
| Cores | 6(12) | 2(4) | 6 | 4 | |
| Frequency | 3.50 GHz | 2.40 GHz | 2.04 GHz | 1.20 GHz | |
| L1 Data Cache | 32 kB | 32 kB | 32-128 kB | 32 kB | |
| L2 Cache | 256 kB (core) | 256 kB (core) | 2 MB | 512 kB | |
| L3 Cache | 12 MB | 3 MB | N/A | N/A | |
| Memory | 32 GB DDR3 | 32 GB DDR4 | 8 GB LPDDR4 | 1 GB LPDDR2 | |
| Storage | 2 TB HDD | 256 GB SSD | 64 GB SD card | 64 GB SD card | |
| Networking | Gbit | Gbit | Gbit | 100 Mbit | |
| CPU | CoreMark (one core) [IPS] | 25201.6 | 18022.3 | 12019.7 | 3591.8 |
| System power [W] | 70.6 | 13.8 | 8.8 | 3.0 | |
| CoreMark (all cores) [IPS] | 186924.9 | 50582.4 | 67345.9 | 11031.3 | |
| System power [W] | 127.7 | 18.6 | 11.7 | 4.9 | |
| Keccak256 [MBPS] | 314.2 | 217.4 | 119.0 | 1.0 | |
| System power [W] | 77.1 | 14.7 | 4.9 | 2.4 | |
| Keccak512 [MBPS] | 169.9 | 116.2 | 65.2 | 0.9 | |
| System power [W] | 74.1 | 14.7 | 4.8 | 2.3 | |
| Idle system power [W] | 50.8 | 9 | 2.4 | 1.9 | |
| Storage | Write throughput [MB/s] | 160.0 | 409.0 | 16.3 | 12.5 |
| Read throughput [MB/s] | 172.0 | 551.0 | 88.9 | 22.6 | |
| Buffered read throughput [GB/s] | 8.1 | 6.6 | 2.7 | 0.8 | |
| Write latency [ms] | 9.3 | 1.0 | 17.1 | 14.0 | |
| Read latency [ms] | 2.5 | 0.2 | 2.8 | 25.5 | |
| Network | TCP bandwidth [Mbits/s] | 941 | 839 | 943 | 94 |
| UDP bandwidth [Mbits/s] | 810 | 813 | 755 | 96 | |
| Ping latency [ms] | 0.14 | 0.14 | 0.3 | 0.35 |
2.2 The Time-Energy Analysis of Blockchains
There are a number of related works that analyze performance of blockchains [11, 19]. However, only a few include energy analysis [21, 23], and the analysis is of limited depth.
BLOCKBENCH [11] is a benchmarking suite comprising both simple (micro) benchmarks and complex (macro) benchmarks. The micro benchmarks, namely CPUHeavy, IOHeavy and Analytics, stress different subsystems such as the CPU, memory and IO. On the other hand, YCSB macro benchmark implements a key-value storage, while Smallbank represents OLTP and simulates banking operations. These benchmarks are implemented as smart contracts in Ethereum, Parity and Hyperledger. Their performance in terms of throughput and latency is evaluated on traditional high-performance servers with Intel Xeon CPU. In this paper, we extend BLOCKBENCH to include time-energy analysis of a wider range of systems, with focus on low-power nodes.
Sankaran et al. [21] analyze the time and energy performance of an in-house Ethereum network consisting of high-performance mining servers and low-power Raspberry Pi clients. These low-power systems cannot run Ethereum mining due to their limited memory size, hence, they only take the role of clients. In this paper, we run the Ethereum full nodes on low-power devices with higher performance, such as Intel NUC and Jetson TX2. To the best of our knowledge, we are the first to run and analyze the time-energy performance of full-fledged blockchains on low-power systems.
MobiChain [23] is an approach that allows mining on mobile devices running Android OS, in the context of mobile commerce. While containing analysis of both time and energy performance, MobiChain has no comparison to other blockchains. In terms of energy analysis, the authors show that it is more energy-efficient to group multiple transactions in a single block since there is less mining work and therefore less time and power wasted in this process. However, larger blocks increase latency and result in poor user experience.
Jupiter [16] is a blockchain designed for mobile devices. It aims to address the problem storing large ledger on mobile devices with limited storage capacity. However, there is no time or energy performance evaluation.
To the best of our knowledge, we provide the first extensive time-energy performance analysis of blockchain systems on low-power, wimpy nodes in comparison with high-performance server systems.
3 Experimental Setup
In this section, we describe our experimental setup, starting with the systems and ending with the workloads. We present a detailed characterization of the selected systems at CPU, memory, storage and networking levels. The results of this detailed characterization are summarized in Table 1.
3.1 Systems
We compare the time and energy performance of low-power systems against a high-performance traditional server system. This server system is based on a x86/64 Intel Xeon E5-1650 v3 CPU clocked at 3.5GHz, and has 32GB DDR3 memory, 2TB hard-disk (HDD) and 1Gbps networking interface card (NIC). It runs Ubuntu 14.04 with Linux kernel 3.13.0-95.
The low-power systems used for the analysis are (i) Intel NUC [2], (ii) NVIDIA Jetson TX2 [14] and (iii) Raspberry Pi 3 model B (RP3) [1]. The NUC system is based on a x86/64 Intel Core i3 CPU with two physical cores that support Hyperthreading and run at 2.4GHz. This system has 32GB DDR4, 256GB solid-state drive (SSD) and 1Gbps NIC. It runs Ubuntu 16.04 with Linux kernel 4.15.0-34.
The TX2 system is based on a heterogeneous 6-core 64-bit CPU with two NVIDIA Denver cores and four ARM Cortex-A57 cores clocked at more than 2GHz. The system has 8GB LPDDR4, a 32GB SD card and 1Gbps NIC. TX2 is running Ubuntu 16.04 with Linux kernel 4.4.38-tegra of aarch64 (64-bit ARM) architecture.
The RP3 has a 4-core ARM Cortex-A53 CPU of 64-bit ARM architecture and 1GB of LPDDR2 memory. This system has a 64GB SD card that acts as storage and 100Mbps NIC. It runs Debian 9 (stretch) with Linux kernel 4.9.80-v7+ (32-bit ARM).
We measure power and energy consumption of these systems with a Yokogawa power meter connected to the AC lines. We report only AC power and energy values in this paper. We believe that these values are more useful compared to DC measurements since they reflect the final billable energy.
3.2 Systems Characterization
Before analyzing the time and energy of blockchains on the selected systems, we evaluate the hardware at CPU, memory, storage and networking level to understand their relative performance. The measured values and system characteristics are summarized in Table 1.
We first measure idle system power when the hardware is running only the OS. We obtain 50W, 9W, 2.4W and 1.9W for Xeon, NUC, TX2 and RP3, respectively. These values clearly show the power efficiency gap between brawny nodes used in the majority of datacenters and supercomputers, and wimpy nodes used at the edge.
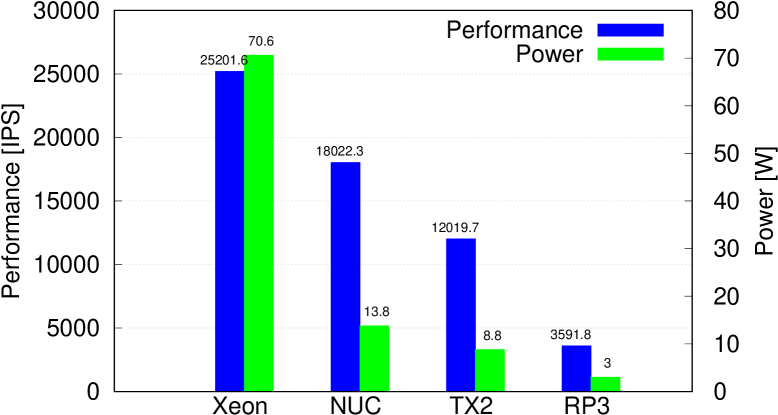
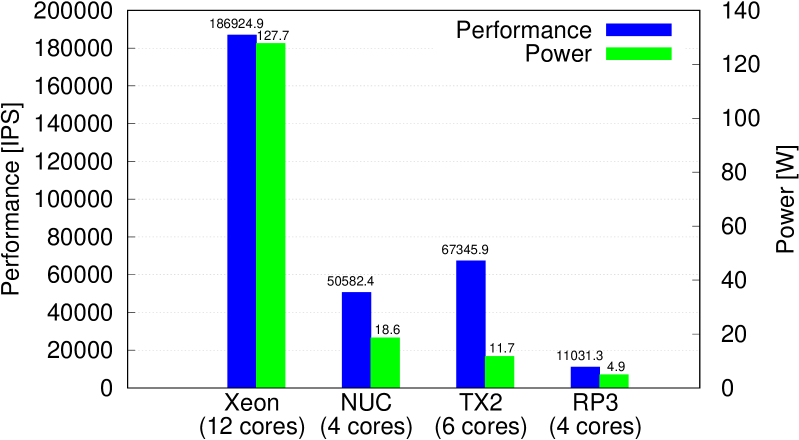
To assess CPU performance, we use CoreMark benchmark which is increasingly used by the industry, including vendors that equip their systems with ARM CPUs [4]. CoreMark measures CPU performance in terms of iterations per second (IPS). We present the performance and average power usage in Figure 1(a) and Figure 1(b) for CoreMark running on a single core and all cores, respectively. For multi-core analysis, we enable all available cores, including virtual cores in systems that support Hyperthreading. For example, we use twelve and four virtual cores on Xeon and NUC, respectively.
At single-core level, the performance of Xeon is 1.4, 2.1 and 7 times higher compared to NUC, TX2 and RP3, respectively. But this performance comes at the cost of , and higher power consumption. However, we note that this is the power used by the entire system which includes other components beside the CPU. We then estimate the power of CPU by subtracting the values for idle system power. One Xeon core uses almost 20W, while one ARM core from RP3 uses only 1.1W. Hence, the performance-to-power ratio (PPR) of the RP3 is superior to that of the Xeon.
At multi-core level, TX2 exhibits better performance than NUC, mainly because of its six real cores compared to only two real cores on NUC. Moreover, TX2 uses less power than NUC to deliver higher performance. Therefore, it is expected that TX2 has a better time-energy performance for multi-threaded workloads. We also observe that the performance is not scaling perfectly with the number of cores. For example, Xeon exhibits only 7.4 times performance boost when 12 cores are used. TX2 is performing better, with a 5.6 performance increase when 6 cores are used. This sub-linearity is due to resource contention, both in-core and off-core [24].
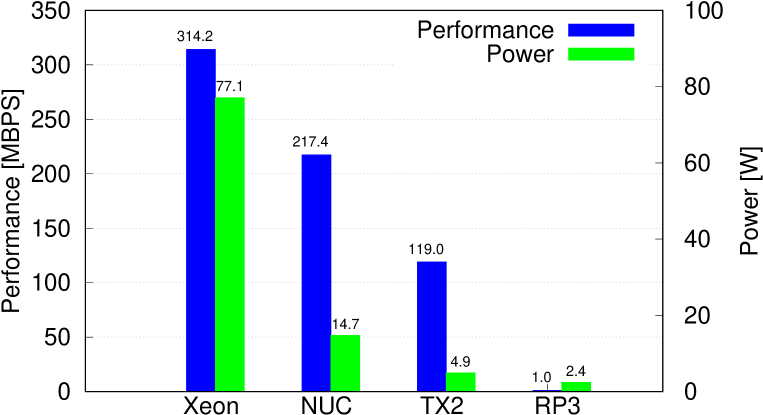
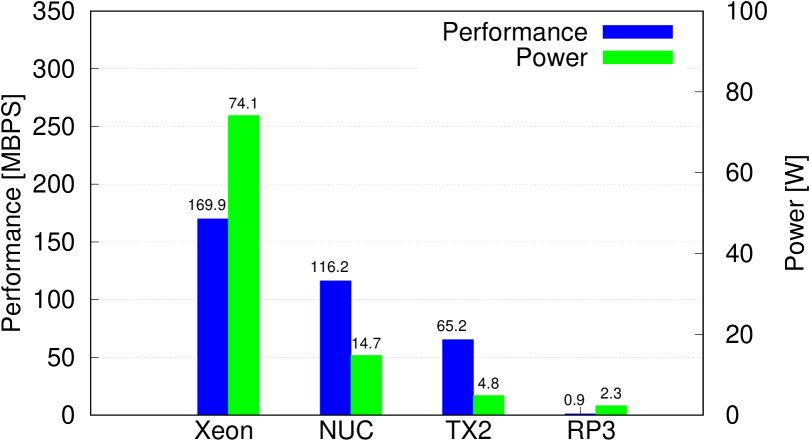
Blockchain systems rely heavily on cryptographic operations that are CPU-intensive. We evaluate the CPU on running this type of workload by measuring the performance and average power of Keccak secure hash algorithm from go-ethereum v1.8.15, compiled with go 1.11. We run both Keccak256 and Keccak512 on a random input of one billion bytes. The throughput measured in MB per second (MBPS) represents the performance of these cryptographic algorithms on the selected systems. As shown in Figure 1(c) and Figure 1(d), the performance trends are similar to CoreMark. RP3 exhibits much lower performance: almost and lower throughput compared to Xeon on Keccak256 and Keccak512, respectively. The lower system power of RP3 running these cryptographic operations compared to CoreMark suggests that the core is not fully utilized. In fact, it is often stuck in memory operations that use less power compared to arithmetic operations. As we shall see in the next paragraph, RP3’s memory has significantly lower bandwidth than the other three systems.
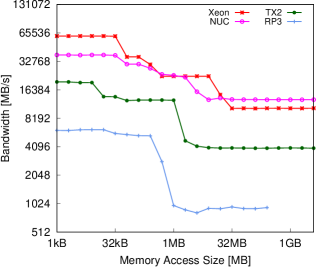
We analyze the performance of the memory subsystem in terms of bandwidth. We use lmbench [22] to get the read-write bandwidth and plot the results in Figure 2. At level one cache (L1), Xeon has the highest bandwidth, which is almost 60GB/s, while NUC, TX2 and RP3 exhibit bandwidths of 37GB/s, 19GB/s and 6GB/s, respectively. This is expected since server-class processors, such as Xeon, have optimized caches. However, at the main memory level, NUC leads with a bandwidth of 12.5GB/s, followed closely by Xeon with 10GB/s. This lower performance of Xeon is attributed to the older DDR3 memory generation. TX2 and RP3 exhibit main memory bandwidths of less than 4GB/s and 1GB/s, respectively. This low bandwidth, together with small memory size hinder the execution of modern workloads on wimpy systems.
At storage level, there is a mixed performance profile since the systems are equipped with different types of storage mediums. To assess throughput and latency, we use dd and ioping Linux commands, respectively. As expected, the SSD of NUC exhibits the highest throughput and the lowest latency. On the other hand, the SD cards used by TX2 and RP3 exhibit low throughput, high latency and significant read/write asymmetry. Since modern operating systems are caching files or chunks in memory, we also measure the buffered read throughput. We observe that this throughput follows the memory bandwidth trend, except for NUC where the buffered throughput of 6.6GB/s is half of the memory bandwidth.
At networking level, we measure the bandwidth and latency using iperf and ping Linux commands, respectively. As expected, RP3 exhibits lower TCP and UDP bandwidths since it is equipped with 100Mbps NIC, compared to the Gigabit Ethernet NICs of the other systems. The slightly higher latency of TX2 and RP3 can be attributed to the lower clock frequency of the wimpy systems. To validate this hypothesis, we have measured the networking latency while setting the clock frequency to a fixed step. TX2 supports twelve frequency steps in the range 346MHz-2.04GHz. We obtained a Pearson correlation coefficient of -0.93 between the twelve frequency steps and corresponding latencies, suggesting strong inverse proportionality. For example, the networking latency at 346MHz is 0.33ms, while at 2.04GHz is 0.25ms. On RP3, there are only two available frequency steps, but we obtained similar results. While setting the frequency to 600MHz and 1.2GHz, we obtained networking latencies of 0.35ms and 0.29ms, respectively.
Observation 1
In summary, the hardware systems have the following characteristics.
Observation 1.1
Low-power x86/64 devices, such as Intel NUC, can match the performance of server-class systems at memory and storage level while using less power. However, CPU performance is lower when running multi-threaded workloads due to the small number of cores.
Observation 1.2
High-end ARM-based wimpy devices, such as Jetson TX2, have potential to achieve high PPR at the cost of lower time performance compared to x86/64 systems.
Observation 1.3
Low-end ARM-based devices, such as Raspberry Pi 3, suffer from low core clock frequency, small and low-bandwidth memory. These systems may not be able to run modern server-class workloads, including blockchains.
3.3 Workloads
We use BLOCKBENCH [11] with minor changes111The updated source code of BLOCKBENCH is available at https://github.com/dloghin/blockbench to assess blockchain performance. We were not able to compile go-ethereum v1.4.18 evaluted in the original BLOCKBENCH paper [11] on TX2 due to issues with older versions of go toolchain on aarch64 architecture. We also encountered issues with the compilation of parity-ethereum v1.6.0 on all systems due to broken Rust packages. Hence, we use go-ethereum v1.8.15 compiled with go 1.11 and parity-ethereum v2.1.6 compiled with cargo 1.30.0 on all systems. For Hyperledger experiments we use version v0.6 which supports PBFT consensus.
The micro-benchmarks in BLOCKBENCH assess the performance of different subsystems. CPUHeavy uses quicksort to sort an array of integers, while IOHeavy implements Write and Scan operations that touch key-value pairs to stress the memory and IO subsystems. The analytics benchmark simulates typical OLAP workloads as found in traditional databases. It implements three queries. The first query (Q1) computes the total value of transactions between two blocks. The second (Q2) and third (Q3) computes the maximum transaction and the maximum account balance, respectively, between two blocks for a given account. This benchmark requires an initialization step that creates 120,000 accounts and generates over 100,000 blocks with an average of three transactions per block.
The macro-benchmarks in BLOCKBENCH are complex database applications stressing all key subsystems. For example, YCSB evaluates the performance of a key-value store with configurable read-write ratios, while Smallbank represents OLTP workloads by simulating banking transactions. Donothing benchmark estimates the overhead of consensus protocols since it performs no computations and no IO operations inside the smart contract. In this paper, the macro-benchmarks are run on clusters of nodes.
All workloads are run at least three times. We report the average values and standard deviations.
3.4 Raspberry Pi 3 (RP3) Setup
RP3 is unable to run go-ethereum since it has only 1GB of RAM while Ethereum requires more than 4GB. Modifying go-ethereum to run on low-end wimpy devices is left to future work. In this paper, we only report the performance and energy of Ethereum on Xeon, NUC and TX2.
Running Hyperledger on ARM-based devices is challenging and requires non-trivial
engineering work to patch the existing code222The modified Fabric
code is available on GitHub at
https://github.com/dloghin/fabric/tree/v0.6_raspberrypi. Firstly, we
need to recompile the Linux kernel to support Docker, since Hyperledger is
running the chaincode inside Docker containers. Secondly, we need to pre-compile
several tools, such as protoc and grpc, used in these
containers for armv7l (32-bit ARM) and aarch64 (64-bit ARM)
architectures.
Thirdly, we need to decrease the size of some buffers and increase timeouts for
the execution on RP3. For example, we decreased cNameArr buffer size
from 256MB (which is one fourth of the available memory on RP3) to 1MB, and we
increased request execution timeout from 30s to 10m.
Even with all these changes, populating the blockchain for Analytics queries on RP3 leads to system crashes. We discovered that the swap space on the default Debian 9 OS of RP3 was 100MB which is too small given the main memory size of 1GB. We increased this swap size to 2GB. We also found through profiling with Go pprof that much of the memory is used in encoding and decoding protobuf objects. Many of these operations are redundant and can be avoided by keeping extra fields in blockchain data structures. One option to save memory is to de-allocate unused memory space. To this end, we insert debug.FreeOSMemory() in Hyperledger’s code after memory-intensive routines to make sure the garbage collector (GC) is de-allocating memory faster. We also decreased client’s transaction rate during the initialization step of Analytics to allow GC to free more memory. With all these changes in place, we were able to run Hyperledger without problems.
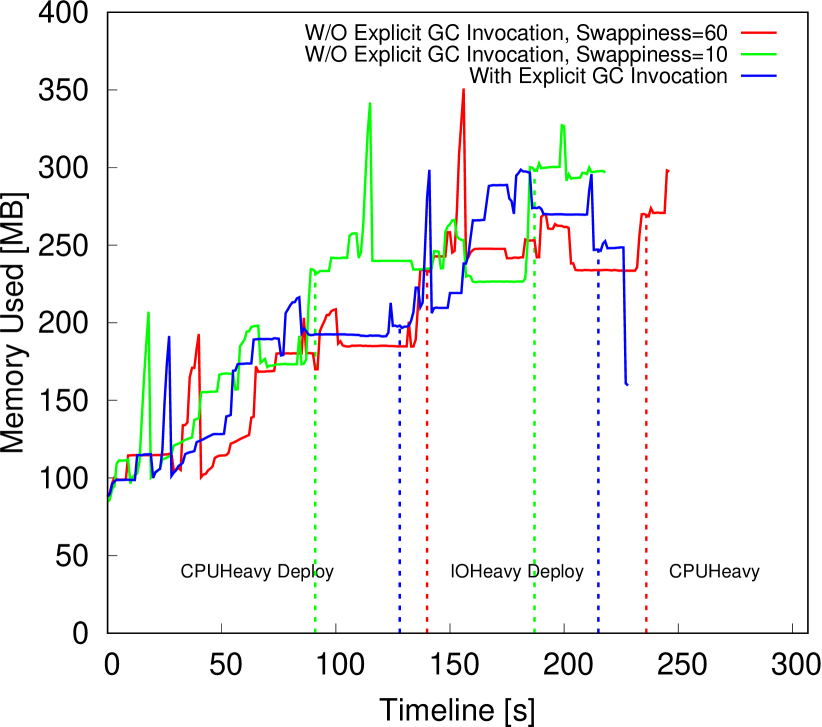
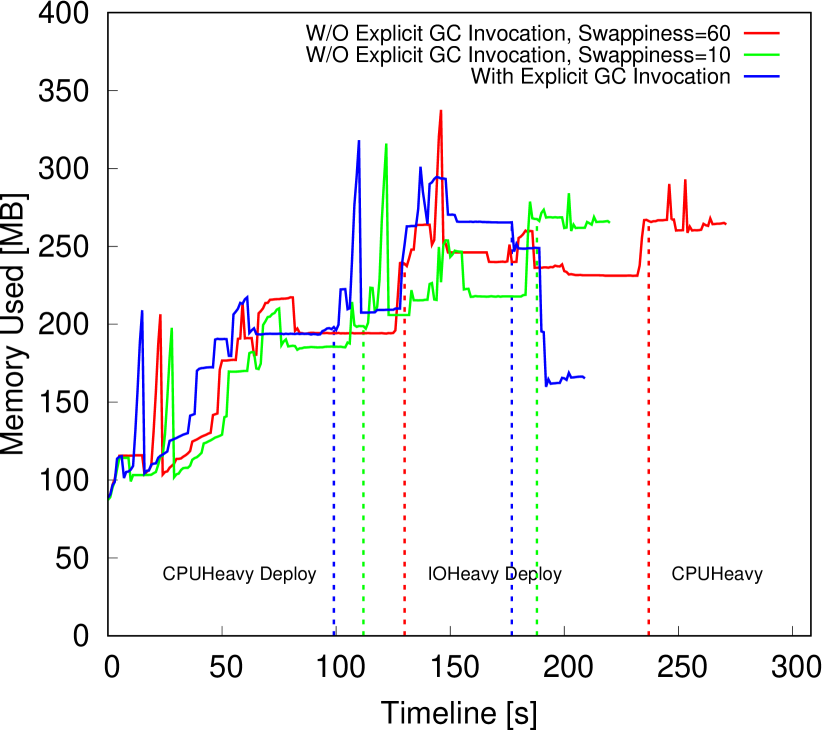
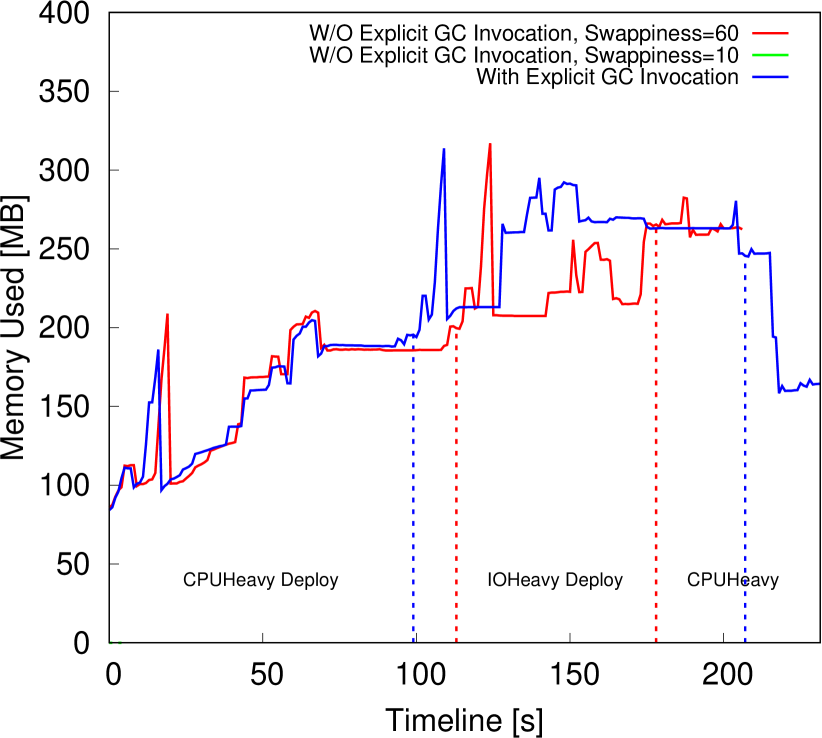
While explicitly invoking Go’s GC is not necessary for some workloads, such as CPUHeavy, we observed that IOheavy Write/Scan and Analytics almost always crash without this change. We evaluate the effects of this change on a sequence of operations consisting of CPUHeavy deploy (phase 1), IOHeavy deploy (phase 2), and CPUHeavy (phase 3) executions. The memory usage, depicted in Figure 3, shows that when the GC is called explicitly (i) peak memory usage is smaller, as expected, but interestingly (ii) the execution becomes faster than without explicit GC invocation. Figures 3(b) and 3(c) illustrates clearly that explicit GC invocation decreases the memory footprint at the end of phase execution.
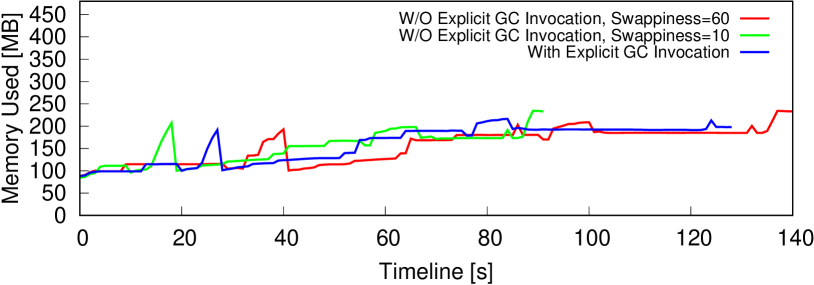
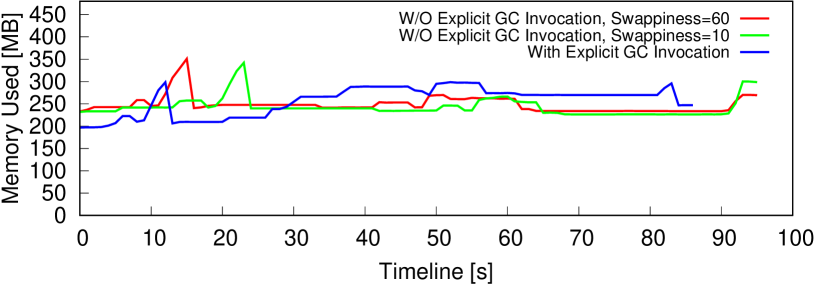
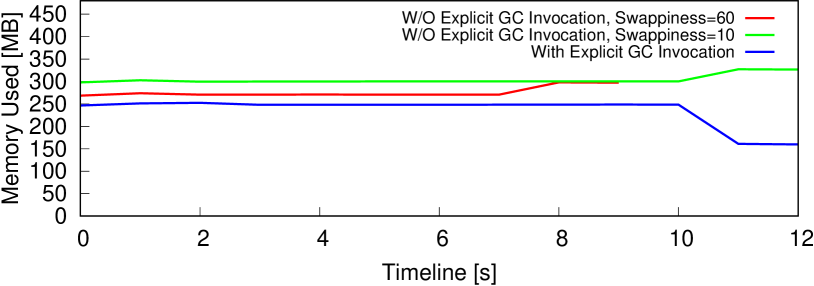
Intuitively, explicit GC should incur overheads and delay the execution. But freeing memory aggressively may reduce pressure on the Linux kernel swapping mechanism, and consequently lead to faster execution. In Debian/Ubuntu OS, the swapping is controlled by a parameter called swappiness which is by default 60, but can take values from 0 to 100. A value of 0 indicates that the kernel avoids swapping pages out of the physical memory, while a value of 100 indicates an aggressive swapping mechanism [3]. To test our hypothesis, we lower the swappiness value to 10 for a lower swapping overhead. With this change, the overall execution is faster, but the memory footprint is higher during execution, as shown in Figure 3(c). However, we note that decreasing swappiness value does not help with Hyperledger’s crashes on heavy workloads.
| Workload | Size | Execution Time [s] | Power [W] | Performance-to-Power Ratio [ops/J] | |||||||||||||||||
| Average | Std. dev. | Average | Std. dev. | ||||||||||||||||||
| Xeon | NUC | TX2 | RP3 | Xeon | NUC | TX2 | RP3 | Xeon | NUC | TX2 | RP3 | Xeon | NUC | TX2 | RP3 | Xeon | NUC | TX2 | RP3 | ||
| CPUHeavy | 1000000 | 1.0 | 1.0 | 1.1 | 2.4 | 0.0 | 0.0 | 0.0 | 1.7 | 50.6 | 9.0 | 2.4 | 2.1 | 1.7 | 0.2 | 0.0 | 0.1 | 19,459.2 | 106,885.5 | 383,004.3 | 308,875.7 |
| 10000000 | 1.2 | 1.2 | 1.7 | 2.5 | 0.0 | 0.0 | 0.0 | 0.0 | 52.0 | 10.9 | 3.8 | 2.7 | 1.0 | 0.7 | 0.6 | 0.2 | 165,735.7 | 739,181.8 | 1,597,910.5 | 1,494,017.5 | |
| 100000000 | 2.8 | 3.9 | 8.3 | 17.7 | 0.0 | 0.2 | 0.2 | 1.1 | 72.9 | 14.8 | 4.6 | 2.9 | 1.0 | 1.2 | 0.1 | 0.1 | 485,530.3 | 1,720,378.6 | 2,607,959.9 | 1,978,696.9 | |
| IOHeavy Write | 3200000 | 1,055.2 | 1,721.1 | 7,365.3 | 11,911.7 | 52.3 | 88.9 | 78.3 | 142.1 | 83.1 | 17.9 | 3.7 | 3.3 | 0.1 | 0.0 | 0.0 | 0.0 | 36.6 | 104.4 | 117.2 | 82.3 |
| 6400000 | 2,125.1 | 3,473.2 | 14,675.3 | 27,246.0 | 85.3 | 139.9 | 114.0 | 309.6 | 83.0 | 17.9 | 4.5 | 3.1 | 0.1 | 0.1 | 1.1 | 0.0 | 36.3 | 103.1 | 102.9 | 74.9 | |
| 12800000 | 4,299.0 | 7,025.0 | 28,957.0 | 63,891.3 | 102.5 | 162.7 | 751.9 | 917.2 | 83.0 | 17.9 | 3.7 | 3.0 | 0.1 | 0.0 | 0.1 | 0.0 | 35.9 | 101.6 | 120.1 | 66.2 | |
| IOHeavy Scan | 3200000 | 744.1 | 1,442.0 | 6,191.7 | 8,915.3 | 5.9 | 7.2 | 79.3 | 42.6 | 83.7 | 15.1 | 3.1 | 3.2 | 0.1 | 0.0 | 0.0 | 0.0 | 51.4 | 147.1 | 169.3 | 112.4 |
| 6400000 | 1,487.1 | 2,871.4 | 10,960.3 | 17,296.3 | 11.5 | 26.5 | 2195.8 | 118.8 | 83.6 | 15.1 | 3.6 | 3.2 | 0.0 | 0.0 | 0.8 | 0.0 | 51.5 | 147.4 | 169.4 | 114.6 | |
| 12800000 | 2,966.1 | 5,768.3 | 25,049.0 | 34,274.7 | 20.2 | 84.4 | 257.7 | 702.6 | 83.6 | 15.1 | 3.0 | 3.2 | 0.1 | 0.1 | 0.0 | 0.0 | 51.6 | 147.3 | 167.7 | 115.3 | |
| Analytics Q1 | 10000 | 9.7 | 18.8 | 157.6 | 103.8 | 0.0 | 0.0 | 0.3 | 5.0 | 90.3 | 18.1 | 2.9 | 3.2 | 0.5 | 0.1 | 0.0 | 0.0 | 11.4 | 29.5 | 21.8 | 30.6 |
4 Single Node Analysis
4.1 Hyperledger
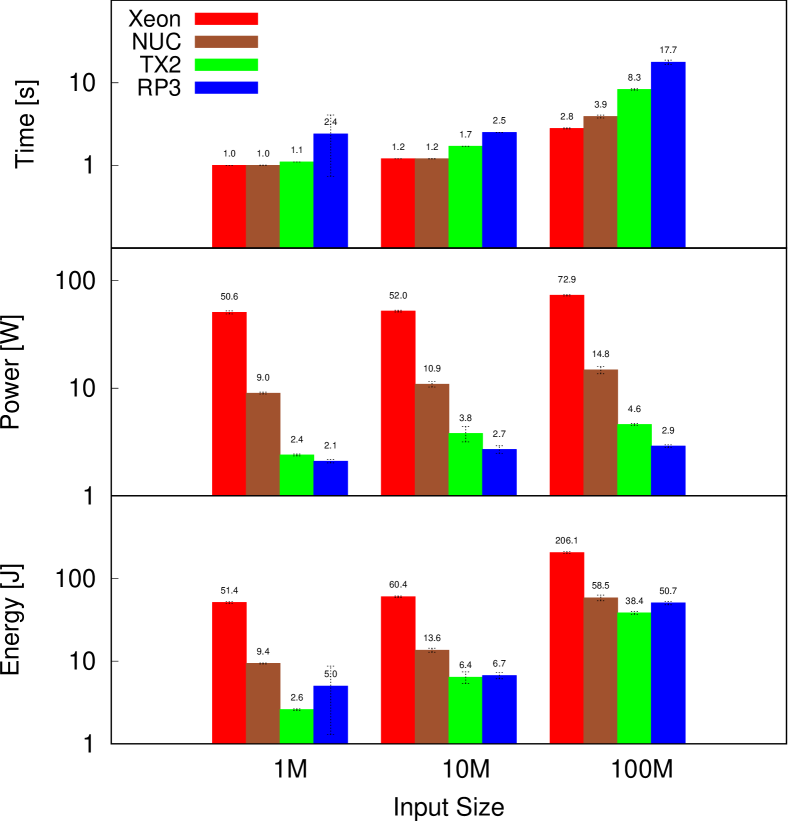
The time-power performance333Background colors represent relative performance, with green and red being the best and the worst, respectively. of Hyperledger workloads is shown in Table 2, across four systems under evaluation. Lower values are better for the execution time and power, while for the performance-to-power ratio (PPR) higher values are better. We define the PPR as the ratio between useful work and power. For simplicity, we consider useful work to be proportional with the input size. For example, for Xeon system, sorting one million numbers using the CPUHeavy smart contract performs one million operations and consumes W, therefore its PPR is ops/J.
| geth | Execution Time [s] | Apply Transaction Count | ||||||||
| version | Run #1 | Run #2 | Run #3 | Run #4 | Run #5 | Run #1 | Run #2 | Run #3 | Run #4 | Run #5 |
| 1.4.18 | 146.7 | 97.7 | 120.9 | 98.9 | 99.2 | 6 | 4 | 5 | 4 | 4 |
| 1.8.13 | 5.5 | 5.0 | 4.5 | 7.5 | 5.0 | 1 | 1 | 1 | 1 | 1 |
| 1.8.14 | 1369.3 | 2152.8 | 561.7 | 197.3 | 72.6 | 314 | 481 | 126 | 42 | 16 |
| 1.8.15 | 62.08 | 125.45 | 27.68 | 141.64 | 186.4 | 13 | 27 | 4 | 31 | 42 |
As expected, the fastest system is Xeon, followed by NUC, TX2 and RP3, in this order. For example, RP3 is up to slower than Xeon for IOHeavy Write, while TX2 is more than slower than Xeon for IOHeavy Scan. These performance patterns are in accordance with the characterization in Section 3.2.
The average power profile is the opposite of time performance, with Xeon being the most power-hungry and RP3 the most power-efficient. In particular, Xeon uses 50W and up to 84W for CPUHeavy and IOHeavy, respectively. For the CPUHeavy benchmark there is a gradual increase in power usage with the growing input size since the CPU is doing more work. The IOHeavy workloads incur more power compared to CPUHeavy because they stress the memory and storage, in addition to using the CPU. At the same time, this high-power usage of IOHeavy remains constant as input size increases because (i) the CPU utilization is low but roughly constant, and (ii) the memory and storage have lower dynamic power fluctuations [5]. For example, the average CPU utilization is 9.5% (3.5% standard deviation) and 8.1% (3.6% standard deviation) during the IOHeavy Write and Scan, respectively, for 3.2 million key-value pairs.
The energy is the product of execution time and average power usage. Xeon and RP3 exhibit the highest energy cost due to high power usage for the former and long execution time for the latter. On the other hand, TX2 and NUC use almost always the lowest energy. TX2 is almost always the most efficient because of its lower power profile compared to NUC, and higher performance compared to RP3. We note that even if RP3 has a very low power profile, its memory and CPU limitation translate to larger energy cost than systems with higher power profile.
In summary, we make the following observation concerning Hyperledger execution.
Observation 2
The highest energy efficiency is achieved by low-power systems with balanced performance-to-power profile, rather than systems with low power profile but also low performance.
4.2 Ethereum
| Workload | Size | Execution Time [s] | Power [W] | Performance-to-Power Ratio [ops/J] | ||||||||||||
| Average | Std. dev. | Average | Std. dev. | |||||||||||||
| Xeon | NUC | TX2 | Xeon | NUC | TX2 | Xeon | NUC | TX2 | Xeon | NUC | TX2 | Xeon | NUC | TX2 | ||
| CPUHeavy | 1000000 | 6.2 | 40.6 | 31.4 | 1.4 | 12.3 | 5.5 | 80.9 | 17.1 | 5.0 | 1.4 | 0.2 | 0.1 | 2,112.5 | 1,586.8 | 4,111.3 |
| IOHeavy Write | 100 | 3.5 | 2.9 | 9.2 | 0.8 | 1.4 | 7.7 | 76.7 | 16.4 | 4.8 | 0.1 | 0.5 | 0.0 | 0.5 | 3.1 | 2.3 |
| 1000 | 4.4 | 10.5 | 12.6 | 2.5 | 5.0 | 7.2 | 81.4 | 16.1 | 5.1 | 4.0 | 0.2 | 0.3 | 4.1 | 7.5 | 15.5 | |
| 10000 | 329.9 | 142.4 | 194.4 | 48.9 | 118.6 | 173.7 | 80.5 | 17.5 | 5.2 | 0.5 | 0.4 | 0.2 | 0.4 | 10.4 | 24.9 | |
| IOHeavy Scan | 100 | 3.9 | 3.4 | 5.2 | 1.7 | 0.9 | 3.3 | 78.0 | 16.7 | 5.0 | 1.1 | 0.4 | 0.1 | 0.4 | 1.9 | 3.0 |
| 1000 | 1.8 | 6.5 | 29.6 | 1.0 | 2.3 | 10.7 | 77.4 | 16.0 | 4.7 | 3.2 | 0.5 | 0.0 | 12.3 | 10.7 | 7.1 | |
| 10000 | 1.8 | 2.4 | 11.1 | 0.9 | 0.6 | 1.4 | 79.7 | 17.0 | 5.0 | 2.8 | 0.3 | 0.2 | 81.7 | 270.6 | 140.7 | |
| Analytics Q1 | 1000 | 0.7 | 8.1 | 19.5 | 0.0 | 0.0 | 0.1 | 70.4 | 19.4 | 5.5 | 4.1 | 0.1 | 0.1 | 20.4 | 63.9 | 91.9 |
| Analytics Q2 | 1000 | 0.7 | 8.1 | 19.6 | 0.0 | 0.0 | 0.3 | 73.5 | 19.4 | 5.5 | 0.5 | 0.2 | 0.0 | 19.2 | 63.8 | 92.9 |
| Analytics Q3 | 1000 | 0.4 | 6.6 | 16.9 | 0.0 | 0.0 | 0.1 | 71.7 | 19.6 | 5.5 | 0.3 | 0.2 | 0.1 | 32.0 | 76.9 | 105.8 |
| Workload | Size | Execution Time [s] | Power [W] | Performance-to-Power Ratio [ops/J] | |||||||||||||||||
|---|---|---|---|---|---|---|---|---|---|---|---|---|---|---|---|---|---|---|---|---|---|
| Average | Std. dev. | Average | Std. dev. | ||||||||||||||||||
| Xeon | NUC | TX2 | RP3 | Xeon | NUC | TX2 | RP3 | Xeon | NUC | TX2 | RP3 | Xeon | NUC | TX2 | RP3 | Xeon | NUC | TX2 | RP3 | ||
| CPUHeavy | 1000000 | 64.9 | 71.1 | 147.1 | 1,205.5 | 26.0 | 0.0 | 3.7 | 6.5 | 57.6 | 12.7 | 3.6 | 2.6 | 1.2 | 0.3 | 0.1 | 0.0 | 324.2 | 1,106.6 | 1,910.1 | 316.0 |
| 10000000 | 469.7 | 705.1 | 1,371.0 | 12,205.4 | 4.3 | 0.2 | 83.0 | 367.2 | 71.5 | 14.7 | 4.5 | 2.7 | 1.2 | 0.4 | 0.0 | 0.0 | 298.1 | 967.4 | 1,634.5 | 302.0 | |
| IOHeavy Write | 100 | 84.8 | 42.1 | 30.8 | 62.2 | 15.3 | 15.2 | 0.2 | 45.3 | 50.7 | 8.8 | 2.5 | 2.1 | 0.8 | 0.0 | 0.0 | 0.0 | 0.0 | 0.3 | 1.3 | 1.2 |
| 1000 | 170.4 | 96.0 | 106.7 | 287.0 | 84.1 | 26.0 | 40.0 | 5.6 | 52.8 | 10.5 | 3.0 | 2.5 | 0.1 | 0.2 | 0.1 | 0.1 | 0.1 | 1.1 | 3.6 | 1.4 | |
| 10000 | 124.7 | 186.9 | 380.7 | 2,996.5 | 0.4 | 5.8 | 1.1 | 25.8 | 71.0 | 14.2 | 4.2 | 2.7 | 1.8 | 0.1 | 0.1 | 0.0 | 1.1 | 3.7 | 6.3 | 1.2 | |
| IOHeavy Scan | 100 | 63.1 | 52.6 | 30.7 | 82.5 | 0.0 | 15.2 | 0.0 | 40.0 | 50.0 | 8.8 | 2.5 | 1.9 | 0.8 | 0.1 | 0.0 | 0.0 | 0.0 | 0.3 | 1.3 | 0.9 |
| 1000 | 42.2 | 149.0 | 51.9 | 72.2 | 15.1 | 30.0 | 30.0 | 40.0 | 50.1 | 8.7 | 2.5 | 2.0 | 0.9 | 0.0 | 0.1 | 0.0 | 0.5 | 0.8 | 10.1 | 9.7 | |
| 10000 | 52.6 | 191.7 | 30.3 | 112.7 | 14.9 | 78.3 | 1.2 | 2.8 | 51.0 | 9.5 | 2.8 | 2.5 | 0.9 | 0.1 | 0.1 | 0.0 | 4.1 | 6.7 | 119.6 | 35.5 | |
| Analytics Q1 | 1000 | 1.2 | 2.0 | 10.5 | 14.2 | 0.0 | 0.0 | 0.3 | 2.3 | 51.1 | 14.0 | 2.8 | 2.5 | 1.3 | 1.4 | 0.0 | 0.2 | 16.3 | 36.9 | 34.8 | 28.1 |
| Analytics Q2 | 1000 | 1.2 | 1.9 | 10.2 | 14.6 | 0.0 | 0.0 | 0.2 | 1.4 | 49.5 | 14.4 | 2.7 | 2.5 | 1.7 | 1.1 | 0.0 | 0.1 | 17.1 | 36.0 | 35.7 | 27.8 |
| Analytics Q3 | 1000 | 0.5 | 0.7 | 1.8 | 4.0 | 0.0 | 0.0 | 0.1 | 0.0 | 50.3 | 13.5 | 4.6 | 2.9 | 1.7 | 2.3 | 0.1 | 0.0 | 42.1 | 102.8 | 108.5 | 85.0 |
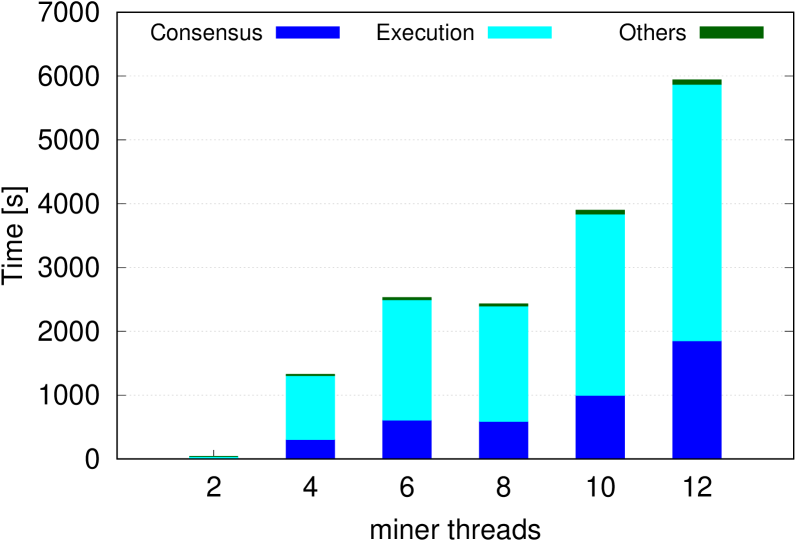
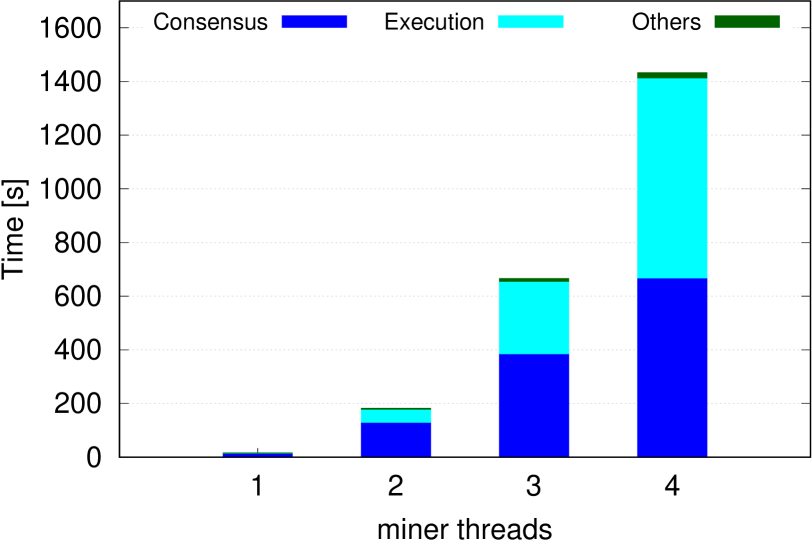
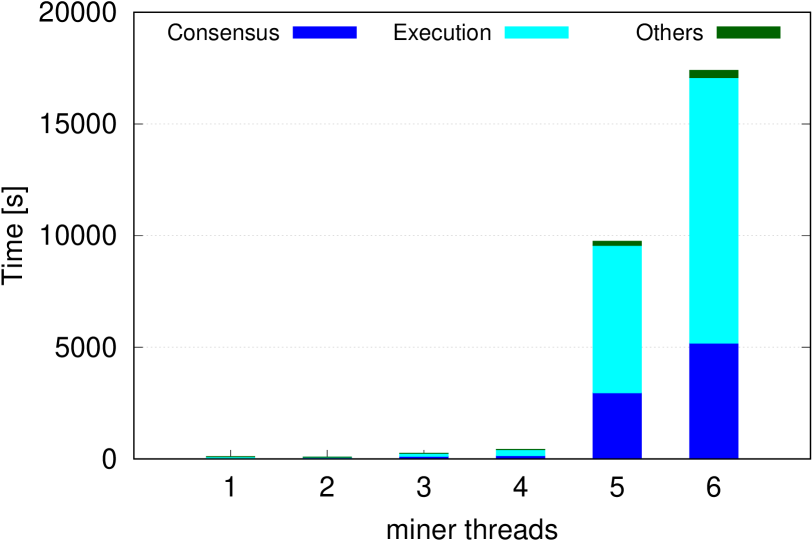
Figure 4 shows a super-linear increase in the execution time of
go-ethereum (geth) v1.8.15 with increasing number of miner threads on
three systems under evaluation. Recall that RP3 is unable to run Ethereum. To
investigate the cause of high execution time with more miner threads, we split
break down execution time to three components as described in
BLOCKBENCH [11]. We profiled geth with Go
pprof and analyzing both the callgraph and the cumulative execution
time per routine. From our analysis, the consensus starts with the call of
go-ethereum/consensus/ethash.
(*Ethash).Seal.func1, while the
execution starts with the invocation,
go-ethereum/core/vm.(*EVMInterpreter).Run. The remaining time is spent
at application layer and data layer of the blockchain stack. We observed that
execution takes longer as the number of miner threads increase. This would
suggest that EVM is inefficient when more miner threads are used.
We observed high variations among the executions of the same benchmark with the same number of miner threads. Table 3 shows five executions of CPUHeavy on NUC with four miner threads. The high variations are visible in go-ethereum releases starting from v1.8.14. Previous releases, including v1.4.18 used by BLOCKBENCH [11], exhibit relatively stable execution. We found that starting with go-ethereum v1.8.14 a transaction is started, or applied, multiple times and that this number is inconsistent among different runs. For example, a CPUHeavy transaction is applied as few as and as many as times in go-ethereum v1.8.14. This is explained by the fact that go-ethereum v1.8.14 underwent a significant design change. Specifically, whenever a miner thread receives a new block, it discards any transactions currently being executed and applies the transactions in the newly received block. In our case, there is a single transaction, and during its execution the miners keep generating empty blocks. As a result, the probability of receiving a block during the transaction execution increases with the number of miners. Therefore, the transaction is interrupted and restarted many times. As we shall see in the next section, the same results hold for the cluster setting and for non-CPU heavy workloads.
We note that this design works well when a newly received block contains updates to states currently used by the transaction being executed. In this case, it saves time to stop and restart the current transaction until after the new block is applied. However, interrupting transactions even when receiving empty block results in unnecessary overhead. A more elegant approach is to restart only transactions whose states are affected by the new block.
In summary, we make the following observation concerning Ethereum execution.
Observation 3
In the latest versions of Ethereum, (i) execution time increases with the number of miner threads and (ii) there is high execution time variation among different runs of the same workload, especially when the workload is computation heavy or when more miner threads are used. These are due to new transaction restarting mechanism which restarts execution when receiving a new block, even if that block is empty.
Time-energy performance. The time, power and PPR of Ethereum runnign with one miner thread are shown in Table 4. Across systems, we observe the same pattern as that of Hyperledger. In other words, Observation 2 holds. Even if TX2 exhibits the highest execution time in general, its energy usage is the lowest and, thus, its PPR is the highest. For example, the IOHeavy Scan benchmark with key-value pairs is slower on TX2, but uses less energy than Xeon.
As expected, Ethereum uses more power than Hyperledger. In particular, for sorting M values, Xeon, NUC and TX2 use 50.6W, 9W and 2.4W, respectively, in Hyperledger, as opposed to 81W, 17W and 5W, respectively, in Ethereum. There are two reasons for this behavior. First, Ethereum use more cryptographic operations which incur high CPU utilization. Second, Ethereum uses EVM, an interpreted execution environment which is less efficient than Hyperledger’s Docker execution. Consequently, the CPU performs more work in Ethereum.
Our evaluation demonstrates high variability, especially for IOHeavy operations, as indicated by the high standard deviation in Table 4. Execution profiling of IOHeavy Write shows that much of the time is spent in the EVM interpreter. For example, the writing of key-value pairs on Xeon spends of the time inside EVM interpreter, while sorting one million numbers spends only in the same routine. The root cause is the same as for running multiple miner threads, namely, the transaction is restarted multiple times until it manages to finish. Transactions that perform more work and take longer to finish, have higher chances to be restarted and, thus, take even longer to finish under geth v1.8.15. For example, an execution of sorting one million numbers on Xeon finishes in 9s and restarts the transaction 2 times. In contrast, the execution of IOHeavy Write of key-value pairs finishes in 458s and is restarted 63 times.
We note that we were unable to run CPUHeavy with input size of M and M. While BLOCKBENCH paper [11] reports execution times for Ethereum CPUHeavy on M input, in our experiments the clients never finish the execution.
4.3 Parity
The time-power results for Parity are presented in Table 5. Unlike Ethereum, Parity is able to run on the wimpy RP3 system. On the other hand, all systems are not able to run the CPUHeavy workload with M input.
Recall that RP3 is slower than TX2 for Hyperledger. This gap is much bigger for Parity. In particular, RP3 is slower than TX2 when running CPUHeavy with M input. Our profiling using Linux perf shows that RP3 spends significant time in libarmmem.so which is a library for memory operations for ARM-based systems. This, together with a low CPU utilization of 10%, suggest that memory is the main bottleneck of Parity execution on RP3. In contrast, the other systems spend most of the time in the execution layer, i.e., inside EVM interpreter.
The variability in execution time among different runs is less visible in Parity compared to Ethereum. Table 5 shows high standard deviations only for IOHeavy workloads with small input size. We attribute this to the memory hierarchy, especially to CPU caches and memory buffers that need time to warm-up and may exhibit unpredictable behavior on shorter executions. Indeed, CPUHeavy and Analytics do not exhibit execution time variability. The former is not memory or I/O intensive. The latter includes an initialization step that warms up the caches and memory buffers.
As expected, the power consumption of Parity is lower compared to Ethereum, but higher when compared to Hyperledger. Taking CPUHeavy workload as example, Xeon, NUC and TX2 use 57.6W, 12.7W and 3.6W, respectively, to sort one million values in Parity. For the same amount of work, Ethereum consumes 81W, 17W, and 5W on Xeon, NUC and TX2, respectively, while Hyperledger consumes 50.6W, 9W and 2.4W, respectively. This behavior can be explained by the lower power overhead of Parity’s PoA consensus protocol compared to Ethereum’s PoW. Parity also has an interpreted EVM which is not as efficient as Hyperledger’s Docker execution engine, and which draws additional power.
Observation 2 holds also for Parity. In particular, Xeon and NUC are the fastest systems, while TX2 uses the smallest amount of energy due to its shorter execution than RP3 and lower power usage than Xeon and NUC.
4.4 Impact of Storage Subsystem
In this section, we analyze the impact of different types of storage subsystems on blockchain performance using the IOHeavy benchmarks. We select the TX2 system which has interfaces for SD card, SATA storage and USB3 devices. While the baseline is the system with a 64GB SD card (TX2+SDC), we separately connect a 1TB SSD through SATA (TX2+SSD) and an external 2TB HDD through USB3 (TX2+HDD). The SD card stores the OS in both TX2+SSD and TX2+HDD.
We first measure the IO performance in terms of raw read/write throughput and latency. Then, we measure the performance of IOHeavy benchmarks in Hyperledger and Parity. Ethereum is not included in this analysis because of its unpredictable behaviour, as discussed in Section 4.2. In addition, we evaluate the impact of storage on the total power by measuring the idle power when the hardware is running only the OS, and the active power during blockchain execution. The results are summarized in Table 6.
| Metric | System | ||
|---|---|---|---|
| TX2+SDC | TX2+SSD | TX2+HDD | |
| Idle System Power [W] | 2.4 | 2.9 | 5.9 |
| Write Throughput [MB/s] | 16.3 | 206.0 | 87.6 |
| Read Throughput [MB/s] | 88.9 | 277.0 | 93.4 |
| Write Latency [ms] | 17.1 | 2.8 | 13.7 |
| Read Latency [ms] | 2.8 | 1.8 | 1.2 |
| IOHeavy Write (10000) | |||
| Hyperledger Time [s] | 18.2 | 22.4 | 24.0 |
| Parity Time [s] | 380.7 | 382.8 | 386.2 |
| Hyperledger Power [W] | 7.2 | 7.7 | 10.0 |
| Parity Power [W] | 4.2 | 4.8 | 7.7 |
| IOHeavy Scan (10000) | |||
| Hyperledger Time [s] | 28.8 | 31.7 | 29.8 |
| Parity Time [s] | 30.3 | 32.5 | 43.1 |
| Hyperledger Power [W] | 3.1 | 3.6 | 6.6 |
| Parity Power [W] | 2.8 | 3.3 | 6.4 |
In terms of raw performance, the SSD is the clear winner. It has almost higher write throughput and higher read throughput than SD card, while adding only 0.5W to the idle power. In contrast, the HDD adds 3.5W to the idle power, thus increasing it by . The HDD has more than higher write throughput but similar read throughput compared to TX2+SDC.
Interestingly, Jetson with SD card exhibits slightly better execution time when running the IOHeavy. We attribute this to the fact that the SD card stores the OS, libraries and Docker containers in all three configurations, including the TX2+SSD and TX2+HDD. Hence, the ledger storage subsystem is not a bottleneck, otherwise, TX2+SDC would exhibit higher execution time due to its lower raw throughput and higher latency. In fact, our profiling of IOHeavy Write shows that write operations are sparse, with an average of 1MB/s and a peak of 21.5MB/s across all subsystems. These values are within the capabilities of all storage subsystems, but switching between the execution context of the SD card and the ledger storage may induce overhead.
In terms of power, we observe that IOHeavy Scan adds only 0.7W and 0.4W to the idle power off all system configurations for Hyperledger and Parity, respectively. IOHeavy Write uses more power, adding between 4.1W and 4.8W for Hyperledger and around 1.8W for Parity. These results are stable, in general. The only notable exception is IOHeavy Scan in Parity on the TX2+HDD which, in general, finishes in 32.5s, but in some cases it finishes in s or s.
In summary, we make the following observation.
Observation 4
Wimpy nodes can accommodate conventional storage subsystems of large capacity, therefore they can store large ledgers. The storage subsystem type does not significantly affect the I/O performance of Hyperledger and Parity.
4.5 Bootstrapping Performance
In this section, we analyze the performance of bootstrapping which is the process of joining a blockchain network and synchronizing the distributed ledger. We consider one node that joins an existing network of seven other nodes of the same type. Prior to the bootstrapping process, we generate over blocks by running the YCSB workload on the 8-node blockchain network. We then stop one node, delete its ledger and caches, and restart it so that it synchronizes the ledger with other nodes.
Hyperledger v0.6 adopts a lazy bootstrapping approach where the synchronization is started when new transactions are submitted. Hence, the execution time and power of synchronization and of transaction cannot be clearly separated. Here, we report the time taken by Hyperledger to update its block tip to a certain value. To synchronize around blocks, Hyperledger on Xeon takes s while using 51.25W. Interestingly, TX2 is faster than Xeon: it takes less than s while using up to 3W. We attribute this to networking setup. In particular, the Xeon cluster runs on NFS which adds some overhead. We note that both systems use a relatively low power compared to their peak power. This is because the blocks are downloaded from the other peers without executing all transactions.
Ethereum supports three bootstrapping modes, fast, full and light [13]. In light mode, which is intended for wimpy systems, only the current state is downloaded from other peers. In fast and full mode, all blocks are downloaded. However, only in full mode are all the transactions applied, which means it is slower than fast mode. In our experiments, we do not consider light mode because it is very fast on both wimpy and brawny nodes. Ethereum takes s and s to synchronize around blocks in fast and full mode on Xeon, respectively, while using 120W. On TX2, it takes s and 6.7W to synchronize in full mode, and only s and 6W to synchronize in fast mode.
By default, Parity uses fast (or warp) synchronization which skips “almost all of the block processing” [12]. However, we observed that synchronizing the ledger in Parity takes much longer than Ethereum, even when warp syncing is on. In particular, synchronizing blocks in Parity takes over 4 hours on Xeon and over 3 hours on TX2, whereas in Ethereum it takes s and s on Xeon and TX2, respectively. This is a well-known issue in Parity444For example, users report on StackExchange that synchronizing with the main network in 2018 took few days (https://bit.ly/2UvIR1g), with some users blaming the I/O subsystem. But our profiling shows that the peak I/O write rate is around 1MB/s which is much lower than the available throughput of the storage system. Moreover, the power during Parity’s synchronization is close to the idle power: 51W and 2.4W on Xeon and TX2, respectively. This shows that Parity is not doing much work during the synchronization process. We therefore conclude that the synchronization inefficiency lies in Parity’s implementation rather than in the hardware.
5 Cluster Analysis
In this section, we analyze the time-energy performance of blockchains on a cluster. We consider both homogeneous consisting of nodes of the same type, and heterogeneous cluster consisting of multiple types of nodes.
5.1 Homogeneous Cluster
We consider Xeon-only and TX2-only clusters. The former is the faster, the latter the most energy efficient. We vary the cluster size from to nodes. The clients that issues requests run on separate nodes, and unlike the analysis in [21], they are not included in our performance evaluation. Our main focus is on the blockchain nodes.
5.1.1 Impact of request rate
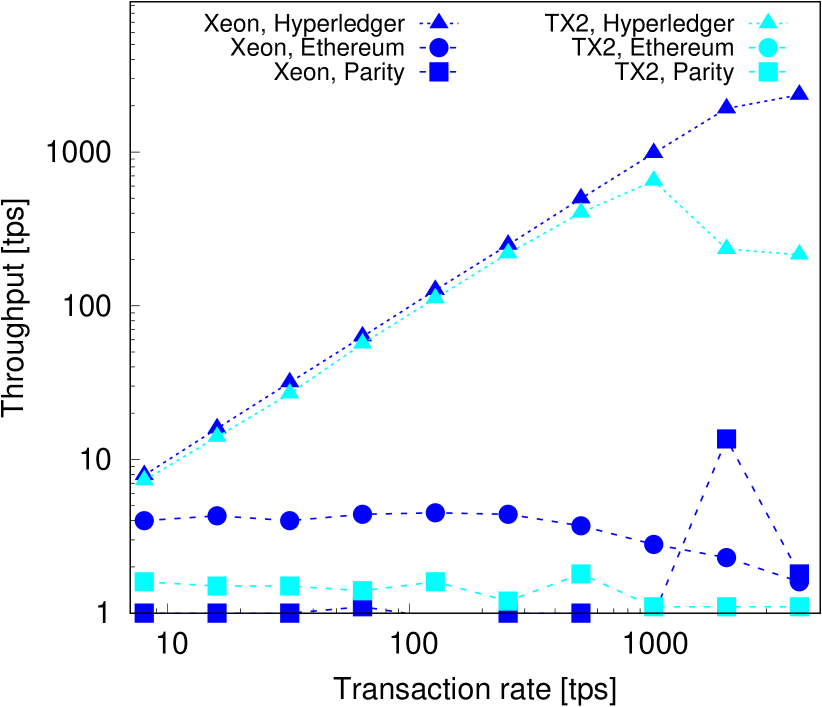
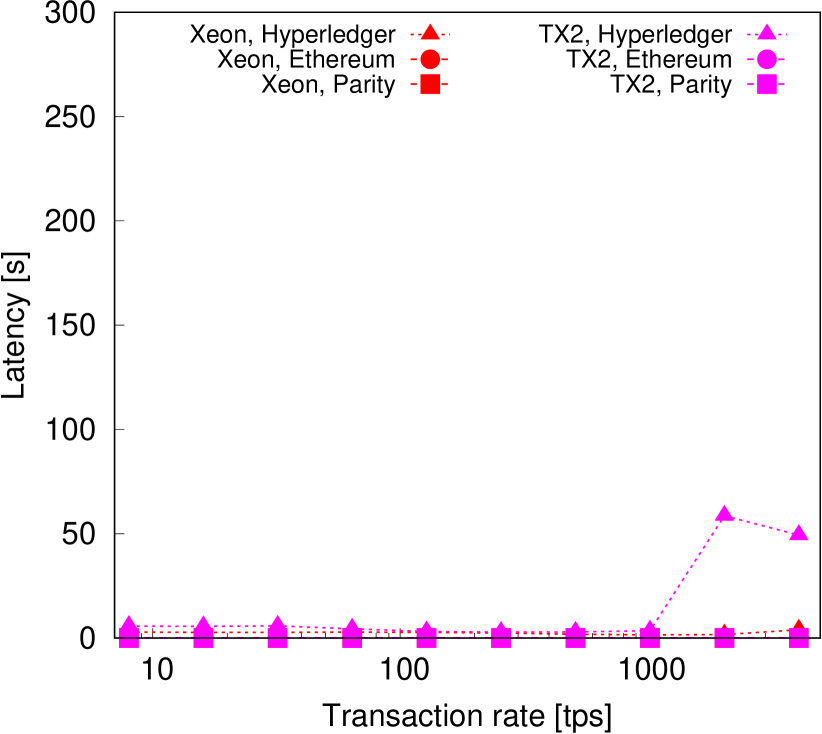
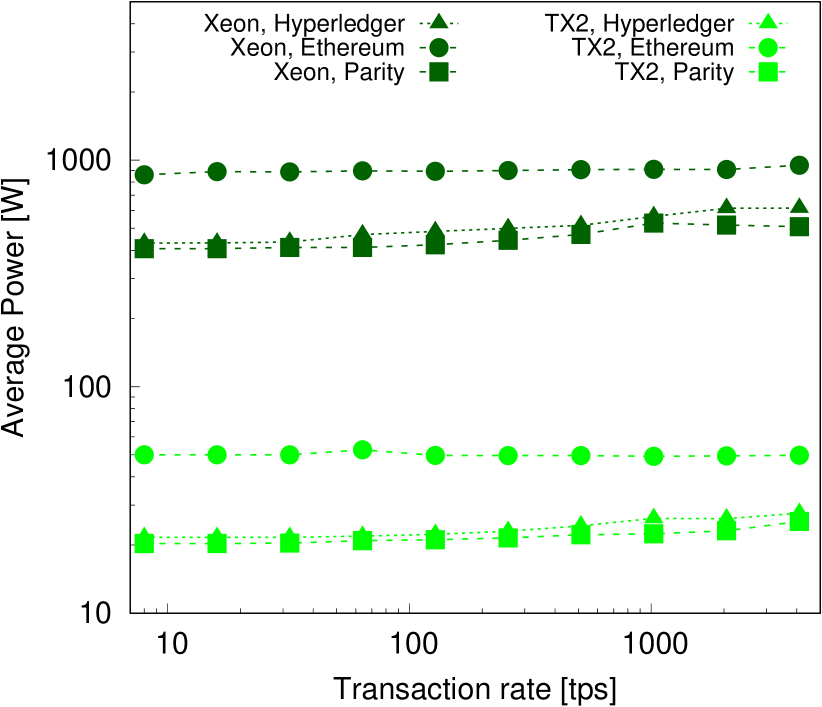
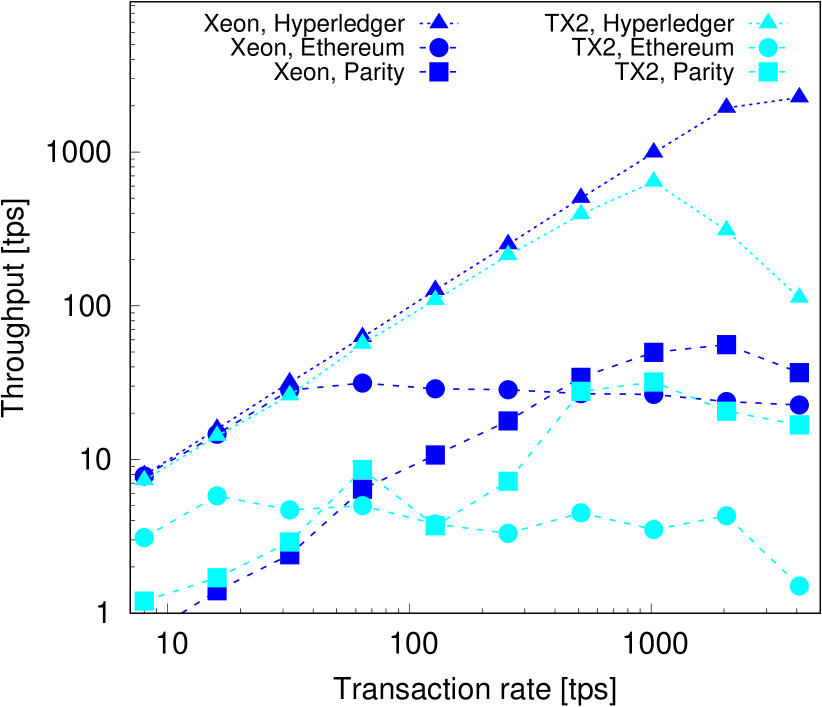
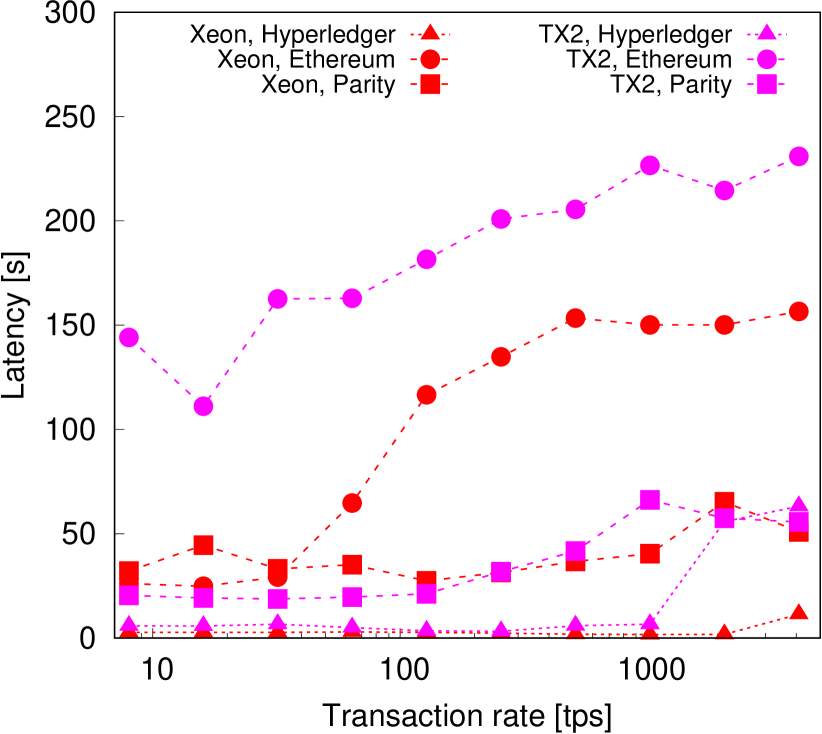
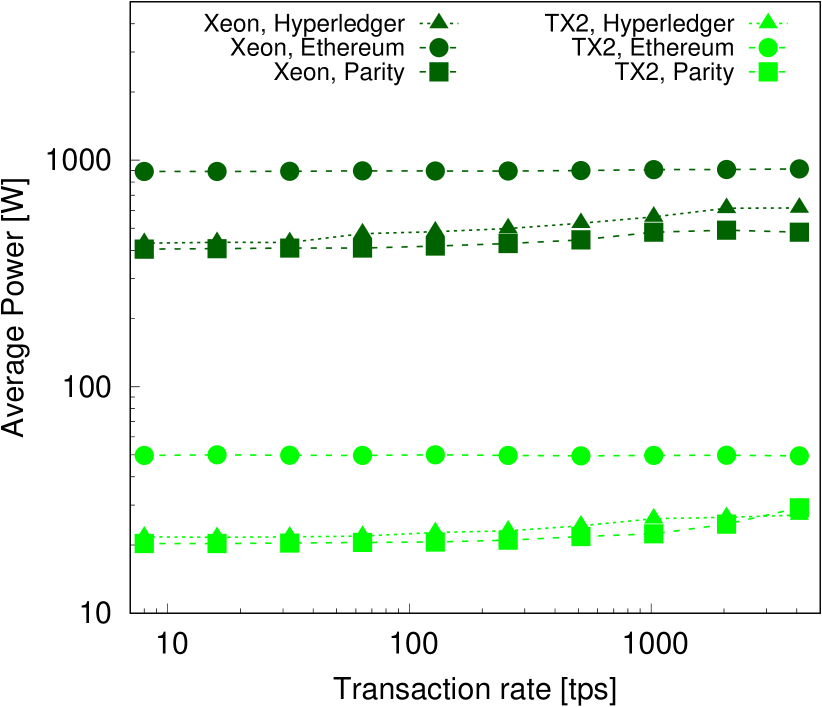
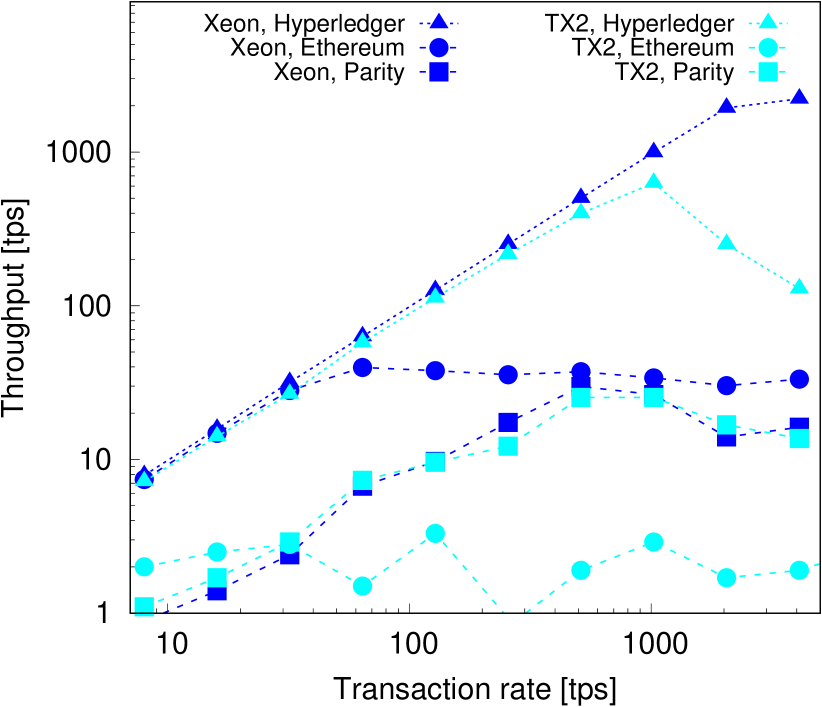
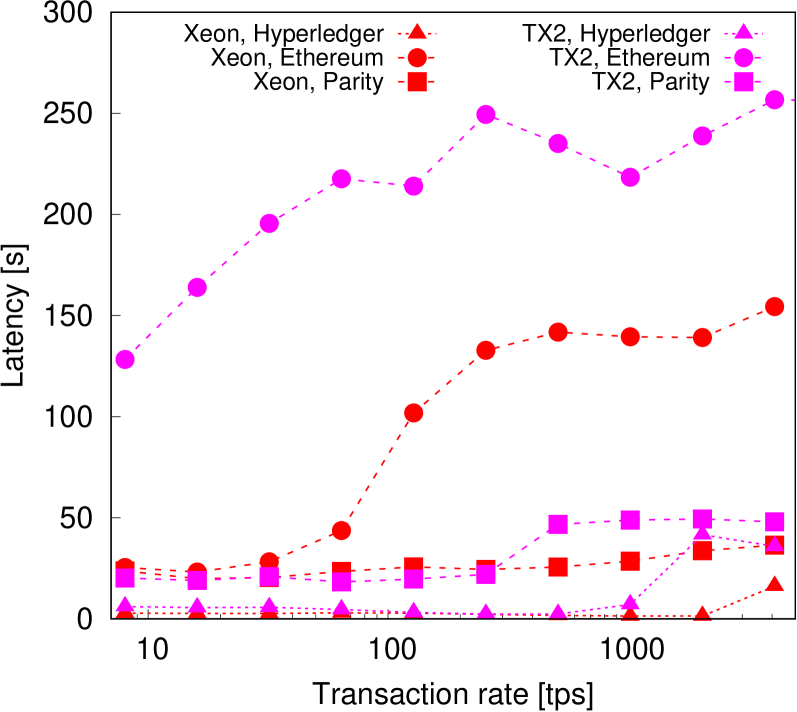
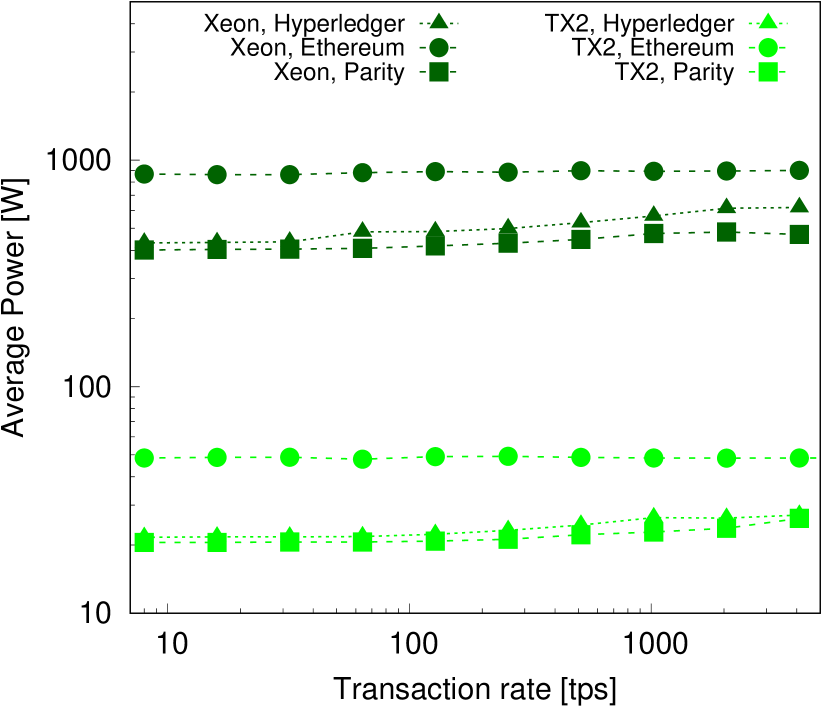
We first examine the throughput, latency and power usage with increasing request rate. We fix the cluster size to nodes, and use to send transactions. We increase the transaction rate from to transactions per second (tps). The results, depicted in Figure 5 for the YCSB benchmark, show that Hyperledger is able to sustain a throughput of up to tps and tps on Xeon and TX2, respectively. Ethereum achieves a throughput of up to tps and only tps on Xeon and TX2, respectively. Parity achieves a maximum throughput of tps and tps on Xeon and TX2, respectively, when the client request rate is 512tps. Similar patterns are observed when running Smallbank and Donothing benchmarks.
To achieve peak throughput, Hyperledger uses 618W on Xeon and only 26.4W on TX2. Parity uses even less power, ranging between 400W and 480W on Xeon, and between 20W and 26W on TX2. In contrast, Ethereum uses the most power, between 860W and 900W on Xeon and around 49W on TX2.
These results can be summarized in the following observation.
Observation 5
Higher-end wimpy nodes, such as Jetson TX2, achieve around one-third of Hyperledger throughput and almost the same performance for Parity compared to brawny Xeon nodes, while using to less power. These nodes have potential of achieving significant power and cost savings.
Standard deviation is relatively low in most of the cases, with the highest outliers being the latency under high request rates. In particular, Hyperledger’s latency exhibits a standard deviation of % and % on Xeon with tps and TX2 with tps request rate, respectively. For throughput, the maximum standard deviation is for Ethereum on TX2 and for Parity on Xeon. Power consumptions have low standard deviation: below on Xeon and on TX2.
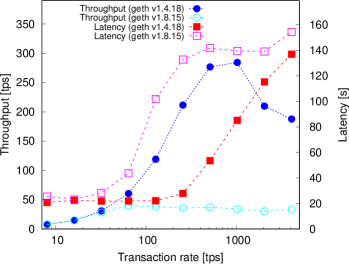
Ethereum execution on TX2 is irregular, as shown in Figure 5, and has higher standard deviation compared to the other two blockchains. Moreover, Ethereum throughput is much lower and its latency is higher when using version v1.8.15 compared to v1.4.18 evaluated in BLOCKBENCH [11]. As shown in Figure 7 for YCSB, v1.4.18 achieves a maximum of tps for a transaction request rate of tps, while v1.8.15 achieves only tps. The increase in latency is relatively smaller, with maximum latencies of and seconds for v1.4.18 and v1.8.15, respectively.
We note that the higher throughput reported for v1.4.18 is attributed to (i) different parameter settings, and more fundamentally to (ii) a design change in Ethereum. First, there are changes in gas values in the newer versions. This requires to increase the gas value to in order to run YCSB benchmark on v1.8.15. Second, a transaction may be restarted multiple times in v1.8.15, as discussed in Section 4.2.
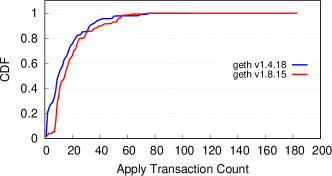
To understand the second factor contributing to the low throughput, we profile the code to record the number of times an unique transaction, as represented by its hash, is restarted, or applied. Even though the average number of times a transaction is applied is similar, which is 20 times, we observed that a higher number of unique transactions are executed by geth v1.4.18 than by geth v1.8.15. These unique transactions are reflected in the throughput. Furthermore, transactions are restarted more often in geth v1.8.15, as shown in Figure 8. The maximum number of restarts in v1.8.15 is much higher than v1.4.18, namely times versus times.
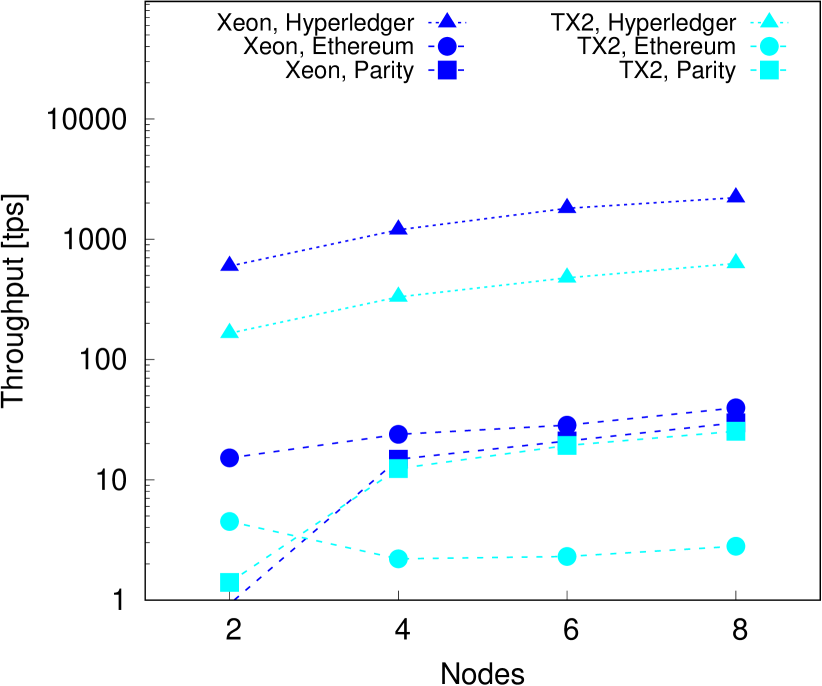
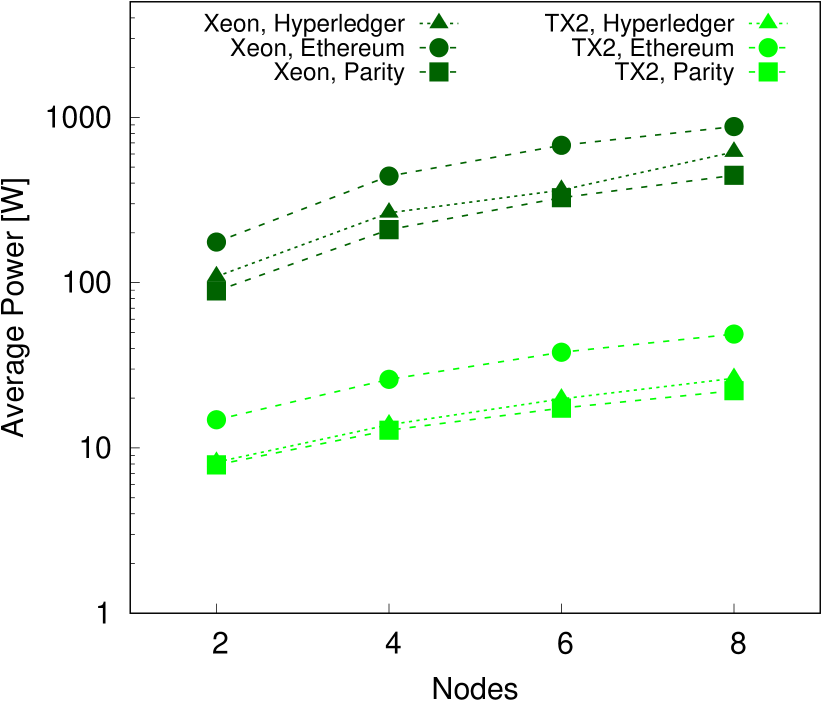
5.1.2 Impact of network size
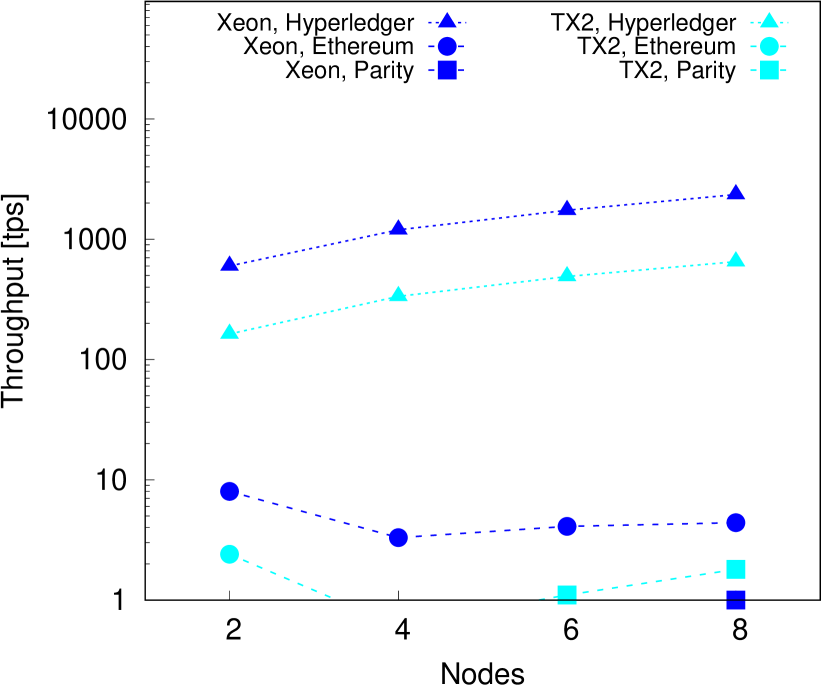
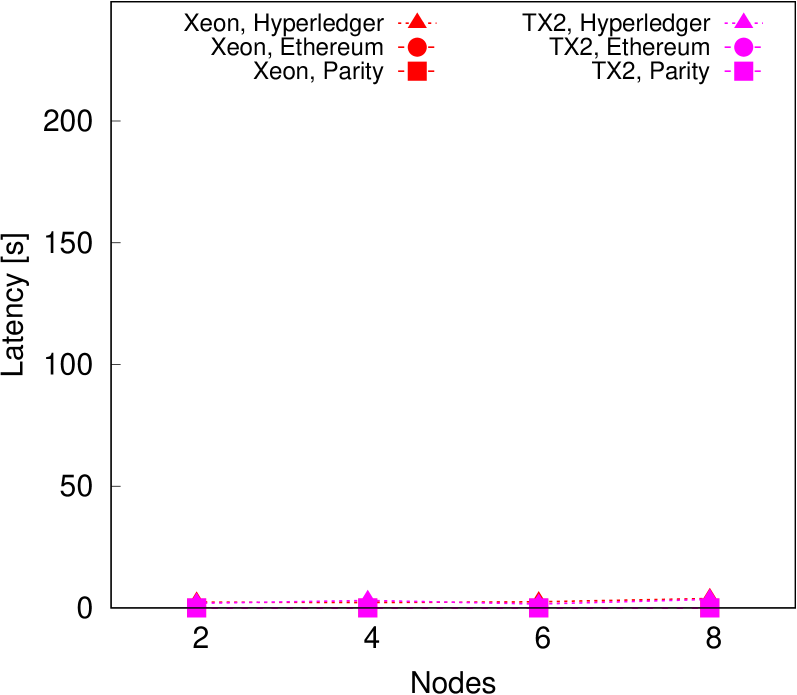
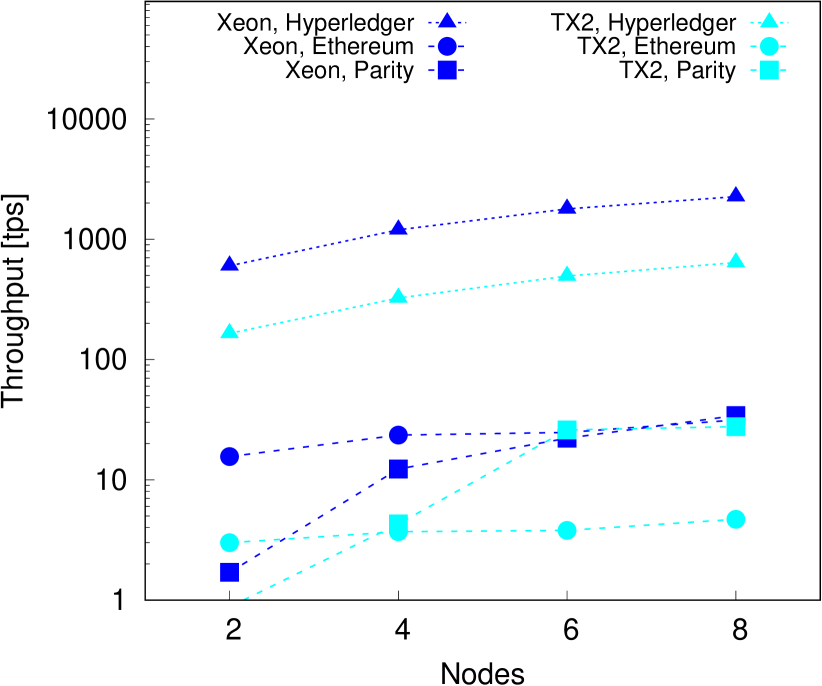
Next, we examine the scalability with increasing number of blockchain nodes and clients. We use the same number of clients as the number of nodes. We choose a request rate that saturates the systems, as identified in the previous section. In particular, for Xeon we set the rate per client node to , and tps for Hyperledger, Ethereum and Parity, respectively. On TX2, we set the rate per client to , and tps.
Figure 6 shows the throughput for YCSB with increasing number of nodes. We attribute the fluctuations of Ethereum on TX2 to the non-deterministic transaction restarting mechanism. The lower throughput, when compared to Xeon, is due to the compute-intensive PoW consensus protocol. In fact, the power usage of Ethereum is higher than Hyperledger and Parity on TX2. Specifically, TX2 nodes use, on average, 37.9W, 19.8W and 17.4W when running Ethereum, Hyperledger and Parity, respectively.
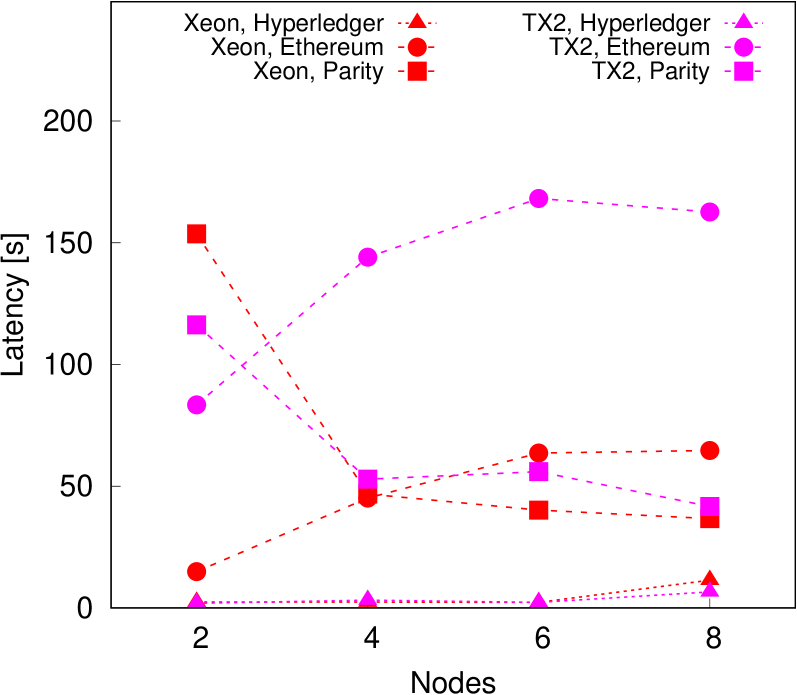
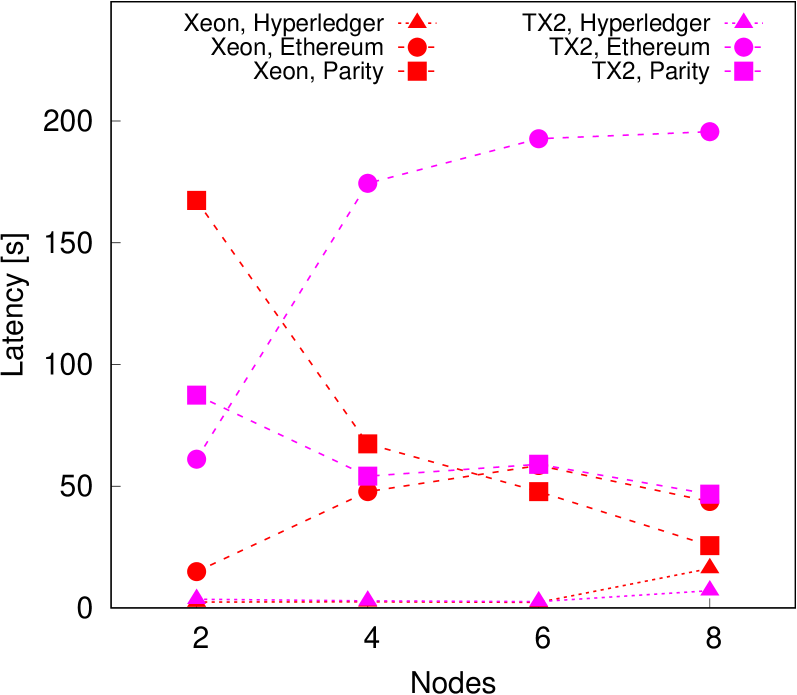
The latency of Ethereum increases significantly on TX2, from 46.7s on nodes to 195.6s on nodes. This is higher than the latency on Xeon nodes. On the other hand, Parity’s latency decreases with the number of nodes: from s on nodes to s on nodes. In summary, Ethereum is virtually unusable on wimpy systems due to (i) low throughput and high latency caused by PoW consensus, and (ii) unstable performance due to transaction restarting.
5.2 Heterogeneous Cluster
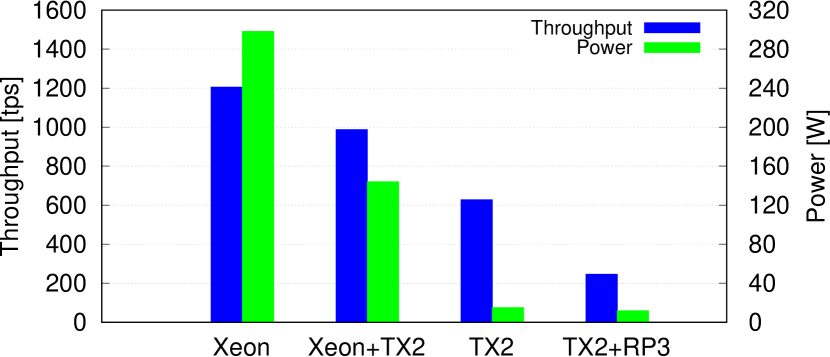
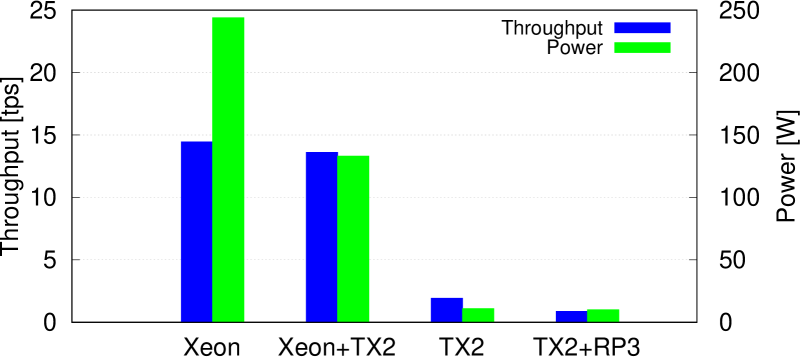
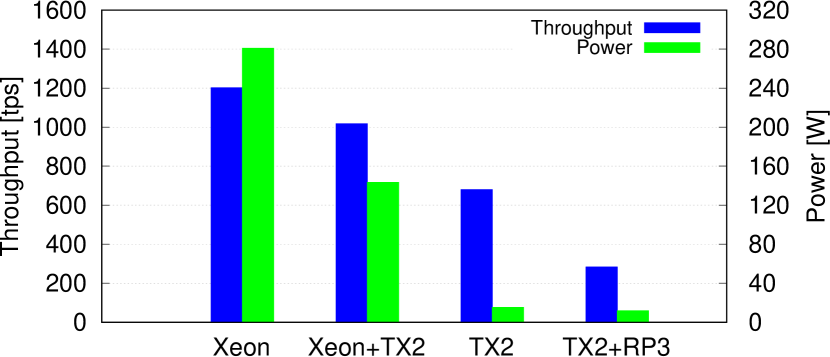
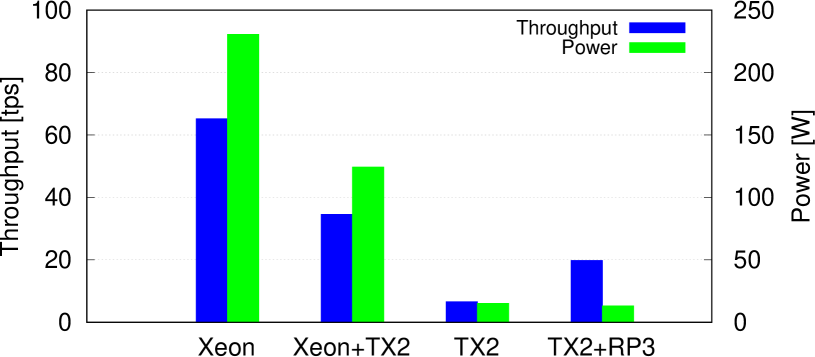
In this section we examine the effects of heterogeneous nodes on the overall blockchain performance. The baselines of homogeneous clusters are represented by (i) Xeon nodes and (ii) TX2 nodes. From the homogeneous Xeon cluster, we replace two nodes with TX2 (Xeon+TX2); from the homogeneous TX2 cluster we replace two nodes with RP3 (TX2+RP3). We run the distributed benchmarks for Hyperledger and Parity. Ethereum is left out because it cannot be run on RP3.
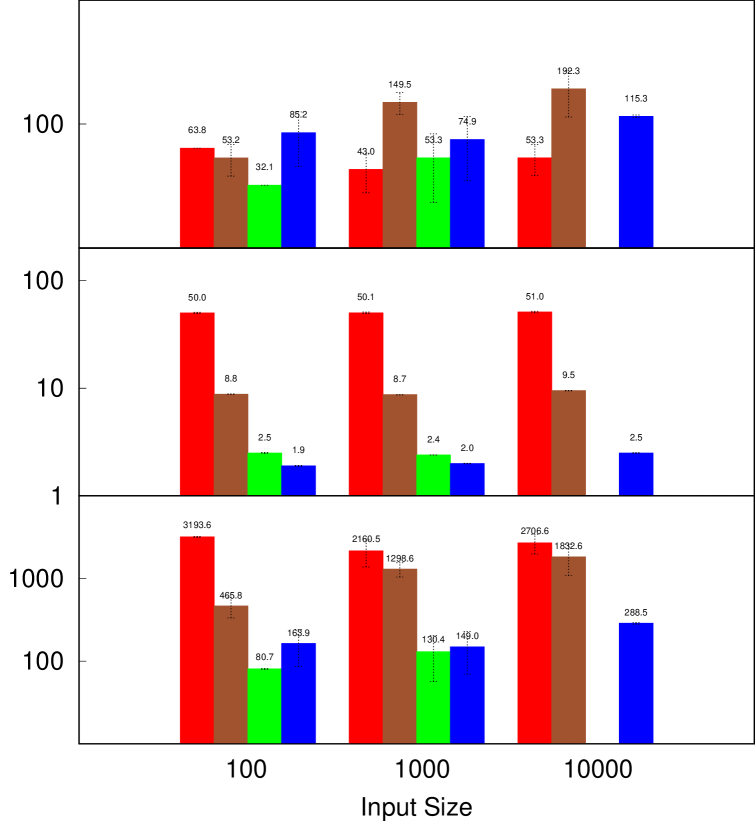
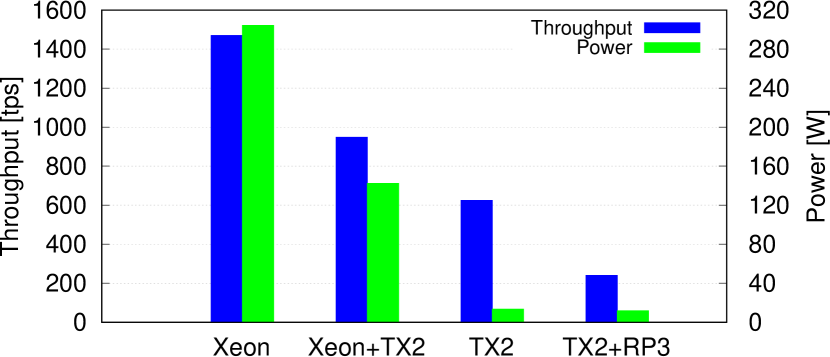
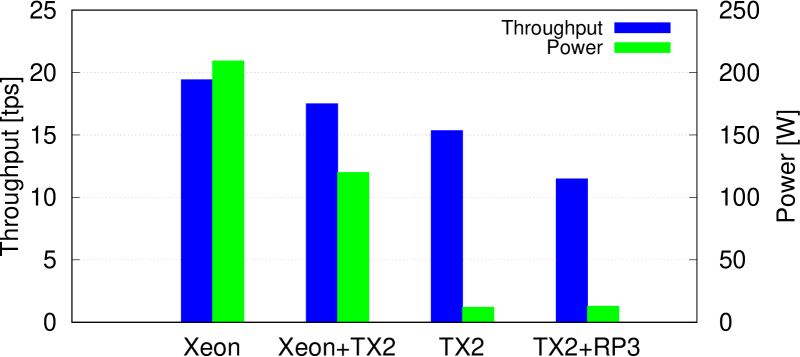
As shown in Figure 9 for the peak throughput of YCSB, the performance degrades when lower-performance nodes are introduced. But the power consumption improves because the heterogeneous cluster uses less power. In particular, Xeon+TX2 has a performance drop of 35% but uses 53% less power than the homogeneous Xeon cluster, when running Hyperledger. The results are better for Parity, where a power savings causes only loss of throughput. However, adding RP3 nodes to a TX2 cluster does not yield satisfactory results. For Hyperledger, the throughput drops 62%, while the power decreases only slightly from 13.4W to 11.8W (or only 12% power savings). For Parity, the power consumption of the heterogeneous cluster is even higher than the homogeneous cluster, 12.8W versus 12W, while the throughput drops from tps to tps.
Similar to the analysis of homogeneous clusters, the results here demonstrate that higher-end wimpy nodes have the potential of reducing power usage, while achieving reasonable performance. However, heterogeneous clusters with wimpy nodes may not always achieve the best PPR. More specifically, if the performance gap between different types of nodes is too large, the low-power profile of the wimpy nodes does not lead to better energy efficiency due to lower throughput and increasing latency.
6 Conclusions
In this paper, we performed an extensive time-energy analysis of representative blockchain workloads on low-power, wimpy nodes in comparison with traditional brawny nodes. The wimpy nodes used in our analysis cover the low-end and high-end performance spectrum, and both x86/64 and ARM architectures.
We found that higher-end wimpy nodes achieve reasonable performance with significantly lower energy than brawny nodes. In particular, a Jetson TX2 cluster with eight nodes achieves more than 80% and almost 30% of Parity and Hyperledger throughput, respectively, while using and less power, respectively, than an 8-node Xeon cluster.
We also found that wimpy nodes with well-balanced PPR achieve higher energy efficiency compared to extremely low-power nodes. For example, a TX2 is more energy efficient than a Raspberry Pi 3, even though the former has an idle power of 2.4W and a peak power of more than 10W, while the latter has 2W and 5W, respectively. The better energy efficiency of TX2 compared to RP3 is due to its higher performance while keeping a low power profile at subsystem level, including the CPU, memory and storage.
Finally, we found that recent versions of Ethereum suffer from low and unstable performance. It is due to the transaction restarting mechanism that stops and discards transaction execution whenever new blocks are received, even if those blocks are empty. This fact, together with the high cost of the PoW consensus protocol, make Ethereum unusable on wimpy nodes.
References
- [1] Raspberry Pi 3 Model B. http://bit.ly/1WTq1N4, 2016.
- [2] Intel® NUC Kit NUC7i3BNH. http://www.webcitation.org/74GPLkSah, 2017.
- [3] Ubuntu Docs - What is swappiness and how do I change it? http://www.webcitation.org/76QeVALC9, 2018.
- [4] ARM. ARM Announces Support For EEMBC CoreMark Benchmark. http://www.webcitation.org/6RPwNECop, 2009.
- [5] L. A. Barroso, J. Clidaras, and U. Hoelzle. The Datacenter as a Computer: An Introduction to the Design of Warehouse-Scale Machines, Second Edition. Morgan and Claypool Publishers, 1st edition, 2013.
- [6] T. Blummer. An Introduction to Hyperledger. 2018.
- [7] V. Buterin. A Next-Generation Smart Contract and Decentralized Application Platform. 2013.
- [8] M. Castro and B. Liskov. Practical byzantine fault tolerance. In Proceedings of the Third Symposium on Operating Systems Design and Implementation, OSDI ’99, pages 173–186, Berkeley, CA, USA, 1999. USENIX Association.
- [9] Digiconomist. Bitcoin Energy Consumption Index. http://www.webcitation.org/74GL5jBxg, 2018.
- [10] Digiconomist. Ethereum Energy Consumption Index (beta). http://www.webcitation.org/74GLngHMZ, 2018.
- [11] T. T. A. Dinh, J. Wang, G. Chen, R. Liu, B. C. Ooi, and K.-L. Tan. BLOCKBENCH: A Framework for Analyzing Private Blockchains. In Proc. of 2017 ACM International Conference on Management of Data, pages 1085–1100, 2017.
- [12] P. T. Documentation. Getting Synced. https://wiki.parity.io/Getting-Synced, 2019.
- [13] EtherWorld. Understanding Ethereum Light Node. http://www.webcitation.org/77lSRvuey, 2018.
- [14] D. Franklin. NVIDIA Jetson TX2 Delivers Twice the Intelligence to the Edge. http://www.webcitation.org/73M0i1pIf, 2017.
- [15] V. Gupta and K. Schwan. Brawny vs. Wimpy: Evaluation and Analysis of Modern Workloads on Heterogeneous Processors. In Proc. of 27th International Symposium on Parallel and Distributed Processing Workshops and PhD Forum, pages 74–83, 2013.
- [16] S. Han, Z. Xu, and L. Chen. Jupiter: A Blockchain Platform for Mobile Devices. In Proc. of 34th IEEE International Conference on Data Engineering (ICDE), pages 1649–1652, 2018.
- [17] S. Nakamoto. Bitcoin: A Peer-to-peer Electronic Cash System. 2008.
- [18] Parity.io. Blockchain Infrastructure for the Decentralised Web. 2018.
- [19] S. Pongnumkul, C. Siripanpornchana, and S. Thajchayapong. Performance Analysis of Private Blockchain Platforms in Varying Workloads. In Proc. of 26th International Conference on Computer Communication and Networks, pages 1–6, 2017.
- [20] N. Rajovic, L. Vilanova, C. Villavieja, N. Puzovic, and A. Ramirez. The Low Power Architecture Approach Towards Exascale Computing. Journal of Computational Science, 4(6):439–443, 2013.
- [21] S. Sankaran, S. Sanju, and K. Achuthan. Towards Realistic Energy Profiling of Blockchains for Securing Internet of Things. In Proc. of 38th IEEE International Conference on Distributed Computing Systems, pages 1454–1459, 2018.
- [22] C. Staelin and L. McVoy. lmbench - system benchmarks. http://www.webcitation.org/74EthsKEa, 2018.
- [23] K. Suankaewmanee, D. T. Hoang, D. Niyato, S. Sawadsitang, P. Wang, and Z. Han. Performance Analysis and Application of Mobile Blockchain. In Proc. of International Conference on Computing, Networking and Communications, pages 642–646, 2018.
- [24] B. M. Tudor, Y. M. Teo, and S. See. Understanding Off-Chip Memory Contention of Parallel Programs in Multicore Systems. In Proc. of International Conference on Parallel Processing, pages 602–611, 2011.
- [25] L. van Doorn. Enabling Cloud Workloads Through Innovations in Silicon. http://www.webcitation.org/6t33R0NZg, 2017.
Appendix A Additional Results
Hyperledger on RP3. Figure 10 compares three different runs of Hyperledger with and without explicitly calling Go’s garbage collector on RP3. Figure 10(a) represents the same execution plotted in detail in Figure 3. In almost all cases, Hyperledger with explicit GC invocation uses less memory and is as fast, if not faster, than Hyperledger without explicit GC invocation. On the one hand, the GC incurs more mmap/munmap system calls. On average across our experiments, Hyperledger with explicit GC incurs 70 mmap and 4 munmap calls, respectively, while Hyperledger without GC invocation incurs 50 mmap and 2 munmap calls, respectively.
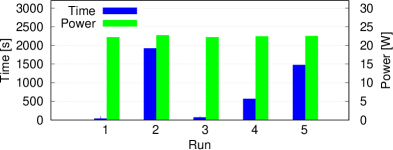
Ethereum. Figure 11 compares the execution time and power usage of different runs of the same CPUHeavy workload on Ethereum with four miner threads, when running on the NUC node. We observe significant execution time differences, while the power is roughly constant at around 23W. Compared to the idle power of 9W and the CoreMark power of 18.6W, Ethereum’s power usage is higher, suggesting that the system is doing heavy work not only at CPU level, but also at memory and I/O.
Table 7 compares the number of times transactions are re-started (applied) in two versions of Ethereum on a cluster setup with varying request rate. We present the minimum, maximum and average times, with standard deviation, across all unique transactions. We also show how many unique transactions are executed and the total number of times ApplyTransaction() method is called.
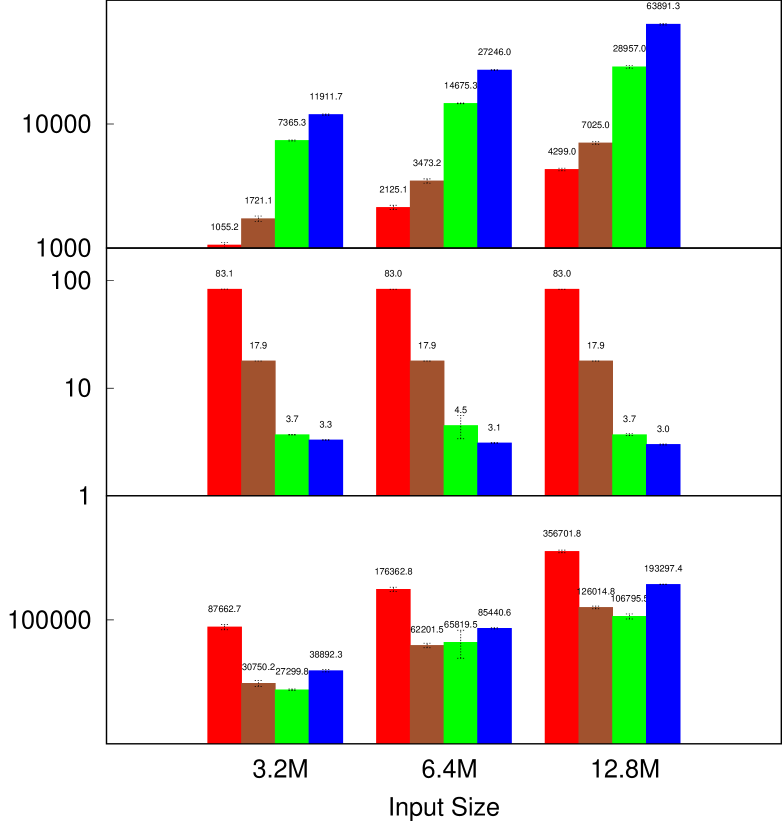
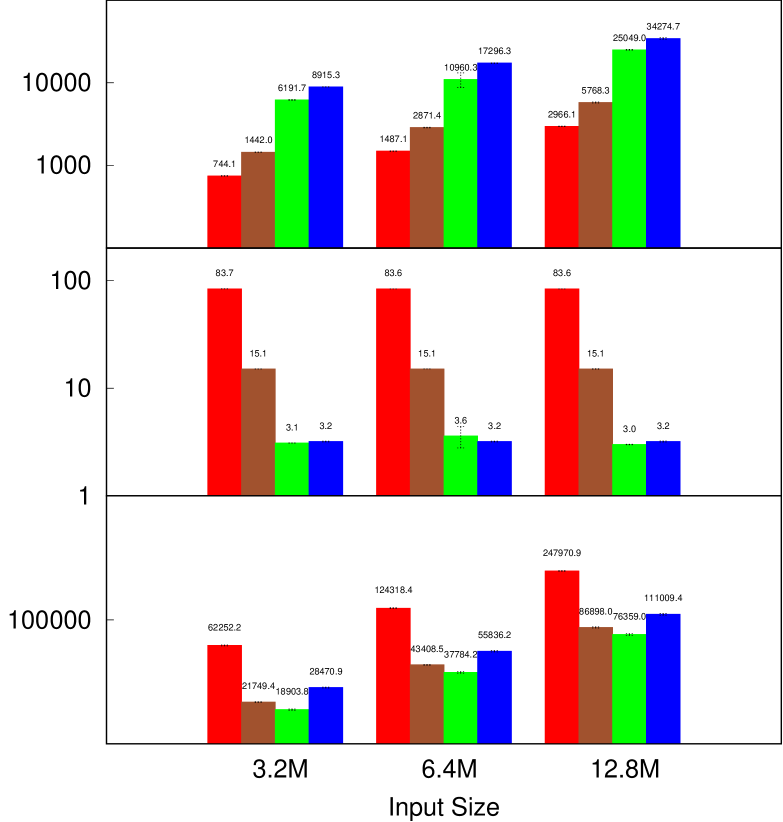
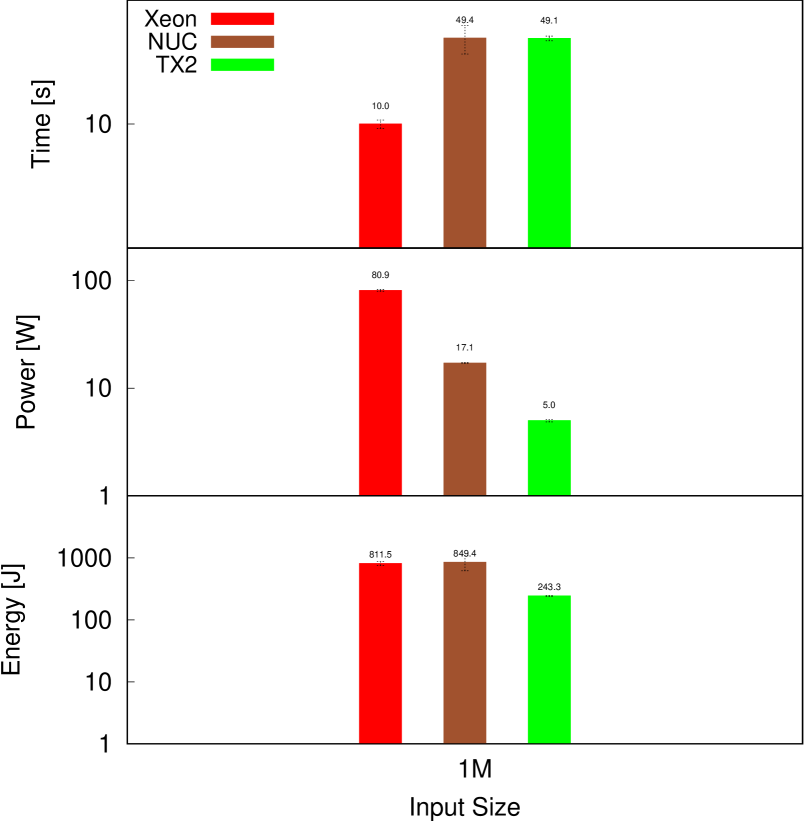
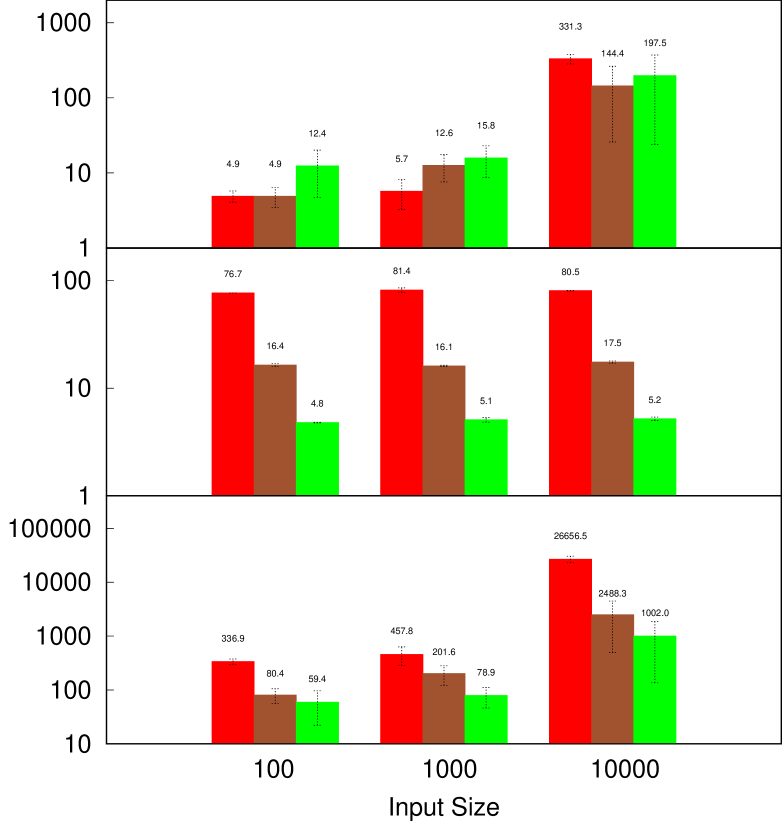
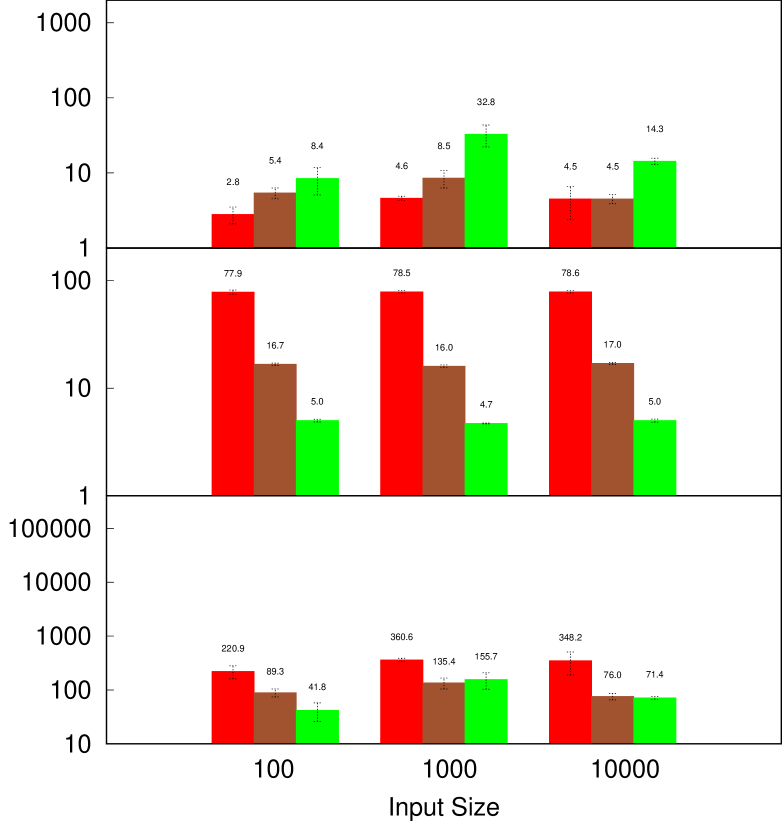
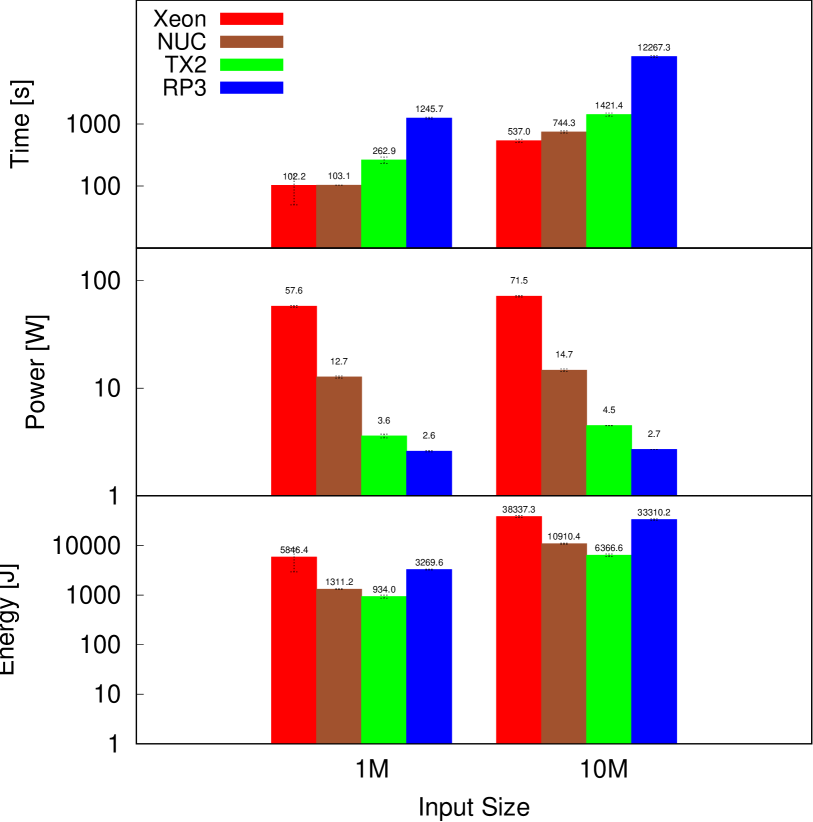
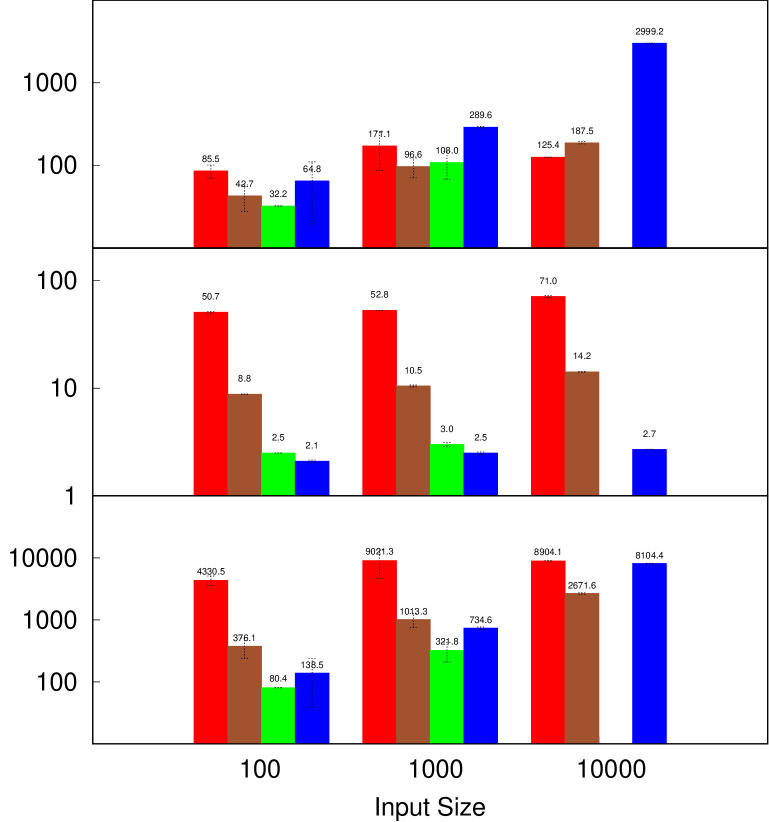
Single-node Time-Power-Energy. Execution time, power usage and total energy of CPUHeavy and IOHeavy workloads are plotted in Figures 12, 13 and 14 for Hyperledger, Ethereum and Parity, respectively.
Cluster Performance. The throughput, latency and power usage of Smallbank and Donothing workloads at cluster level are plotted in Figures 15, 16, 17, 18, 19 and 20. Figures 15 and 16 reflect the performance with varying transaction request rate for Smallbank and Donothing, respectively. Figures 17, 18 show the performance on increasing number of nodes. Figures 19 and 20 show the performance of Smallbank and Donothing, respectively, on heterogeneous clusters, as discussed in Section 5.2.
| geth | Apply | Txn Request Rate [tps] | |||||
|---|---|---|---|---|---|---|---|
| Txn | |||||||
| Count | 64 | 128 | 256 | 512 | 1024 | 2048 | |
| v1.4.18 | Min | 8 | 1 | 1 | 1 | 1 | 1 |
| Max | 71 | 59 | 92 | 106 | 105 | 143 | |
| Average | 29.7 | 27.8 | 22.2 | 19.1 | 14.9 | 13.0 | |
| Std.dev. | 9.8 | 7.6 | 14.4 | 14.6 | 14.3 | 11.8 | |
| Unique | 19,531 | 38,832 | 74,535 | 122,500 | 125,093 | 126,455 | |
| Total | 580,507 | 1,080,921 | 1,653,870 | 2,342,661 | 1,863,023 | 1,641,687 | |
| v1.8.15 | Min | 1 | 1 | 1 | 1 | 1 | 1 |
| Max | 528 | 385 | 497 | 246 | 183 | 114 | |
| Average | 21.0 | 18.4 | 20.8 | 18.8 | 19.4 | 21.1 | |
| Std.dev. | 17.4 | 14.9 | 16.3 | 14.5 | 14.5 | 18.4 | |
| Unique | 10,935 | 12,289 | 10,713 | 10,957 | 10,826 | 10,725 | |
| Total | 229,754 | 226,488 | 222,503 | 206,357 | 209,560 | 226,455 | |