toltxlabel \zexternaldocument*si_final
|
|
Crack formation and self-closing in shrinkable, granular packings† |
| H. Jeremy Cho,a Nancy B. Lu,a Michael P. Howard,b Rebekah A. Adams,a and Sujit S. Datta∗a | |
|
|
Many clays, soils, biological tissues, foods, and coatings are shrinkable, granular materials: they are composed of packed, hydrated grains that shrink when dried. In many cases, these packings crack during drying, critically hindering applications. However, while cracking has been widely studied for bulk gels and packings of non-shrinkable grains, little is known about how packings of shrinkable grains crack. Here, we elucidate how grain shrinkage alters cracking during drying. Using experiments with model shrinkable hydrogel beads, we show that differential shrinkage can dramatically alter crack evolution during drying—in some cases, even causing cracks to spontaneously “self-close". In other cases, packings shrink without cracking or crack irreversibly. We developed both granular and continuum models to quantify the interplay between grain shrinkage, poromechanics, packing size, drying rate, capillarity, and substrate friction on cracking. Guided by the theory, we also found that cracking can be completely altered by varying the spatial profile of drying. Our work elucidates the rich physics underlying cracking in shrinkable, granular packings, and yields new strategies for controlling crack evolution. |
1 Introduction
Hydrated packings of grains often crack when they dry; familiar examples of this phenomenon are cracks in mud and paint. Cracking also poses a problem in many settings: it damages structures built on clay-rich soil, causes leakage from clay barriers used for waste isolation or \ceCO2 sequestration, alters the texture of foods, disrupts biological tissues, and limits the performance of gel particle coatings with potential for use as non-fouling films, biosensors, and drug delivery platforms 1, 2, 3, 4, 5, 6, 7. In all of these cases, the individual hydrated grains shrink when dried. However, despite its ubiquity, the influence of grain shrinkage on cracking has thus far been overlooked. Previous studies have shed light on the influence of grain size and stiffness, packing size, drying rate, capillarity, and surface adhesion 8, 9, 10, 11, 12, 13, 14, 15, 16, 17, 18, but only for bulk gels and packings of non-shrinkable grains. Here, we demonstrate that grain shrinkage is a key factor that alters how packings crack when dried—and can be harnessed to unlock new ways to control cracking. Therefore, shrinkage should not be neglected from studies of cracking.
Experiments on model shrinkable grains reveal a range of cracking behaviors during drying: shrinkage without cracking, irreversible cracking, and most remarkably, reversible cracking in which cracks spontaneously self-close. We developed a granular model that captures these diverse cracking behaviors by connecting single-grain shrinkage and inter-grain interactions to macroscopic cracking. Moreover, we extended this granular model to a continuum model of cracking that is quantified by four universal nondimensional parameters incorporating the role of grain shrinkage, poromechanics, packing size, drying rate, capillarity, and substrate friction. This multi-scale description yields quantitative criteria to predict different cracking behaviors. Finally, guided by our theory, we found that cracking behavior can be completely altered by varying the spatial profile of drying itself, suggesting a new way to control crack evolution in shrinkable, granular packings.
2 Results
2.1 Experiments reveal three different cracking behaviors
The granular packing we consider consists of a model system of non-Brownian, cross-linked hydrogel beads held together by capillary bridges in a pendular configuration 19. As packings in this configuration dry, bead shrinkage can cause the inter-bead capillary bridges to break, leading to the formation of cracks. Thus, our analysis starts from the moment the pendular configuration is initialized.
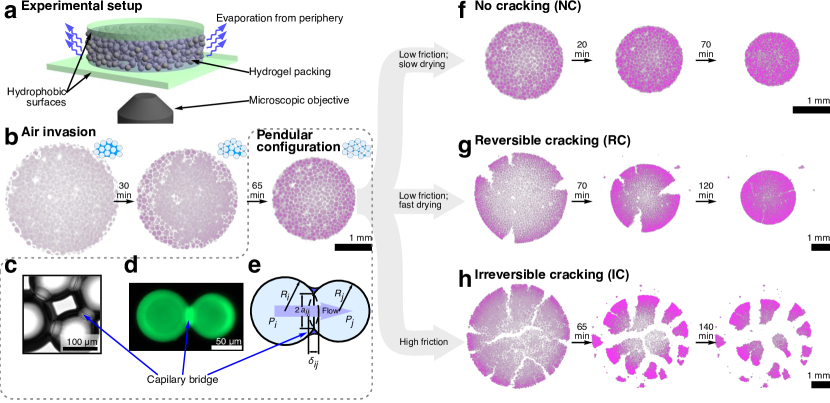
To initialize the pendular configuration, we suspended hydrogel beads near random close packing in deionized water. Upon drying, the individual beads dehydrate and shrink in radius by a factor of 1.3 as compared to the fully-hydrated state. We confined each suspension between two smooth, hydrophobic, parallel surfaces in a disk geometry where the top surface follows the top of the packing (Materials and Methods). This setup imposed azimuthal symmetry and ensured that drying to the ambient only occurred at the circular periphery as shown in Figure 1a; we describe more complex drying profiles in Section 2.5. As each suspension dries, the liquid-vapor interface recedes, compacting the hydrogel beads until they are close-packed. The interstitial liquid menisci then continue to recede, leading to rapid bursts of air—known as Haines jumps—that invade the space between beads as shown and schematized in Fig. 1b 20. In all packings tested, this air invasion results in a pendular configuration of hydrated beads interconnected by annular capillary bridges21, which we confirmed directly with brightfield and confocal fluorescence microscopy (Fig. 1c and d, respectively). These bridges precompress the individual beads by a distance as schematized in Fig. 1e 22, 23, 24. Our theoretical analysis starts from the moment this pendular configuration has been initialized (right-most panel of Fig. 1b); we denote the radius of the overall packing at this state as , which is smaller than the radius of the initial suspension due to compaction during air invasion and bead precompression. Subsequent changes in the packing—such as cracking via breaking of capillary bridges—arise solely due to bead shrinkage during drying.
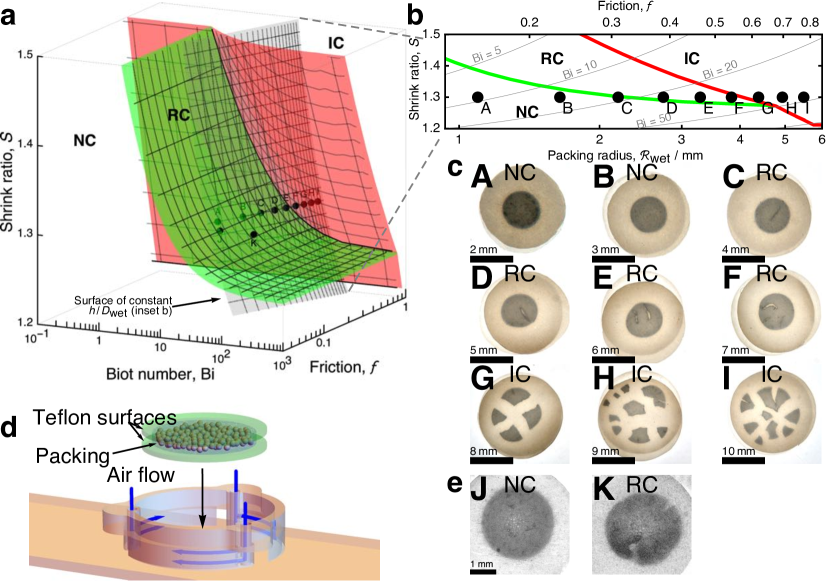
As packings continue to dry, we found that they evolve in one of three different ways depending on . Packings with small shrink with no cracking (NC) (Fig. 1f, Supplementary Video S1). For sufficiently large , cracks form at the periphery; remarkably, for a range of , we found that the cracks spontaneously self-close in a process we term reversible cracking (RC) to reflect the morphological similarity to the initial uncracked state (Fig. 1g, Supplementary Video S2). By contrast, for even larger , we observed irreversible cracking (IC) wherein packings break up into clusters that cannot self-close (Fig. 1h, Supplementary Video S3).
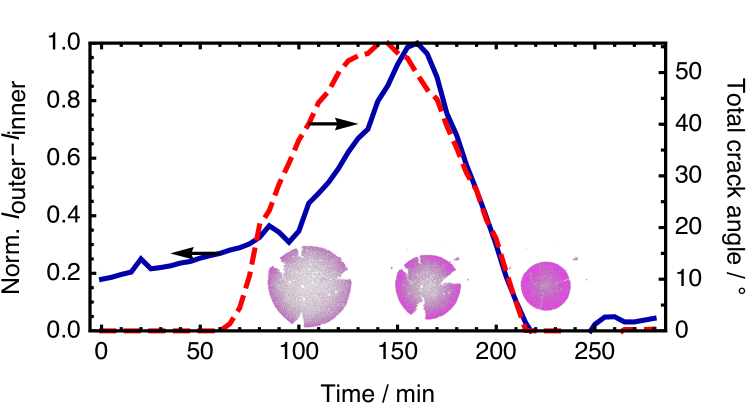
Close inspection of the individual beads suggests the underlying mechanisms of cracking and self-closing. To quantify shrinkage during drying, we dissolved a fluorescent dye—which was subsequently absorbed by the hydrogel beads—and measured fluorescence intensity. The local dye concentration increases with bead shrinkage, leading to an increase in fluorescence intensity, as validated using direct bead size measurements (Fig. S1). As a packing dries, we observed a differential shrinkage resulting from a mismatch in bead sizes as quantified by the gradient in fluorescence intensity in Fig. 1f–h and Fig. 2. Beads at the periphery shrink before beads in the interior, suggesting that water transport from the interior to the periphery is limited. For larger , we observed an even larger differential shrinkage, suggesting that the rate of intra-packing water transport cannot match the rate of periphery drying; compare the radial intensity gradient between Fig. 1f and Fig. 1g. When this differential shrinkage is large enough, capillary bridges between periphery beads overstretch and break (Supplementary Video S4), which initiates cracking. Interestingly, cracks close upon themselves when this differential shrinkage subsides (Fig. 2), highlighting the central importance of differential shrinkage in crack evolution. However, for very large , while cracks still initially form at the periphery, they can also nucleate from within the packing and are unable to completely self-close, leading to immobile clusters of beads. This observation suggests that friction with the confining surfaces limits self-closing and leads to IC.
2.2 Modeling of transport and forces
To provide a multiphysics description of these cracking behaviors, we analyzed the physics of bead shrinkage, inter-bead water transport, and inter-bead forces during drying, as described in Sections 2.2.1-2.2.3 below. We developed a discrete-element model (DEM) that fully incorporates these physics; directly solving this DEM using computer simulations yielded results that capture the experimental observations, indicating that cracking behavior can be understood using these bead-scale processes (Section 2.3). Motivated by previous work on bulk gels 25, 26, 27, 28, we also extended the DEM to a simplified continuum model. In contrast to previous work, this model explicitly incorporates parameters that describe the granularity of the medium, including bead shrinkage, stiffness, permeability, and size. Importantly, however, these parameters can be collapsed into four nondimensional state variables that can predict the ultimate state of cracking (Section 2.4)—providing a simple and intuitive description of cracking. Moreover, the continuum model enables us to test more complex drying profiles and how they can be harnessed to control crack evolution (Section 2.5).
2.2.1 Bead shrinking
Our experimental observations in Fig. 1f–h and Fig. 2 highlight the key role of bead shrinkage in cracking. Shrinkage primarily occurs between the initial wet state—at which air invasion has completed and the packing of hydrated beads is pendular—and the final dry state (Supplementary Videos S1–S3). We denote these states using subscripts. At the initial wet state, we assume that all hydrogel beads have the same fully hydrated volume, , for simplicity; conversely, at the dry state, all beads have fully shrunk to the same dry volume, , in equilibrium with the ambient environment. Simulations show that polydispersity does not appreciably affect our results (Supplementary Discussion and Figs. S4–S6). We use the shrink ratio, , as a state variable to quantify the bead shrinkage between these two states:
| (1) |
where and denote the radius and volume of a single bead, respectively. In nondimensional form, and ; therefore, and are measures of shrinkage during drying, where and . In general, we use the hat notation () to nondimensionalize quantities by bead-scale values.
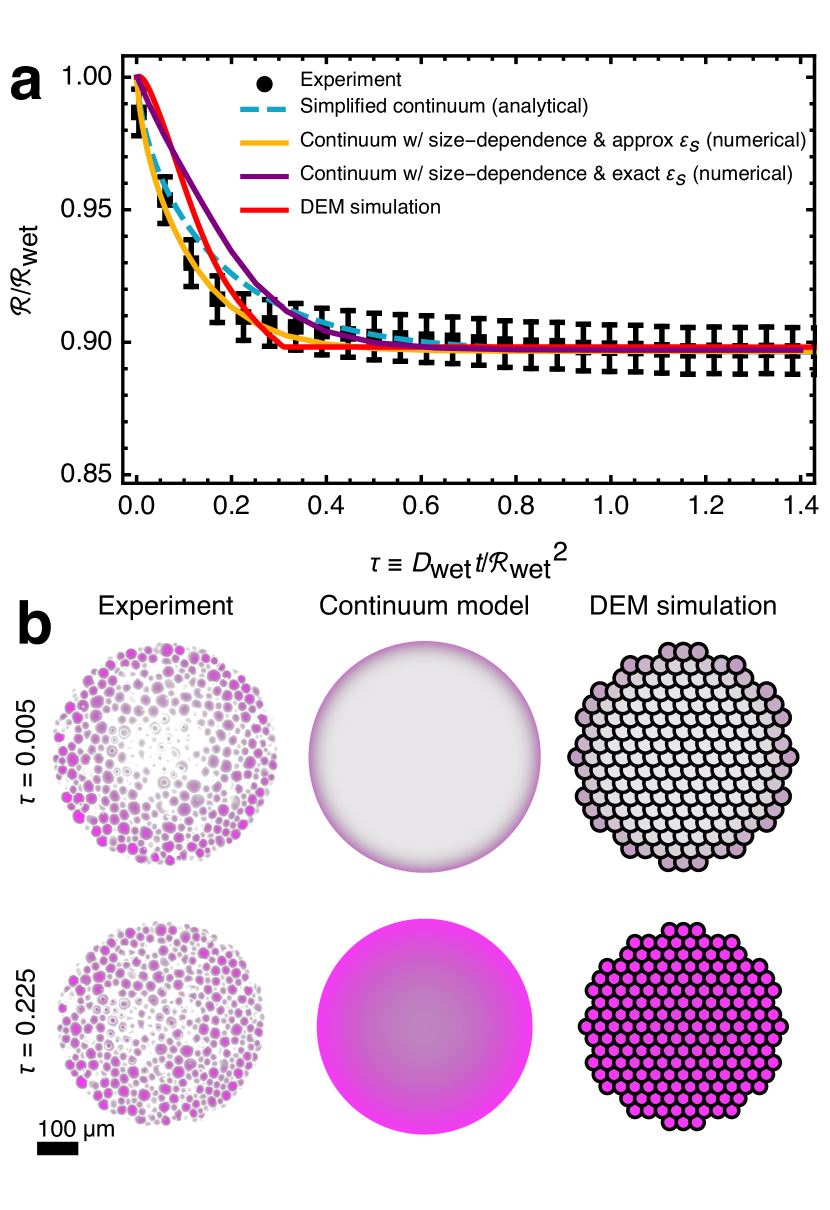
As a hydrogel bead shrinks, its hydrated polymer mesh deswells. We treat this change by assuming that the mesh size , as experimentally verified by others for many hydrogels such as those used in our experiments 29, 30, 31, 32; therefore, the poromechanical properties—bulk modulus, , and permeability, —also depend on according to power laws (as detailed in Section 4.2). Our DEM simulations include all of these dependencies. However, since is of order unity in the experiments, these dependencies are weak; an example demonstrating this is given in Fig. 3. Hence, for simplicity, we focus on a version of the continuum model that does not consider size-dependent changes in bead properties in the following discussion.
2.2.2 Water transport and evaporation
The experiments shown in Fig. 1f–h and Fig. 2 highlight the importance of intra-packing water transport and periphery drying on crack behavior. In the experiments, beads inside the packing do not shrink immediately after air invasion (Fig. 1b)—rather, the overall packing slightly compacts due to bead precompression by capillary bridges—indicating that the partial pressure of water vapor is near saturation in the air-invaded region. We therefore assume that water transport through the vapor region is negligible. Water transport at the single-bead scale can then be described using Darcy’s law: where is the liquid flux, is the dynamic viscosity of water, and is the liquid pore pressure. Periphery drying imposes a gradient of within the packing, leading to inter-bead water transport. This evaporation-induced flow is similar to that found in drying suspensions and emulsions 33, 34; however, in our packings, flow is limited by the permeability of the hydrogel beads themselves 28. This behavior is quantified by the poroelastic diffusion coefficient, (Section 4.4), which converts the pressure gradient to a gradient in bead volumes 1, 26. Thus, our DEM simulations use a discretized form of Darcy’s law that explicitly considers differences in bead size—that is, differential shrinkage—as detailed in Section 4.3.2.
To develop a continuum version of this granular model, we assume that there is a continuum of beads within a packing. We thus treat the system as having a shrinkage field of , which specifies for a grain located at —the Lagrangian radial coordinate normalized by time-dependent packing radius ( at the packing periphery). We use the tilde notation () to nondimensionalize quantities by macroscopic values. Applying fluid mass conservation yields a diffusion equation governing the time-dependent distribution of water, as derived in Section 4.4:
| (2) |
where is time. Here, the poroelastic diffusion coefficient is defined similarly to the granular case, but is constant and evaluated at the wet state: . The simplifying assumptions described above do not considerably affect the model results, as exemplified in Fig. 3. However, they enable us to analytically solve for the differential shrinkage in the packing that arises during drying.
We model periphery drying using a convective boundary condition with a mass transfer coefficient , such that the volumetric flux of water due to evaporation is proportional to the concentration of water at the periphery: . In nondimensional form, this condition is expressed as
| (3) |
where is the fractional water content. The nondimensional quantity Bi is the Biot number, which quantifies the rate of periphery drying () relative to the rate of intra-packing water transport (). We therefore expect that the packing shrinks more non-uniformly when and more uniformly when . We confirmed this expectation by analytically solving our simplified continuum diffusion equation (Eq. 2) with this convective boundary condition (Eq. 3), yielding a full solution for that exhibits greater differential shrinkage at higher Bi:
| (4) |
where , and are the zeroth and first-order Bessel functions of the first kind, is nondimensional time expressed as the Fourier number, and are the roots of . The dependence on Bi confirms the expectation that higher Bi results in a greater differential shrinkage—as quantified by a difference in between the periphery and interior—throughout the drying process; this relationship is plotted in Fig. S2. Furthermore, using both our DEM simulations and continuum approximation, we will show that the stresses that develop due to differential shrinkage at high Bi lead to an increased propensity for cracking. This expectation is consistent with our experiments in Fig. 1 where increased —which increased Bi—led to more cracking. Bi, along with , is therefore a state variable that governs cracking behavior.
2.2.3 Force interactions
To model the stresses that develop due to differential shrinkage during drying, we start by describing the contact and capillary forces between beads in the pendular configuration. We neglected inter-bead friction since this has been measured to be negligible 35. We also first consider the case when friction with the substrate is negligible; however, we explicitly incorporated these interactions in the DEM simulations, as described below. As shown in Fig. 1c,d and schematized in Fig. 1e, the balance of contact and capillary forces precompresses beads by an amount . Motivated by previous work 22, 36, 23, 24, and validated for hydrogel beads 37, 38, we modeled the contact force using a simple Hertzian mechanical description: where is the effective bead bulk modulus, is the effective bead size, and is the instantaneous deformation distance. Motivated by our observations of thin annular capillary bridges (Fig. 1c,d) and previous work 22, 39, we modeled the capillary force as , where is the surface tension and the capillary bridge radius is equivalent to the contact radius . At mechanical equilibrium when the capillary force is equivalent to the contact force, . Our DEM simulations explicitly incorporate the variation of this equilibrium compression distance with bead shrinkage (Section 4.2), and its value at the wet state provides a way to characterize the combined influence of capillary and elastic forces. In nondimensional form, this parameter is given by (Section 4.3.3):
| (5) |
where we nondimensionalize the bulk modulus by a characteristic capillary pressure . We expect that packings composed of softer beads—with high —are more crack-resistant since they require a larger separation between bead centers to break capillary bridges. Our DEM simulations confirm this expectation as we will show later. , along with and Bi, is therefore a state variable that governs cracking behavior.
To determine the stresses due to differential shrinkage, we extend this granular description to a continuum model using linear elasticity. A linearization of contact and capillary forces in granular packings yields an effective Young’s modulus 22,
| (6) |
Using this modulus, we build a constitutive relationship between stress, , and strain, , by adding an extra drying-induced shrinkage term to Hooke’s law:
| (7) |
where the quantity represents the strain due to bead shrinkage from water evaporation. At the wet state, and at the dry state, , which can be explicitly related to the state variables and (Eq. 49). We found that this quantity can be approximated by
| (8) |
as detailed in Section 4.5. This simplifying assumption does not considerably affect the model results, as exemplified in Fig. 3. Moreover, incorporating this approximation into the constitutive relation (Eq. 7), along with the full solution for water transport throughout the packing (Eq. 4), yields the full, analytical time-dependent displacement and azimuthal stress fields and , respectively:
| (9) |
| (10) |
This time-dependent solution depends directly on the state variables: and through (Eq. 49), and Bi through and (Eq. 4). Specifically, the shrinkage—as quantified by —and the stress increase with Bi as shown in Fig. S2. We tested this continuum model by direct comparison with a NC drying experiment, which most closely represents the radial geometry of our continuum model at the same , Bi, and ; we found excellent agreement in shrinkage between the two as shown in Fig. 3.
The continuum solution of stress (Eq. 10) reveals how the state variables , Bi, and , which naturally arise from the granular picture, govern the onset of macroscopic cracking. As drying progresses, differential shrinkage grows, causing the stress to develop and eventually reach a maximum near the onset of cracking. After this maximum, the stress diminishes as the interior of the packing begins to shrink, reducing the amount of differential shrinkage. This peaking behavior is also captured mathematically in Eq. 10—the stress is a series of decaying time exponentials that could be positive or negative. Although this maximum, , cannot be expressed in closed form, we found that it can be closely approximated by
| (11) |
which increases with Bi sigmoidally (Fig. S3), as well as with increasing and decreasing via (Eq. 49). Therefore, our continuum model can quantify how a packing is more likely to crack when it is rapidly dried (high Bi) and composed of more shrinkable (high ) and stiffer beads (low ).
2.3 DEM simulations capture all three cracking behaviors
We implemented the granular physics described heretofore in DEM simulations. Our DEM simulation method solves for bead sizes, bead positions, and capillary-bridge bonds using the granular forces and water transport rules we derived. The method incorporates a gradient-descent scheme to find the mechanical minimum for a packing of beads with time-dependent sizes. The packing is initially hexagonal-close-packed, but we found that this condition does not appreciably affect our results (Supplementary Discussion, Figs. S4–S6). A hybrid event-detection scheme breaks bonds when they become overstretched. We tested this time-dependent DEM simulation by direct comparison with a NC drying experiment at the same , Bi, and ; we found excellent agreement in shrinkage between the two, and with the continuum model, as shown in Fig. 3. To incorporate friction with the substrate into the DEM simulations, we first determine the net capillary and contact forces on each individual bead. If this net force exceeds a constant, static friction threshold, , then the bead moves; otherwise, it does not.
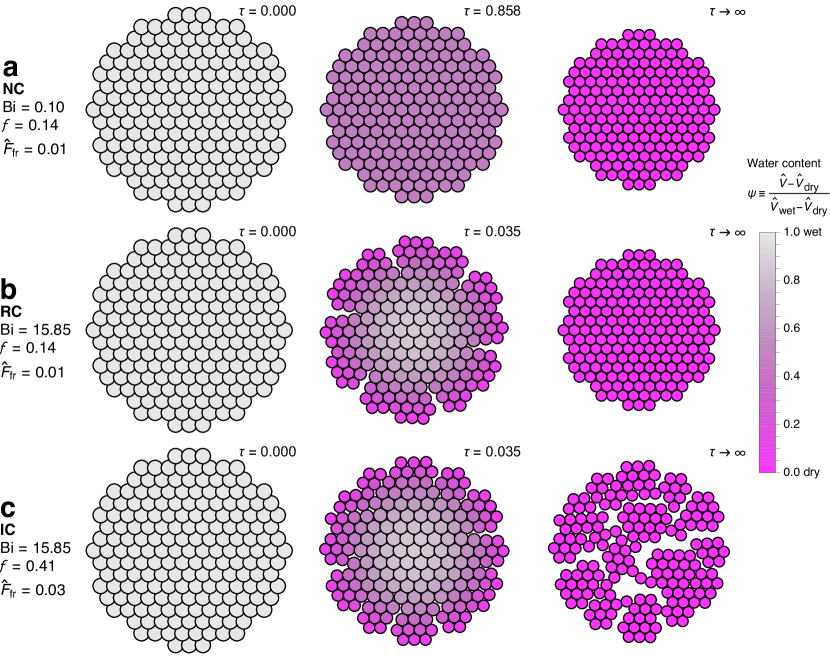
To test the influence of , Bi, and on cracking as suggested by our continuum model, we ran several thousand simulations varying these state variables. We were able to classify all results as either NC, RC, or IC (Fig. 4, Supplementary Videos S5–S7) as indicated by blue, green, and red symbols in the state diagrams in Fig. 5. Thus, the experimentally-observed cracking behaviors can be captured using the bead-scale interactions that are incorporated in the DEM. Moreover, clear boundaries delineate these different behaviors. Cracking results (RC and IC) have higher , higher Bi, and lower compared to NC results. Thus, the boundary describing the onset of cracking agrees with the expectations of our continuum model.
Our experiments show that for large packings, clusters of beads can be immobilized and cause IC; this observation suggests that friction with the substrate also governs cracking behavior. To incorporate the observed dependence on packing size, we independently varied the number of beads that make up the area of the packing, . We found that increasing either or increases the propensity for IC as shown in Fig. 5. In particular, an increase in or moves the NC–IC and RC–IC borders—denoted by and , respectively—to lower and lower Bi. Both and move these borders in similar ways, suggesting that there is a characteristic friction for the entire packing that depends on both of these parameters.
This characteristic friction can be determined by examining the force required to break up the packing into smaller clusters beads across. Breakup occurs when the friction force that immobilizes a cluster, , balances the capillary force holding the boundary of the cluster to the packing, ; is the number of monolayers quantifying the packing height, is the number of beads at the cluster boundary, and the single-bead forces and —assumed to be uniform throughout the packing for this simple estimate—are nondimensionalized by . At the boundary of IC, ; thus, to incorporate both packing size dependence and single-bead friction within a characteristic friction for the entire packing, we can define
| (12) |
The parameter can be interpreted as the force per grain to immobilize clusters of beads in the limit of low Bi since we assumed to be uniform. DEM simulations with different and , but the same value of , yield nearly identical results as shown in Fig. 5b,c and Fig. S7. This finding confirms our expectation that a single parameter collapses the effects of varying and . As such, is also a state variable that governs cracking, along with , Bi, and .
2.4 Determining cracking criteria from continuum theory
Having verified that the four state variables—, Bi, , and —predict cracking, we then used our continuum theory to determine expressions for the borders, or cracking criteria, that delineate NC, RC, and IC behaviors. The criteria arise from different balances of three different stresses: the drying-induced stress from differential shrinkage, (Eq. 11), the cohesive stress from capillary bridges, , and the friction-induced stress to immobilize clusters of beads, . The resulting criteria depend solely on the state variables, demonstrating that these variables fully describe cracking of shrinkable, drying packings. The criteria are plotted in Fig. 5 and show excellent agreement with the results of our DEM simulations.
When friction is small, the NC–RC border is delineated by a threshold (blue–green boundaries in Fig. 5). RC occurs when the Bi-dependent shrinkage stress overcomes the capillary stress, ; using Griffith’s criterion yields similar results (Supplementary Discussion). Balancing these stresses, expressing both sides purely in terms of state variables— in terms of , , and Bi (Eq. 11); in terms of and (Eq. 31)—and solving for Bi yields an expression for the cracking criterion in terms of the state variables:
| (13) |
where and the numeric constants were determined from DEM simulation results. decreases with increasing and decreasing . This NC–RC criterion demonstrates that a packing is more likely to crack when it is rapidly dried () and composed of more shrinkable, stiffer beads.
When friction is appreciable, the NC–IC border is delineated by a threshold (blue–red boundaries in Fig. 5). IC occurs when the characteristic friction-induced stress to immobilize clusters in the low Bi limit overcomes the capillary stress, ; using Griffith’s criterion yields similar results 40, 41 (Supplementary Discussion). Balancing these stresses and expressing both sides purely in terms of state variables— in terms of and (Eq. 31)—and solving for yields the shrink ratio above which IC must occur due to cluster breakup:
| (14) |
where the numeric constant was determined from DEM simulation results. decreases with decreasing and increasing . This criterion demonstrates that a packing is more likely to break up into clusters when it has more friction with the substrate.
At high Bi and high friction, the RC–IC border is delineated by a threshold (green–red boundaries in Fig. 5). IC occurs when the Bi-dependent stress, , overcomes the friction-induced stress to immobilize a cluster of beads from the rest of the packing, . This friction-induced stress also depends on for large Bi; we used our DEM simulations to empirically determine this dependence with the constraint that , , and intersect at a point when . Balancing these stresses, expressing both sides purely in terms of state variables— in terms of , , and Bi (Eq. 11)—and solving for Bi yields the RC–IC criterion in terms of the state variables:
| (15) |
where the numeric constants were determined from DEM simulation results. decreases with increasing , decreasing , and increasing . This criterion demonstrates that a packing is more likely to break up into clusters when it is rapidly dried (), composed of more shrinkable, stiffer beads, and has more friction with the substrate.
However, with very soft beads, cracking can be completely suppressed even if (Fig. S7). There is a below which NC must occur due to beads being unable to separate from high precompression. When , the maximum distance that bead radii shrink by, , does not exceed the distance they are initially precompressed by, . By equating these distances, we obtain an expression for :
| (16) |
which decreases with decreasing . This criterion demonstrates that a packing is more likely to crack when it is composed of more shrinkable, stiffer beads.
The combination of the cracking criteria—, , , and —provides a universal state space of cracking behavior for shrinkable, granular packings. For any packing where the four state variables are known, we can predict how the packing will crack as shown for several values of and in Fig. 5. To more completely visualize this universal state space, we plotted the cracking criteria that delineate NC, RC, and IC behaviors for the experimentally determined value of (Fig. 6a). As an experimental test of the validity of these criteria, we performed multiple drying experiments traversing all three different cracking behaviors in this state space (points A–I in Fig. 6). We first systematically increased packing radius, which simultaneously increases Bi and . We observed a transition from NC to RC to IC in good agreement with our criteria (Fig. 6b,c). To further isolate the role of Bi, we performed additional experiments where we varied the mass transfer coefficient, , which independently changes Bi for a fixed packing size; this was done using a custom 3D-printed test apparatus with precise air-flow control (Fig. 6d). Changing only Bi, we observed an NC–RC transition in good agreement with the criteria (points J,K in Fig. 6). These experimental agreements provide support for our description of cracking in shrinkable, granular packings.
2.5 Controlling cracking
Our experiments (Figs. 1,2) and experimentally-supported cracking theory demonstrate the central role of differential shrinkage in governing cracking behavior. For the case of drying from the periphery considered heretofore, increasing the drying rate relative to intra-packing transport—as quantified by the Biot number—amplifies differential shrinkage (Fig. 1). Thus, varying the drying rate is a way to control cracking behavior for periphery drying.
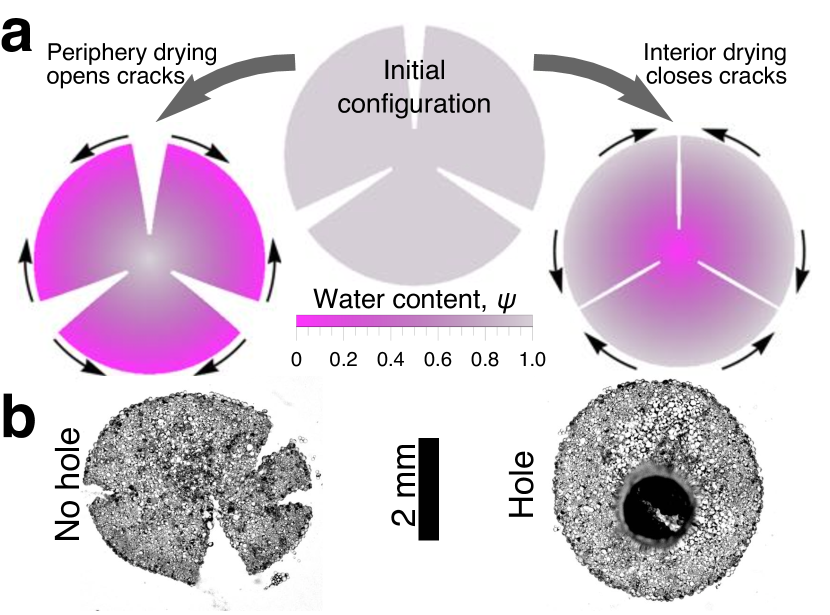
However, our theory is general and not limited to the case of periphery drying. In fact, we can impose any arbitrary shrinkage profile into our continuum model with a pre-cracked geometry and solve for the deformation. To illustrate the influence of different shrinkage profiles, we tested two contrasting cases. When imposing faster drying at the periphery, cracks open as we expect (Fig. 7a, left); conversely, for the opposite case of faster drying in the interior, cracks close (Fig. 7a, right). This observation explains the different stages of reversible cracking we found experimentally: cracking, followed by self-closing (Fig. 1g). At the early stage, periphery beads shrink faster, causing cracks to open; at the later stage, the interior beads shrink faster, decreasing the differential shrinkage and causing cracks to self-close (Fig. 2). Moreover, this observation suggests a simple method to prevent cracking at the periphery: by promoting interior drying at all times. A direct experimental demonstration of this crack prevention strategy is shown in Fig. 7b. To promote interior drying, we incorporated a hole into the top surface overlying the interior of a packing. Without the hole, cracks form at the periphery (Fig. 7b, left); by contrast, with the hole, cracks are suppressed (Fig. 7b, right). These results show that, in addition to varying the periphery drying rate, another way to control cracks is to vary the spatial profile of drying itself.
3 Conclusions
Our work describes the first investigations of how grain shrinkage impacts the cracking of granular packings during drying. Experiments reveal the diverse forms of cracking—shrinkage without cracking, irreversible cracking, and most remarkably, reversible cracking—that can arise due to differential shrinkage. DEM simulations capture these experimental observations, indicating that different macroscopic cracking behaviors can be understood by considering the interplay between bead shrinkage, inter-bead water transport, and inter-bead forces during drying. Moreover, we developed a continuum model that can describe the ultimate state of cracking. As a first step toward a more complete theoretical framework, we focused on a version of the continuum model that uses a linear description of elasticity and does not consider size-dependent changes in bead poromechanical properties; incorporating further details of granular water transport and forces will be a useful direction for future work. Nevertheless, our continuum description sheds light on the underlying physics through the four state variables , Bi, , and , which quantify how grain-scale processes determine cracking.
This knowledge can inform applications that need to avoid cracking. It could also suggest ways to control cracking; emerging examples include micro/nano-patterning 42 and transport in fuel cells 43. Moreover, our observation of shrinkage-driven crack evolution suggests a new way to engineer materials that can actuate 44 and can even self-close, potentially enabling self-healing. Importantly, this approach to self-healing would not require specialized material architectures or additional cross-linking chemicals as current approaches do.
The work presented here focused on differential shrinkage due to drying. However, differential shrinkage can be controlled through other means: for example, by removing or injecting water at targeted points throughout the packing, by imposing osmotic stresses 45 or changes in solvent quality, and by designing packings with intrinsic, spatially-varying grain transport characteristics. Our results can therefore be generalized beyond the case of drying.
4 Materials and Methods
4.1 Experimental
4.1.1 Drying experiments
Drying experiments were performed at with Sephadex G-50F (). All comparative experiments were performed at the same time to ensure the same humidity and drying rate. Hydrophobic surfaces in the results presented in Fig. 1 and Supplementary Videos S1–S3 were circular siliconized glass coverslips, which were either purchased (Hampton) or silanized (see below). Hydrophobic surfaces in the results presented in Figs. 6,7 were made from -thick PTFE. Circles were cut out using a razor cutter (Roland STIKA SV-8).
To create disk-shaped packings, hydrogels were hydrated in centrifuge tubes with deionized water. After hydrogels settled to the bottom of the tube after approximately five minutes, excess water was removed such that the water level was a few millimeters above the packing. To ensure that the deposited suspension had a packing density close to random close packing, pipette tips were submerged several millimeters below the top of the packing during bead when filling. Droplets were then deposited from the pipette to circular hydrophobic surfaces. Another hydrophobic surface (top surface) was then placed on top of the droplet; it therefore follows the top of the packing throughout the drying process. The droplet suspension then expanded such that its contact lines became pinned to the circumferential edges of the top and bottom surfaces, rendering a disk-like geometry.
Fluorescence micrographs (Figs. 1,2,3 were obtained via confocal microscope (Nikon A1R) with the widest pinhole settings. Fluorescein sodium salt in deionized water () was used to fluorescently label hydrogels. Samples were excited at and imaged at . Conventional photographs (Figs. 6,7) were obtained via CMOS camera (Sony A6300) with a macro lens (Nikon Micro-Nikkor 105mm f/2.8 AF-D).
Experiments where the mass transfer coefficient (drying speed) was varied were performed on a custom 3D-printed device (Fig. 6d). A packing between two hydrophobic surfaces was placed in the device. An annular region provided airflow in a clockwise direction, which was supplied by air channels. These air channels were connected to lab air supply and controlled via a flow regulator to rates ranging .
4.1.2 Glass silanization procedure
of trichloro(octadecyl)silane was added to a mixture of 80% dodecane and 20% chloroform by volume. round coverslips were made hydrophobic by submersing them in the solution and mixing for 20 minutes. The coverslips were then rinsed with chloroform, acetone, and finally with water.
4.1.3 Hydrogel bead property measurements (, , )
Wet bead radius, , shrink ratio, , and poroelastic diffusion coefficient, of Sephadex G-50F were measured by imaging the time-dependent swelling process of individual beads. Individual beads were placed on a glass slide under observation of a confocal microscope. Then, a droplet of deionized water was placed in contact with the beads to swell the beads. The time-series images of swelling were processed using Mathematica®. An edge detection filter was applied to obtain circles around each bead. Then, a circle Hough transform was applied to obtain the locations and sizes of circles. Identical beads were identified across successive frames by finding similarly positioned and sized beads. The wet bead size was measured to be (uncertainties are one standard deviation). By comparing bead sizes before and after swelling, . The poroelastic diffusion coefficient was determined by fitting the 1D spherical diffusion equation solution with Dirichlet boundary condition to the time-dependent bead volume data. This diffusion coefficient was set to . This coefficient was measured to be . Uncertainties in , , and are likely due to imprecisions in image processing and variations in the manufacturing process. For modeling purposes, , , and .
4.1.4 Friction measurement ()
Friction for PTFE surfaces was measured by first placing a packing with a volume of several hundred on a PTFE surface taped to a glass slide. The weight of the packing was measured on a scale. Then, the surface was tilted and the angle at the moment when the packing began to slide was recorded (the moment when static friction is overcome). The contact area with the surface was determined by photographing the underside of the slide (the PTFE was slightly transparent). Using the weight of the packing, and the angle of initial sliding, the static friction force was determined. Dividing this static friction force by the average area per bead (assuming hexagonal close packing and ) yields the static friction threshold for a single bead: . For modeling purposes, we used .
4.1.5 Precompression measurement ()
Precompression () was measured using a fluorescent micrograph of a packing at the wet state. By measuring the length of lines between beads (), can be determined using Eq. 32. A value of was measured (uncertainty is one standard deviation). For modeling purposes, .
4.1.6 Biot number measurement (Bi)
The Biot number was determined by measuring the velocity of packing shrinkage, . Time-series images of a packing shrinking over time during the air invasion process showed nearly constant disk shrinkage velocity ( linearly decreasing with time) up to the conclusion of air invasion. The moment when air invasion ends and individual beads begin to shrink is a state we define as the wet state. However, in some cases beads started to shrink before air invasion was completed. Thus, the wet state is an idealization for modeling purposes. It is a reasonable idealization since any overlap time between shrinkage and air invasion was short compared to the length of the experiment.
4.2 Scaling relationships for poromechanical properties
As a hydrogel bead shrinks, its hydrated polymer mesh deswells. We treat this change by assuming that the mesh size , as experimentally verified by others for many hydrogels, including those used in our experiments, for which the poromechanical properties can be described by treating the hydrogel as a semi-dilute polymer solution 29, 30, 31, 32. Using scaling relationships developed by de Gennes 29, the bulk modulus, , is related to the mesh size, , at constant temperature by , and thus, . In terms of the wet state, we can write an explicit power-law dependence of the modulus on the state of swelling ( or ):
| (17) |
Since at any intermediate state , we can describe the modulus in terms of . Nondimensionally,
| (18) |
where we nondimensionalize forces by and lengths by ; thus, we nondimensionalize pressure by .
Similarly, the single-bead permeability is a function of the state of swelling for an individual bead: and thus . We can again write an explicit power-law dependence of the permeability on shrink ratio in terms of the wet state:
| (19) |
Since the poroelastic diffusion coefficient, , depends on both and where (Section 4.4), the diffusion coefficient also scales with the shrink ratio:
| (20) |
The compression distance, , and its nondimensional form , are also a function of the state of swelling since is a function of the state of swelling:
| (21) |
4.3 DEM simulations
4.3.1 Algorithm
Networks of individual shrinkable beads were simulated using the equations of discrete transport and discrete force interactions. The packing geometry was a circular 2D monolayer of hexagonally-close-packed spherical beads with bonds between adjacent beads. Simulations were performed using Mathematica. The simulation procedure was as follows.
- 1.
-
2.
Perform a gradient descent where beads are moved in timeless steps (quasistatic relaxation) in the direction of their net forces. These forces are calculated using discrete contact forces (Eq. 28) and capillary forces (Eq. 31). Continue gradient descent until the smallest force on a bead in the system is less than 1% of the force to break a bond.
-
3.
If, after gradient descent, any bonds are overstretched, check whether the amount of overstretching exceeds 1% of (hybrid event detection)—using smaller values of excessive overstretching did not greatly affect DEM simulation results. If it does, then go back to Step 1 with half the timestep size and proceed in time (Steps 1–3) until the same cracking event is reached. If the amount of overstretching still exceeds 1% of , go back to the last timestep where cracking did not occur with half the timestep size. Repeat with finer and finer timestep sizes until the amount of overstretching is less than 1% of . Once the overstretching is small enough, break the bond, and perform a gradient descent.
-
4.
Continue timestepping (Steps 1–3) until all beads have reached their final dry size.
4.3.2 Water transport and evaporation
We discretize Darcy’s law between two beads and such that the volumetric flow rate between them is given by , where is the radius of the capillary bridge linking the beads, is an effective permeability for the pair of beads, is the dynamic viscosity of water, and are the liquid pore pressure and radius of bead , and is the precompression distance between the beads determined from Hertzian mechanics (Fig. 1e).
We use poroelasticity to convert the gradient in to a gradient in bead volumes 1, 26. Specifically, the bulk modulus , and thus, , where is an effective nondimensional bead volume. Thus,
| (22) |
The discretized diffusion coefficient is
| (23) |
where
| (24) |
is a mutual poroelastic diffusion coefficient—assuming transport between the beads is limited by the slower diffusing of the two (detailed further in Section 4.4). Our DEM simulations use this discretized form of Darcy’s law with size-dependent , as described by the scaling relationships in Section 4.2.
The discretized flow at the periphery of the packing is
| (25) |
where the evaporative area for a single periphery bead , Bi is the Biot number, is the poroelastic diffusion coefficient evaluated at the wet state, is the initial packing radius, and is given in Eq. 49. For the purpose of approximating , we assume periphery beads are cylindrical with a circumference of and a height of . The evaporative area for a single periphery bead is then
| (26) |
where is the 2D angular fraction of the bead that is visible to the environment (line of sight). This angular fraction is calculated via where is the total field of view from every other bead. The total volume change for bead over a timestep size of is
| (27) |
where is determined from Eq. 22.
4.3.3 Force interactions
Motivated by previous work 22, 36, 23, 24, and validated for hydrogel beads 37, 38, we model the contact force using a simple Hertzian mechanical description:
| (28) |
where is the instantaneous deformation distance and the bead moduli and sizes are given by
| (29) | ||||
| (30) |
We assume that Poisson’s ratio, , is equal to under quasistatic conditions and thus , as measured previously for cross-linked hydrogels 46, 47, 48. Motivated by our observations of thin annular capillary bridges (Fig. 1c,d) and other modeling work 22, 39, we consider an attractive capillary force between the beads:
| (31) |
where is the surface tension of water and
| (32) |
is the radius of contact between beads. Because the hydrogel beads are hydrated polymer networks—containing a continuous fluid phase through each bead—and thus, the size of the hydrated polymer network in each bead is contiguous with the fluid volume, we assume this contact radius is the capillary bridge annular radius. Once this capillary force is overcome, the capillary bridge link between two spheres is broken. At mechanical equilibrium when , and
| (33) |
and thus .
4.3.4 Quasistatic assumption
The quasistatic assumption is valid since the diffusion timescale is much smaller than the mechanical relaxation timescale. Using a very approximate mobility of (extracted from Fig. 5 of 49), a characteristic of force (, ), and a characteristic system length scale of , a characteristic mechanical relaxation timescale is . Conversely, using and the same system length scale of gives a characteristic time that is . As a result, the diffusion is many orders of magnitude slower than mechanical relaxation.
4.3.5 Cracking behavior classification
DEM results were classified as either NC, RC, and IC according to a set of rules. NC occurs if the number of bond breaks is less than 1% of the total number of bonds. IC occurs if, in the final state, the standard deviation of bond distances is more than 10% of the mean bond distance, or if the average number of bond breaks that occur after the point of maximum strain energy is more than three times the number of bond breaks at the point of maximum strain energy. Otherwise, RC occurs.
4.4 Derivation of the diffusive transport model
We can write a statement of conservation of mass (incompressible fluid) for a single bead with bridges attached (a coordination number of ).
| (34) |
where is the inward volumetric flux of water through the th bridge and is the cross-sectional area of a liquid bridge. Around each bead, let us consider a volume called the Voronoi cell, , which is the space-filling volume associated with each bead. Thus, the Voronoi cells can be tessellated with each other. The bounding surface of each Voronoi cell is what we will call . The with outward facing normal associated with is . With these definitions, we can express the right hand side as a closed surface integral around .
| (35) |
The divergence theorem states that
| (36) |
thus,
| (37) |
Since the average of the flux divergence within the bead is related to the volume integral by
| (38) |
we can express the change in mass as
| (39) |
where is time. Assuming a bead can be treated as infinitesimally sized and that there is an effective mean continuum flow field where , then
| (40) |
The transport constitutive law for the continuum flow field is
| (41) |
The quantity is the local solid fraction that varies in space and time. Reapplying Darcy’s law, the poroelastic relation between pressure and volume is given by,
| (42) |
Multiplying the right hand side by , we can express the transport equation as
| (43) |
where . We can nondimensionalize this diffusion equation as
| (44) |
where , . Eq. 44 is a continuum treatment of transport that takes into account size-dependent changes in (used in Fig 3). The changes in can be handled with polymer scaling relationships. Since , , , and
| (45) |
The parameter is thus the reciprocal of the packing volume fraction at the wet state; as a simplifying assumption, we take this to be . Moreover, because is of order unity in the experiments, we focus on a version of the continuum model that does not consider size-dependent changes in bead properties, for simplicity. Indeed, for materials where , does not vary more than an order of magnitude; thus, a constant-diffusion transport approximation is reasonable in many cases (). Thus, the transport equation can be reasonably approximated as
| (46) |
for . Here, we have used , defined as
| (47) |
as it spans , which is convenient for transport boundary conditions.
4.5 Derivation of drying-induced stresses
To determine the stresses due to differential shrinkage, we develop a continuum model using linear elasticity. Specifically, we build a constitutive relationship between stress, , and strain, , by adding an extra drying-induced shrinkage term to Hooke’s law (Eq. 7), where the quantity represents the strain due to bead shrinkage from water evaporation. Specifically, we define as the relative change in cross-sectional length per bead due to a change in water content:
| (48) |
At the wet state, and at the dry state, , which is related to the state variables and :
| (49) |
where and . To obtain a simplified and analytical solution for displacement and stress, we linearize Eq. 48 such that is proportional to changes in volumetric water content, , and retains the same values at the wet and dry states (Eq. 8):
This simplifying assumption does not considerably affect the model results, as exemplified in Fig. 3. Moreover, incorporating this approximation into the constitutive relation (Eq. 7) within the framework of linear elasticity, along with the water transport solution (Eq. 4), yields the full, analytical time-dependent displacement and stress fields (Eqs. 9,10):
Conflicts of interest
There are no conflicts to declare.
Acknowledgements
It is a pleasure to acknowledge S. Hilgenfeldt, L. Mahadevan, A.Z. Panagiotopoulos, W.B. Russel, and G.W. Scherer for stimulating discussions. We also acknowledge the Princeton Institute for Computational Science and Engineering for computer cluster access. This work was supported by start-up funds from Princeton University, the Alfred Rheinstein Faculty Award, the Grand Challenges Initiative of the Princeton Environmental Institute, the ReMatch+ Summer Internship Program, and in part by funding from the Princeton Center for Complex Materials, a Materials Research Science and Engineering Center supported by NSF grant DMR-1420541.
Notes and references
- Goehring et al. 2015 L. Goehring, A. Nakahara, T. Dutta, S. Kitsunezaki and S. Tarafdar, Desiccation cracks and their patterns : formation and modeling in science and nature, John Wiley and Sons, Inc, Weinheim, Germany, 2015.
- Gates et al. 2009 W. P. Gates, A. Bouazza and G. J. Churchman, Elements, 2009, 5, 105.
- Espinoza and Santamarina 2012 D. N. Espinoza and J. C. Santamarina, Int J Greenh Gas Con, 2012, 10, 351–362.
- Tsuji and Kawaguchi 2005 S. Tsuji and H. Kawaguchi, Langmuir, 2005, 21, 8439–8442.
- Still et al. 2015 T. Still, P. J. Yunker, K. Hanson, Z. S. Davidson, M. A. Lohr, K. B. Aptowicz and A. G. Yodh, Adv Mater Interfaces, 2015, 2, 1500371.
- Hendrickson et al. 2010 G. R. Hendrickson, M. H. Smith, A. B. South and L. A. Lyon, Adv Funct Mater, 2010, 20, 1697–1712.
- Arroyo and Trepat 2017 M. Arroyo and X. Trepat, Curr Opin Cell Biol, 2017, 44, 1 – 6.
- Routh and Russel 1999 A. F. Routh and W. B. Russel, Langmuir, 1999, 15, 7762–7773.
- van der Kooij et al. 2016 H. M. van der Kooij, G. T. van de Kerkhof and J. Sprakel, Soft Matter, 2016, 12, 2858–2867.
- Chung et al. 2016 J. Y. Chung, I. Regev and L. Mahadevan, Soft Matter, 2016, 12, 7855–7862.
- Tirumkudulu and Russel 2005 M. S. Tirumkudulu and W. B. Russel, Langmuir, 2005, 21, 4938–4948.
- Carreras et al. 2007 E. S. Carreras, F. Chabert, D. Dunstan and G. Franks, J Colloid Interf Sci, 2007, 313, 160 – 168.
- Brinker and Scherer 1990 C. J. Brinker and G. W. Scherer, in Sol-Gel Science, ed. C. J. Brinker and G. W. Scherer, Academic Press, San Diego, 1990, pp. 452 – 513.
- Routh 2013 A. F. Routh, Rep Prog Phys, 2013, 76, 046603.
- Dufresne et al. 2003 E. R. Dufresne, E. I. Corwin, N. A. Greenblatt, J. Ashmore, D. Y. Wang, A. D. Dinsmore, J. X. Cheng, X. S. Xie, J. W. Hutchinson and D. A. Weitz, Phys Rev Lett, 2003, 91, 224501.
- Chiu et al. 1993 R. C. Chiu, T. J. Garino and M. J. Cima, J Am Ceram Soc, 1993, 76, 2257–2264.
- Giorgiutti-Dauphiné and Pauchard 2018 F. Giorgiutti-Dauphiné and L. Pauchard, Eur Phys J E, 2018, 41, 32.
- Allain and Limat 1995 C. Allain and L. Limat, Phys Rev Lett, 1995, 74, 2981–2984.
- Mitarai and Nori 2006 N. Mitarai and F. Nori, Advances in Physics, 2006, 55, 1–45.
- Xu et al. 2008 L. Xu, S. Davies, A. B. Schofield and D. A. Weitz, Phys Rev Lett, 2008, 101, 094502.
- Scheel et al. 2008 M. Scheel, R. Seemann, M. Brinkmann, M. Di Michiel, A. Sheppard, B. Breidenbach and S. Herminghaus, Nat Mater, 2008, 7, 189.
- Møller and Bonn 2007 P. C. F. Møller and D. Bonn, EPL, 2007, 80, year.
- Butt et al. 2010 H.-J. Butt, W. J. P. Barnes, A. del Campo, M. Kappl and F. Schönfeld, Soft Matter, 2010, 6, 5930–7.
- Herminghaus 2005 S. Herminghaus, Adv Phys, 2005, 54, 221–261.
- Doi 2009 M. Doi, Journal of the Physical Society of Japan, 2009, 78, 052001.
- Bertrand et al. 2016 T. Bertrand, J. Peixinho, S. Mukhopadhyay and C. W. MacMinn, Phys Rev Applied, 2016, 6, 064010.
- Scherer 1989 G. W. Scherer, Journal of Non-Crystalline Solids, 1989, 109, 171–182.
- Scherer 1992 G. W. Scherer, Journal of Non-Crystalline Solids, 1992, 144, 210–216.
- de Gennes 1979 P.-G. de Gennes, Scaling Concepts in Polymer Physics, Cornell University Press, 1979.
- van der Sman 2015 R. G. M. van der Sman, Food Hydrocolloid, 2015, 48, 94–101.
- Zrinyi and Horkay 1987 M. Zrinyi and F. Horkay, Polymer, 1987, 28, 1139 – 1143.
- Stubbe et al. 2002 B. G. Stubbe, K. Braeckmans, F. Horkay, W. E. Hennink, S. C. De Smedt and J. Demeester, Macromolecules, 2002, 35, 2501–2505.
- Deegan et al. 1997 R. D. Deegan, O. Bakajin, T. F. Dupont, G. Huber, S. R. Nagel and T. A. Witten, Nature, 1997, 389, 827–829.
- Feng et al. 2013 H. Feng, J. Sprakel, D. Ershov, T. Krebs, M. A. Cohen Stuart and J. van der Gucht, Soft Matter, 2013, 9, 2810–2815.
- Dijksman et al. 2017 J. A. Dijksman, N. Brodu and R. P. Behringer, Rev Sci Instrum, 2017, 88, 051807.
- Fogden and White 1990 A. Fogden and L. R. White, J Colloid Interf Sci, 1990, 138, 414–430.
- Mukhopadhyay and Peixinho 2011 S. Mukhopadhyay and J. Peixinho, Phys Rev E, 2011, 84, 011302.
- Nordstrom et al. 2010 K. N. Nordstrom, E. Verneuil, W. G. Ellenbroek, T. C. Lubensky, J. P. Gollub and D. J. Durian, Phys Rev E, 2010, 82, 041403.
- Willett et al. 2000 C. D. Willett, M. J. Adams, S. A. Johnson and J. P. K. Seville, Langmuir, 2000, 16, 9396–9405.
- Flores 2017 J. C. Flores, Soft Matter, 2017, 13, 1352–1356.
- Ma and Burton 2018 X. Ma and J. C. Burton, arXiv:1807.06126, 2018.
- Kim et al. 2016 M. Kim, D.-J. Kim, D. Ha and T. Kim, Nanoscale, 2016, 8, 9461–9479.
- Kim et al. 2016 S. M. Kim, C.-Y. Ahn, Y.-H. Cho, S. Kim, W. Hwang, S. Jang, S. Shin, G. Lee, Y.-E. Sung and M. Choi, Sci Rep-UK, 2016, 6, 26503.
- Reyssat and Mahadevan 2009 E. Reyssat and L. Mahadevan, J R Soc Interface, 2009, 6, 951–957.
- Datta et al. 2016 S. S. Datta, A. Preska Steinberg and R. F. Ismagilov, P Natl Acad Sci USA, 2016, 113, 7041–7046.
- Wyss et al. 2010 H. M. Wyss, T. Franke, E. Mele and D. A. Weitz, Soft Matter, 2010, 6, 4550–4555.
- Geissler and Hecht 1981 E. Geissler and A. M. Hecht, Macromolecules, 1981, 14, 185–188.
- Andrei et al. 1998 D. C. Andrei, B. J. Briscoe, P. F. Luckham and D. R. Williams, in Deformation of Gel Particles, ed. R. H. Ottewill and A. R. Rennie, Springer Netherlands, Dordrecht, 1998, pp. 15–24.
- Nelson et al. 2011 W. C. Nelson, P. Sen and C.-J. Kim, Langmuir, 2011, 27, 10319–10326.