Intense C IV and He II Emission in Galaxies:
Probing High-Energy Ionizing Photons111
Based on observations made with the NASA/ESA Hubble Space Telescope,
obtained from the Data Archive at the Space Telescope Science Institute, which
is operated by the Association of Universities for Research in Astronomy, Inc.,
under NASA contract NAS 5-26555.
Abstract
In the last few years, prominent high-ionization nebular emission lines (i.e., O III], C III], C IV, He II) have been observed in the deep UV spectra of galaxies, indicating that extreme radiation fields characterize reionization-era systems. These lines have been linked to the leakage of Lyman continuum photons (necessary for reionization) both theoretically and observationally. Consequently, high-ionization UV emission lines present our best probe to detect and characterize the most distant galaxies that we will observe in the coming years, and are key to understanding the sources of reionization, yet the physics governing their production is poorly understood. Here we present recent high-resolution Hubble Space Telescope spectra of two nearby extreme UV emission-line galaxies, J104457 and J141851. We report the first observations of intense nebular He II and double-peaked, resonantly-scattered C IV emission, a combination that suggests these galaxies both produce and transmit a significant number of very high-energy ionizing photons ( eV) through relatively low column densities of high-ionization gas. This suggests that, in addition to photons at the H-ionizing edge, the very hard ionizing photons that escape from these galaxies may provide a secondary source of ionization that is currently unconstrained observationally. Simultaneous radiative transfer models of Ly and C IV are needed to understand how ionizing radiation is transmitted through both low- and high-ionization gas. Future rest-frame FUV observations of galaxies within the epoch of reionization using the James Webb Space Telescope (JWST) or extremely large telescopes (ELTs) will allow us to constrain the escape of helium-ionizing photons and provide an estimate for their contribution to the reionization budget.
Subject headings:
galaxies: abundances - galaxies: evolutionI. Introduction
The 21st century of astronomy has been marked by deep imaging surveys with the Hubble Space Telescope (HST) that have opened new windows onto the high-redshift universe, unveiling thousands of galaxies (e.g., Bouwens et al., 2015; Finkelstein et al., 2015; Livermore et al., 2017; Atek et al., 2018; Oesch et al., 2018). From these studies, and the numerous sources discovered, a general consensus has emerged that low-mass galaxies host a substantial fraction of the star formation in the high-redshift universe and are likely the key contributors to reionization (e.g., Wise et al., 2014; Robertson et al., 2015; Madau & Haardt, 2015; Stanway et al., 2016). Much work has been done to characterize these reionization epoch systems, revealing compact, metal-poor, low-mass galaxies with blue UV continuum slopes and large specific star formation rates (sSFRs; e.g., Stark, 2016). Additionally, deep restframe UV spectra of galaxies have revealed prominent high-ionization nebular emission lines (i.e., O III], C III], C IV, He II) indicating that extreme radiation fields characterize reionization-era galaxies (Sobral et al., 2015; Stark et al., 2015; Stark, 2016; Mainali et al., 2017, 2018), and may be more common at high redshifts (see, also, Smit et al., 2014, 2015).
Currently, few direct detections of the H-ionizing Lyman continuum photons (LyC; Å) exist at high redshifts (e.g., , de Barros et al., 2016; Shapley et al., 2016; Vanzella et al., 2018; Steidel et al., 2018), owing to their faintness and the increasing neutral intergalactic medium (IGM) attenuation with redshift (e.g., Inoue et al., 2014). Alternatively, studies of local galaxies with similar properties to observed reionization-era galaxies have lead to the proposal of several LyC-emitter indicators.
Ly is the strongest feature in the rest-frame far-UV (FUV) emission-line spectra of galaxies, and is commonly used as an indirect indicator of leaking ionizing radiation. Recent radiative transfer simulations have demonstrated that low column densities of low-ionization (H I) gas lead to multi-peaked Ly emission profiles (e.g., Verhamme et al., 2006, 2015; Gronke et al., 2016; Dijkstra et al., 2006; Dijkstra, 2014). In these models, smaller velocity separations between the two emission peaks correlate with lower H I column densities within the galaxy through which LyC photons can escape. Observationally, all LyC emitting galaxies have strong double-peaked Ly emission profiles (e.g., Verhamme et al., 2017), which are produced in media that either have low H I column densities or inhomogeneous covering fractions of gas through which ionizing radiation could escape. Strong correlations have been reported between the LyC escape fraction of local leakers with the shape of the Ly emission line (Izotov et al., 2018) and with the fraction of Ly photons that escape galaxies (Chisholm et al., 2018). In other words, Ly emission is our most reliable indirect indicator of LyC escape. However, blueshifted Ly emission is also attenuated by the IGM from galaxies within the epoch of reionizaiton and so cannot diagnose LyC escape at high-.
Alternatively, rest-frame high-ionization nebular emission lines have been proposed as probes of reionization-era systems. Indeed, strong high-ionization nebular emission, which indicates a large production of high-energy ionizing photons, has been linked to the leakage of LyC photons both theoretically (e.g., Nakajima & Ouchi, 2014) and observationally (e.g., Izotov et al., 2016; Chisholm et al., 2018). Specifically, the large ratios of high- to low-ionization emission that have been observed from all galaxies emitting LyC, have been previously used to argue for fully-ionized interstellar media (i.e., are density bounded) or optically-thin tunnels by which ionizing photons can escape (e.g., Jaskot & Oey, 2013; Nakajima & Ouchi, 2014; Rivera-Thorsen et al., 2015; Gazagnes et al., 2018). This idea is further supported by the low covering fractions of low-ionization absorption lines observed in many high-ionization galaxies (e.g., Heckman et al., 2011; Alexandroff et al., 2015; Henry et al., 2015; Erb et al., 2016; Chisholm et al., 2018).
LyC indicators are intimately intertwined at high-redshift, where high-ionization UV emission lines have been detected in five of the 13 known Ly emitters at . These observations suggest the extreme radiation fields more commonplace at high redshift may aid the transmission of Ly photons, and consequently ionizing photons as they must travel through the same gas (Mainali et al., 2018).
Therefore, high-ionization nebular UV emission lines provide a valuable tool to identify potential galaxies with high transmission of ionizing photons and characterize the most distant galaxies that the next generation of telescopes will observe. Yet, the physics governing the production of high-ionization nebular emission lines and their link to Ly and LyC escape are poorly understood. Of these lines, C IV emission may be especially informative as it is a resonant line, meaning it is easily scattered by the gas surrounding galaxies, and so, similar to Ly, is very sensitive to column density. While the Ly profile traces neutral gas, C IV emission probes the density of the high-ionization gas through which very high energy ionizing photons may escape. C IV emission, therefore, provides the rare opportunity to quantify both the production and transmission of high-energy ionizing photons. Here we present high-resolution HST spectra of the intense, high-ionization UV C IV and He II nebular emission in two galaxies with properties typical of reionization-era sources.
| Property | Units | J104457 | J141851 |
|---|---|---|---|
| Adopted from Archival Sources: | |||
| Reference | B16 | B19 | |
| R.A. | J2000 | 10:44:57.79 | 14:18:51.13 |
| Decl. | J2000 | 03:53:13.15 | 21:02:39.74 |
| 0.013 | 0.009 | ||
| log | M⊙ | 6.80 | 6.63 |
| log SFR | M⊙ yr-1 | ||
| log sSFR | yr-1 | ||
| mag. | 0.077 | 0.140 | |
| log(O/H) | dex | ||
| log | |||
| Derived from the UV COS G160M Spectra: | |||
| EWOIII] | Å | ||
| EWCIV | Å | ||
| EWHeII | Å | ||
| O III] | km s-1 | ||
| C IV | km s-1 | , | , |
| He II | km s-1 | ||
| CIV | km s-1 | ||
| CIV | km s-1 | ||
| CIV | km s-1 | ||
| L1500 | erg s-1 Hz-1 | ||
| , : | |||
| Q0 | s-1 | ||
| Q1 | s-1 | ||
| Q2 | s-1 | ||
| log | Hz erg-1 | 25.13 | 25.18 |
| , : | |||
| Q0 | s-1 | ||
| Q1 | s-1 | ||
| Q2 | s-1 | ||
| log | Hz erg-1 | 25.23 | 25.28 |
| log | Hz erg-1 | 25.26 | 25.31 |
Note. — Properties of the extreme UV emission-line galaxies presented here. The top portion of the table lists properties previously reported by Berg et al. (2016) for J104457 and Berg et al. (2019) for J141851. The R.A., Decl., redshift, total stellar masses, SFRs, and sSFRs were adopted from the SDSS MPA-JHU DR8 catalog222Data catalogues are available from http://www.sdss3.org/dr10/spectro/galaxy_mpajhu.php. The Max Plank institute for Astrophysics/John Hopkins University(MPA/JHU) SDSS data base was produced by a collaboration of researchers(currently or formerly) from the MPA and the JHU. The team is made up of Stephane Charlot (IAP), Guinevere Kauffmann and Simon White (MPA), Tim Heckman (JHU), Christy Tremonti (U. Wisconsin-Madison formerly JHU) and Jarle Brinchmann (Leiden University formerly MPA)., whereas , log(O/H), and log , were measured from the SDSS optical spectra. The bottom portion of the table lists the properties derived in this work from the UV HST/COS G160M spectra (see Figure 2). Equivalent widths are listed for C IV 1548,1550, O III 1661,1666, and He II 1640. We list velocity widths, , of O III] 1666 and He II 1640, and both blue and red components of the C IV 1548 profiles. Since the individual C IV lines present as doublets, we list the , , and measured for the C IV 1548 line. The H I (He I, He II) ionizing photons, Q0 (Q1, Q2) are derived from the H (He I 4471, He II 4686) flux. The UV luminosity density is derived from the UV continuum at 1500Å. Together, these values are used to determine log (see Section 3.2).
II. Observations of Reionization Era Analogues
II.1. Extreme UV Emission-Line Galaxies
Recent HST/COS spectral campaigns have revealed a sample of nearby galaxies with emission-line features more analogous to reionization-era systems than their local family of galaxies. In particular, studies targeting high-ionization UV emission lines in nearby, metal-poor (12+log(O/H)) star-forming galaxies have observed 22 objects with significant nebular emission from C IV 1548,1550 or He II 1640 (Berg et al., 2016; Senchyna et al., 2017; Berg et al., 2019; Senchyna et al., 2019). Of these, J104457 and J141851, have the largest reported UV C IV EW (Berg et al., 2016 , hereafter, B16) and He II EW (Berg et al., 2019 , hereafter, B19), respectively, amongst local star-forming galaxies.333Note that the C IV and He II EWs reported in Table 1 are from the higher-resolution spectra presented here and are lower than (but within the errors of) the EWs originally reported in B16 and B19.
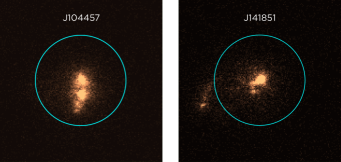
Here we present high-resolution HST/COS G160M spectra of two extreme UV emission-line galaxies, J104457 and J141851. These galaxies are shown in Figure 1 and their properties, many of which liken them to reionization-era systems, are listed in Table 1. Despite the strong C IV and He II emission detected in these galaxies, B16 and B19 find that their relative UV and optical emission-line ratios are typical of intensely star-forming galaxies, and not AGN. For example, the strong O III] 1661,1666 emission shown in Figure 2 has not been observed for narrow-line AGN (e.g., Hainline et al., 2011), where the very hard radiation fields producing strong He II recombination lines also weaken O III] by triply-ionizing O instead.
Stellar population synthesis (SPS) models that include very massive stars (MM⊙) or binaries can reproduce the observed C IV, O III], and C III] emission, but cannot explain He II (e.g., Berg et al., 2018; Stanway & Eldridge, 2019). Relative to the He II emission, which requires the largest ionization energy of these lines ( eV), standard SPS models underpredict, by an order of magnitude, the number of ionizing photons produced beyond the He+-ionizing edge relative to the H-ionizing flux. Alternatively, Schaerer et al. (2019) suggest high-mass X-ray binaries as the source of He II ionizing photons in star-forming galaxies, while Senchyna et al. (2019) propose the presence of strong, nebular C IV emission as an indicator of ionizing photons from very low-metallicity () massive stars. While we may rule out AGN, it is still unclear what is powering this unique suite of relative line strengths of C IV, He II, O III], and C III].
Despite the serendipitous success of recent surveys, it is important to note that very strong high-ionization UV emission lines are atypical of galaxy samples. This is due, in part, to the fact that nebular He II and C IV are only found at low metallicities (12+log(O/H)) and few UV spectroscopic campaigns have targeted the 1500–1700 Å range of metal-poor galaxies. Even so, the low-metallicity targeted surveys considered here only have a % detection rate of both nebular He II and C IV. These extreme nebular features are far from ubiquitous even amongst high-ionization, very metal-poor galaxies (e.g., Senchyna et al., 2019).
 |
 |
II.2. HST/COS Spectra
Strong C IV and He II emission were originally observed for J104457 and J141851 in their low-resolution HST/COS G140L spectra. Based on these detections, we obtained high-resolution HST/COS G160M observations with program HST-GO-15465. Our observing strategy was similar to B19, but used the G160M grating at a central wavelength of 1589Å, and science exposures of 6439 and 12374s for J104457 and J141851, respectively. In order to improve the signal-to-noise, we binned the spectra by 6 native COS pixels such that and the emission line FWHMs are sampled by more than 4 pixels (see Table 1).
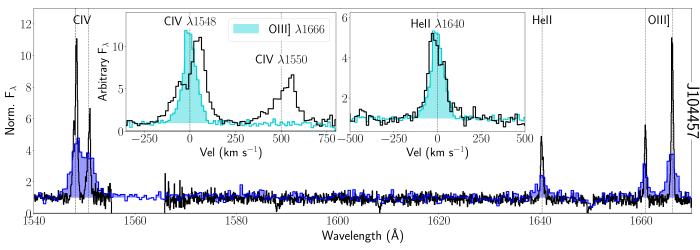
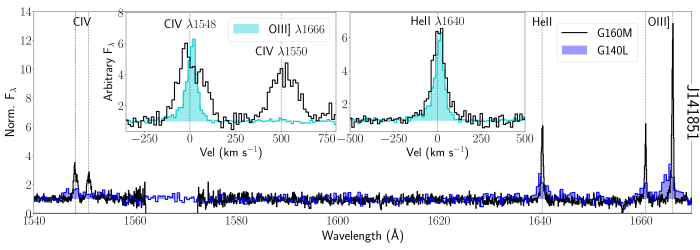
The new G160M spectra for J104457 and J141851 are compared to the low-resolution G140L spectra in Figure 2. The higher spectral resolution and S/N of the G160M spectra allow us to investigate the kinematic properties of the most intense high-ionization UV C IV and He II emission features in local galaxies for the first time. We reserve the detailed modeling analysis of the stellar continuum, ISM features, and nebular emission for a future paper (Olivier et al., 2019).
II.3. Resonantly Scattered C IV Emission
The C IV 1548,1550 spectral feature is challenging to interpret due to complex composite profiles with possible contributions from narrow nebular emission, broad stellar emission, stellar photospheric absorption, and interstellar medium absorption (Leitherer et al., 2011). Further, C IV is a resonant transition such that high-ionization gas scatters the photons. The resulting profiles of the reprocessed C IV emission for this work are plotted in velocity space in the left inset panels of Figure 2. For comparison, we plot an O III] emission line to represent the width of nebular emission. We find the resonantly-scattered C IV emission lines to be visibly broader, with profile widths nearly twice that of O III]. However, the strength and pure emission of the C IV profiles, and therefore the absence of ISM absorption, are evidence of channels of relatively low column density high-ionization gas along the line of sight that allows its transmission.
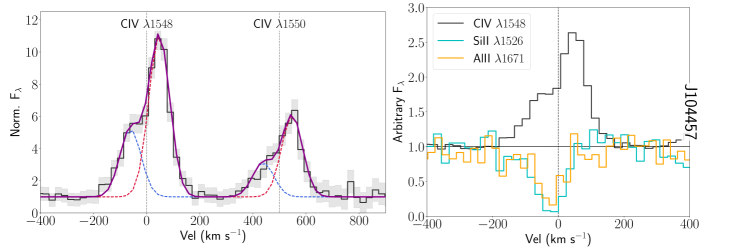
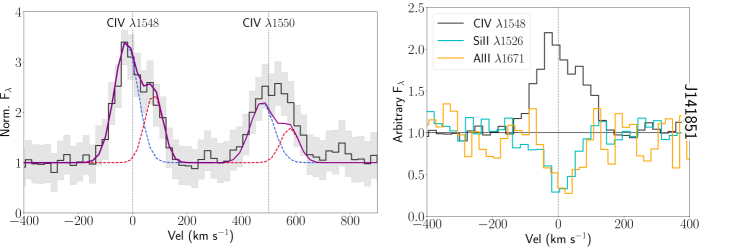
The C IV 1548 features also appear to be double-peaked (see, also, the double-peaked Si IV emission in Jaskot et al., 2017). This double-peaked profile is a classic signature of resonantly scattered emission and is found in the Ly emission profiles of LyC emitting galaxies (e.g., Verhamme et al., 2017) and predicted LyC emitters (e.g., Henry et al., 2015, 2018). We characterize the C IV 1548 profiles of our galaxies by fitting a double Gaussian with unconstrained wavelengths and line widths. From the fits we measure the maximum peak both blueward () and redward () of the systemic redshift and determine the peak separation as . J104457 has a blue-peak dominant profile, with a peak separation of km s-1, whereas J141851 has a red-peak dominant profile, but with a similar peak separation of km s-1.
The C IV 1548 profiles for both galaxies are well fit by the double Gaussians assumed here (see Figure 3). Because 1550 is the weaker line of the C IV doublet, its profiles are noisier and more difficult to freely characterize. Instead, we use the theoretical relative emissivities, given the measured temperature and density, to scale the C IV 1548 fit to the 1550 profile. This method successfully reproduces the 1550 line profile for J104457 and J141851, where the excess of red emission seen in J141851 is within the error. Given the fact that the bluer 1548 line experiences a larger optical depth to resonant scattering (with relative oscillator strengths of ), this exercise supports the low column density nature of high-ionization gas in these galaxies.
Radiative transfer models of Ly resonance emission indicate that small peak separations correlate to large escape fractions (e.g., Verhamme et al., 2015), due to low average column densities of gas that may be uniform or include lower density channels. Analogously, we expect the C IV 1548 peak separations to decrease with lower column densities of high-ionization gas, which also lowers the opacity to high-energy ionizing photons. The very strong nebular C IV emission observed in J104457 and J141851 suggests that these galaxies have low column densities of high-ionization gas that may allow large escape fractions of high-energy ionizing photons. In this work we have measured, for the first time, both C IV 1548,1550 emission lines to have consistent double-peaked resonantly-scattered profiles with extremely narrow peak separations; these fits, reported in Table 1, will be useful to constrain future C IV radiative transfer modeling.
II.4. Nebular He II Emission
In the right inset panels of Figure 2 we plot the velocity structure of the He II emission versus the nebular O III] 1666 profile. For both galaxies, the He II profile widths are km s-1 wider than the O III] widths (see Table 1), possibly due to an unresolved stellar component. However, visually, the He II emission appears consistent with the O III] profiles, indicating the He II emission is dominated by nebular emission and that very hard ionizing sources must be present, comparable to the known UV emission-line galaxies at high-redshift. Stark et al. (2015) measure a He II (upper limit) flux that is roughly 27% of the C IV emission in a galaxy, whereas we observe He II/C IV flux at the levels of 22% and 86%, respectively. Given these unprecedented levels of relative He II emission (see, also, Berg et al., 2018 for a galaxy with He II/C IV), we could be witnessing hard radiation from X-ray binaries in very low-mass galaxies; future X-ray observations will help constrain the nature of these ionizing sources.
UV He II can go undetected in known optical He II emitters due to extinction. Six of the 13 galaxies from B16 and B19 with He II 4686 detections in their optical SDSS spectra do not have 3 He II 1640 detections, where the missing flux can be accounted for by dust attenuation. However, the large He II 1640/4686 ratios observed for J104457 and J141851 confirm low dust attenuation of (assuming an intrinsic ratio of 1640/4686=6.96; Dopita & Sutherland, 2003). Even when very strong nebular He II 1640 is detected, such as in I Zw 18, C IV is often seen in absorption (e.g., Lebouteiller et al., 2013; Senchyna et al., 2019) likely due to higher column densities of high-ionization gas. Therefore, while optical He II 4686 nebular emission is not uncommon in metal-poor blue compact dwarf galaxies (BCDs; e.g., Guseva et al., 2000; Thuan & Izotov, 2005; Shirazi & Brinchmann, 2012), the combination of strong UV C IV and He II emission observed in our galaxies is much more rare, perhaps indicating unique physical conditions that allow their detection.
 |
 |
III. Escape of High Energy Photons
The observed strong nebular C IV and He II emission require an especially hard ionizing radiation field ( and 54.4 eV respectively), indicating the production of an unusually large number of high-energy photons. We discuss below how the strong C IV emission that is resonantly scattering out of these galaxies indicates physical conditions that may also allow high-energy photons to escape.
III.1. H and He Opacities
The photoionization cross-sections of H and He are important factors in determining the fraction of ionizing photons that can escape. At the energies needed to ionize C+2 to C+3 (47.888 eV, Draine, 2011) and He+ to He+2 (54.418 eV), the H cross-sections are only and , or less than 2.29% of the maximum cross-section at 13.6 eV. Neutral H gas is essentially optically-thin to high-enery ionizing photons. Instead, at the wavelengths corresponding to C+3 (Å) and He+2 (Å) ionization, the He I bound-free opacity dominates.
To understand the effects of the He opacity on the escape of high-energy photons, we refer to the circumgalactic medium transmission models of McCandliss & O’Meara (2017), which include the neutral H, neutral He, and singly ionized He optical depths as products of the column densities and cross-sections for each species. Specifically, in their Figure 3 these authors compute the LyC transmission functions for a range of H I column densities that span the transition from optically thin to thick at the Lyman edge. For a moderate column density of log(N the transmission of C IV ionizing photons (Å) is higher than %, and increases exponentially with decreasing column density. At this column density, the transmission of He II ionizing photons (Å) is %. These transmission models show that the integrated escape fraction of ionizing photons can be as large as 27% even when the Lyman edge appears opaque for log(N (see Figure 4 of McCandliss & O’Meara, 2017).
Therefore, given the relatively low column densities of high-ionization gas in our galaxies, as demonstrated by their strong C IV emission and lack of ISM absorption, the McCandliss & O’Meara (2017) models suggest that a significant fraction of high-energy ionizing photons can escape, even if H I column densities are large (no observations of NHI exist for these galaxies). Consequently, the combination of strong C IV and He II emission could be good indicators for the production and escape of the high-energy ionizing photons that could contribute to reionization in the early universe.
III.2. H-Ionizing Photon Production Efficiency ()
Next, we consider the ionizing photon production efficiency, . Following the method of Shivaei et al. (2018), we used the ratio of the H ionizing photon luminosity to the non-ionizing UV continuum luminosity density:
| (1) |
Here, is determined from the continuum flux of the G160M spectra at 1500Å. The continuum flux was dereddened using the Calzetti et al. (2000) extinction law, assuming and , where is determined from the optical spectrum. The H ionizing photon luminosity, , is then estimated from the dereddened SDSS H flux as
| (2) |
Here, and are the total and effective H case-B H recombination coefficients calculated for the electron temperatures of our targets (Pequignot et al., 1991). The fraction of ionizing photons absorbed by the gas, , is equal to 1.0 for a standard ionization-bounded model, providing a lower limit on the number of H I ionizing photons produced.
In addition to the H ionizing photons, we also determine the number of He I and He II ionizing photons, and , respectively. To do so, we measure the He I 4471 and He II 4686 luminosities, and , from the SDSS spectra and reverse Equations 5 & 6 from Schaerer & Vacca (1998) such that
| (3) |
and
| (4) |
The calculated minimum H I, He I, and He II ionizing photons produced () suggest that of the ionizing photons have energies large enough to ionize He0 and another are large enough to ionize He+ (reported in Table 1).
Observations suggest that the universe became reionized when galaxies produced ionizing photons at the rate of log( photons assuming an escape fraction of (Robertson et al., 2013). Adopting this (), we recalculate . The corresponding log values for our pair of galaxies (J104457, J141851) are entirely consistent with galaxies that could reionize the universe. If we also consider the and ionizing photons, we find log for our galaxies, increasing the total number of ionizing photons by . Further, since the and ionizing photons are significantly less likely to be absorbed by neutral H or He gas, and a single He+2 recombination can result in two H0 ionizations (Osterbrock, 1989), He ionizing photons also play a role in the cosmic reionization of hydrogen.
III.3. Predicting LyC Escape
The large values determined for our galaxies are unsurprising given that H-ionizing photon production efficiency has been found to correlate with high ionization, low metallicity, and blue UV spectral slopes (Shivaei et al., 2018). Intense high-ionization emission lines in local galaxies have also been found to correlate with (e.g., large [O III] EW, Chevallard et al., 2018; Tang et al., 2018), and suggest that short, powerful bursts of star formation in metal-poor, low-mass galaxies could provide enough H-ionizing photons to achieve the log value (Robertson et al., 2013) needed to maintain ionization of the IGM (Chevallard et al., 2018). Relative to these works, the two galaxies presented here seem to have H-ionizing production efficiencies typical of low-mass, metal-poor, high-ionization galaxies (log , depending on ). However, the empirical relationship between and total EW([O III]) from Chevallard et al. (2018) predicts log and for the extreme [O III] emission observed in our galaxies (EW([O III]) and Å, respectively). Similarly, Schaerer et al. (2018) find a trend of increasing with C III] 1907,1909 EW and note a large C III] EW for the local leaker, J1154+2443, which has a large LyC escape of . Extrapolating this C III] EW trend predicts log for our galaxies (EW(C III]) and Å).
The very large values predicted from the [O III] and C III] EWs are roughly 4 times larger than the canonical value, implying escape fractions of %. Such strong H-ionizing production rates, and the subsequently inferred escape fractions, are certainly atypical, but not unprecedented. Schaerer et al. (2016, 2018) report observed log values between 25.5-26.2 for 9 local leakers with , that reduce down to log when corrected for dust attenuation. Strong production (log ) has also been reported for 5 nearby galaxies in Chevallard et al. (2018) and 2 galaxies in Tang et al. (2018).
III.4. Additional Factors Affecting LyC Escape
Probably the most significant and limiting uncertainty in predicting the escape of ionizing photons is the effect of dust. First, Shivaei et al. (2018) found that differences in the assumed UV reddening curve can result in discrepant estimates by as much as 0.4 dex. Second, none of the available reddening laws have been calibrated to the very low metallicities considered here, nor do their wavelength coverage extend to the He ionizing continuum regime. In other words, the fate of the He ionizing photons due to dust is completely unknown.
A second consideration is the distribution of absorbing gas surrounding our galaxies. Some insight can be gained from the strong absorption profiles of low-ionization species seen in the COS spectra. The velocity profiles for the Al II 1671 (5.9858 eV) and Si II 1526 (8.1517 eV) absorption features are plotted in the right column of Figure 3. The deep profiles indicate that the gas in these galaxies are likely optically thick to low-ionization emission, with Si covering fractions of roughly 90% and 70% for J104457 and J141851, respectively. Using the empirical relationship from Chisholm et al. (2018), these covering fractions correlate to escape fractions of % for ionizing photons with energies near eV.
III.5. Future Modeling
While the arguments presented in this work for C IV emission as an indicator for escaping ionizing photons may be qualitatively compelling, radiation transfer models are necessary to draw more quantitative conclusions. Further, it would be advantageous to resolve the profiles of multiple resonant emission lines, such as both Ly and C IV, in order to investigate radiative transfer through both low- and high-ionization gas. Unfortunately, no high-resolution observations of both nebular Ly and C IV emission within the same galaxy currently exist. Therefore, follow-up observations are needed to compare C IV with Ly within the same galaxies and constrain models of the escape fraction of both high- and low-energy ionizing photons in order to determine a total escape fraction over all energies. This total escape fraction will help inform what photon energies escape reionization-era systems and whether a sufficient number of ionizing photons escape from star-forming galaxies to reionize the universe.
IV. Summary
We present high-resolution HST/COS spectra of two nearby extreme UV emission-line galaxies, J104457 and J141851, with properties that liken them to reionization-era systems. We report the first observations of narrowly-separated, double-peaked, resonantly-scattered C IV emission-line profiles and intense nebular He II emission. While the low-ionization absorption line profiles of these galaxies suggest that they are optically thick to H I ionizing photons, the strong C IV nebular emission and lack of ISM absorption indicate that they have lower column densities of high-ionization gas that may transmit high-energy photons. Therefore, the large number of very hard ionizing photons () that are produced by these galaxies and travel outward through the high-ionization media, may similarly escape from high-redshift galaxies. We therefore propose that the combination of strong C IV and He II emission may identify galaxies, with or without escaping Ly, that produce and transmit a substantial number of high-energy photons that contribute to cosmic reionization. How the profiles of Ly and C IV emission relate as LyC indicators is currently unknown, so a larger sample and future radiative transfer modeling are needed. Further, future rest-frame FUV spectroscopy covering C IV and He II in galaxies within the epoch of reionization using the James Webb Space Telescope (JWST) or extremely large telescopes (ELTs) are needed to constrain the helium ionizing photons and provide an estimate for their contribution to the reionization budget.
References
- Alexandroff et al. (2015) Alexandroff, R. M., Heckman, T. M., Borthakur, S., Overzier, R., & Leitherer, C. 2015, ApJ, 810, 104
- Atek et al. (2018) Atek, H., Richard, J., Kneib, J.-P., & Schaerer, D. 2018, MNRAS, 479, 5184
- Berg et al. (2018) Berg, D. A., Erb, D. K., Auger, M. W., Pettini, M., & Brammer, G. B. 2018, ApJ, 859, 164
- Berg et al. (2019) Berg, D. A., Erb, D. K., Henry, R. B. C., Skillman, E. D., & McQuinn, K. B. W. 2019, ApJ, 874, 93
- Berg et al. (2016) Berg, D. A., Skillman, E. D., Henry, R. B. C., Erb, D. K., & Carigi, L. 2016, ApJ, 827, 126
- Bouwens et al. (2015) Bouwens, R. J., Illingworth, G. D., Oesch, P. A., et al. 2015, ApJ, 803, 34
- Calzetti et al. (2000) Calzetti, D., Armus, L., Bohlin, R. C., et al. 2000, ApJ, 533, 682
- Chevallard et al. (2018) Chevallard, J., Charlot, S., Senchyna, P., et al. 2018, MNRAS, 479, 3264
- Chisholm et al. (2018) Chisholm, J., Gazagnes, S., Schaerer, D., & others. 2018, A&A, 616, A30
- de Barros et al. (2016) de Barros, S., Vanzella, E., Amorín, R., & others. 2016, A&A, 585, A51
- Dijkstra (2014) Dijkstra, M. 2014, PASA, 31, e040
- Dijkstra et al. (2006) Dijkstra, M., Haiman, Z., & Spaans, M. 2006, ApJ, 649, 37
- Dopita & Sutherland (2003) Dopita, M. A. & Sutherland, R. S. 2003, Astrophysics of the diffuse universe
- Draine (2011) Draine, B. T. 2011, Physics of the Interstellar and Intergalactic Medium
- Erb et al. (2016) Erb, D. K., Pettini, M., Steidel, C. C., et al. 2016, ApJ, 830, 52
- Finkelstein et al. (2015) Finkelstein, S. L., Ryan, Jr., R. E., Papovich, C., et al. 2015, ApJ, 810, 71
- Gazagnes et al. (2018) Gazagnes, S., Chisholm, J., Schaerer, D., Verhamme, A., Rigby, J. R., & Bayliss, M. 2018, A&A, 616, A29
- Gronke et al. (2016) Gronke, M., Dijkstra, M., McCourt, M., & Oh, S. P. 2016, ApJ, 833, L26
- Guseva et al. (2000) Guseva, N. G., Izotov, Y. I., & Thuan, T. X. 2000, ApJ, 531, 776
- Hainline et al. (2011) Hainline, K. N., Shapley, A. E., Greene, J. E., & Steidel, C. C. 2011, ApJ, 733, 31
- Heckman et al. (2011) Heckman, T. M., Borthakur, S., Overzier, R., et al. 2011, ApJ, 730, 5
- Henry et al. (2018) Henry, A., Berg, D., Scarlata, C., Verhamme, A., & Erb, D. 2018, ApJ, submitted
- Henry et al. (2015) Henry, A., Scarlata, C., Martin, C. L., & Erb, D. 2015, ApJ, 809, 19
- Inoue et al. (2014) Inoue, A. K., Shimizu, I., Iwata, I., & Tanaka, M. 2014, MNRAS, 442, 1805
- Izotov et al. (2016) Izotov, Y. I., Schaerer, D., Thuan, T. X., & others. 2016, MNRAS, 461, 3683
- Izotov et al. (2018) Izotov, Y. I., Worseck, G., Schaerer, D., & others. 2018, MNRAS, 478, 4851
- Jaskot & Oey (2013) Jaskot, A. E. & Oey, M. S. 2013, ApJ, 766, 91
- Jaskot et al. (2017) Jaskot, A. E., Oey, M. S., Scarlata, C., & Dowd, T. 2017, ApJ, 851, L9
- Lebouteiller et al. (2013) Lebouteiller, V., Heap, S., Hubeny, I., & Kunth, D. 2013, A&A, 553, A16
- Leitherer et al. (2011) Leitherer, C., Tremonti, C. A., Heckman, T. M., & Calzetti, D. 2011, AJ, 141, 37
- Livermore et al. (2017) Livermore, R. C., Finkelstein, S. L., & Lotz, J. M. 2017, ApJ, 835, 113
- Madau & Haardt (2015) Madau, P. & Haardt, F. 2015, ApJ, 813, L8
- Mainali et al. (2017) Mainali, R., Kollmeier, J. A., Stark, D. P., & others. 2017, ApJ, 836, L14
- Mainali et al. (2018) Mainali, R., Zitrin, A., Stark, D. P., et al. 2018, MNRAS, 479, 1180
- McCandliss & O’Meara (2017) McCandliss, S. R. & O’Meara, J. M. 2017, ApJ, 845, 111
- Nakajima & Ouchi (2014) Nakajima, K. & Ouchi, M. 2014, MNRAS, 442, 900
- Oesch et al. (2018) Oesch, P. A., Montes, M., Reddy, N., et al. 2018, ApJS, 237, 12
- Olivier et al. (2019) Olivier, G., Berg, D. A., Chisholm, J., et al. 2019, in preparation
- Osterbrock (1989) Osterbrock, D. E. 1989, Astrophysics of gaseous nebulae and active galactic nuclei
- Pequignot et al. (1991) Pequignot, D., Petitjean, P., & Boisson, C. 1991, A&A, 251, 680
- Rivera-Thorsen et al. (2015) Rivera-Thorsen, T. E., Hayes, M., Östlin, G., Duval, F., Orlitová, I., Verhamme, A., Mas-Hesse, J. M., Schaerer, D., Cannon, J. M., Otí-Floranes, H., Sandberg, A., Guaita, L., Adamo, A., Atek, H., Herenz, E. C., Kunth, D., Laursen, P., & Melinder, J. 2015, ApJ, 805, 14
- Robertson et al. (2015) Robertson, B. E., Ellis, R. S., Furlanetto, S. R., & Dunlop, J. S. 2015, ApJ, 802, L19
- Robertson et al. (2013) Robertson, B. E., Furlanetto, S. R., Schneider, E., et al. 2013, ApJ, 768, 71
- Schaerer et al. (2019) Schaerer, D., Fragos, T., & Izotov, Y. I. 2019, A&A, 622, L10
- Schaerer et al. (2018) Schaerer, D., Izotov, Y. I., Nakajima, K., et al. 2018, A&A, 616, L14
- Schaerer et al. (2016) Schaerer, D., Izotov, Y. I., Verhamme, A., et al. 2016, A&A, 591, L8
- Schaerer & Vacca (1998) Schaerer, D. & Vacca, W. D. 1998, ApJ, 497, 618
- Senchyna et al. (2019) Senchyna, P., Stark, D. P., Chevallard, J., et al. 2019, arXiv e-prints
- Senchyna et al. (2017) Senchyna, P., Stark, D. P., Vidal-García, A., et al. 2017, MNRAS, 472, 2608
- Shapley et al. (2016) Shapley, A. E., Steidel, C. C., Strom, A. L., et al. 2016, ApJ, 826, L24
- Shirazi & Brinchmann (2012) Shirazi, M. & Brinchmann, J. 2012, MNRAS, 421, 1043
- Shivaei et al. (2018) Shivaei, I., Reddy, N. A., Siana, B., et al. 2018, ApJ, 855, 42
- Smit et al. (2015) Smit, R., Bouwens, R. J., Franx, M., et al. 2015, ApJ, 801, 122
- Smit et al. (2014) Smit, R., Bouwens, R. J., Labbé, I., Zheng, W., Bradley, L., & others. 2014, ApJ, 784, 58
- Sobral et al. (2015) Sobral, D., Matthee, J., Darvish, B., et al. 2015, ApJ, 808, 139
- Stanway & Eldridge (2019) Stanway, E. R. & Eldridge, J. J. 2019, A&A, 621, A105
- Stanway et al. (2016) Stanway, E. R., Eldridge, J. J., & Becker, G. D. 2016, MNRAS, 456, 485
- Stark (2016) Stark, D. P. 2016, ARA&A, 54, 761
- Stark et al. (2015) Stark, D. P., Richard, J., Charlot, S., & others. 2015, MNRAS, 450, 1846
- Steidel et al. (2018) Steidel, C. C., Bogosavljević, M., Shapley, A. E., et al. 2018, ApJ, 869, 123
- Tang et al. (2018) Tang, M., Stark, D., Chevallard, J., & Charlot, S. 2018, arXiv e-prints
- Thuan & Izotov (2005) Thuan, T. X. & Izotov, Y. I. 2005, ApJ, 161, 240
- Vanzella et al. (2018) Vanzella, E., Nonino, M., Cupani, G., et al. 2018, MNRAS, 476, L15
- Verhamme et al. (2015) Verhamme, A., Orlitová, I., Schaerer, D., & Hayes, M. 2015, A&A, 578, A7
- Verhamme et al. (2017) Verhamme, A., Orlitová, I., Schaerer, D., et al. 2017, A&A, 597, A13
- Verhamme et al. (2006) Verhamme, A., Schaerer, D., & Maselli, A. 2006, A&A, 460, 397
- Wise et al. (2014) Wise, J. H., Demchenko, V. G., Halicek, M. T., et al. 2014, MNRAS, 442, 2560